Download - Digital Landscape 2013

© comScore, Inc. Proprietary.
Digital Landscape
7th Internet and Mobile Marketing Summit 2013
Joe Nguyen SVP APAC, comScore Inc.
Twitter: @jnguyen
Email: [email protected]

© comScore, Inc. Proprietary. 2
Agenda
• Global Overview
• Southeast Asian Landscape
• Digital Multi-Platform Audience
• Category Highlights
• Does Viewability Matter?

© comScore, Inc. Proprietary. © comScore, Inc. Proprietary.
GLOBAL OVERVIEW
© comScore, Inc. Proprietary. 4
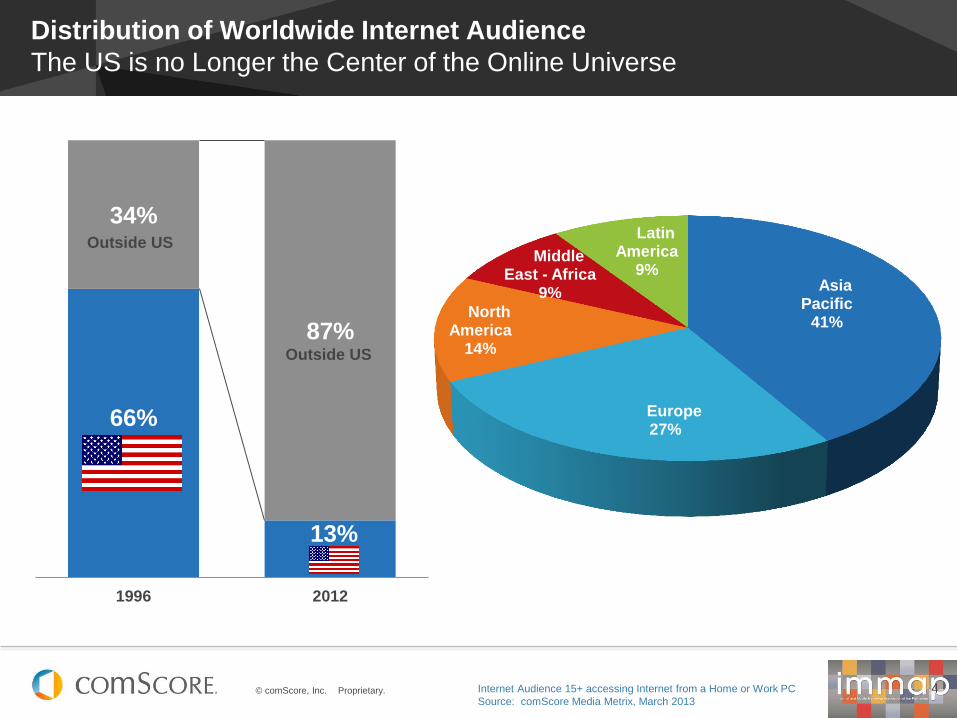
Distribution of Worldwide Internet Audience
The US is no Longer the Center of the Online Universe
66%
13%
34%
87%
1996 2012
Outside US
Asia Pacific
41%
Europe 27%
North America
14%
Middle East - Africa
9%
Latin America
9%
Outside US
Internet Audience 15+ accessing Internet from a Home or Work PC
Source: comScore Media Metrix, March 2013
© comScore, Inc. Proprietary. 5
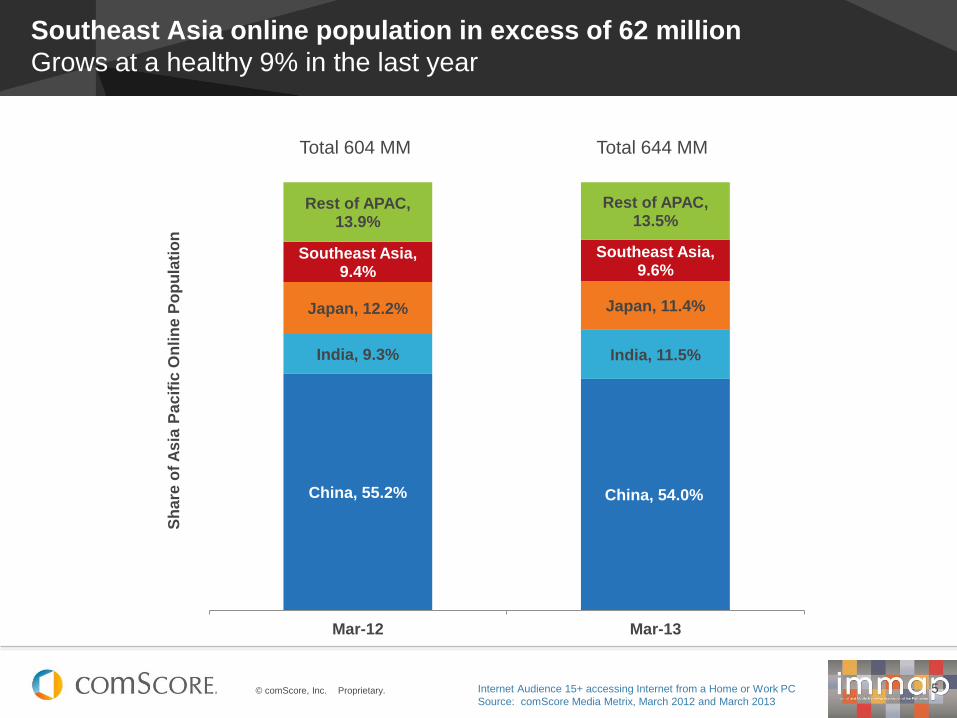
Southeast Asia online population in excess of 62 million
Grows at a healthy 9% in the last year
Internet Audience 15+ accessing Internet from a Home or Work PC
Source: comScore Media Metrix, March 2012 and March 2013
China, 55.2% China, 54.0%
India, 9.3% India, 11.5%
Japan, 12.2% Japan, 11.4%
Southeast Asia, 9.4%
Southeast Asia, 9.6%
Rest of APAC, 13.9%
Rest of APAC, 13.5%
Mar-12 Mar-13
Sh
are
of
As
ia P
ac
ific
On
lin
e P
op
ula
tio
n
Total 604 MM Total 644 MM
© comScore, Inc. Proprietary. 6
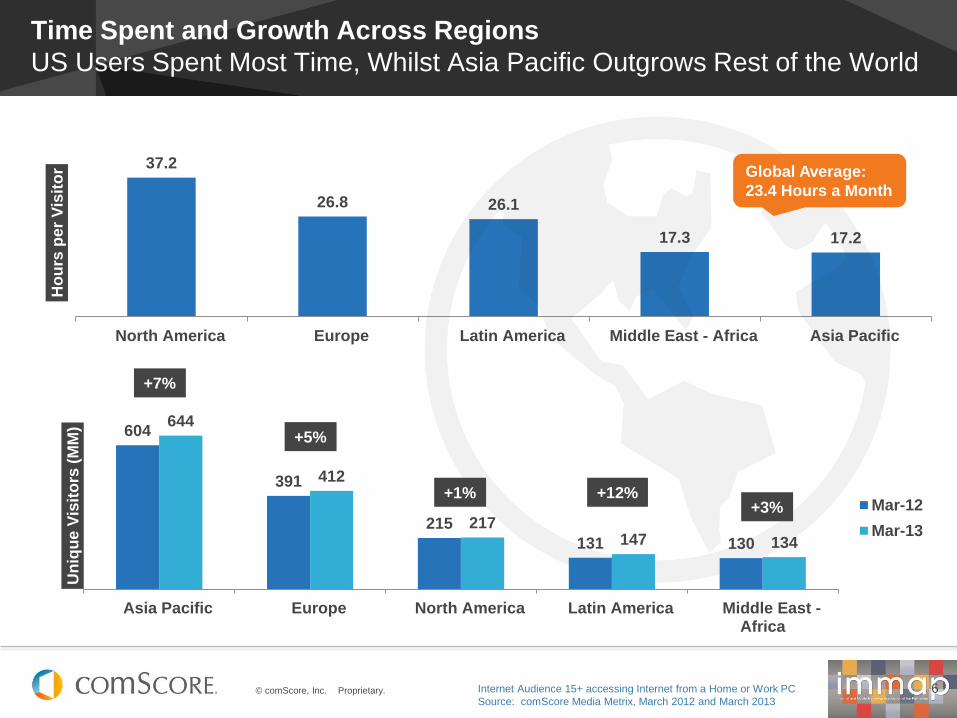
37.2
26.8 26.1
17.3 17.2
North America Europe Latin America Middle East - Africa Asia Pacific
Ho
urs
per
Vis
ito
r
Time Spent and Growth Across Regions
US Users Spent Most Time, Whilst Asia Pacific Outgrows Rest of the World
Global Average:
23.4 Hours a Month
604
391
215
131 130
644
412
217 147 134
Asia Pacific Europe North America Latin America Middle East -Africa
Un
iqu
e V
isit
ors
(M
M)
Mar-12
Mar-13
+7%
+5%
+1% +12% +3%
Internet Audience 15+ accessing Internet from a Home or Work PC
Source: comScore Media Metrix, March 2012 and March 2013

© comScore, Inc. Proprietary. 7 Source: World Bank http://goo.gl/knFHZ and World Internet Stats http://goo.gl/eZObs
Source: comScore Media Metrix, Total Unique visitors (000), May 2013, Home & Work Locations
APAC Region Overview
Region Countries GDP
(m)
GDP
(2011-12)
Total
Population
(m)
Online
Population
MMX (000)*
ANZ Australia $1,520,608 3.30% 22 14,437
N. Zealand $159,710 2.20% 4.4 2,904
Greater
China
China $8,227,102 7.80% 1,373 350,127
Hong Kong $248,725 1.80% 7.3 4,602
Taiwan $466,830 1.30% 23.4 13,628
India India $1,841,717 6.50% 1,247 76,053
Japan Japan $5,896,794 0.20% 73.6 73,656
Southeast
Asia
(SEA)
Indonesia $846,341 6.00% 239.8 13,628
Malaysia $287,934 4.50% 28.7 11,800
Philippines $250,265 6.60% 97.3 7,711
Singapore $245,024 1.30% 5.1 3,415
Thailand $345,672 5.50% 68.8 9,591
Vietnam $141,669 5.00% 91.2 16,413
© comScore, Inc. Proprietary. 8 Source: World Bank http://goo.gl/knFHZ
Source: comScore Media Metrix, Total Unique visitors (000), May 2013, Home & Work Locations
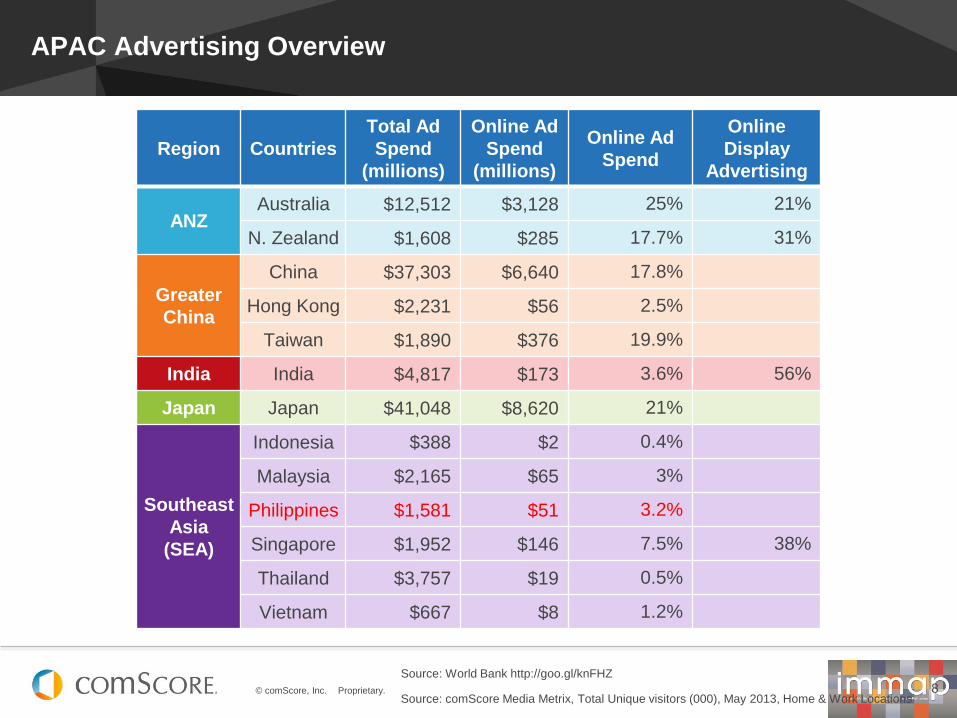
APAC Advertising Overview
Region Countries
Total Ad
Spend
(millions)
Online Ad
Spend
(millions)
Online Ad
Spend
Online
Display
Advertising
ANZ Australia $12,512 $3,128 25% 21%
N. Zealand $1,608 $285 17.7% 31%
Greater
China
China $37,303 $6,640 17.8%
Hong Kong $2,231 $56 2.5%
Taiwan $1,890 $376 19.9%
India India $4,817 $173 3.6% 56%
Japan Japan $41,048 $8,620 21%
Southeast
Asia
(SEA)
Indonesia $388 $2 0.4%
Malaysia $2,165 $65 3%
Philippines $1,581 $51 3.2%
Singapore $1,952 $146 7.5% 38%
Thailand $3,757 $19 0.5%
Vietnam $667 $8 1.2%
© comScore, Inc. Proprietary. © comScore, Inc. Proprietary.
SOUTHEAST ASIAN ONLINE LANDSCAPE

© comScore, Inc. Proprietary. 10
Online Audience in Southeast Asia
High Growth in Developing Regions
14.1
12.4 11.8
8.9
6.1
3.3
16.1
13.6
11.8
9.5
7.4
3.4
-
2.0
4.0
6.0
8.0
10.0
12.0
14.0
16.0
18.0
Vietnam Indonesia Malaysia Thailand Philippines Singapore
Mar-12
Mar-13
The internet audience in the Philippines is
the fastest-growing in the region, growing
by 22% since March 2012.
Internet Audience 15+ accessing Internet from a Home or Work PC
Source: comScore Media Metrix, March 2012 and March 2013

© comScore, Inc. Proprietary. 11
Demographic Distribution of Southeast Asian Audiences Emerging Internet Markets in the Region Skew Very Young
In Thailand and Vietnam, 74% of the audience is under 35
42%
45%
24%
40%
37%
43%
32%
29%
27%
31%
26%
27%
14%
14%
25%
16%
22%
19%
8%
7%
17%
9%
10%
8%
5%
4%
8%
5%
6%
4%
Vietnam
Thailand
Singapore
Philippines
Malaysia
Indonesia
% o
f O
nlin
e P
op
ula
tion
by A
ge
15-24 25-34 35-44 45-54 55+
Internet Audience 15+ accessing Internet from a Home or Work PC
Source: comScore Media Metrix, March 2013

© comScore, Inc. Proprietary. 12
Youngest Web Users Are Heaviest Web Users
Average Usage by Under-35s is Substantially Heavier in Vietnam, Thailand
27.7 28.3
18.2 16.5 16.4
13.5
22.2 24.2
14.5 16.0 15.2
13.6
0.0
5.0
10.0
15.0
20.0
25.0
30.0
Vietnam Thailand Singapore Philippines Malaysia Indonesia
Under 35 Over 35
Internet Audience 15+ accessing Internet from a Home or Work PC
Source: comScore Media Metrix, March 2013
© comScore, Inc. Proprietary. 13
(Lowest)
F-to-M
Reach
Index
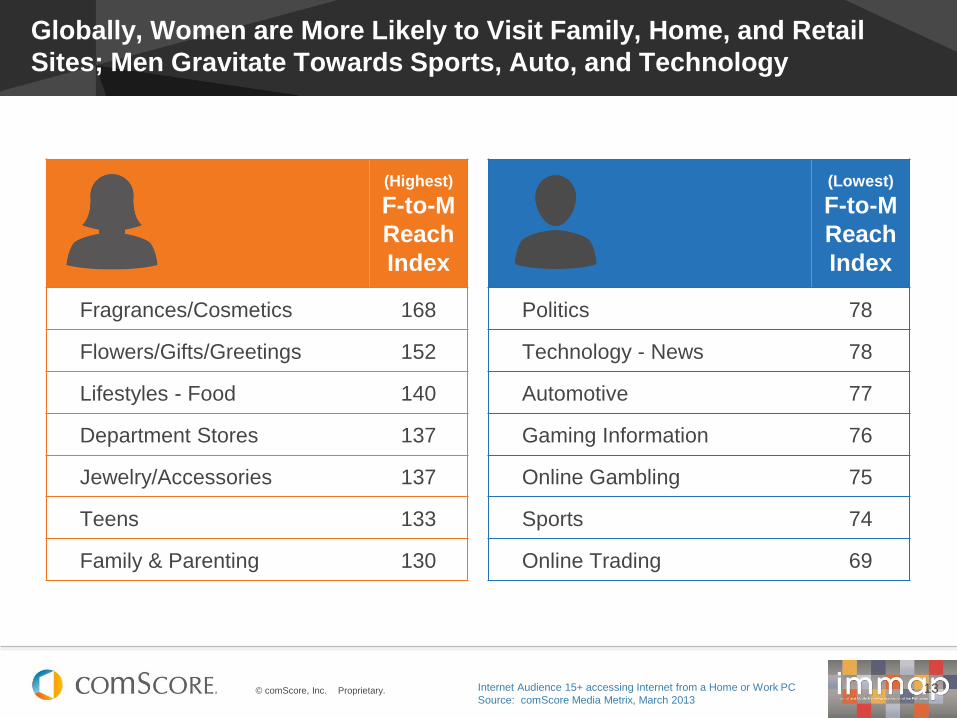
Politics 78
Technology - News 78
Automotive 77
Gaming Information 76
Online Gambling 75
Sports 74
Online Trading 69
Globally, Women are More Likely to Visit Family, Home, and Retail
Sites; Men Gravitate Towards Sports, Auto, and Technology
(Highest)
F-to-M
Reach
Index
Fragrances/Cosmetics 168
Flowers/Gifts/Greetings 152
Lifestyles - Food 140
Department Stores 137
Jewelry/Accessories 137
Teens 133
Family & Parenting 130
Internet Audience 15+ accessing Internet from a Home or Work PC
Source: comScore Media Metrix, March 2013

© comScore, Inc. Proprietary. © comScore, Inc. Proprietary.
DIGITAL MULTI-PLATFORM AUDIENCE

© comScore, Inc. Proprietary. 15
Non-PC traffic in South-East Asia zooms ahead, in excess of 20%
This number is accelerating with each passing month
75%
80%
85%
90%
95%
100%
Sep-12 Oct-12 Nov-12 Dec-12 Jan-13 Feb-13 Mar-13
PC Mobile Tablet Other
Non-PC Traffic: 15.4%
Non-PC Traffic: 20.9%
Source: comScore Device Essentials – Singapore, Malaysia, Thailand, Sep’12 – Mar’13

© comScore, Inc. Proprietary. 16
Non-PC traffic in Singapore
Most mobile market in the region
75%
80%
85%
90%
95%
100%
Sep-12 Oct-12 Nov-12 Dec-12 Jan-13 Feb-13 Mar-13
PC Mobile Tablet Other
Non-PC Traffic: 17.4%
Non-PC Traffic: 23.3%
Source: comScore Device Essentials – Singapore, Sep’12 – Mar’13

© comScore, Inc. Proprietary. 17
Non-PC traffic in Thailand
Fastest growing market in the region
75%
80%
85%
90%
95%
100%
Sep-12 Oct-12 Nov-12 Dec-12 Jan-13 Feb-13 Mar-13
PC Mobile Tablet Other
Non-PC Traffic: 10.4%
Non-PC Traffic: 18.9%
Source: comScore Device Essentials – Thailand, May’12 – May’13

© comScore, Inc. Proprietary.
18
A Day in the life of a Multi-platform User (UK)
LATE NIGHT
(12AM - 7AM)
EARLY
MORNING
(7AM – 10AM) DAYTIME
(10AM – 5PM)
EARLY
EVENING
(5PM – 8PM)
PRIME
TIME
(8PM – 12AM)
Mobiles dominate
morning commute
time
PCs
dominate
working hours
Tablets most
popular at night
Source: comScore Custom Analytics based on 21st Jan 2013 UK data
Sh
are
of
De
vic
e P
ag
e T
raff
ic o
n a
Typ
ica
l W
ork
da
y

© comScore, Inc. Proprietary. 19
Tablets popular
at night
Sh
are
of
De
vic
e P
ag
e T
raff
ic o
n a
Typ
ica
l W
ee
ke
nd
Device Preferences Throughout the Day in Europe
Most Weekend Tablet Usage Peaks at 9pm
Mobiles peak late
PCs during
the day
Source: comScore Device Essentials, Sunday, 17th February 2013, Europe

© comScore, Inc. Proprietary. 20
Device usage varies significantly by time of day (Singapore)
PC’s take up work hours, while tablets rule evenings
Sh
are
of
Devic
e P
ag
e T
raff
ic o
n a
Typ
ica
l W
ork
day
Mobiles
brighten the
commute
PCs dominate
working hours
Tablets popular at
night
Source: comScore Device Essentials, July 2013, Singapore

© comScore, Inc. Proprietary. © comScore, Inc. Proprietary.
SOCIAL NETWORKING
#FutureinFocus

© comScore, Inc. Proprietary. 22
88.2
93.9
85.4
96.1
91.6
86.9
Vietnam Thailand Singapore Philippines Malaysia Indonesia
Percent of Web Users Visiting a Social Networking Site
Vietnam Thailand Singapore Philippines Malaysia Indonesia
Social Networking Category Captures the Largest Percentage of
Consumers’ Time in Southeast Asia
Internet Audience 15+ accessing Internet from a Home or Work PC
Source: comScore Media Metrix, March 2013
All SEA Countries Index Higher
than Worldwide average (79%)
reach of Social Networking sites

© comScore, Inc. Proprietary. 23
The Philippines and Thailand Among Top 10 Countries
With the Highest Facebook Penetration Globally
92.6
92.2
91.4
91.1
90.8
89.3
89.0
88.5
86.8
84.2
84.1
83.2
82.9
82.3
81.0
Brazil
Philippines
Peru
Turkey
Argentina
Thailand
Colombia
Mexico
Chile
Venezuela
Portugal
Canada
Israel
Malaysia
Taiwan
Facebook Top 15 Markets by % Reach
Internet Audience 15+ accessing Internet from a Home or Work PC
Source: comScore Media Metrix, March 2013
© comScore, Inc. Proprietary. 24
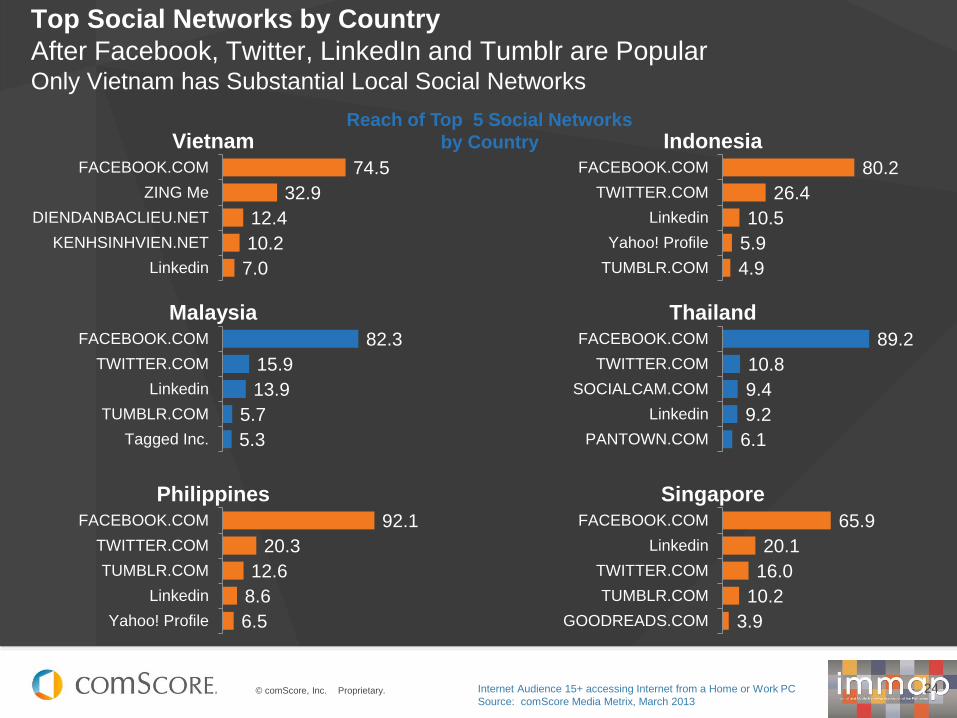
Top Social Networks by Country
After Facebook, Twitter, LinkedIn and Tumblr are Popular Only Vietnam has Substantial Local Social Networks
Internet Audience 15+ accessing Internet from a Home or Work PC
Source: comScore Media Metrix, March 2013
74.5
32.9
12.4
10.2
7.0
FACEBOOK.COM
ZING Me
DIENDANBACLIEU.NET
KENHSINHVIEN.NET
Vietnam
80.2
26.4
10.5
5.9
4.9
FACEBOOK.COM
TWITTER.COM
Yahoo! Profile
TUMBLR.COM
Indonesia
82.3
15.9
13.9
5.7
5.3
FACEBOOK.COM
TWITTER.COM
TUMBLR.COM
Tagged Inc.
Malaysia
89.2
10.8
9.4
9.2
6.1
FACEBOOK.COM
TWITTER.COM
SOCIALCAM.COM
PANTOWN.COM
Thailand
92.1
20.3
12.6
8.6
6.5
FACEBOOK.COM
TWITTER.COM
TUMBLR.COM
Yahoo! Profile
Philippines
65.9
20.1
16.0
10.2
3.9
FACEBOOK.COM
TWITTER.COM
TUMBLR.COM
GOODREADS.COM
Singapore
Reach of Top 5 Social Networks
by Country

© comScore, Inc. Proprietary. © comScore, Inc. Proprietary.
NEWS AND INFORMATION

© comScore, Inc. Proprietary. 26
Reach of News/Information Category is Highest in Singapore,
but Visitors in Vietnam Spend the Most Time on Those Sites
76.1%
90.0%
63.5%
73.0%
71.0%
50.0%
92.3%
Worldwide
Vietnam
Indonesia
Malaysia
Thailand
Philippines
Singapore
Percent Reach of News/Information Category
69.7
194.8
75.9
37.4
32.9
25.9
55.7
Worldwide
Vietnam
Indonesia
Malaysia
Thailand
Philippines
Singapore
Minutes Spent per Visitor on News/Information Category
Internet Audience 15+ accessing Internet from a Home or Work PC
Source: comScore Media Metrix, March 2013

© comScore, Inc. Proprietary. 27
Large Nonresident Population Drives Visiting to Filipino News Sites
Internet Audience 15+ accessing Internet from a Home or Work PC
Source: comScore Media Metrix, March 2013
63%
61%
63%
0 200 400 600 800 1,000 1,200 1,400 1,600 1,800
INQUIRER.NET
ABS-CBNNEWS.COM
PHILSTAR.COM
PH
ILIP
PIN
ES
Singapore
India
Australia
United Kingdom
Malaysia
Canada
United States
Top 7 International Markets

© comScore, Inc. Proprietary. 28
Blogs Form an Important Component of News Stream
Reach of the Category is Highest in Indonesia and Thailand
53.3%
49.5%
71.6%
64.5%
71.3%
49.7%
58.5%
Worldwide
Vietnam
Indonesia
Malaysia
Thailand
Philippines
Singapore
Percent Reach of Blogs Category
29.5
15.6
32.9
28.3
20.8
14.4
25.2
Worldwide
Vietnam
Indonesia
Malaysia
Thailand
Philippines
Singapore
Minutes Spent per Visitor on Blogs Category
Internet Audience 15+ accessing Internet from a Home or Work PC
Source: comScore Media Metrix, March 2013

© comScore, Inc. Proprietary. © comScore, Inc. Proprietary.
ENTERTAINMENT AND ONLINE VIDEO

© comScore, Inc. Proprietary. 30
Countries with More Young People Visit and Spend More Time on
Entertainment Sites
88.0%
96.1%
79.8%
97.2%
99.1%
82.5%
96.3%
Worldwide
Vietnam
Indonesia
Malaysia
Thailand
Philippines
Singapore
Percent Reach of Entertainment Category
3.5
5.3
2.2
2.3
4.8
2.9
3.4
Worldwide
Vietnam
Indonesia
Malaysia
Thailand
Philippines
Singapore
Hours Spent per Visitor on Entertainment Category
Internet Audience 15+ accessing Internet from a Home or Work PC
Source: comScore Media Metrix, March 2013

© comScore, Inc. Proprietary. 31
Most Top Entertainment Sites in SEA are International Properties
Malaysia
YOUTUBE.COM 7,339
CBS Interactive 2,152
VEVO 1,884
Viacom Digital 1,730
DAILYMOTION.COM 1,329
Indonesia
YOUTUBE.COM 7,171
omg! from Yahoo! 2,172
KAPANLAGI.COM 2,133
CBS Interactive 1,808
VEVO 1,636
Vietnam
YOUTUBE.COM 11,101
ZING MP3 9,711
24h Online Advertising JSC 7,054
KENH14.VN 5,373
NHACCUATUI.COM 5,236
Unique Visitors (000)
Top 5 Entertainment Sites per Country
Thailand
YOUTUBE.COM 7,289
MTHAI.COM 3,329
DAILYMOTION.COM 2,491
VEVO 2,053
iTunes Software (App) 1,589
Philippines
YOUTUBE.COM 4,902
VEVO 1,563
CBS Interactive 1,447
Viacom Digital 1,231
iTunes Software (App) 1,225
Singapore
YOUTUBE.COM 1,989
iTunes Software (App) 978
CBS Interactive 870
MediaCorp Network 772
VEVO 694
Internet Audience 15+ accessing Internet from a Home or Work PC
Source: comScore Media Metrix, March 2013

© comScore, Inc. Proprietary. 32
Online Video Shows Steady Growth Over the Past Year
42 Million Online Video Viewers in the Region* Now
0
2,000
4,000
6,000
8,000
10,000
12,000
14,000
16,000
Vietnam Indonesia Malaysia Philippines Singapore
Apr-2012 Apr-2013
*Sum of 5 Countries Under Video Measurement by comScore
Internet Audience 15+ accessing Internet from a Home or Work PC
Source: comScore Video Metrix, March 2013
+14%
+3% -2%
+18%
+5%

© comScore, Inc. Proprietary. 33
Google Accounts for the Majority of Videos Viewed Overall in the
Region, with Some Exceptions
64% 42%
76% 54%
77%
36% 58%
24% 46%
23%
Vietnam Indonesia Malaysia Philippines Singapore
Share of Videos Viewed
All Others
Google Sites
Total
Number of
Videos Viewed
1.6 B 459 M 931 M 357 M 353 M
In the Philippines,
14.5% of Videos
Viewed are on
Internet Audience 15+ accessing Internet from a Home or Work PC
Source: comScore Video Metrix, March 2013

© comScore, Inc. Proprietary. © comScore, Inc. Proprietary.
Does Viewability Matter?

© comScore, Inc. Proprietary. 35
If the ad was not seen, then everything else is irrelevant!
Being seen
matters
more than
being clicked

© comScore, Inc. Proprietary.
Because of the complex daisy chain of ad delivery, the reality is that
digital ad ecosystem can be really complicated.
START
AD SERVER
AD EXCHANGE
AD NETWORK
AD NETWORK
PUBLISHER
PUBLISHER’S FRIEND WHO
BORROWED THE AD TAGS
© comScore, Inc. Proprietary.
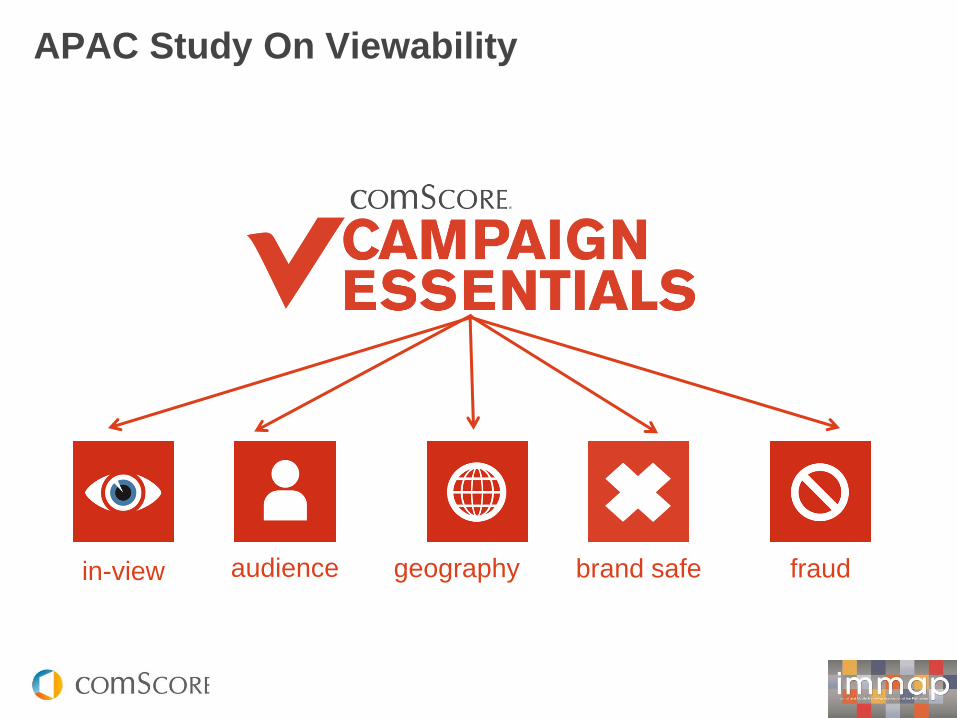
APAC Study On Viewability
in-view audience geography brand safe fraud

© comScore, Inc. Proprietary.
The first Asia industry study to bring 6 leading
marketers together to VALIDATE online advertising
delivery
10 campaigns 9 countries
347 million impressions 329,000 sites

© comScore, Inc. Proprietary.
Study Objective: Quantify incidence of successful and sub-optimal ad
delivery across key dimensions …
VIEWABILITY GEOGRAPHY
SAFETY LEVEL OF FRAUD
TARGET
AUDIENCE
DELIVERY
• Demographically
• Behaviorally

© comScore, Inc. Proprietary. 40
• 1000s of campaigns
• 290 billion impressions
• Mix of advertisers
• Mix of publishers
• 10 campaigns
• 347 billion impressions
• Top tier advertisers
• Mainly premium publishers
54% of Display Ads are Not Seen
vCE™ APAC Charter Study (May 2012) vCE™ Benchmarks (June 2013)
“best-case scenario” “real-world scenario”
46% 54% Not Viewable
Viewable
46% Not Viewable
Viewable
54%

© comScore, Inc. Proprietary. 41
Wrap Up
• Global Overview
• Southeast Asian Landscape
• Digital Multi-Platform Audience
• Category Highlights
• Does Viewability Matter?

© comScore, Inc. Proprietary.
Digital Landscape
7th Internet and Mobile Marketing Summit 2013
Joe Nguyen SVP APAC, comScore Inc.
Twitter: @jnguyen
Email: [email protected]


