
DISTRICT GROUNDWATER BROCHURE
TIRUCHCHIRAPPALLI DISTRICT, TAMIL
NADU
Dr S.Suresh
Scientist-D
Government of India
Ministry of Water Resources
Central Ground Water Board South Eastern Coastal Region
Chennai
February 2008
For official use
Technical Report Series

1
DISTRICT AT A GLANCE (TIRUCHCHIRAPPALLI DISTRICT)
S.NO ITEMS STATISTICS 1.
GENERAL INFORMATION
i. Geographical area (Sq.km) 4403.83
ii. Administrative Divisions as on 31-3-2007 Number of Tehsils Number of Blocks Number of Villages
8
14 504
iii. Population (as on 2001 Census) Total Population Male Female
2418366 1208534 1209832
iv. Average Annual Rainfall (mm) 841.9 mm
GEOMORPHOLOGY
i. Major physiographic Units Peneplain
2.
ii. Major Drainages Cauvery, Coleroon 3. LAND USE (Sq. km) during 2005-06 i. Forest area
ii. Net area sown iii. Cultivable waste
36246 191347
8856 4. MAJOR SOIL TYPES 5. AREA UNDER PRINCIPAL CROPS
(AS ON 2005-2006) 1. Paddy - 78956 Ha – 65% 2. Cereals – 80153 Ha - 65% 3. Fruits & Vegetables –
24236 Ha – 15% 4. Oil Seeds – 27203 Ha – 9% 5. Sugar Cane – 7485 Ha –6% 6. Pulses – 5708 Ha – 0.59%
6. IRIGATION BY DIFFERENT SOURCES (During 2005-06)
Number Area irrigated (Ha)
i. Dug wells 95349 57883
ii. Tube wells 8988 10981
iii. Tanks 1761 8791
iv. Canals 135 32399 v. Other Sources - -
vi. Net irrigated area 110054 Ha
vii. Gross irrigated area 121852 Ha
2
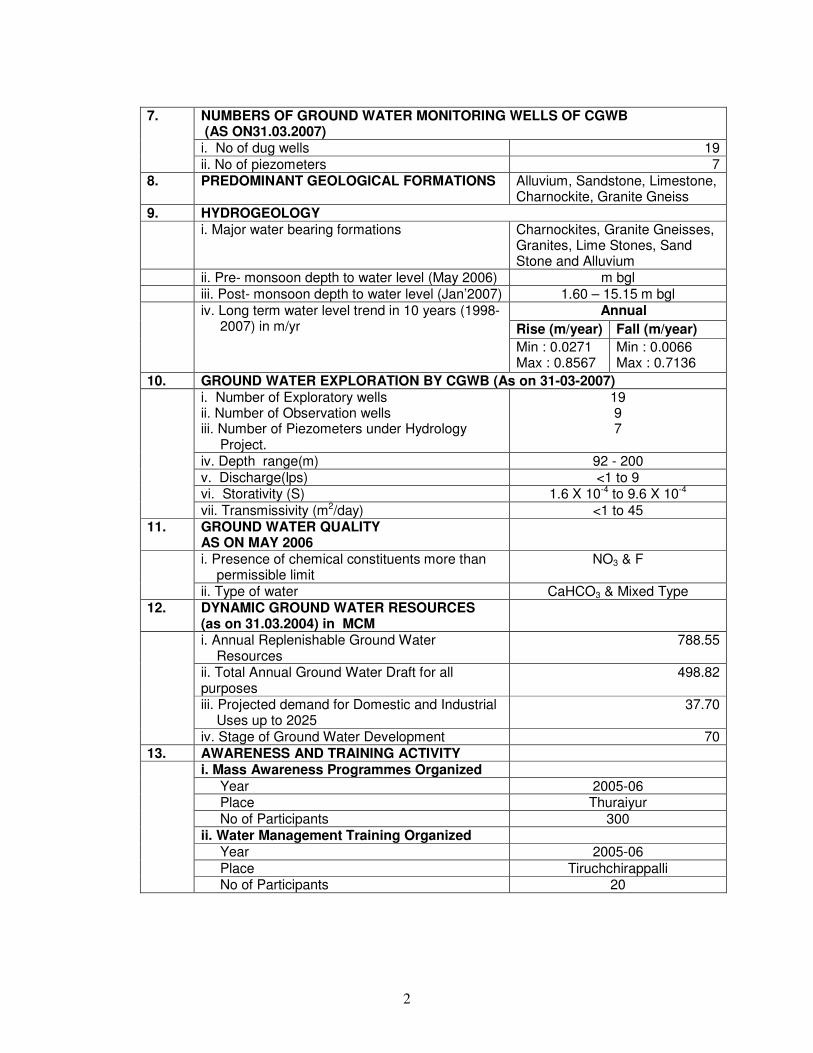
NUMBERS OF GROUND WATER MONITORING WELLS OF CGWB (AS ON31.03.2007)
i. No of dug wells 19
7.
ii. No of piezometers 7 8. PREDOMINANT GEOLOGICAL FORMATIONS Alluvium, Sandstone, Limestone,
Charnockite, Granite Gneiss 9. HYDROGEOLOGY i. Major water bearing formations Charnockites, Granite Gneisses,
Granites, Lime Stones, Sand Stone and Alluvium
ii. Pre- monsoon depth to water level (May 2006) m bgl iii. Post- monsoon depth to water level (Jan’2007) 1.60 – 15.15 m bgl
Annual
Rise (m/year) Fall (m/year)
iv. Long term water level trend in 10 years (1998- 2007) in m/yr
Min : 0.0271 Max : 0.8567
Min : 0.0066 Max : 0.7136
10. GROUND WATER EXPLORATION BY CGWB (As on 31-03-2007) i. Number of Exploratory wells ii. Number of Observation wells iii. Number of Piezometers under Hydrology Project.
19 9 7
iv. Depth range(m) 92 - 200 v. Discharge(lps) <1 to 9 vi. Storativity (S) 1.6 X 10⁻⁴ to 9.6 X 10⁻⁴
vii. Transmissivity (m2/day) <1 to 45 11. GROUND WATER QUALITY
AS ON MAY 2006
i. Presence of chemical constituents more than permissible limit
NO3 & F
ii. Type of water CaHCO3 & Mixed Type 12. DYNAMIC GROUND WATER RESOURCES
(as on 31.03.2004) in MCM
i. Annual Replenishable Ground Water Resources
788.55
ii. Total Annual Ground Water Draft for all purposes
498.82
iii. Projected demand for Domestic and Industrial Uses up to 2025
37.70
iv. Stage of Ground Water Development 70
13. AWARENESS AND TRAINING ACTIVITY i. Mass Awareness Programmes Organized
Year 2005-06 Place Thuraiyur No of Participants 300 ii. Water Management Training Organized Year 2005-06
Place Tiruchchirappalli
No of Participants 20
3
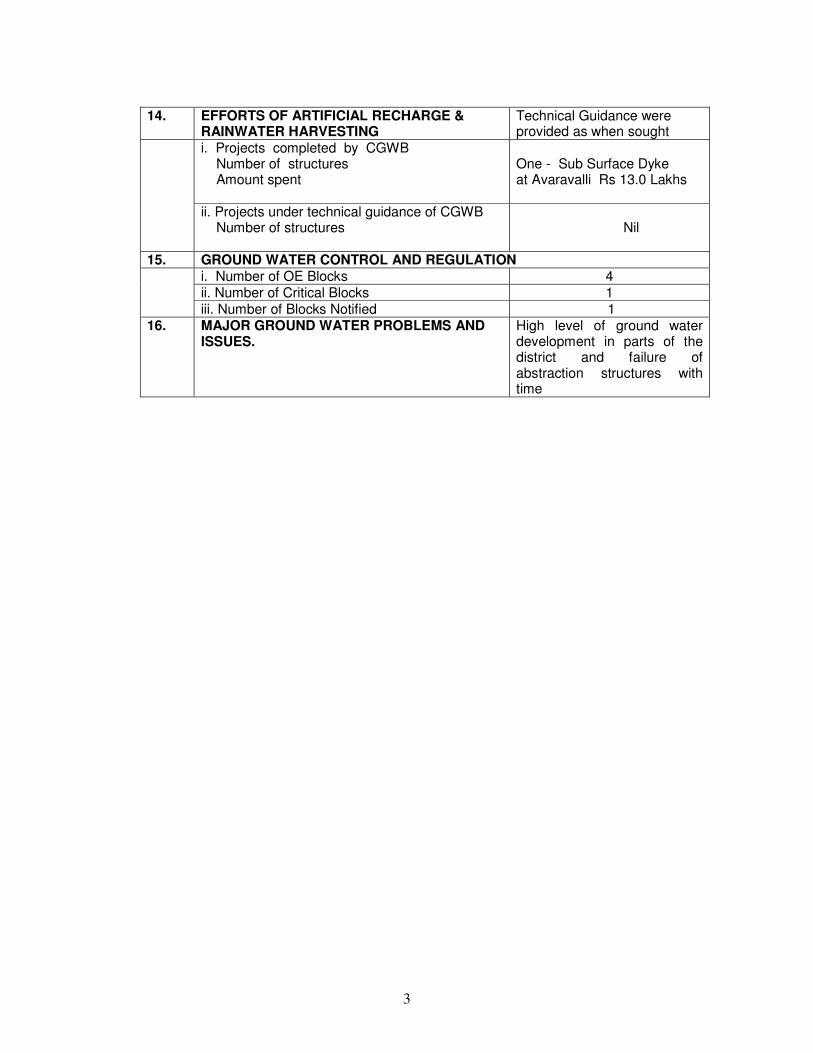
14. EFFORTS OF ARTIFICIAL RECHARGE &
RAINWATER HARVESTING Technical Guidance were provided as when sought
i. Projects completed by CGWB Number of structures Amount spent
One - Sub Surface Dyke at Avaravalli Rs 13.0 Lakhs
ii. Projects under technical guidance of CGWB Number of structures
Nil
15. GROUND WATER CONTROL AND REGULATION i. Number of OE Blocks 4 ii. Number of Critical Blocks 1
iii. Number of Blocks Notified 1 16. MAJOR GROUND WATER PROBLEMS AND
ISSUES. High level of ground water development in parts of the district and failure of abstraction structures with time

4
1.0 INTRODUCTION
1.1 Administrative Details
Tiruchchirappalli district is having administrative divisions of 7 taluks, 14 blocks, 539 Panchayats and 341 villages as detailed below:
S.No. Taluk No.of Villages Block No.of Villages
1 Tiruchchirappalli 46 Thiruverumbur 46
Manikandam 33 2 Srirangam 66
Andanallur 33
Manapparai 28
Vaiyampatti 23
3 Manapparai 96
Marungapuri 45
Musiri 34 4 Musiri 64
Thathayangarpettai 30
5 Thottiyam 30 Thottiyam 30
Thuraiyur 30 6 Thuraiyur 64
Uppiliapuram 34
Lalgudi 53 7 Lalgudi 92
Pullambadi 39
8 Manachanallur 46 Manachanallur 46
Total 504 504
1.2 Basin and sub-basin
.The entire district forms part of Cauvery river basin.
1.3 Drainage
The entire district forms part of Cauvery river basin. Cauvery is the major, and the only perennial river in the district. The northern branch of Cauvery, known as ‘Coleroon’ is mainly a flood carried, while the southern branch retains the name Cauvery. It has numerous tributaries draining the district, the prominent ones of which are Ayyar and Uppar in the north and Koraiyar in the south. Most of the rivers are structurally controlled. The drainage pattern, in general, is dendritic.
1.4 Irrigation Practices
The nine-fold lands use classification for the district is given below (2005-06).
S.No Classification Area (Ha)
1 Forests 36246
2 Barren & Uncultivable Lands 13599
3 Land put to non agricultural uses 84791
4 Cultivable Waste 8856
5 Permanent Pastures & other grazing lands 659
6 Groves not included in the area sown 1931
7 Current Fallows 21142
8 Other Fallow Lands 81812
9 Net Area sown 191347
Total 440383
(Source: Department of Economics & Statistics, Govt. of Tamil Nadu)
The chief irrigation sources in the area are the canals, followed by tanks, wells and tube wells.

5
The block wise and source wise net area irrigated in Ha is given below (2005-06).
Net area irrigated by S.No Block Canals Tanks Tube
wells Ordinary
wells Other
Sources
Total Net
Area irrigated
1 Andanallur 3700 0 1850 1342 0 6892 2 Manikandam 2913 567 2144 599 0 6223 3 Tiruverumbur 5218 1210 580 535 0 7543
4 Manaparai 0 481 27 4824 0 5332 5 Marungapuri 0 570 36 8214 0 8820 6 Vaiyampatti 59 257 98 4609 0 5023 7 Lalgudi 8228 40 2685 1538 0 12491 8 Pullambadi 3579 888 934 1733 0 7134 9 Manachanallur 2647 350 677 4228 0 7900 10 Musiri 1924 819 173 5073 0 7689
11 T.Pet 0 0 1474 5355 0 6829 12 Thottiam 2960 320 163 4449 0 7892 13 Thuraiyur 430 2009 80 6968 0 9487 14 Uppiliyapuram 741 1280 60 8418 0 10499 Total 32399 8791 10981 57883 0 110054
(Source: Department of Economics & Statistics, Govt. of Tamil Nadu)
1.5 Studies/Activities carried out by CGWB
Detailed systematic hydrogeological studies were taken up for the first time in the district by during 1959-’60 in the sedimentary tracts of the district. The occurrence of ground water under both phreatic and confined conditions and the existence of potential deep confined aquifers were brought to light for the first time during these studies. Subsequently systematic hydrogeological surveys were carried out in other parts of the district during 1986-’88.
Four boreholes were again drilled by CGWB in Cretaceous sediments during 1984-’85. Nine production wells and one flowing well have been constructed in the district. In order to strengthen groundwater monitoring network under Hydrology Project, 7 piezometers have been constructed for water level and water quality monitoring. In 2004, 28 well have been constructed through outsourcing in the district to assist State Government in drought proofing work.
Monitoring of ground water levels and water quality is being carried out by Central Ground Water Board since 1972 through a network of Hydrograph Stations.
Under Central Sector Scheme, technical and financial assistance were rendered for the execution a sub surface dyke across Siruganur Odai for an estimate of Rs 13.0 Lakhs.

6
2.0 RAINFALL AND CLIMATE
The normal annual rainfall over the district varies from about 730 mm to about 900 mm. It is the minimum around Musiri (731.9 mm) in the western part. It gradually increases towards north, east and south and reaches a maximum around Manapparai (908.5 mm) The district enjoys a tropical climate. The period from April to June is generally hot and dry. The weather is pleasant during the period from November to January. Usually mornings are more humid than afternoons. The relative humidity varies between 50 and 85% in the mornings while in the afternoon it varies between 70 and 92%.
3.0 GEOMORPHOLOGY AND SOIL TYPES
3.1 Geomorphology
The entire Tiruchchirappalli district constitutes a peneplain. The Kolli Hills in the north-western part and Pachchamalai Hills in the north-eastern parts of the distrinct constitute the remnants of the denuded Eastern Ghats and rise to a heights of more than 100 m above Mean Sea Level. From these hills, the land slopes gently toward east and forms a vast stretch of plain country. There are numerous small residual hillocks dotting the countryside, the most prominent one of which is the Rock Fort hill in Tiruchchirappalli town. The area northeast of Tiruchchirappalli is in an active stage of erosion and shows typical bad land topography. The master slope of the district is towards east.
The prominent geomorphic units identified in the district through interpretation of Satellite Imagery are 1) Alluvial Plains, 2) Valley Fills, 3) Buried Pediments, 4) shallow Pediments, 5) Pediments and 6) Structural Hills.
The alluvial plains are confined to the northern bank of Cauvery River in the district. Valley fill deposits are seen mainly in the northern part adjoining the hillocks in Uppiliapuram and Thuraiyur blocks. Buried Pediments have been identified in almost all blocks in the district except Marungapuri, Manapparai, Vaiyampatti and Manikandam. Pediments, both shallow and deep, constitute the most prominent geomorphic unit in the district and are evenly distributed in the entire district. Structural hills, on the other hand, are confined to the northern and southwestern borders of the district.
3.2 Soils
The major soil types encountered in the district are black cotton soils, red sandy to loamy soils and alluvial soils. A thin layer of red sandy soils overlies the western and southern parts of the district. Alluvial soils of considerable thickness occur in the central part, particularly in Tiruchchirappalli, Kulithalai, Musiri and Lalgudi taluks. Black cotton soils are observed in the northern part., whereas red loamy soils occur in the hilly regions.

7
4.0 GROUND WATER SCENARIO
4.1 Hydrogeology
The major part of the district is underlain by Archaean crystalline metamorphic complex. The important aquifer systems encountered in the district are classified into
i) Fissured, fractured and weathered crystalline formations consisting of charnockites, Granite Gneisses and
ii) Unconsolidated and semi-consolidated formations.
The unconsolidated and semi consolidated formations in the district include shales, sandstones and clays of Jurassic age (Upper Gondwana), marine sediment of Cretaceous age, sandstones of Tertiary age and Recent alluvial formations. As the Gondwana formations are well compacted and poorly jointed, the movement of ground water in these formations is mostly restricted to shallow levels. Ground water occurs under phreatic to semi confined conditions in the inter-granular pore spaces in sands and sandstones and the bedding planes and thin fractures in shales. In the area underlain by Cretaceous sediments, ground water development is rather poor due to the rugged nature of the terrain and the poor quality of the formation water. Quaternary formations comprising mainly sands, clays and gravels are confined to major drainage courses in the district. The maximum thickness of alluvium is 30 m whereas the average thickness is about 15 m. Ground water in these formations is being developed by means of dug wells and filter points.
The water bearing properties of crystalline formations which lack primary porosity depend on the extent of development of secondary intergranular porosity either through weathered or fracturing. These aquifers are highly heterogeneous in nature due to variations in lithology, texture and structural features even within short distances. Ground water generally occurs under phreatic conditions in the weathered mantle and under semi-confined conditions in the fissured and fractured zones at deeper levels. The thickness of weathered zone in the district is in the range of 2 to 25 m.
The prominent lineaments trend in E-SW, NNE-SSW, NW-SE and E-W directions. Some of these fracture zones persist to depths and may form potential aquifers in the area. Productive joints have been encountered down to a depth of about 100 m bgl in the wells drilled for rural water supply by the Ground Water Department and Tamil Nadu water Supply and Drainage Board. The yield of these wells at the time of drilling and development ranged from less than 1 to 10 lps.
The depth of drilling in the district through outsourcing for drought proofing work was in the range of 92 to 200 m bgl. The wells encountered three to five fracture zones with two fracture zones down to 50 m and two fracture zones in the depth range of 100 – 150 m and one fracture zone deeper than 150 m. The yield of these wells varied from <1 to 9 lps. Dug wells are used extract groundwater from weathered formation while deeper fractures are tapped through bore wells and dug cum bore wells.

8
The yield of large diameter wells in the district, tapping the weathered mantle of crystalline rocks or the unconsolidated formations ranges from 200 to 900 lpm for drawdowns ranging from 0.4 to 2.5 m. The wells tapping the deep seated fracture system can yield about 1 – 5 lps and can sustain a pumping of 6-8 hrs a day. The depth to water level during pre monsoon (May 2006) in the district varied from 1.95 to 9.49 m bgl. Out of 17 wells, 6% of wells had depth to water level in the range of 0- 2 m bgl, 47% in the range of 2 – 5 m bgl and 10 – 20 m bgl. The depth to water level during post monsoon (Jan 2007) varied from 1.6 to 15.15 m bgl and 5% of wells had depth to water level in the range of 0- 2 m bgl and 58% of the wells in the range of 2 – 5 m bgl. 26% of the wells had depth to water level in the range of 5 - 10 m bgl and 10% of the wells had the depth to water level in the range of 10 - 20 m bgl.
4.1.1 Long Term Fluctuation (1998-2007)
Rise (m) Fall (m) Period
Minimum Maximum Minimum Maximum Pre monsoon (May 1998 – May 2006)
0.04
8.99
1.53
1.53
Post Monsoon (Jan 1998 – Jan 2007)
0.37
3.48
0.07
8.69
4.1.2 Aquifer Parameters
Formation Sp.Yield (%)
Transmissivity (m
2/d)
Hy. Conductivity (m/d)
Yield of Wells (lps)
Storativity
Alluvium 7.2 49-216 2-5 10-20 -
Cretaceous 0.3 - 2.56 33-772 10-66 1.1-3.5 -
Gondwana 1.5 – 2.5 43-52 10-20 1-2 -
Crystallines 1.5 32-80 5-10 1-2 1.6 X 10⁻⁴
to 9.6 X 10⁻⁴
4.2 Ground Water Resources
The ground water resources have been computed jointly by Central Ground Water Board and State Ground & Surface Water Resources and Development Centre (PWD, WRO, Government of Tamil Nadu) as on 31st March 2004. The salient features of the computations are furnished below.

9
Stage of Groundwater Development of Tiruchchirappalli District, Tamil Nadu as on 31st March 2004 ( in Ham)
S.No Block Net Groundwater Availability
Existing Gross
Draft for Irrigation
Existing Gross
Draft for Domestic
and industrial
water supply
Existing Gross
Draft for all uses
Allocation for Domestic
and Industrial
Requirement supply up to
next 25 years (2029)
Net groundwater Availability for future Irrigation
Development
Stage of Groundwater Development
Category of the Block
1 Andanallur 4218.50 1536.50 196.65 1733.15 204.31 2477.69 41 Safe
2 Lalgudi 8580.45 2614.31 304.91 2919.22 316.78 5649.36 34 Safe
3 manachanallur 5374.31 2775.99 333.04 3109.03 346.01 2252.31 58 Safe
4 Manaparai 3563.96 3451.16 190.66 3641.82 198.08 0.00 102 Over Exploited
5 Manikandam 4709.60 1313.98 251.88 1565.86 261.69 3133.93 33 Safe
6 Marungapuri 6691.77 3202.89 198.03 3400.92 205.74 3283.14 51 Safe
7 Musiri 4626.74 4292.72 251.52 4544.24 261.31 72.71 98 Critical
8 Pullambadi 4889.04 2160.43 215.21 2375.65 223.59 2505.02 49 Safe
9 Tattayangarpettai 4420.99 5124.68 206.44 5331.13 214.48 0.00 121 Over Exploited
10 Thiruverumbur 6622.62 305.95 608.10 914.05 631.78 5684.89 14 Safe
11 Thottiam 4562.56 2217.97 277.33 2495.30 288.12 2056.46 55 Safe
12 Thuraiyur 3049.72 6091.13 211.29 6302.42 219.52 0.00 207 Over Exploited
13 Uppiliyapuram 6694.30 9391.09 211.46 9602.55 219.69 0.00 143 Over Exploited
14 Vaiyampatti 2964.87 1774.82 172.29 1947.11 179.00 1011.05 66 Safe
District Total 70969.43 46253.64 3628.81 49882.44 3770.10 20945.69 70
* - If the difference between Net Groundwater Availability and sum of existing groundwater draft & allocation for domestic is negative, groundwater availability for future is taken as zero. In Case of district total, the negative availability and positive availability is added up to get the district total and if it is negative, it is taken as zero and if It is positive, the district total is given.
4.3 Ground Water Quality
Ground water in phreatic aquifers in Tiruchchirappalli district, in general, is colourless, odourless and slightly alkaline in nature. The electrical conductivity of ground water in phreatic zone (in Microsiemens at 25o C) during May 2006 was in the range of 570 to 4550 µS/cm and major parts of the district are having the electrical conductivity above 1700 µS/cm. It is observed that in general the ground water is suitable for drinking and domestic uses in respect of all the constituents except Fluoride of higher concentration at Siruganallur (1.85 mg/L) and at few places are having higher concentration of NO3 than BIS permissible limit.
4.4 Status of Ground Water Development
The estimation of groundwater resources for the district has shown that out of 14 blocks, 4 blocks are categorized as over exploited and 1 block as Critical and rest is Safe. Dug wells are the most common ground water abstraction structures used for irrigation in the district. The yield of dug wells range from less than 50 to 200 m3/day in weathered crystalline rocks, 20 to 100 m3/day in Gondwana formations and up to 400 m3/day in recent alluvial formations along major drainage courses. The yields of dug wells in crystalline and Gondwana formations are improved at favourable locations by construction of extension bores which are 20 to 40 m deep. In recent years, a few bore wells have also been drilled by farmers for irrigation purposes. The bore wells down to a

10
depth 150 m may encounter 3 -4 fracture zones and may yield between <1 to 9 lps may sustain the pumping of 8 – 10 hrs a day.
Based on the data on ground water abstraction structures and area under irrigation from ground water, the average unit draft of dug wells and bore wells have been computed as 0.47 ha.m and 0.86 ha.m respectively
5.0 GROUNDWATER MANAGEMENT STRATEGY
5.1 Groundwater Development
In view of the heterogeneity of the crystalline formation and poor yield prospects in the Gondwana sediments, scientific source finding methods may be employed to site wells for planning further development of available ground water resources in the district. The map showing the development prospects for the district is shown in Plate VI.
5.2 Water Conservation and Artificial Recharge
On the basis of experimental studies, it has been found that desilting of existing tanks followed by percolation pond with recharge wells//recharge shafts are economical. Accordingly, computations have been made for Drought Prone Area Programme (DPAP), over exploited and critical blocks in the districts warranting immediate attention. A summary giving the availability of surface run off, number of structures feasible and cost estimates for the schemes is provided in the table.

11
Details of computation of the number and cost estimates of artificial recharge structures proposed Number
of
Structures
Cost of
Structures
(Lakhs)
S.No Block
Area
Suitable for
Groundwater
Development
(sq.km)
Categorization
of Block as on
March 2004
*Harnessable
surface water
(M.Cu.m)
**Capacity
of existing
Tanks
(MCM)
Committed
Supply for
existing
Tanks
(MCM) (2
Fillings)
Surplus
available
for AR
(MCM)
Available
Subsurface
storage
(MCM) PP ( 1 in
15 sq.km).
Capacity -
0.1
M.Cu.m
PP (Unit
Cost - Rs
20 Lakhs)
Whether
Number of
Structures
are
Feasible as
per SW
Availability
1 Manaparai 272.07 OE / DPAP 24.96 9.53 19.060 5.90 57.95 18 360 Yes
2 Musiri 338.69
Critical /
DPAP 37.38 10.88 21.760 15.62 0.76 23 460 Yes
3 Tattayangarpettai 310.98 OE / DPAP 14.24 9.53 19.060 0.00 26.35 0 0 No
4 Thuraiyur 464.57 OE / DPAP 33.07 7.17 14.340 18.73 16.31 31 620 Yes
5 Uppiliyapuram 331.7 OE / DPAP 21.99 6.84 13.680 8.31 11.65 22 440 Yes
Total 131.63 43.95 87.90 48.55 113.02 94 1880
* Data Source : Institute of Remote Sensing, Anna University, Chennai
** Capacity of existing surface water structures computed from data available with SG&SWRDC, Govt. of Tamil Nadu on waterspread area,
assuming average depth of 1.0 m.
# Considering 4mm/day recharge for 120 days filling up of tank in a year.
* It is learned from the earlier executed projects that 50% of Percolation Ponds in Tamil Nadu should be provided with Recharge Shaft/Bore
Well/Tube Well as per the local terrain condition for effective recharge.
12
6.0 GROUNDWATER RELATED ISSUES & PROBLEMS
Based on the high level of ground water development in 5 blocks, it is inferred that in these parts of the district could be considered vulnerable to water level depletion. The heterogeneity of the crystalline formation and poor yield prospects in Gondwana sediments make the availability groundwater for further development site specific and scientific methods may employed for siting of wells.
7.0 AWARENESS & TRAINING ACTIVITY
Mass Awareness Campaign (MAP) & Water Management Training Programme (WMTP) by CGWB
One Mass Awareness Campaign on “Ground Water Management, Regulation & Conservation” was organized at Thuraiyur during 2005-2006. The findings of exploration carried out by CGWB, the results of Geophysical investigations for source finding and their limitations, Ground water resource potential of Tiruchchirappalli district, Techniques on Ground water resource management and need for regulation and water conservation were explained to the gathering of 200 people.
8.0 AREA NOTIFIED BY CGWA/SGWA
Central Ground Water Authority has notified Thuraiyur Block in the district for registration of groundwater abstraction structures. Government of Tamil Nadu vide G.O.No. 53 has banned groundwater development for irrigation in the over exploited blocks of Tamil Nadu. The over exploited blocks in this district are as follow. 1. Tattayangarpettai, 2. Thuraiyur, 3. Uppiliyapuram and 4. Manaparai
9.0 RECOMMENDATIONS
Based on the high level of ground water development in the above mentioned overexploited blocks, further groundwater development is not envisaged in these blocks and in Musiri, where the groundwater development has Critical stage, the block could be considered vulnerable to water level depletion. The heterogeneity of the crystalline formation and poor yield prospects in Gondwana sediments make the availability groundwater for further development site specific and scientific methods may employed for siting of wells. On the basis of the experiences in execution of Central Sector Scheme and Demonstrative Projects on artificial recharge, the desilting of existing

13
ponds/tanks will be the most cost effective structures. The provision of recharge wells/shafts in percolation ponds/ check dams will enhance the efficacy of these structures. Rainwater Harvesting has already been made mandatory by the Govt. of Tamil Nadu and people have already made provision for roof top rain water harvesting. However, the efficacy of these structures may be conformed and if any corrections needed may be applied to make these structures effective. Further, artificial recharge structures need to be maintained periodically and it may be given priority for making these structures effective. A concerted effort involving various Government agencies and NGOs can create the necessary awareness among the rural masses. Action plan in this direction with participation of state and central agencies and industrial establishments is recommended.

14

15

16

17

18

19
LEGEND FOR PLATE V
Aquifer Age Lithology Groundwater Condition Yield Prospects
(Cu.m/day)
Groundwater
Development
Strategies
Unconsolidated Recent Alluvium Discontinuous, thin,
unconfined to semi confined
<200
Development through
dug well, shallow tube
well
Semi consolidated Cretaceous
to Miocene
Sandstone, Shale Discontinuous, unconfined to
semi confined
<100 Development of shallow
aquifer through dug well
Consolidated Archaean Granite Gneiss, Granites & Charnockites
Discontinuous, unconfined to semi confined, restricted to
weathered residuum and
fractures
<75 Development of weathered residuum
through dug well &
fractures through bore well
ADMINISTRATIVE SETUP
∆
HILLY AREA
TRIANGULATION HEIGHT[ elevation in m.amsl]
DISTRICT BOUNDARY
BLOCK BOUNDARY
752
CREEK
ISOCONS [ Sp ELECTRICAL CONDUCTANCE [ µs /Cm at 25° C ]
HYDROCHEMISTRY
GROUND WATER HYDROLOGY
∀∀∀∀
TRACE OF LINEAMENT
EXPLORATORY BORE WELL [ CGWB ]
STRUCTURE
750
∀∀∀∀ HIGH YIELDING BORE WELL [ CGWB ]

20
LEGEND OVER LEAF
CENTRAL GROUND WATER BOARD, SECR, CHENNAI.
GROUND WATER DEVELOPMENT POTENTIAL AND
ARTIFICAL RECHARGE PROSPECTS
TIRUCHCHIRAPPALLI DISTRICT, TAMIL NADU
PLATE VI

21
LEGEND FOR PLATE -VI
DISTRICT – TIRUCHIRAPALLI
OTHER INFORMATION

Author : Dr.S.Suresh, Scientist-D, CGWB, SECR, Chennai
Published by : Regional Director, CGWB, SECR, E-1, Rajaji Bhavan, Besant Nagar, Chennai-90
�+914424912941/24914494 �/Fax : 91 4424914334 Web: www.cgwb.gov.in


