
Chicago Equity Partners, LLC // e: [email protected] // t: +1 312.629.8200 // www.chicagoequity.com 1
DO ALPHAS HAVE
BETAS?
Executive Summary
In the world that has evolved from the Capital Asset Pricing Model framework, a greater number of systematic exposures have been used to explain asset returns better, and obtain a better regression fit for the data. In these
multi-regression models, the market is decomposed into a number of systematic beta factors, instead of just one catch-all market beta.
The relationships between these beta factors can be complex, and they are not completely independent from each other. One such interconnection that is often overlooked is the basic relationship between the well-known factor
betas and the overall market beta. Perhaps the most intuitive way of understanding this is to state that some of these factors are pro-cyclical (positively related to the economy/market), while others are counter-cyclical (negatively
related to the economy/market). Investors who understand these essential relationships can gain valuable insight.
This paper explores Value and Momentum factors, which are widely identified in related literature as systematic betas, as well as Quality factors, which are not as well publicized. It will demonstrate that Value and Momentum factors are pro-cyclical with positive market betas, while Quality factors are counter-cyclical with negative market
betas. Furthermore, most active investment strategies have a strong pro-cyclical element, and therefore, have
“betas” in their alphas.
In light of this, the rising popularity of low-volatility, low-beta approaches is not surprising. Such strategies are counter-cyclical and are available in various flavors, through either active management or more passive ETFs. While
they are counter-cyclical and afford downside risk protection, the likely trade-off is underperformance in up markets.
One viable alternative is a quality-oriented factor portfolio. Rather than simply creating a portfolio based on stock volatility characteristics, a quality-based strategy selects securities based on alpha characteristics that are also associated with less downside risk and lower volatility. With some additional volatility and beta controls, the end
result can achieve the desired end goal without sacrificing long-term excess return potential.
Do Alphas Have Betas?
Keith E. Gustafson, CFA, Managing Director
June 30, 2015

Chicago Equity Partners, LLC // e: [email protected] // t: +1 312.629.8200 // www.chicagoequity.com 2
DO ALPHAS HAVE
BETAS?
Introduction
In the Capital Asset Pricing Model, or CAPM (Miller-Lintner-Sharpe1), the performance of an asset is related to the performance of the total market based upon its composition of systematic, or market-based, risk. The returns of the
asset are decomposed through a linear regression into two primary components of systematic risk: beta (the slope
term) and alpha (the intersection term), as well as a residual error term. Essentially, the CAPM beta relates the portion of the total return explained by the market’s movements, while the alpha—as well as the residual error term—
attempts to isolate the elements entirely unrelated to market movements.
In the world that has evolved from the CAPM framework, a greater number of systematic exposures have been used to explain asset returns better, and obtain a better regression fit for the data. These models have evolved from the generic multi-factor Arbitrage Pricing Theorem, or APT (Roll and Ross2), through the latest 5-factor Fama-French
model, which is most commonly used in academia. In parallel development are the multi-factor alpha/risk models
used for both asset management and attribution by practitioners, such as Barra and Northfield, among others.
In these multi-regression models, the market is decomposed into a number of systematic beta factors, instead of just one catch-all market beta. The widely recognized additional beta factors encompass traditional valuation
metrics, like Price-to-Book, as well as factors that are more growth-related, such as Price Momentum, as well as
factors related to a stock’s market capitalization. Just because these other factors have been identified as separate beta factors in stock returns doesn’t necessarily mean they have no relationship to the traditional market beta,
though. In technical terms, it means these factor betas are not perfectly orthogonal to each other or to the market
beta. In fact, there is often multicollinearity of these systematic factors with each other and with the market. Even casual market observers will agree that there is a positive correlation between the systematic factors of size and
value, for instance.
In other words, there are relationships between variables that can be complex, and these factors are not completely independent from each other. One such interconnection that is often overlooked is the relationship between the well-known factor betas (i.e. value, size, momentum) and the overall market beta. Perhaps a more intuitive way of
understanding this is to state that some of these factors are pro-cyclical (positively related to the economy/market),
while others are counter-cyclical (negatively related to the economy/market). Investors who understand these essential relationships can gain valuable insight.
Do Alphas Have Betas?
Keith E. Gustafson, CFA, Managing Director
June 30, 2015

Chicago Equity Partners, LLC // e: [email protected] // t: +1 312.629.8200 // www.chicagoequity.com 3
DO ALPHAS HAVE
BETAS?
This paper will explore Value and Momentum factors, which are widely identified in related literature as systematic betas, as well as Quality factors, which are not as well publicized. It will demonstrate that Value and Momentum factors are pro-cyclical with positive market betas, while Quality factors are counter-cyclical with negative market
betas. Furthermore, most active investment strategies have a strong pro-cyclical element, and therefore, have
“betas” in their alphas. This is true even for supposedly uncorrelated strategies, such as “market neutral,” that employ such factors. Although the market beta may be removed from a portfolio by stripping out the market
benchmark, a residual market beta-related component often exists in the remaining alpha. However, active value
and active momentum/growth strategies do tend to be pro-cyclical at different stages of the market cycle. These differences are beneficial in portfolio structuring. While Quality is counter-cyclical, very few active strategies exhibit
this pattern as the primary characteristic, which explains some of the appeal of specific low-volatility, low-beta
approaches.
The Beta in Value and Growth/Momentum Alphas – Pro-Cyclical
Value Strategies
Value factors are among the betas well recognized for their long-term efficacy in contributing to excess returns above the market. Not surprisingly, value managers will outperform when valuation factors (P/B, P/S, P/E, P/CF,
P/FCF, etc.) are working well. These factors provide the best returns when there is wide dispersion in valuations between stocks and/or sectors. This dispersion is generally widest after a recession or bear market, and it
subsequently shrinks over the course of an economic/market expansion. As the multiple dispersion across sectors
and stocks contracts, and as those multiples revert to the mean, it means the valuation factors are working. Valuation factors generate their return through reversion to the mean.
Therefore, there is a pro-cyclical element to traditional valuation factors. They work best when the market is climbing from the trough of the market at a very steep rate of ascent. As such, these strategies can actually have high
correlations with market beta at certain times. This is confusing to most investors because there is a distinction between the components of “value” that are pro-cyclical and those components of “value” that are counter-cyclical.
Both elements are present in value indexes, but active value managers usually emphasize the pro-cyclical sectors
and stocks.
This distinction between pro-cyclical “value” and counter-cyclical “value” is intertwined with volatility. Historically, Value factors are associated with both anomalous excess returns over the market, as well as concomitant lower risk,
as measured by standard deviation. This is an anomaly that it is a violation of the CAPM – simultaneous higher
returns and lower risk. Interestingly, this often results from combining cyclical and counter-cyclical components in a quasi-asset allocation framework.
Chicago Equity Partners, LLC // e: [email protected] // t: +1 312.629.8200 // www.chicagoequity.com 4
DO ALPHAS HAVE
BETAS?
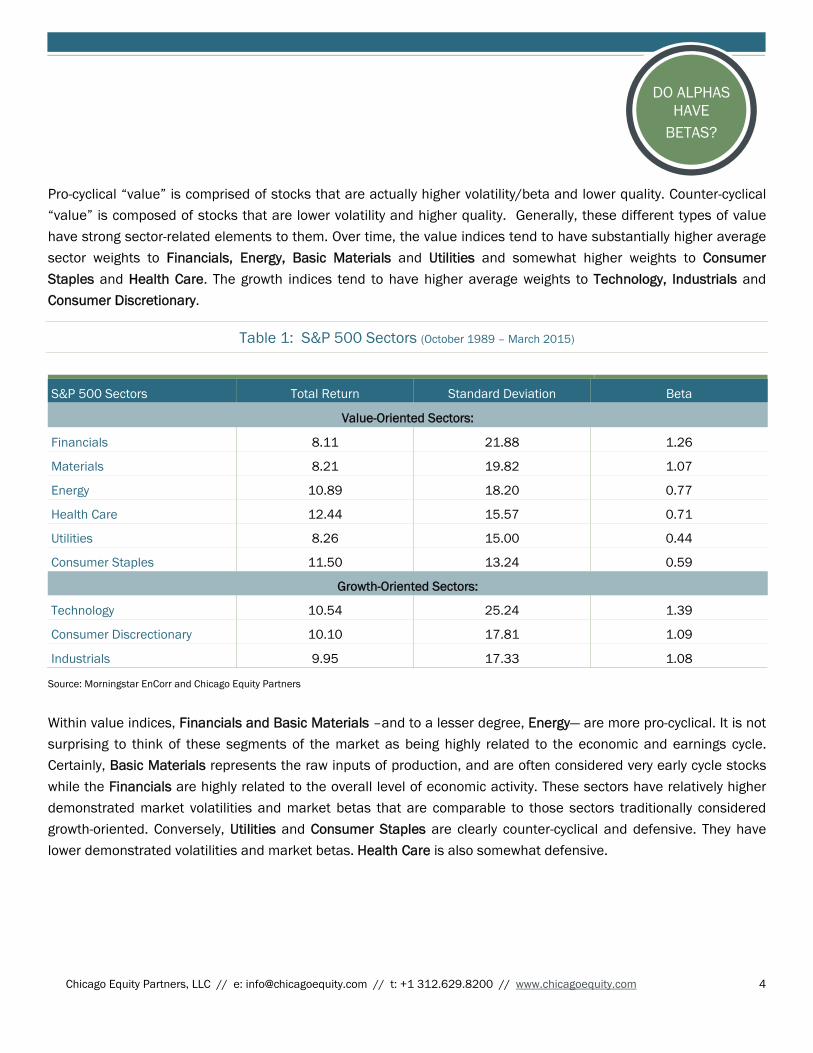
Pro-cyclical “value” is comprised of stocks that are actually higher volatility/beta and lower quality. Counter-cyclical “value” is composed of stocks that are lower volatility and higher quality. Generally, these different types of value have strong sector-related elements to them. Over time, the value indices tend to have substantially higher average
sector weights to Financials, Energy, Basic Materials and Utilities and somewhat higher weights to Consumer
Staples and Health Care. The growth indices tend to have higher average weights to Technology, Industrials and Consumer Discretionary.
Table 1: S&P 500 Sectors (October 1989 – March 2015)
S&P 500 Sectors Total Return Standard Deviation Beta
Value-Oriented Sectors:
Financials 8.11 21.88 1.26
Materials 8.21 19.82 1.07
Energy 10.89 18.20 0.77
Health Care 12.44 15.57 0.71
Utilities 8.26 15.00 0.44
Consumer Staples 11.50 13.24 0.59
Growth-Oriented Sectors:
Technology 10.54 25.24 1.39
Consumer Discrectionary 10.10 17.81 1.09
Industrials 9.95 17.33 1.08
Source: Morningstar EnCorr and Chicago Equity Partners
Within value indices, Financials and Basic Materials –and to a lesser degree, Energy— are more pro-cyclical. It is not surprising to think of these segments of the market as being highly related to the economic and earnings cycle. Certainly, Basic Materials represents the raw inputs of production, and are often considered very early cycle stocks
while the Financials are highly related to the overall level of economic activity. These sectors have relatively higher
demonstrated market volatilities and market betas that are comparable to those sectors traditionally considered growth-oriented. Conversely, Utilities and Consumer Staples are clearly counter-cyclical and defensive. They have
lower demonstrated volatilities and market betas. Health Care is also somewhat defensive.
Chicago Equity Partners, LLC // e: [email protected] // t: +1 312.629.8200 // www.chicagoequity.com 5
DO ALPHAS HAVE
BETAS?
Pro-cyclical components of value primarily drive value index outperformance of the market in periods of low-quality,
high beta, cyclical recovery rallies, like 2009. Counter-cyclical components of value drive the outperformance of value indexes in periods of market downturns, like 2008, which emphasize low beta, higher quality and lower
volatility. Distinguishing between these different components that comprise value indexes is critical to
understanding the performance of most active value strategies.
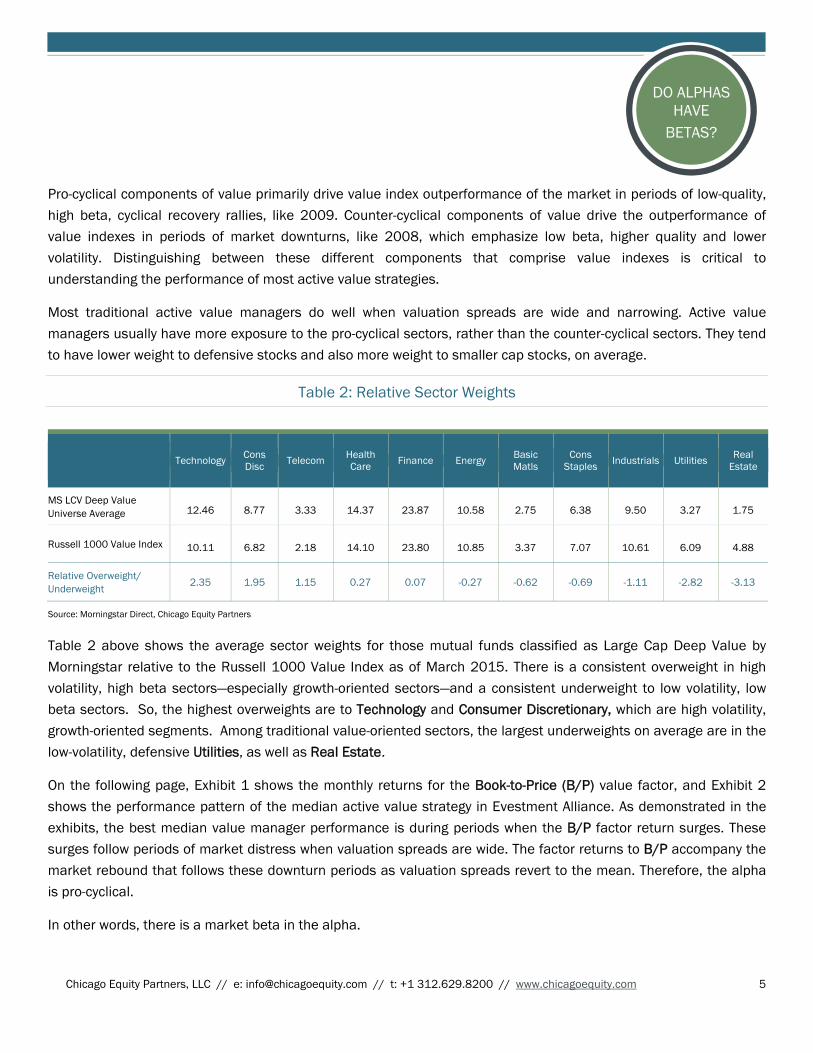
Most traditional active value managers do well when valuation spreads are wide and narrowing. Active value
managers usually have more exposure to the pro-cyclical sectors, rather than the counter-cyclical sectors. They tend
to have lower weight to defensive stocks and also more weight to smaller cap stocks, on average.
Table 2: Relative Sector Weights
Technology Cons Disc Telecom Health
Care Finance Energy Basic Matls
Cons Staples Industrials Utilities Real
Estate
MS LCV Deep Value Universe Average 12.46 8.77 3.33 14.37 23.87 10.58 2.75 6.38 9.50 3.27 1.75
Russell 1000 Value Index 10.11 6.82 2.18 14.10 23.80 10.85 3.37 7.07 10.61 6.09 4.88
Relative Overweight/ Underweight
2.35 1.95 1.15 0.27 0.07 -0.27 -0.62 -0.69 -1.11 -2.82 -3.13
Source: Morningstar Direct, Chicago Equity Partners
Table 2 above shows the average sector weights for those mutual funds classified as Large Cap Deep Value by
Morningstar relative to the Russell 1000 Value Index as of March 2015. There is a consistent overweight in high
volatility, high beta sectors—especially growth-oriented sectors—and a consistent underweight to low volatility, low beta sectors. So, the highest overweights are to Technology and Consumer Discretionary, which are high volatility,
growth-oriented segments. Among traditional value-oriented sectors, the largest underweights on average are in the
low-volatility, defensive Utilities, as well as Real Estate.
On the following page, Exhibit 1 shows the monthly returns for the Book-to-Price (B/P) value factor, and Exhibit 2
shows the performance pattern of the median active value strategy in Evestment Alliance. As demonstrated in the
exhibits, the best median value manager performance is during periods when the B/P factor return surges. These surges follow periods of market distress when valuation spreads are wide. The factor returns to B/P accompany the
market rebound that follows these downturn periods as valuation spreads revert to the mean. Therefore, the alpha
is pro-cyclical.
In other words, there is a market beta in the alpha.

Chicago Equity Partners, LLC // e: [email protected] // t: +1 312.629.8200 // www.chicagoequity.com 6
DO ALPHAS HAVE
BETAS?
Exhibit 1: Return to B/P Factor, Monthly Regression Coefficient
Exhibit 2: Evestment Large Cap Value Universe Median Excess Returns Rolling 3 Year Excess vs. Russell 1000 Value Index
-4.0
-2.0
0.0
2.0
4.0
6.0
8.0
10.0
Dec
-89
Dec
-90
Dec
-91
Dec
-92
Dec
-93
Dec
-94
Dec
-95
Dec
-96
Dec
-97
Dec
-98
Dec
-99
Dec
-00
Dec
-01
Dec
-02
Dec
-03
Dec
-04
Dec
-05
Dec
-06
Dec
-07
Dec
-08
Dec
-09
Dec
-10
Dec
-11
Dec
-12
Dec
-13
Dec
-14
Source: Chicago Equity Partners
Monthly Regression Coeffcient
-5.0
-4.0
-3.0
-2.0
-1.0
0.0
1.0
2.0
3.0
4.0
5.0
Dec
-89
Dec
-90
Dec
-91
Dec
-92
Dec
-93
Dec
-94
Dec
-95
Dec
-96
Dec
-97
Dec
-98
Dec
-99
Dec
-00
Dec
-01
Dec
-02
Dec
-03
Dec
-04
Dec
-05
Dec
-06
Dec
-07
Dec
-08
Dec
-09
Dec
-10
Dec
-11
Dec
-12
Dec
-13
Dec
-14
Excess Return
Source: Chicago Equity Partners, Evestment Alliance U.S. Large Cap Value Universe. Data is gross of fees. Past performance is not indicative of future results.

Chicago Equity Partners, LLC // e: [email protected] // t: +1 312.629.8200 // www.chicagoequity.com 7
DO ALPHAS HAVE
BETAS?
To empirically demonstrate this, we construct simple factor portfolios and measure the correlation between their
excess returns and the market return. The result is shown in Exhibit 3. This graph shows the market correlations of high tracking error (HTE), factor based portfolios for Momentum, Value and Quality factors. These portfolios
emphasize a mixture of factors within each group, based upon Chicago Equity Partners’ (CEP) factors. They are
meant to represent more extreme tail exposures, which allows for higher standardized exposures to the factors.
The average correlation between the Value factor portfolio and the market index is positive 0.27, on average, from
2001 to 2014, which is not very different from that of a Momentum factor portfolio, which is positive 0.28. The
difference between them, with respect to their market relationships, lies in timing.
Therefore, for value strategies we see: 1) Active value managers emphasize higher volatility, higher beta sectors; 2)
Value factor returns are best when the market returns are the highest in early stage recoveries, which are key data
leverage points; and 3) Empirically, a Value factor portfolio demonstrates a market beta, on average, similar to that of a Momentum factor portfolio.
Exhibit 3: Beta of Factor Alpha – Pro-Cyclical vs. Counter-Cyclical Factors Rolling 252 day Correlation of HTE Factor Portfolios’ Excess Returns vs. Russell 1000 Index
-1.0
-0.8
-0.6
-0.4
-0.2
0.0
0.2
0.4
0.6
0.8
1.0
HTE MomentumHTE ValueHTE Quality
Source: Chicago Equity Partners
Dec
-00
Dec
-01
Dec
-02
Dec
-03
Dec
-04
Dec
-05
Dec
-06
Dec
-07
Dec
-08
Dec
-09
Dec
-10
Dec
-11
Dec
-12
Dec
-13
Dec
-14
Average CorrelationsMomentum 0.28Value 0.27Quality -0.47

Chicago Equity Partners, LLC // e: [email protected] // t: +1 312.629.8200 // www.chicagoequity.com 8
DO ALPHAS HAVE
BETAS?
Momentum / Growth Strategies
Although a positive beta exposure for value portfolios may seem counterintuitive, it seems very intuitive for growth portfolios. Growth managers will typically outperform when momentum and growth factors are working (Price
Momentum, Estimate Momentum, Expected Earnings Growth, Earnings Surprise, etc.). This generally occurs during
sustained economic and market expansions, when market returns are also positive. As shown earlier in Table 1, volatility and beta characteristics of growth-oriented S&P sectors are intuitively higher than the market average.
Growth managers maintain higher weights to these sectors, on average.
As Exhibit 3 illustrates, momentum factors are largely pro-cyclical—meaning that there is a positive market correlation. The notable exception to this general rule is when a market inflects from a downturn into a subsequent
sharp rebound, like 2003 and 2009. Early in the cycle, momentum factors will tend to have a brief negative
relationship with market returns as the primary trends inflect. In fact, there is actually an inverse correlation between returns to a traditional value factor, like B/P, and factors like Price Momentum or Estimate Revisions.
This is best illustrated in Exhibit 4, which shows the return to a broad-based momentum factor (consisting of both
Price Momentum and Estimate Momentum) applied in a sector-neutral fashion. Dips in the momentum factor return in 2002-2003, 2008-2009 and 2012-2013 correspond with dips in the beta of the momentum portfolio in Exhibit 3.
Exhibit 4: Momentum Factors, Forward 12-Month Regression Coefficient
-2.25
-1.25
-0.25
0.75
1.75
2.75
Apr-8
9
Jan-
90
Oct
-90
Jul-9
1
Apr-9
2
Jan-
93
Oct
-93
Jul-9
4
Apr-9
5
Jan-
96
Oct
-96
Jul-9
7
Apr-9
8
Jan-
99
Oct
-99
Jul-0
0
Apr-0
1
Jan-
02
Oct
-02
Jul-0
3
Apr-0
4
Jan-
05
Oct
-05
Jul-0
6
Apr-0
7
Jan-
08
Oct
-08
Jul-0
9
Apr-1
0
Jan-
11
Oct
-11
Jul-1
2
Apr-1
3
Jan-
14
Source: Chicago Equity Partners

Chicago Equity Partners, LLC // e: [email protected] // t: +1 312.629.8200 // www.chicagoequity.com 9
DO ALPHAS HAVE
BETAS?
Therefore, growth/momentum strategies are not correlated with the market during the early stages of recoveries.
That’s when value factors do the best and have the highest market correlation. Instead, momentum factors have the highest correlation later in the market cycle, when clear trends have already been established. Paradoxically, both
traditional growth/momentum and traditional value strategies are pro-cyclical over a market cycle, but not with each
other! Each factor strategy peaks in terms of correlation with the market at slightly different points in the cycle. They both have betas in their alphas, but those betas are not synchronized.
Value was actually more pro-cyclical (higher beta) during the decade 2000-2009, when performance was essentially
sideways, because there were multiple opportunities for market downturns and subsequent market rebounds. It was much less pro-cyclical during the sustained expansionary period of the 1990s. During a sustained expansion, value
factors will exhibit lower betas, while momentum factors will have consistently positive returns and consistently
positive market betas.
Importantly, while there is some positive market beta in both respective alphas, neither active value nor
momentum/growth strategies are expected to consistently outperform in market downturns. This is because neither
set of factors, on which these strategies are based, is truly counter-cyclical.
Counter-Cyclical Approaches – Low Volatility vs. Quality
One specific sub-set of value strategies is counter-cyclical. This sub-set encompasses low-volatility and low-beta
strategies. Almost without exception, these strategies employ heavy tilts toward the sectors with the lowest betas and volatilities, such as Utilities and Consumer Staples. It is important not to confuse these strategies with
fundamental indexing or similar Smart Beta approaches that tilt to higher volatility components, Value and Size.
There are numerous active low volatility strategies in the marketplace, as well as more passive ETF approaches.
Exhibit 5: PowerShares Low-Volatility ETF (SPLV), 3/31/15 Sector Over/Underweights vs. Value Index
-15.0
-10.0
-5.0
0.0
5.0
10.0
15.0
Ener
gy
Tech
nolo
gy
Fina
ncia
ls
Cons
Dis
c
Hea
lthca
re
Telc
om
Bas
ic M
atls
Indu
stria
ls
Util
ties
Cons
Sta
ples
Rea
l Est
ate
Source: Morningstar Direct

Chicago Equity Partners, LLC // e: [email protected] // t: +1 312.629.8200 // www.chicagoequity.com 10
DO ALPHAS HAVE
BETAS?
On the previous page, Exhibit 5 shows one such ETF strategy— Powershares S&P 500 Low Volatility ETF (ticker:
SPLV). It is heavily overweighted to Utilities, Consumer Staples and Real Estate sectors, which exhibit lower volatility and lower beta versus the value index. It is heavily underweighted to Energy, Technology and Financials, which are
higher volatility and higher beta sectors.
So far, so good. If an investor is looking for downside protection that will do relatively better than pro-cyclical growth and value strategies in a market downturn, these low volatility strategies will provide some protection. Many of these
strategies, however, are marketed as long-term alpha plays capitalizing on “low beta, low volatility” anomalies. If an
investor is expecting to outperform the market in the long run through such an approach, we think that they are likely to be disappointed. Certainly, such strategies will not work on a consistent basis. Value indices have
outperformed in the long run with lower volatility because they mix pro-cyclical, beaten-down stocks that are actually
high volatility and beta at attractive prices along with lower volatility, lower beta counter-cyclical stocks. The favorable long-term results stem in part from a quasi-asset-allocation effect.
Strictly relying on the lower volatility, lower beta, counter-cyclical value constituents is likely to provide those exact
benefits, but not the overall outperformance associated with traditional value strategies. Exhibit 6 illustrates the recent performance of the low-volatility ETF (ticker: SPLV) compared with the broad market (SPX), along with
momentum (ticker: PDP) and value (ticker: PRF) ETFs from the same fund family of PowerShares. Each of these
strategies largely expresses their factor bets through sector tilts, rather than at the stock level within each sector. The low-volatility approach, not surprisingly, has underperformed in this recent market upturn.
Exhibit 6: Cumulative Returns of Factor ETFs vs. Market (6/30/13 – 3/31/15)
-5.0
0.0
5.0
10.0
15.0
20.0
25.0
30.0
35.0
40.0
45.0
Jul-1
3
Jul-1
3
Aug-
13
Sep-
13
Sep-
13
Oct
-13
Nov
-13
Nov
-13
Dec
-13
Jan-
14
Jan-
14
Feb-
14
Mar
-14
Mar
-14
Apr-1
4
May
-14
Jun-
14
Jun-
14
Jul-1
4
Aug-
14
Aug-
14
Sep-
14
Oct
-14
Oct
-14
Nov
-14
Dec
-14
Dec
-14
Jan-
15
Feb-
15
Mar
-15
Mar
-15
Momentum ETF (PDP)
Value ETF (PRF)
Low-Vol ETF (SPLV)
S&P 500 (SPX)
Source: Thomson Reuters Baseline, (PDP) Powershares DWA MOTM, (SPLV) Powershares S&P 500 Lo Vol, (PRF) Powershares FTSE RAFI Value
Chicago Equity Partners, LLC // e: [email protected] // t: +1 312.629.8200 // www.chicagoequity.com 11
DO ALPHAS HAVE
BETAS?
Over the last couple years that these ETFs have been available, the market has largely continued in a solid upward
trajectory, as represented in the chart. The momentum ETF has handily outperformed, as would be expected because of the overweight to higher volatility, higher beta sectors. In an up market, high beta should pay off. The low
beta, low volatility ETF is the worst performer, as expected. It performed the best over the short time frames in which
the market pulled back in this longer-term expansion, but not over the entire timeframe. Once again, in an up market, low beta should not pay off! If an investor is expecting long-term outperformance from specifically
constructed low volatility, low beta strategies, this is only likely in an extended sideways market as we experienced in
the 2000s. Once low volatility, low beta strategies have established an extended track record, investors are likely to be disappointed with the returns generated if we remain in an extended bull market.
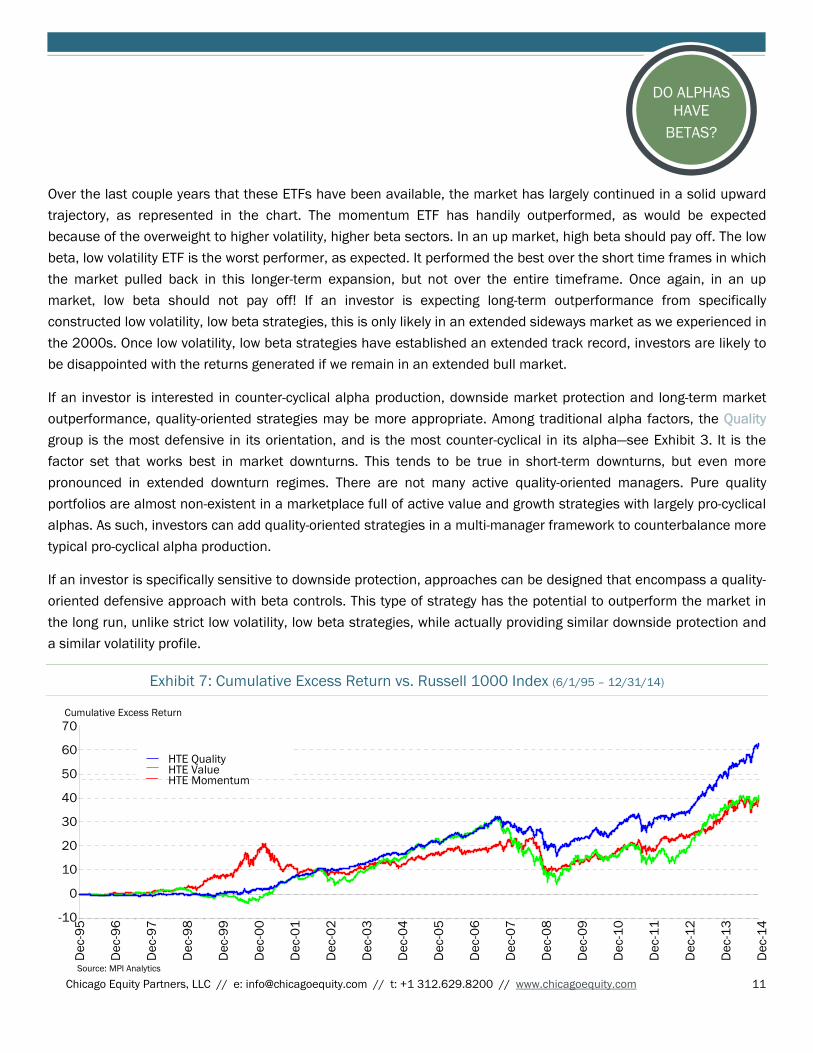
If an investor is interested in counter-cyclical alpha production, downside market protection and long-term market
outperformance, quality-oriented strategies may be more appropriate. Among traditional alpha factors, the Quality group is the most defensive in its orientation, and is the most counter-cyclical in its alpha—see Exhibit 3. It is the
factor set that works best in market downturns. This tends to be true in short-term downturns, but even more
pronounced in extended downturn regimes. There are not many active quality-oriented managers. Pure quality portfolios are almost non-existent in a marketplace full of active value and growth strategies with largely pro-cyclical
alphas. As such, investors can add quality-oriented strategies in a multi-manager framework to counterbalance more
typical pro-cyclical alpha production.
If an investor is specifically sensitive to downside protection, approaches can be designed that encompass a quality-
oriented defensive approach with beta controls. This type of strategy has the potential to outperform the market in
the long run, unlike strict low volatility, low beta strategies, while actually providing similar downside protection and a similar volatility profile.
Exhibit 7: Cumulative Excess Return vs. Russell 1000 Index (6/1/95 – 12/31/14)
Source: MPI Analytics
HTE Momentum R1HTE Value R1HTE Quality R1
Cumulative Excess Return
Dec
-95
Dec
-96
Dec
-97
Dec
-98
Dec
-99
Dec
-00
Dec
-01
Dec
-02
Dec
-03
Dec
-04
Dec
-05
Dec
-06
Dec
-07
Dec
-08
Dec
-09
Dec
-10
Dec
-11
Dec
-12
Dec
-13
Dec
-14
70
60
50
40
30
20
10
0
-10
HTE QualityHTE ValueHTE Momentum
Source: MPI Analytics

Chicago Equity Partners, LLC // e: [email protected] // t: +1 312.629.8200 // www.chicagoequity.com 12
DO ALPHAS HAVE
BETAS?
Quality is comprised of factors focusing on the balance sheet and income statement that encompass a range of
metrics, including earnings quality and corporate leverage, among other things. Exhibit 7 shows the same factor portfolios that we utilized in Exhibit 3 to illustrate the market beta behavior. This chart shows the cumulative excess
return for the factor portfolios. In the long run, the quality alpha-factor portfolio is just as efficacious as momentum-
based or value-based alpha factor portfolio strategies.
Yet, a quality-oriented portfolio has some unique and desirable properties in terms of its beta and volatility profile,
as well as its complementary relationship with other pro-cyclical strategies. Table 3 shows an overall daily excess
return batting average similar to that of momentum or value. The composition of up and down market capture ratios and batting averages is completely different, however. The beta is also much lower, which leads, of course, to a
higher concomitant measured alpha (excess return adjusted for beta). The lower beta also leads to a higher Treynor
Ratio, while the lower variance leads to a higher measured Sharpe Ratio.
Table 3: Statistical Summary (6/2/95 – 12/31/14)
Alpha% Beta Sharpe Ratio
Treynor Ratio
Batting Avg
Up Mkt Capture%
Up Mkt Batting Avg
Down Mkt Capture%
Down Mkt Batting Avg
HTE Momentum 2.426 1.084 0.510 0.087 52.4% 117.6 60.9% 104.7 42.3%
HTE Value 2.582 1.085 0.509 0.088 52.9% 110.3 55.5% 102.2 49.7%
HTE Quality 4.404 0.861 0.655 0.124 52.8% 82.7 39.1% 90.0 69.1%
Source: Chicago Equity Partners
Therefore, investors that are interested in simplistic low volatility, low beta approaches because of the attractive risk/return trade-off should explore alternative quality-based factor strategies, which have a much better long-term
return profile with similar counter-cyclical properties.

Chicago Equity Partners, LLC // e: [email protected] // t: +1 312.629.8200 // www.chicagoequity.com 13
DO ALPHAS HAVE
BETAS?
Conclusion
What does it mean for alphas to have betas? Quite simply, it means that the timing of alpha is related to the market. Some strategies are pro-cyclical and produce their alpha mostly when the market itself is generating returns. This
pro-cyclical alpha production applies to most active strategies. Although this is somewhat intuitive for momentum
and growth approaches, it is less intuitive for value approaches. This paper has attempted to explain that conundrum through a decomposition of typical sector bets, as well as the return pattern of value factors in relation
to market returns. Empirically, momentum and value approaches are both pro-cyclical. In other words, they do have
betas in their alphas. The exact timing of this alpha production is different, and each approach is most correlated with the market at different points in the economic/market cycle.
Investors have always had a desire for some counter-cyclical alpha production. “Why can’t managers outperform
when markets are going down and I need that outperformance the most?” is a typical investor refrain. Unfortunately, there is not a copious supply of such investment vehicles. In light of this, the rising popularity of low volatility, low
beta approaches is not surprising. These are available in various vehicles, through either active management or
more passive ETFs. While they are counter-cyclical and afford downside risk protection, the likely trade-off is underperformance in up markets. In the long run, we expect markets to go up, which is a potential problem for these
strategies.
One viable alternative is a quality-oriented factor portfolio. Rather than simply creating a portfolio based on stock volatility characteristics, a quality-based strategy selects securities based on alpha characteristics that are also
associated with less downside risk and lower volatility. With some additional volatility and beta controls, the end
result can achieve the desired end goal without sacrificing long-term excess return potential.

Chicago Equity Partners, LLC // e: [email protected] // t: +1 312.629.8200 // www.chicagoequity.com 14
DO ALPHAS HAVE
BETAS?
Endnotes
1 Modigliani, F. & Miller, M. (1958) ‘The Cost of Capital, Corporation Finance and the Theory of Investment’ American Economic Review, Vol 48 No. 4 pp 261- 297.
Lintner, J. (1965a) ‘The Valuation of Risk Assets and the Selection of Risky Investments in Stock Portfolios and Capital Budgets’ Review of Economics and Statistics, Vol 73 pp 13-37.
Lintner, J. (1965b) ‘Security Prices, Risk and Maximal Gains from Diversification’ Journal of Finance, Vol 20 pp 587-615.
Sharpe, W.F. (1964) ‘Capital Asset Prices: A Theory of Market Equilibrium under Conditions of Risk’ Journal of Finance, Vol 19 No. 3 pp 425-42.
2 Roll, R. (1977) ‘A Critique of the Asset Pricing Theory’s Tests’ Journal of Financial Economics, Vol 4 pp 129-76.
Roll, R. (1978) ‘Ambiguity When Performance is Measured by the Securities Market Line’ Journal of Finance, Vol 33 pp 1051-69.
Ross, S. (1976) ‘The Arbitrage Theory of Capital Asset Pricing’ Journal of Economic Theory, Vol 13 pp 341-60.
Ross, S. (1978) ‘The Current Status of the Capital Asset Pricing Model (CAPM)’ Journal of Finance, Vol 33 pp 885-90.
This material has been distributed for informational purposes only and does not constitute investment advice or a recommendation of any security or investment service offered by Chicago Equity Partners, LLC. The material presented reflects the opinions of the author and is subject to change without notice. The opinions and themes discussed herein may not be suitable for all investors. Past performance is not indicative of future results. No part of this material may be reproduced in any form without the express written permission of Chicago Equity Partners, LLC.


