DOCUMENTATION FOR THE 2005 POINT SOURCE
NATIONAL EMISSIONS INVENTORY
Prepared for:
Emission Inventory and Analysis Group (D205-01)
Emissions, Monitoring and Analysis Division
U.S. Environmental Protection Agency
Research Triangle Park, NC 27711
Prepared by:
Eastern Research Group, Inc.
1600 Perimeter Park Drive
Morrisville, NC 27560
September 9, 2010

This page is intentionally left blank.

iii
TABLE OF CONTENTS Section Page
1.0 INTRODUCTION....................................................................................................... 1-1
1.1 What is the National Emissions Inventory? ....................................................... 1-1
1.2 Why Did the EPA Create the NEI?................................................................... 1-1
1.3 How is the EPA Going to Use the NEI? ........................................................... 1-2
1.4 Report Organization......................................................................................... 1-3
2.0 INFORMATION QUALITY GUIDELINES ADDENDUM FOR THE 2005 NEI....... 2-1
2.1 Purpose............................................................................................................ 2-1
2.2 Explanation of Potential Uses ........................................................................... 2-1
2.3 Product Content – Inputs, Methodologies, and Outputs.................................... 2-2
2.4 Product Limitations and Caveats ...................................................................... 2-3
2.5 Contact Information ......................................................................................... 2-4
3.0 DEVELOPMENT OF THE POINT SOURCE NEI ..................................................... 3-1
3.1 EIAG Requested State, Local and Tribal Inventory Data in 2007...................... 3-2
3.2 Initial Data Received from State, Local, Tribal and Regional Agencies.............. 3-4
3.3 Data Provided By Trade Associations............................................................... 3-4
3.4 EIAG Prepared 2005 Emissions from Electric Generating Units (EGUs) .......... 3-4
3.5 EIAG Requested SPPD Maximum Achievable Control Technology Inventory Data
and Facility Lists .............................................................................................. 3-7
3.6 EIAG Requested SPPD’s RTR Data................................................................. 3-8
3.7 EIAG Requested MMS Gulf of Mexico Oil and Gas Platform Data .................. 3-9
3.8 Supplementing with TRI Data .......................................................................... 3-9
3.9 Processing State, Local, and Tribal Agency, MACT, and Industry Data Sets .. 3-10
3.10 Blending/Merging (aka Data Selection) .......................................................... 3-11
3.11 Particulate Matter Augmentation.................................................................... 3-14
3.12 Final QA Steps ............................................................................................... 3-16
3.13 Data Considerations ....................................................................................... 3-17
3.14 Revisions Made Since October 2008............................................................... 3-18

iv
TABLE OF CONTENTS (Cont.) Section Page
3.15 Revisions Made Since June 2009 .................................................................... 3-20
3.16 Revisions Made Since June 2010 .................................................................... 3-21
4.0 COMPILING THE INVENTORY DATA INTO THE NEI DATABASE.................... 4-1
4.1 NIF 3.0 and EPA’s Data Standards................................................................... 4-1
4.1.1 SIC/NAICS Data Standard ................................................................... 4-1
4.1.2 Latitude/Longitude Data Standard ........................................................ 4-2
4.1.3 Chemical Identification Data Standard .................................................. 4-2
4.1.4 Facility Identification Data Standard ..................................................... 4-2
4.1.5 Contact Standards................................................................................. 4-3
4.2 NOF 3.0 and Data Standards ............................................................................ 4-3
5.0 REFERENCES............................................................................................................ 5-1
Appendix A State, Local, and Tribal Database Summary Tables for the 2005 Point
Source NEI ......................................................................................................A-1 Appendix B Quality Control Reports ...................................................................................B-1

v
LIST OF TABLES
Table Page
Table 3-1. Data Elements Requested from State, Local, and Tribal Agencies ........................... 3-3
Table 3-2. States and Local Areas and Tribes that Provided 2005 Inventory Data .................... 3-5
Table 3-3. MACT Source Categories in the 2005 NEI ............................................................. 3-7
Table 3-4. Facility Lists for MACT Categories ........................................................................ 3-8
Table 3-5. Data Hierarchy for 2005 NEI................................................................................ 3-12
Table 3-6. PM Species Record Count Prior to PM Augmentation Routine............................. 3-14
Table 3-7. PM Augmentation Data Source Codes.................................................................. 3-15
Table 3-8. PM Species Record Count After PM Augmentation Routine................................. 3-16
1-1
1.0 INTRODUCTION
1.1 What is the National Emissions Inventory?
The National Emissions Inventory (NEI) is a comprehensive inventory covering all criteria
air pollutants (CAPs) and hazardous air pollutants (HAPs) for all areas of the United States. The
NEI was created by the EPA’s Emission Inventory and Analysis Group (EIAG) in Research
Triangle Park, North Carolina.
This report presents an overview of how the point source component of the 2005 NEI was
compiled. Ultimately, the 2005 NEI will be used to support air quality modeling and other
activities. To this end, the EPA established a goal to compile comprehensive, facility-specific data
in its 2005 base year NEI for point sources, in addition to preparing nonpoint area and mobile
source 2005 base year inventories.
1.2 Why Did the EPA Create the NEI?
The Clean Air Act (CAA), as amended in 1990, includes many mandates for the EPA
related to CAPs and HAPs. Regulatory agencies rely on emission inventories as indicators of air
quality changes and to set permit requirements. The NEI contains emission estimates for the
following CAPs:
• Carbon monoxide (CO)
• Condensable particulate matter (PM-CON)
• Filterable and primary particulate matter less than 2.5 microns (PM2.5-FIL and
PM2.5-PRI)
• Filterable and primary particulate matter less than 10 microns (PM10-FIL and
PM10-PRI)
• Nitrogen oxides (NOx)
• Sulfur dioxide (SO2)

1-2
• Volatile organic compounds (VOC)
Ammonia is also included in the NEI as a precursor to PM formation.
The NEI is a tool that EPA can use to meet the CAA mandates for HAPs as well. The
CAA presents a list of 188 HAPs (see http://www.epa.gov/ttn/atw/orig189.html for a list of
pollutants and their chemical abstract service [CAS] numbers), for which EPA is to identify their
sources, quantify their emissions by source category, develop regulations for each source
category, and assess public health and environmental impacts after the regulations are put into
effect.
1.3 How is the EPA Going to Use the NEI?
It is anticipated that the 2005 point source inventory developed from this effort will have
multiple end uses. The data have been formatted according to protocols established for the EPA’s
NEI submittals. The common data structure on which the NEI platform is based will allow the
NEI point source data to be transferred to multiple end-users for a variety of purposes.
The CAP emission inventory data are used in State Implementation Plans (SIPs),
compliance demonstrations, emissions trading, and in modeling activities designed to evaluate
ambient air concentrations, exposure assessments, and risk calculations.
The NEI is a critical component of the EPA’s national Air Toxics Program (as described
in EPA’s July 19, 1999 Federal Register notice, 64 FR 38706). The initial objective is to make the
data available to EPA modelers for use in the National Air Toxics Assessment (NATA). In
addition, the emissions data compiled as part of this inventory effort will be used in residual risk
and technology assessments conducted by EPA.

1-3
1.4 Report Organization
Following this introduction, Section 2.0 provides the Information Quality Guidelines
Addendum, a summary of the procedures EIAG implements on the NEI, to make the
development of the inventory more transparent. Section 3.0 provides information on how the
2005 NEI point source emission estimates were first derived from state, local, and tribal
inventories, from data provided by the EPA’s Sector Policies and Programs Division (SPPD) and
Emission Inventory and Analysis Group (EIAG) from the Toxic Release Inventory (TRI) (U.S.
EPA, 2007). Section 4.0 provides information on how the inventory data were compiled into a
common data structure. Section 5.0 presents references cited in this report.
Appendix A provides summary information on the state, local, and tribal agency inventory
data provided to EPA for use in this first version of the 2005 NEI. Appendix B lists quality
control (QC) reports on submitted stack parameters and locational coordinates.

2-1
2.0 INFORMATION QUALITY GUIDELINES ADDENDUM FOR THE
2005 NEI
2.1 Purpose
The National Emissions Inventory (NEI) is a comprehensive inventory covering all criteria
air pollutants (CAPs) and hazardous air pollutants (HAPs) for all areas of the United States. The
NEI was created by the EPA’s Emission Inventory and Analysis Group (EIAG) in Research
Triangle Park, North Carolina. Ultimately, the 2005 base year NEI will be used to support air
quality modeling and other activities. To this end, the EPA established a goal to compile
comprehensive, facility-specific data in its 2005 base year NEI for point sources.
2.2 Explanation of Potential Uses
The Clean Air Act (CAA) includes many mandates for the EPA related to CAPs and
HAPs. The NEI is a tool that EPA can use to meet the CAA mandates. Regulatory agencies rely
on emission inventories as indicators of air quality changes and to set permit requirements. The
CAA presents a list of 188 HAPs for which EPA is to identify their sources, quantify their
emissions by source category, develop regulations for each source category, and assess public
health and environmental impacts after the regulations are put into effect.
It is anticipated that the 2005 point source inventory developed from this effort will have
multiple end uses. The CAP emission inventory data are used in State Implementation Plans
(SIPs), compliance demonstrations, emissions trading, and in modeling activities designed to
evaluate ambient air concentrations.
The NEI is a critical component of the EPA’s national Air Toxics Program. The initial
objective is to make the data available to EPA modelers for use in the National Air Toxics
Assessment (NATA). In addition, the emissions data compiled as part of this inventory effort will
be used in residual risk assessments conducted by EPA.

2-2
2.3 Product Content – Inputs, Methodologies, and Outputs
The scope of the inventory effort was to compile 2005 base year emissions data for point
source facilities in the United States, its territories, and tribal areas.
Criteria pollutant emissions for the NEI are collected under the Consolidated Emissions
Reporting Rule (CERR) (40 CFR Part 51). Under the CERR, EPA requires states to report SO2,
VOC, NOx, CO, Pb, PM10, PM2.5 and NH3. The CERR specifies two sets of reporting thresholds
for criteria pollutants. Type A (large sources) must report annually, while Type B sources must
report every three years. The actual thresholds differ by pollutant and depend upon whether the
source is in a nonattainment area or not. For the 2005 NEI, EPA collected information on both
Type A and Type B sources.
For HAPs, major sources are defined in the CAA as stationary sources that:
• Have the potential to emit 10 tons per year (tpy) or more of one HAP; or
• Have the potential to emit 25 tpy or more of any combination of HAPs.
Smaller point source facilities with annual emissions below these thresholds can be defined
as nonpoint area sources and inventoried as such. While states are more likely to report major
sources as point sources and smaller sources as nonpoint sources, there are no reporting
thresholds for the NEI, and EPA encourages states to submit small sources to the point inventory.
In particular, some source categories which are composed of smaller facilities may emit pollutants
which have a high toxicity weighting, and states may give these categories high priority in data
collection efforts.
The goal in developing the point source NEI was to obtain facility-specific data such as
facility name, location, stack information, emissions, and process descriptions. It was hoped that
the data would be sufficient to support modeling and risk assessment needs. The starting point for
obtaining this facility-specific data was, therefore, state and local air pollution control agencies
and tribes, who are most likely to have this type of detailed inventory data.
2-3
State and local agencies and tribes were asked to supply emission inventory data to the
EPA. Inventory data and facility lists were also requested from the EPA’s Sector Policies and
Programs Division (SPPD) for Risk Technology and Review (RTR) data, Maximum Achievable
Control Technology (MACT), and Section 112(k) Area Source Standards categories. EIAG also
prepared emission inventory data for electric generating units (EGUs).
To develop a complete point source NEI for HAPs, TRI data were also used. The purpose
of appending TRI data to the tribal-, local-, state-, and SPPD-combined databases was to make
sure all emissions data for facilities that report to TRI are included in the NEI.
The EIAG memorandum NEI Quality Assurance and Data Augmentation for Point
Sources (U.S. EPA, 2005) provides details on all of the quality assurance (QA) and augmentation
of the initial data obtained for the 2005 NEI. A variety of QA activities are conducted to identify
duplicate records, referential integrity problems, and records with missing or out-of-range
parameters that are needed for air quality and exposure modeling.
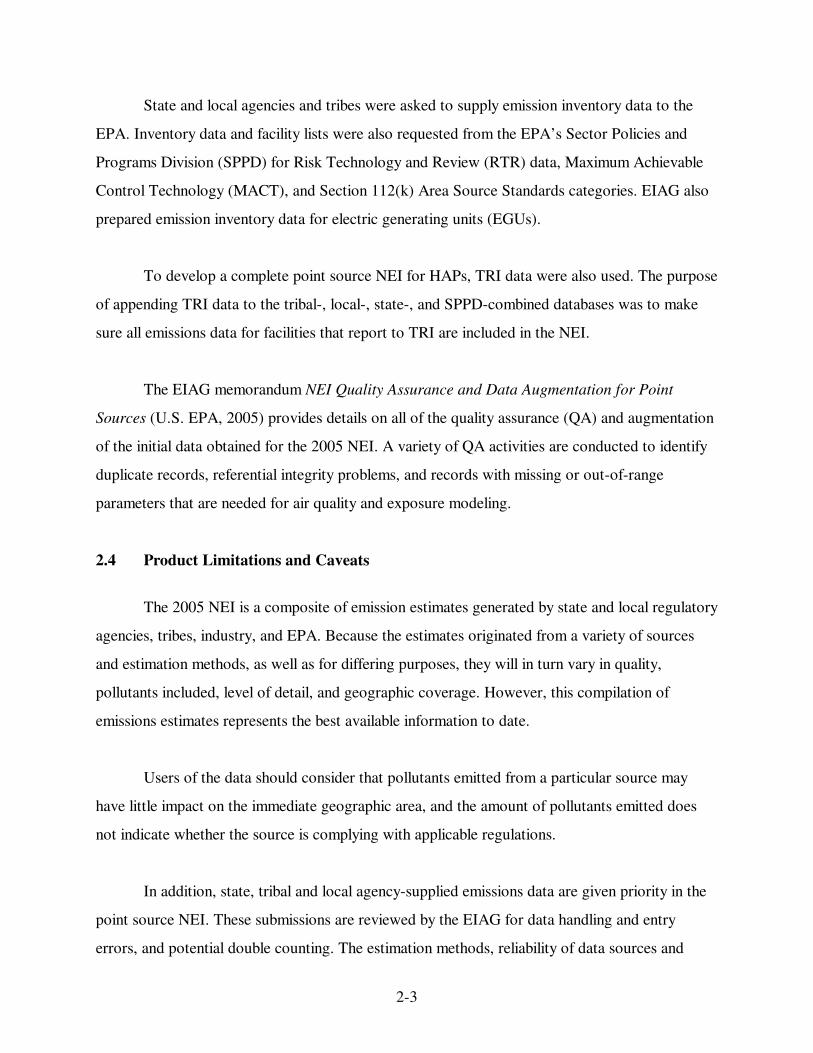
2.4 Product Limitations and Caveats
The 2005 NEI is a composite of emission estimates generated by state and local regulatory
agencies, tribes, industry, and EPA. Because the estimates originated from a variety of sources
and estimation methods, as well as for differing purposes, they will in turn vary in quality,
pollutants included, level of detail, and geographic coverage. However, this compilation of
emissions estimates represents the best available information to date.
Users of the data should consider that pollutants emitted from a particular source may
have little impact on the immediate geographic area, and the amount of pollutants emitted does
not indicate whether the source is complying with applicable regulations.
In addition, state, tribal and local agency-supplied emissions data are given priority in the
point source NEI. These submissions are reviewed by the EIAG for data handling and entry
errors, and potential double counting. The estimation methods, reliability of data sources and

2-4
calculations, and other quality assurance issues are the responsibility of the preparing agency. To
the extent possible, state, local, and tribal agency-supplied data that appear as outliers in the data
set are flagged for further review, and state/local/tribal agency officials are contacted to verify the
validity of the data. In some cases, the questionable data are removed.
For some source facilities, emission estimates were not available for 2005. In these cases,
data for other base years were used. For some of these source categories, SPPD provided
emissions data for a year other than 2005 and noted that the data is the best available to represent
2005. When data are reported for a year other than 2005, it is noted in the NEI.
2.5 Contact Information
NEI point source questions should be forwarded to:
Ms. Anne Pope
U.S. Environmental Protection Agency
Emission Inventory and Analysis Group
Emissions Monitoring and Analysis Division (D205-01)
Office of Air Quality Planning and Standards
Research Triangle Park, North Carolina 27711
919-541-5373

3-1
3.0 DEVELOPMENT OF THE POINT SOURCE NEI
The scope of the inventory effort was to compile and subsequently update 2005 base year
emissions data for point source facilities in the United States.
Criteria pollutant emissions for the NEI are collected under the Consolidated Emissions
Reporting Rule (CERR) (40 CFR Part 51). Under the CERR, EPA requires states to report SO2,
VOC, NOx, CO, Pb, PM10, PM2.5 and NH3. The CERR specifies two sets of reporting thresholds
for criteria pollutants. Type A (large sources) must report annually, while Type B sources must
report every three years. The actual thresholds differ by pollutant and depend upon whether the
source is in a nonattainment area or not. For the 2005 NEI, EPA collected information on both
Type A and Type B sources.
For HAPs, major sources are defined in the CAA as stationary sources that:
• Have the potential to emit 10 tons per year (tpy) or more of one HAP; or
• Have the potential to emit 25 tpy or more of any combination of HAPs.
Smaller point source facilities with annual emissions below these thresholds can be defined
as nonpoint area sources and inventoried as such. While states are more likely to report major
sources as point sources and smaller sources as nonpoint sources, there are no reporting
thresholds for the NEI, and EPA encourages states to submit small sources to the point inventory.
In particular, some source categories which are composed of smaller facilities may emit pollutants
which have a high toxicity weighting, and states may give these categories high priority in data
collection efforts.
The goal in developing the point source NEI was to obtain facility-specific data such as
facility name, location, stack information, emissions, and process descriptions. It was hoped that
the data would be sufficient to support exposure and other modeling analyses, calculate risk,
project control strategies, and track progress to meet the requirements of the CAA. The starting

3-2
point for obtaining this facility-specific data was, therefore, state and local air pollution control
agencies, who are most likely to have this type of detailed inventory data.
3.1 EIAG Requested State, Local and Tribal Inventory Data in 2007
State and local agencies and tribes are asked to supply CAP and HAP emission inventory
data to the EPA. If they are unable to provide emission inventory data, then the EPA will prepare
default emission inventory data for the 2005 NEI, and use these data to support assessments
which will be used in regulatory decision making.
The target inventory area includes every state, tribal area, and territory in the United
States and every county within a state. There are no boundary limitations pertaining to traditional
criteria pollutant nonattainment areas or to designated urban areas. If a facility was included in a
state or local database, it is included in the NEI regardless of where in the state it was located.
The pollutants inventoried include all CAPs.
In addition to CAPs, the NEI requested data also include ammonia, a PM precursor, and
the 188 HAPs identified in Section 112(b) of the CAA. Some agencies collect information on
more HAPs, but only the 188 are included in the NEI. In addition to numerous specific chemical
species and compounds, the list of 188 HAPs includes several compound groups (e.g., individual
metals and their compounds, polycyclic organic matter (POM), and glycol ethers); the NEI
includes emission estimates for the individual compounds wherever possible. Many of the uses of
the NEI depend upon data for individual compounds within these groups rather than aggregated
data on each group as a whole. The lookup database lists all of the specific pollutants and
compound groups included in the 2005 NEI along with their Chemical Abstract Services (CAS)
numbers (for individual compounds).
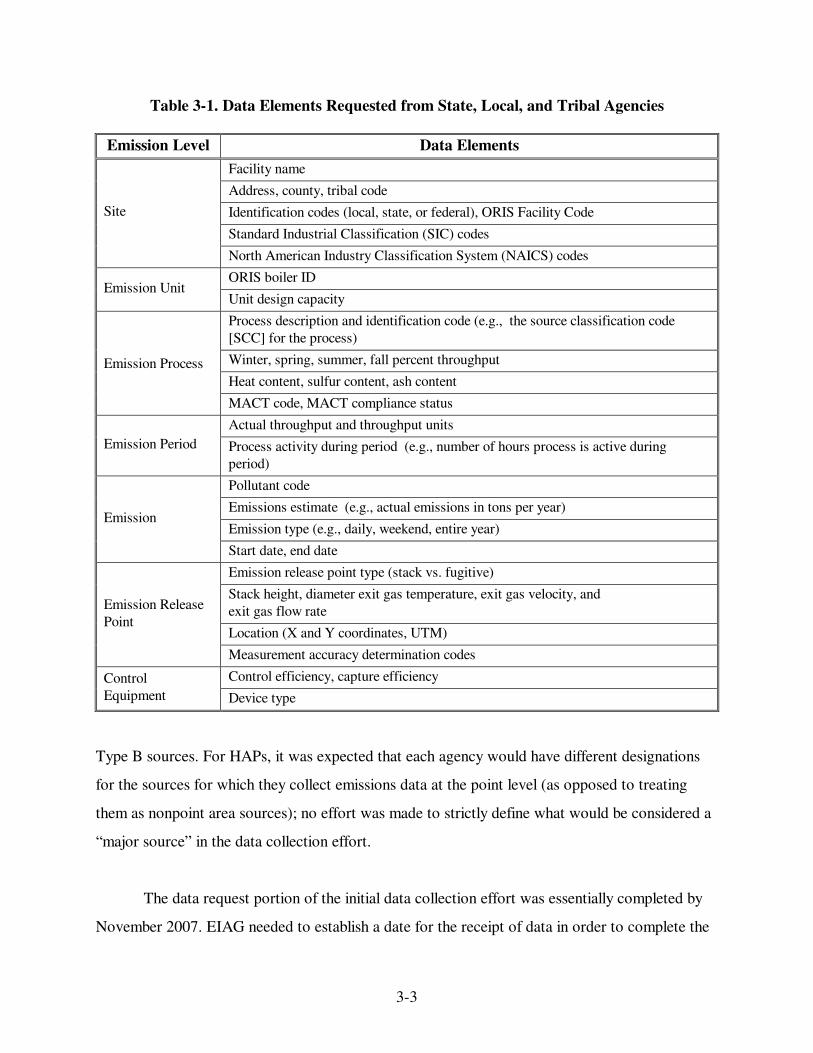
Table 3-1 summarizes the data elements that were targeted for the inventory request.
EIAG requested 2005 facility, unit, process, or stack-specific emissions data. No limits were set
on the type of source categories for which data would be collected. For CAPs, EIAG expected
that at a minimum the state would comply with the CERR reporting requirements for Type A and
3-3
Table 3-1. Data Elements Requested from State, Local, and Tribal Agencies
Emission Level Data Elements
Facility name
Address, county, tribal code
Identification codes (local, state, or federal), ORIS Facility Code
Standard Industrial Classification (SIC) codes
Site
North American Industry Classification System (NAICS) codes
ORIS boiler ID Emission Unit
Unit design capacity
Process description and identification code (e.g., the source classification code
[SCC] for the process)
Winter, spring, summer, fall percent throughput
Heat content, sulfur content, ash content
Emission Process
MACT code, MACT compliance status
Actual throughput and throughput units
Emission Period Process activity during period (e.g., number of hours process is active during
period)
Pollutant code
Emissions estimate (e.g., actual emissions in tons per year)
Emission type (e.g., daily, weekend, entire year) Emission
Start date, end date
Emission release point type (stack vs. fugitive)
Stack height, diameter exit gas temperature, exit gas velocity, and
exit gas flow rate
Location (X and Y coordinates, UTM)
Emission Release
Point
Measurement accuracy determination codes
Control efficiency, capture efficiency Control
Equipment Device type
Type B sources. For HAPs, it was expected that each agency would have different designations
for the sources for which they collect emissions data at the point level (as opposed to treating
them as nonpoint area sources); no effort was made to strictly define what would be considered a
“major source” in the data collection effort.
The data request portion of the initial data collection effort was essentially completed by
November 2007. EIAG needed to establish a date for the receipt of data in order to complete the

3-4
remaining tasks to develop the draft of the 2005 NEI. These tasks included processing the data
for upload to the NEI format, requesting and processing data from SPPD, supplementing with
EIAG-derived EGU data, supplementing with TRI data if gaps remained, and identifying duplicate
facilities between these the multiple data sources. Additionally, EPA planned to review and
augment missing, out-of-range, and bad geocoordinates and stack parameters; and augment
missing PM emissions.
3.2 Initial Data Received from State, Local, Tribal and Regional Agencies
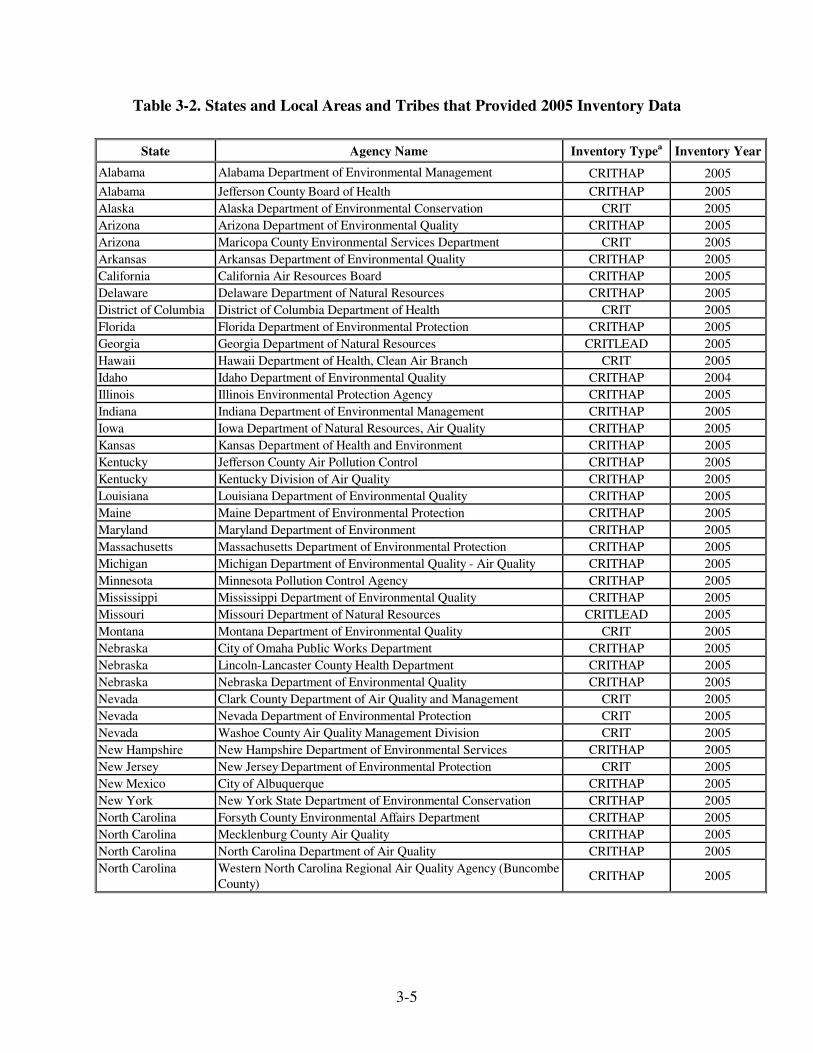
Table 3-2 lists the 70 agencies (in 46 states plus the District of Columbia and 4 tribes) for
which point source inventory data were initially obtained in 2007. In addition to state, local, and
tribal submittals, one Regional Planning Organization (RPO), the Western Regional Air
Partnership (WRAP), submitted data on behalf of four selected tribal entities in their region.
Filling data gaps and evaluating the quality of the data are addressed later in this process.
Appendix A provides detailed contact information and summary statistics for each state, local, and
tribal data submittal.
3.3 Data Provided By Trade Associations
No trade association submitted data specifically to EIAG for the 2005 NEI. However,
several trade associations submitted data and provided comment via EPA’s Risk and Technology
Review (RTR) process. This data set is addressed in Section 3.6 of this report.
3.4 EIAG Prepared 2005 Emissions from Electric Generating Units (EGUs)
EIAG prepared 2005 emissions data for EGUs using data obtained from the Department
of Energy’s (DOE) Energy Information Agency (EIA) and EPA’s Clean Air Markets Division
(CAMD) Emission Tracking System/Continuous Emissions Monitoring (ETS/CEM) data EGUs.
These data are included in the NEI along with state, local or tribal agency submitted emissions
data for EGU sources. See Section 3.9 for a detailed discussion on which estimates were selected
when multiple EGU estimates were available.
3-5
Table 3-2. States and Local Areas and Tribes that Provided 2005 Inventory Data
State Agency Name Inventory Typea Inventory Year
Alabama Alabama Department of Environmental Management CRITHAP 2005
Alabama Jefferson County Board of Health CRITHAP 2005
Alaska Alaska Department of Environmental Conservation CRIT 2005
Arizona Arizona Department of Environmental Quality CRITHAP 2005
Arizona Maricopa County Environmental Services Department CRIT 2005
Arkansas Arkansas Department of Environmental Quality CRITHAP 2005
California California Air Resources Board CRITHAP 2005
Delaware Delaware Department of Natural Resources CRITHAP 2005
District of Columbia District of Columbia Department of Health CRIT 2005
Florida Florida Department of Environmental Protection CRITHAP 2005
Georgia Georgia Department of Natural Resources CRITLEAD 2005
Hawaii Hawaii Department of Health, Clean Air Branch CRIT 2005
Idaho Idaho Department of Environmental Quality CRITHAP 2004
Illinois Illinois Environmental Protection Agency CRITHAP 2005
Indiana Indiana Department of Environmental Management CRITHAP 2005
Iowa Iowa Department of Natural Resources, Air Quality CRITHAP 2005
Kansas Kansas Department of Health and Environment CRITHAP 2005
Kentucky Jefferson County Air Pollution Control CRITHAP 2005
Kentucky Kentucky Division of Air Quality CRITHAP 2005
Louisiana Louisiana Department of Environmental Quality CRITHAP 2005
Maine Maine Department of Environmental Protection CRITHAP 2005
Maryland Maryland Department of Environment CRITHAP 2005
Massachusetts Massachusetts Department of Environmental Protection CRITHAP 2005
Michigan Michigan Department of Environmental Quality - Air Quality CRITHAP 2005
Minnesota Minnesota Pollution Control Agency CRITHAP 2005
Mississippi Mississippi Department of Environmental Quality CRITHAP 2005
Missouri Missouri Department of Natural Resources CRITLEAD 2005
Montana Montana Department of Environmental Quality CRIT 2005
Nebraska City of Omaha Public Works Department CRITHAP 2005
Nebraska Lincoln-Lancaster County Health Department CRITHAP 2005
Nebraska Nebraska Department of Environmental Quality CRITHAP 2005
Nevada Clark County Department of Air Quality and Management CRIT 2005
Nevada Nevada Department of Environmental Protection CRIT 2005
Nevada Washoe County Air Quality Management Division CRIT 2005
New Hampshire New Hampshire Department of Environmental Services CRITHAP 2005
New Jersey New Jersey Department of Environmental Protection CRIT 2005
New Mexico City of Albuquerque CRITHAP 2005
New York New York State Department of Environmental Conservation CRITHAP 2005
North Carolina Forsyth County Environmental Affairs Department CRITHAP 2005
North Carolina Mecklenburg County Air Quality CRITHAP 2005
North Carolina North Carolina Department of Air Quality CRITHAP 2005
North Carolina Western North Carolina Regional Air Quality Agency (Buncombe
County) CRITHAP 2005

3-6
Table 3-2. States and Local Areas and Tribes that Provided 2005 Inventory Data (Cont.)
State Agency Name Inventory Typea Inventory Year
Ohio Ohio Environmental Protection Agency CRITHAP 2005
Oklahoma Oklahoma Department of Environmental Quality CRITHAP 2005
Oregon Lane Regional Air Pollution Authority CRIT 2005
Oregon Oregon Department of Environmental Quality CRIT 2005
Pennsylvania Alleghany County Health Department CRITHAP 2005
Pennsylvania City of Philadelphia CRITHAP 2005
Pennsylvania Pennsylvania Department of Environmental Protection CRITHAP 2005
Puerto Rico Puerto Rico Environmental Quality Board CRIT 2005
Rhode Island Rhode Island Department of Environmental Management CRIT 2005
South Carolina South Carolina Department of Health and Environmental Control CRITHAP 2005
South Dakota South Dakota Department of Environment and Natural Resources CRIT 2005
Tennessee Chattanooga Hamilton County Air Pollution Control Bureau CRITHAP 2005
Tennessee Memphis and Shelby County Health Department CRITHAP 2005
Tennessee Metro Public Health Dept. Nashville/Davidson County CRITHAP 2005
Tennessee Tennessee Department of Environment and Conservation CRITHAP 2005
Texas Texas Commission on Environmental Quality CRITHAP 2005
Tribal Fort Peck Tribe CRITHAP 2005
Tribal Navajo Nation Environmental Protection Agency CRIT 2002
Tribal Sac and Fox Nation of Missouri CRIT 2005
Tribal Winnebago Tribe of Nebraska CRITHAP 2005
Utah Utah Division of Air Quality CRITHAP 2005
Vermont Vermont Department of Environmental Quality CRIT 2005
Virginia Virginia Department of Environmental Quality CRITHAP 2005
Washington Olympic Region Clean Air Agency CRITHAP 2005
Washington Puget Sound Clean Air Agency CRITHAP 2005
Washington Washington State Department of Ecology CRITHAP 2005
West Virginia West Virginia Division of Air Quality CRITHAP 2005
WRAP Arapahoe Tribe of the Wind River Reservation, Wyoming CRIT 2002
WRAP Confederated Tribes and Bands of the Yakama Nation,
Washington CRIT 2003
WRAP Confederated Tribes of the Colville Reservation, Washington CRIT 2003
WRAP Tohono O’Odham Nation of Arizona CRIT 2002 a Inventory Type Code Key:
CRIT - Data submittal contained CAP emissions only.
CRITHAP - Data submittal contained both CAP and HAP emissions.
CRITLEAD - Data submittal contained both CAP and lead emissions.
3-7
3.5 EIAG Requested SPPD Maximum Achievable Control Technology Inventory Data
and Facility Lists
State, local, and tribal databases represent the core of the point source inventory.
Inventory data were also requested from the EPA’s SPPD for MACT/residual risk source
categories. A list of MACT categories and their codes used in the NEI are in the lookup database.
While SPPD provided mostly HAP data, some MACT categories include CAP estimates as well.
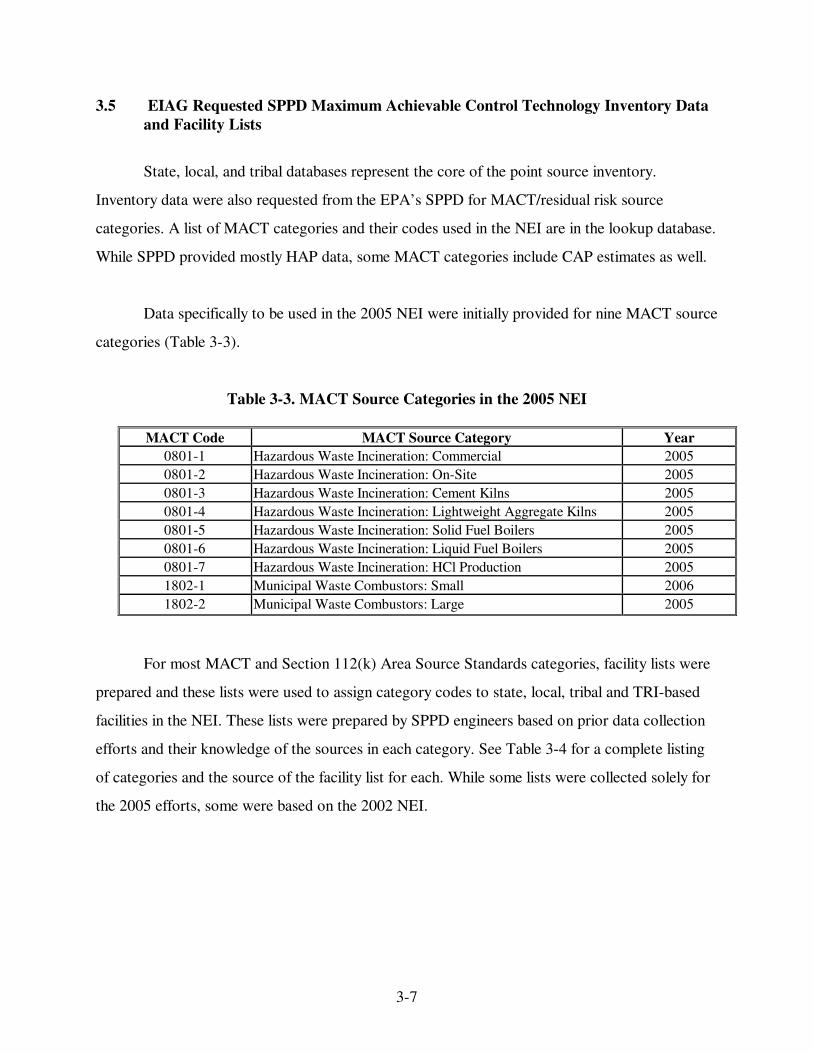
Data specifically to be used in the 2005 NEI were initially provided for nine MACT source
categories (Table 3-3).
Table 3-3. MACT Source Categories in the 2005 NEI
MACT Code MACT Source Category Year
0801-1 Hazardous Waste Incineration: Commercial 2005
0801-2 Hazardous Waste Incineration: On-Site 2005
0801-3 Hazardous Waste Incineration: Cement Kilns 2005
0801-4 Hazardous Waste Incineration: Lightweight Aggregate Kilns 2005
0801-5 Hazardous Waste Incineration: Solid Fuel Boilers 2005
0801-6 Hazardous Waste Incineration: Liquid Fuel Boilers 2005
0801-7 Hazardous Waste Incineration: HCl Production 2005
1802-1 Municipal Waste Combustors: Small 2006
1802-2 Municipal Waste Combustors: Large 2005
For most MACT and Section 112(k) Area Source Standards categories, facility lists were
prepared and these lists were used to assign category codes to state, local, tribal and TRI-based
facilities in the NEI. These lists were prepared by SPPD engineers based on prior data collection
efforts and their knowledge of the sources in each category. See Table 3-4 for a complete listing
of categories and the source of the facility list for each. While some lists were collected solely for
the 2005 efforts, some were based on the 2002 NEI.

3-8
Table 3-4. Facility Lists for MACT Categories
MACT
CODE MACT/Area Source Category Type
1001 Acrylic/Modacrylic Fibers Production MACT
0265 Chemical Manufacturing: Chromium Compounds Area
1314 Flexible Polyurethane Foam Fabrication Operations MACT
1461 Industrial Inorganic Chemical Manufacturing Area
0263 Lead Acid Battery Manufacturing Area
0460 Pressed and Blown Glass and Glassware Manufacturing Area
0203 Primary Copper Smelting MACT
0260 Secondary Nonferrous Metals Area
0364 Stainless and Nonstainless Steel Manufacturing: Electric Arc
Furnaces Area
0264 Wood Preserving Area
3.6 EIAG Requested SPPD’s RTR Data
Over the last two years, EPA has been actively engaged in its Risk and Technology
Review (RTR) Program. The RTR Program is a combined effort to evaluate both risk and
technology after the application of MACT standards, as required by the 1990 CAA Amendments.
The RTR program evaluates the effectiveness of technology-based standards, using cancer and
noncancer risk as metrics, and determines the need for implementing additional and/or more
stringent control requirements on specific source categories to reduce cancer and noncancer risk.
Version 3 of the 2002 NEI was the starting point for the RTR process that is used for conducting
the 8-year residual risk analysis for more than 50 source categories in the NESHAP program. Key
NEI data impacting the modeling results are: stack parameters, location coordinates, chromium
speciation, MACT code assignments, and emissions. During the review phase for categories listed
in the Advanced Notice of Public Rulemaking (ANPRM), state and local agencies, industry, and
EPA have the opportunity to provide extensive review on these key NEI data elements. The
revised emission estimates often reflected a more current base year, such as 2005, and the MACT
code assignments, stack parameters, and location coordinates often replaced surrogate values that
were in the 2002 NEI. These revised data sets were then incorporated in the 2005 NEI and can be
identified by the “R” data source code in the Emission record in the 2005 point sources NEI.
3-9
3.7 EIAG Requested MMS Gulf of Mexico Oil and Gas Platform Data
The U.S. Department of the Interior’s (DOI) Minerals Management Services (MMS)
prepared 2005 base year criteria pollutant emission estimates for nearly 1,600 oil and natural gas
platforms operating in the Gulf of Mexico. Oil and natural gas platforms contain a variety of
similar equipment, such as: boilers, engines, turbines, drilling rigs, vents, flares, and fugitive
components. Additionally, some platforms contain specialized equipment for processing; glycol
dehydrators and amine units. Activity data were collected via electronic surveys, and emission
estimates were calculated using EPA-approved emission factors and models. Platform emissions
data can be identified by the “G” data source code in the Emission record in the 2005 point source
NEI.
3.8 Supplementing with TRI Data
To assess the NEI for source category and facility coverage, TRI data were used (EPA,
2007). TRI is a publicly available EPA database that contains information on toxic chemical
releases reported annually by certain covered industry groups. This inventory was established
under the Emergency Planning and Community Right-to-Know Act of 1986 (EPCRA) and
expanded by the Pollution Prevention Act of 1990. The TRI contains both HAP and ammonia
emissions data, and is used in the NEI mainly to supplement reporting of these compounds. The
purpose of this TRI review was to determine if the tribal-, local-, state-, and SPPD-combined
databases (referred to hereafter as the NEI) needed to be supplemented with data for facilities that
reported to TRI, but were not included in the NEI for some reason. For facilities included in both
the NEI and TRI, it was assumed that the NEI data were more accurate and, thus, no revisions
were made for those facilities.
The TRI facilities missing from the NEI were identified through a process of elimination.
Facilities included in the NEI were matched against TRI-listed facilities using one or more of the
following parameters:
• TRI ID;
• County;

3-10
• Facility name;
• Facility address; and
• Latitude and longitude coordinates.
TRI data can be identified in the NEI by the “T” data source code in the Emission record.
3.9 Processing State, Local, and Tribal Agency, MACT, and Industry Data Sets
All data sets provided to EIAG were first formatted to be consistent with each other and
the NEI Input Format (NIF). Several processing and screening steps were initially performed on
each of the state, local, tribal, SPPD, TRI, and EGU databases as they were received. These steps
included:
• Logging each file as received and recording summary statistics on the file;
• Converting the files to NIF 3.0;
• Setting primary keys on each table;
• Removing duplicate records;
• Screening for records that contain CAPs, ammonia, or HAPs on the CAA list of 188;
• Correcting XY coordinate type;
• Adding state abbreviation based on FIPS code;
• Verifying/correcting control status;
• Assigning NEI Unique Site IDs (NTI_Site_ID) using the 2002 NEI;
• Correcting referential integrity violations;
• Checking/correcting miscellaneous data codes such as emission release point type,
emission type, and emission unit numerator; and
3-11
• Conducting quality control (QC) on latitudes/longitudes, stack parameters, and SCCs
and defaulting missing or bad data.
Each of the data sets were converted into a “one record per line” (ORL) format containing
all the NIF fields. Additionally, selected data descriptor fields, such as pollutant description and
HAP Category Name, were included in the ORL file.
3.10 Blending/Merging (aka Data Selection)
Each ORL file was then combined into a single master database, which was the starting
point for the blending and merging process. Because the NEI is composed of databases submitted
from multiple sources, there can be overlapping estimates from one or more of these sources.
Prior to any blend-merging, EPA must first match the facilities from the multiple data sources and
assign common IDs to facilities found in one or more dataset. The NEI blend-merge or data
selection process attempts to eliminate duplicates. It is important to note, however, that no
estimate is actually deleted from EPA’s “master” inventory. Estimates deemed as duplicative are
simply “unselected” and thus do not appear in any output or summary files. This method allows
EPA to track competing estimates, and refine its merging or data selection routine over time using
different rules of selection.
Facilities found in both the HAP and CAP inventories should share the same NEI Unique
Facility ID. It is important to note that data providers sometimes use different Site IDs for their
CAP and HAP inventories. In the NEI, these different Site IDs are retained; the common NEI
Unique Facility ID indicates that sites are at the same facility. When state, local and tribal data
submittals were received in June 2007, EPA compared facilities from these submittals to the 2002
NEI. When there was a name or local identifier match between the new data set and the
crosswalk, EPA verified that other information such as state, county, address, zip code, TRI ID
(or other type of ID), and latitude/longitude coordinates were identical. If so, both of the sites
received the corresponding NEI Unique Facility ID. Facilities not found in the crosswalk were
assigned a new NEI Unique Facility ID. More details on the NEI facility matching process can be

3-12
found in Pope et al., 2004. After NEI Unique Facility IDs were assigned, data selection took place
using a hierarchal approach. Two “selection” rounds were performed for applicable data sets.
In the first round, which is performed only for emission estimates for the matched
facilities, the selection routine looks only at the data and ranks the estimates. The highest ranked
estimate is selected from among the duplicates in the specified grouping. Selection passes are
made at two grouping levels:
• Facility (NEI Unique Facility ID), pollutant code, data source (ranked),
• Facility (NEI Unique Facility ID), HAP category (ranked), data source (ranked).
The hierarchy of the data sets are presented in Table 3-5.
Table 3-5. Data Hierarchy for 2005 NEI
Hierarchy Rank Code Definition
1 R RTR data
2 E-A “Preferred” EIAG Airports Data
3 E-E “Preferred” EIAG EGU Data
4 P APreferred@ SPPD Data
5 B Tribal Data
6 L Local Agency Data
7 S State Data
8 O Regional Planning Organization (RPO) Data
9 T 2005 TRI Data
10 N 2002 NEI Data
11 G Gulf of Mexico MMS Data
The second selection pass, therefore, looks for duplicative HAPs at the category level at a
facility, so that only one pollutant in a group is selected. Both pollutant specific and HAP
category selection passes are necessary, since the HAP category pass would deselect specific
pollutants in the same HAP category (e.g., chromium III vs. chromium VI). The results of both
passes are evaluated, and a final selection decision is made. Two passes are necessary, because if

3-13
the selection is confined to specific pollutant codes or CAS numbers, then pollutants with
different pollutant codes, where one is reported by CAS number and the other by HAP category,
could be retained and result in double counting. For example, pollutant code 195 (lead and
compounds) will not appear to duplicate pollutant code 7439921 (lead), and both pollutants will
get through the pollutant-specific selection pass.
The blend/merging process was as follows:
1. “Select” all RTR data.
2. “Select” Preferred EIAG Airports and EGU data. There should be no pollutant and
facility/unit/process overlaps with RTR data.
3. “Select” Preferred SPPD data. There was potential for pollutant and
facility/unit/process overlap with the RTR Portland Cement dataset and the Preferred
SPPD data for MACT 0801-3, Hazardous Waste Incineration: Cement Kilns.
4. “Select” Tribal Data. There was potential for pollutant and facility/unit/process
overlap with the Tribal data and the RTR, Airports, EGU, and Preferred SPPD
datasets. In those situations, the Tribal data were “unselected”.
5. “Select” Local Data. There was potential for pollutant and facility/unit/process overlap
with the Local data and the RTR, Airports, EGU, and Preferred SPPD datasets. In
those situations, the Local data were “unselected”.
6. “Select” State Data. There was potential for pollutant and facility/unit/process overlap
with the State data and the RTR, Airports, EGU, Preferred SPPD, Tribal, and Local
datasets. In those situations, the State data were “unselected”.
7. “Select” RPO Data. There was potential for pollutant and facility/unit/process overlap
with the RPO data and the RTR, EGU, Preferred SPPD, Tribal, Local, and State
datasets. In those situations, the RPO data were “unselected”.
8. “Select” 2005 TRI Data. There was potential for pollutant and facility/unit/process
overlap with the TRI data and all of the preceding data sets (RTR, EGU, Preferred
SPPD, Tribal, Local, State, and RPO). In those situations, the TRI data were
“unselected”.
9. “Select” 2002 NEI Data. There was potential for pollutant and facility/unit/process
overlap with the 2002 NEI data and all of the preceding data sets (RTR, EGU,
Preferred SPPD, Tribal, Local, State, RPO, and 2005 TRI). In those situations, the
2002 NEI data were “unselected”.

3-14
10. “Select” Gulf of Mexico Data. There was no potential for pollutant and
facility/unit/process overlap with any of the preceding data sets.
Prior to the solicitation of 2005 emissions data from state/local/tribal agencies, EPA
compiled a list of closed facilities post-2002 NEI using information from the respective agencies
through an earlier request, as well as reviewing operating permits and conducting Internet
searches. Facilities that were closed were removed from the “selected” 2005 emissions inventory.
Additionally, through work in the RTR Program, additional facility-, unit-, and process-level
emission records were removed to reflect a 2005 base year.
3.11 Particulate Matter Augmentation
After the “selected” 2005 emissions inventory was compiled, EPA reviewed the PM
emissions data for completeness. Ideally, five species of PM should be reported: PM10-Primary
(PM10-PRI), PM2.5-Primary (PM2.5-PRI), PM10-Filterable (PM10-FIL), PM2.5-Filterable
(PM2.5-FIL), and PM-Condensable (PM-CON). At the very least, PM10-PRI and PM2.5-PRI are
required as inputs for emissions modeling. As presented in Table 3-6, PM2.5-PRI records were
significantly less than PM10-PRI records.
Table 3-6. PM Species Record Count Prior to PM Augmentation Routine
Pollutant Record Count
PM-PRI 134,281
PM-CON 51,581
PM-FIL 24,664
PM10-PRI 248,335
PM10-FIL 88,112
PM2.5-PRI 167,747
PM2.5-FIL 75,965

3-15
To reconcile the differences in record counts for PM10-PRI and PM2.5-PRI, the PM
Augmentation routine was performed. The approach utilized was similar to the steps taken for the
2002 NEI, with slight modifications:
1. Step 1 – Create a PM data subset from the combined inventory.
2. Step 2 – For emission processes that reported only PM10-PRI and PM25-PRI, these
records were reviewed to ensure that PM10-PRI ≥ PM2.5-PRI. If not, then PM2.5-PRI
emissions were reset to equal PM10-PRI.
3. Step 3 – For emission processes that did not report PM10-PRI and PM2.5-PRI, but did
report PM10-FIL, PM2.5-FIL, and PM-CON…PM10-PRI and PM2.5-PRI were
calculated.
4. Step 4 – For remaining emission processes, uncontrolled emissions from controlled
emissions were calculated using the default control device percentage in the
PM-Calculator. No adjustments were made to the original uncontrolled emission
records.
5. Step 5 – Use the PM-Calculator to apply ratios between the reported PM species.
Although only one PM specie may have been reported, other PM-species may be
calculated using the PM-Calculator. This step required several iterations to capture the
various PM specie(s) combination(s).
Table 3-7 presents the PM augmentation codes assigned after running through Steps 4 and
5. A data record of “AUGPM10FIL” indicates that it was developed from the PM10-FIL emission
estimate using the PM Calculator.
Table 3-7. PM Augmentation Data Source Codes
Data Source Code Description
AUGPM10FIL PM specie used PM10-FIL as the starting point
AUGPM10PRI PM specie used PM10-PRI as the starting point
AUGPM25FIL PM specie used PM2.5-FIL as the starting point
AUGPM25PRI PM specie used PM2.5-PRI as the starting point
AUGPMCON PM specie used PM-CON as the starting point
AUGPMFIL PM specie used PM-FIL as the starting point
AUGPMPRI PM specie used PM-PRI as the starting point

3-16
6. Step 6 – Ensure that PM emission relationships are intact at the emission process-
level:
a. PM-PRI ≥ PM10-PRI ≥ PM2.5-PRI
b. PM-FIL ≥ PM10-FIL ≥ PM2.5-FIL
c. PM-PRI ≥ PM-FIL
d. PM10-PRI ≥ PM10-FIL
e. PM2.5-PRI ≥ PM2.5-FIL
f. PM-PRI = PM-FIL +PM-CON
g. PM10-PRI = PM10-FIL + PM-CON
h. PM2.5-PRI = PM2.5-FIL + PM-CON
Finally, Table 3-8 presents the distribution of the PM species after running the PM
Augmentation routine.
Table 3-8. PM Species Record Count After PM Augmentation Routine
Pollutant Record Count
PM-PRI 136,326
PM-CON 161,443
PM-FIL 33,819
PM10-PRI 291,935
PM10-FIL 167,539
PM2.5-PRI 279,386
PM2.5-FIL 166,085
3.12 Final QA Steps
After PM-augmentation was completed, a master NEI Output File (NOF) was generated
for the entire inventory. Several large-scale QA and record updates can be performed more
efficiently using the NOF format, such as:

3-17
1. Assignments of MACT information (MACT codes, MACT Flag, and MACT
Compliance Status);
2. Check and correct locational coordinates data (See Appendix B.1);
3. Check and correct stack parameters using the EPA’s Stack Parameters Routine (See
Appendix B.2);
4. Assignment of the Facility Category (major or area) in the Site table;
5. Standardization of facility information (address and IDs);
6. Miscellaneous Fixes:
a. Emission changes due to the lead NAAQS;
b. Control device changes due to EPA’s CoST work;
c. Additional state/local agency comments;
d. Additional closed facilities;
e. Populating null SCC, SIC, and NAICS codes; and
f. Updating outdated codes with valid codes.
3.13 Data Considerations
Although improvements and additional data have been incorporated in the 2005 point
sources NEI, there are a few data considerations that are presented below. They include:
• Missing States: Four states and 1 U.S. territory did not submit 2005 inventories;
• Missing Counties: Similarly, point sources from 111 U.S. counties and territories are
not represented from state/local submittals. It’s possible that these counties may not
actually contain significant point sources, and are represented in the Nonpoint Area
Sources portion of the NEI;
• Missing Pollutants: While CAPs were submitted for all submitted state, local, and
tribal agency data sets, over 20 data sets did not include HAP data;
• Unidentified Closed Facilities/Units: Although a number of closed facilities and units
were not included in the 2005 NEI, this does not likely account for all the closed
facilities and units that occurred prior to 2005; and
• Use of Defaults: Although the majority of the data in the 2005 NEI consists of actual
data, significant portions of the inventory data were the result of defaults.
3-18
3.14 Revisions Made Since October 2008
After delivery of the Version 2 NEI, a number of revisions and additional records were
submitted to EIAG for consideration. They include:
• Additional IPM Designations: EIAG Staff identified additional Integrated Planning
Model (IPM) units.
• Additional Facility Identification Reconciliation: These revisions include corrections to
facility names, addresses, and NEI Site IDs for approximately 100,000 facilities.
These revisions were made as identified by EPA staff throughout preparation of the
2005 NEI to reflect current facility owners, more accurate physical plant location
addresses, and refinements of the NEI Site IDs as duplicate facilities were identified.
• Additional NOF field: Closed Year was added to the Site table, primarily to provide
more information concerning the above landfill adjustments procedure. Additionally,
facilities identified as closed after 2005 can be useful for EIAG as they prepare a 2008
NEI.
• Additional PM Augmentation: Some newer datasets did not contain the full suite of
PM species, such that the PM augmentation routine was conducted a second time.
• Additional Pollutant Reconciliation: Pollutant overlaps (e.g., chromium compounds vs.
hexavalent chromium) were identified and corrected. Approximately 30,000 emission
records were deleted as a result of this exercise.
• Airports: EPA’s Office of Transportation and Air Quality (OTAQ) and EIAG staff
developed emission estimates for over 16,000 small airports around the country. The
lead estimates for larger airports were also updated.
• Area Sources Program Designations: Information from EPA’s Area Sources Program
were provided to EIAG, such as applicable facility industries (using SIC and NAICS)
and process-level descriptions. A review of the SCCs in the NEI yielded the
designation of process-level area source records.
• BART Identification: Where possible, facilities subject to EPA’s Best Available
Retrofit Technology (BART) program were identified using information developed
from the five RPOs across the country (WRAP, CENRAP, MRPO, VISTAS, and
MANE-VU). Information on BART units were developed from WRAP.
• Biorefinery Plant Designations: In the Site table, biorefinery plants were designated
accordingly in the Site Description field.

3-19
• Boiler HAP Augmentation: Boiler HAP emission estimates were generated for
emission processes in which an uncontrolled carbon monoxide (CO) emission estimate
was submitted for a natural gas, coal, or diesel-fired boiler (SCCs beginning with 1-02
and 1-03), but no HAP emissions were submitted. Using the CO emission factor
specific to the SCC code, activity-level data was calculated. This activity data was
applied to NEI emission factors for dozens of HAPs to generate HAP estimates for
approximately 567,000 emission records.
• Hazardous Waste Combustion Updates: Emission revisions for Hazardous Waste
Combustion sources were submitted by EPA’s Office of Resource Conservation and
Recovery.
• Landfills Emissions Adjustments: The majority of the landfill emission estimates in
Version 2 were carried-forward from the 1999 NEI. After discussion with EPA staff,
it was decided that the 1999 NEI estimates could be adjusted to reflect 2005
conditions if certain information about the landfill status can be known, such as closure
date. Because closed landfills can emit pollutants for up to 30 years after closure date,
a search of various EPA and state databases was performed to identify closed landfills
and the year closed. According to a standard landfill gas curve, a reduction in
emissions of 3% per year is reasonable after a landfill closes. In addition, EPA
maintains a detailed database of landfills in the U.S. that participate in their voluntary
Landfill Methane Outreach Program (LMOP) program. LMOP is a voluntary
assistance and partnership program that promotes the use of landfill gas as a
renewable, green energy source. On average, EPA estimates that a landfill that
participates in the LMOP program will have reduced their operational landfill
emissions by approximately 36.5%. As a result of this research, the following actions
were taken for the landfill (identified with MACT code 0802) emission estimates in the
2005 NEI:
1) Landfills closed prior to 1976 were removed from the inventory accordingly;
2) Emissions from landfills that closed after 1976, but before or in 1999, were
reduced 3% per year;
3) Emissions from landfills that closed after 1999, but before 2005 were reduced
3% per year starting with the closure year; and
4) Landfills closed after 2005 were not adjusted (unless they participate in the
LMOP program as discussed below).
5) Emissions from landfills participating in LMOP projects prior to or in 1999,
that were still active in 2005 were not adjusted;

3-20
6) Emissions from landfills participating in LMOP projects prior to or in 1999,
but were closed prior to 2005 were adjusted by 3% each year from the year of
closure;
7) Emissions from landfills participating in LMOP projects after 1999 and active
in 2005 were given a one-time 36.5% reduction in emissions for a 2005
estimate; and
8) Emissions from landfills participating in LMOP projects after 1999, but closed
prior to 2005 were given a one-time 36.5% reduction in emissions, and then a
3% reduction in emissions from the year after closure.
• Lead NAAQS: Since October 2008, EPA has been receiving comments on its
proposed Lead NAAQS standard. Comments included emission updates, coordinate
changes, and closed facilities. Approximately 8,000 emission records were revised.
• NATA Coordinates Review: Concurrent to the preparation of this version of the NEI
was the release of EPA’s 2002 NATA final results. A review of the 2002 NATA
results and model input data lead to the identification of a number of mislocated
latitude/longitude coordinates. For the most part, these corrections were made for
landfills. Approximately 7,000 emission release point revisions were made.
• RTR Updates: Through EPA’s RTR Program, SPPD staff provided numerous updates
to emission estimates, facility identifiers, process information (e.g., SCCs), and
coordinate/stack parameter data. These revisions were provided based on extensive
research by SPPD staff working with industry and state and local agency personnel to
best reflect the NEI data for specific MACT source categories. Approximately 48,000
emission records were revised.
• State/Files: Colorado submitted a 2005 CAP and HAP inventory (no data were
submitted initially for V2), while Maine, Minnesota, and Alabama sent wholesale
replacement records.
3.15 Revisions Made Since June 2009
Revisions submitted by states, local agencies, and EPA during the initial NATA review
period were processed for both high risk and non-high risk facilities. Additions were also provided
by SPPD based on continuing RTR assessments. The revisions include:
• NATA Revisions from States and Local Agencies: As a result of the initial NATA
review process, approximately 62 states and local agencies submitted emission,
locational, and stack parameter revisions, data for additional facilities, or identified
closed facilities. The revisions included revisions to SCCs, emission values, MACT

3-21
codes, stack parameters, latitude and longitude coordinates, location information
such as addresses, facility additions, and identification of closed facilities. Emissions
were adjusted for landfills with closure dates between 1976 and 2005 according to
the methodology described in Section 3.14 above.
• RTR Updates: Through EPA’s RTR program, revisions were provided for the
following source categories: printing and publishing, chromium electroplating,
shipbuilding, primary aluminum, pulp and paper, Portland cement, and marine vessel
loading. The revisions included facility-specific wholesale data set replacements,
adding additional facilities to the inventory, inclusion of "line sources," PM
augmentation for the revised pulp and paper facilities, and revisions to emissions,
latitude and longitude coordinates, stack parameters, MACT codes, SCCs, and
process descriptions.
• Removal of Aircraft Data: The base year 2005 aircraft data (for SCCs 2275* and
275*) were removed from this version of the point source inventory.
• Latitude/Longitude Coordinate Revisions from EPA: The Sector Based Assessment
Group (SBAG) and EIAG submitted latitude and longitude revisions for numerous
facilities that were deemed to be mis-located. Approximately 3,950 emission release
point revisions were made.
• Additional Revisions Based on QA/QC Activities: After the revisions summarized
above were incorporated into the inventory, additional QA/QC activities were
performed to identify and correct null or invalid codes, and to check the consistency
of the data. Examples of the types of consistency checks that were implemented
include comparison of the emission release point type to the stack parameters, and
comparison of facility category and MACT code to the MACT compliance status.
3.16 Revisions Made Since June 2010
Revisions submitted by states, local agencies, tribes and US EPA during the second review
period were processed for both high risk and non-high risk facilities. The revisions include:
• NATA Revisions from States and Local Agencies: Approximately 23 states and
local agencies submitted revisions, which included revisions to SCCs, emission
values, MACT codes, stack parameters, emission release point types, latitude and
longitude coordinates, facility categories, facility names, location addresses, and
tribal codes. The revisions also included facility additions and identification of closed
facilities. Emissions were adjusted for a landfill with a closure date of 2004
according to the methodology described in section 3.14 above.
• RTR Updates: EPA’s RTR Program received updates for the following source
categories: printing and publishing, chrome plating, shipbuilding, wood furniture,
3-22
polymers and resins group 1, marine vessel loading, steel pickling, and
pharmaceuticals production. The revisions included adding additional facilities to the
inventory, adding speciated HAP emissions based on VOC emissions, removing
closed facilities, and revisions to existing emission values, latitude and longitude,
stack parameters, and MACT code.
• NATA Revisions from US EPA: US EPA Region 2 submitted comments to revise
emissions to values from 2005 TRI for one facility.
• Additional QA: After the revisions above were incorporated in the inventory,
additional QA was performed to identify and correct null or invalid codes and to
check the consistency of the data. Examples of the types of consistency checks that
were done include comparison of the emission release point type to the stack
parameters, and comparison of facility category and MACT Code to the MACT
Compliance Status.
4-1
4.0 COMPILING THE INVENTORY DATA INTO THE NEI DATABASE
4.1 NIF 3.0 and EPA’s Data Standards
One of the goals of compiling the NEI was to process all the state, local, and tribal
agency, SPPD-supplied, TRI, and EGU inventory data into a common structure with consistently
defined data fields. A common data structure will help end users define standardized approaches
to reviewing and using the data. NIF version 3.0 as designed by EPA allows for a variety of data
transfer mechanisms to be used and is flexible enough to be supported by many different database
programs. More detailed information about the NIF can be found at
http//www.epa.gov/ttn/chief/nif/index.html.
The NIF 3.0 format conforms with EPA=s data standards for environmental information
collection and exchange. The data standards were developed by Environmental Data Standards
Council (EDSC)- sponsored action teams that include members representing states, tribes, and
federal agencies. All of these standards have been implemented in the draft 2005 NEI, as
described below.
4.1.1 SIC/NAICS Data Standard
This standard includes ways to classify business activities, including industry
classifications, product classifications, and product codes. The SIC System has been used for
many years to provide a code system for the identification of business activities. SIC codes are
gradually being replaced by the NAICS codes that were adopted by Canada, Mexico, and the
United States in 1997.
To populate the NAICS code field, a crosswalk of SIC codes to NAICS codes was
developed. Several different parties have already developed crosswalks. The maps that have been
built to date were evaluated to come up with a preferred scheme for the NEI. Where there was a
one-to-one correspondence between NAICS and SIC codes, the assignment was straightforward.
However, in those cases in which one SIC maps to many NAICS codes, the SIC code was

4-2
mapped to a less specific NAICS code (i.e., a 2, 3, or 4 digit code). For more information as to
how EIAG reviewed and defaulted this standard, see the NEI Quality Assurance and Data
Augmentation for Point Sources (U.S. EPA, 2005).
4.1.2 Latitude/Longitude Data Standard
The latitude/longitude standard consists of the group of data elements used for recording
horizontal and vertical coordinates and associated metadata that define a point on earth. This
standard will help users gauge the accuracy and reliability of a given set of coordinates. The
primary responsibility for populating these fields lies with the data submitter, as it is difficult if not
impossible to discern the origin of a latitude/longitude without being the primary author of the
data. EIAG was able to populate these fields whenever latitude/longitudes were obtained from the
TeleAtlas Geocoding EZ Locator Service (http://geocode.com). For more information as to how
EIAG reviewed and defaulted this standard, see the NEI Quality Assurance and Data
Augmentation for Point Sources (U.S. EPA, 2005).
4.1.3 Chemical Identification Data Standard
The Chemical Identification Data Standard provides for the use of common identifiers
throughout the EPA for all chemical substances regulated or monitored by EPA environmental
programs. This standard provides unique, unambiguous, chemically correct common names for all
chemicals substances and groupings in EPA’s system, and will facilitate automated searches for
chemical substances across EPA programs and their databases. EIAG has posted a Chemical
Identification pollutant code lookup table that addresses this standard.
4.1.4 Facility Identification Data Standard
The facility identification data standard consists of core data elements that properly
identify the location, the affiliated organizations, individual business activities, and the
environmental interest of a facility site. To implement this standard, EIAG mapped the NEI
facilities to the FRS (Federal Registry System) ID maintained by OEI. The FRS ID is found in the
NOF files in the strFacilityRegistryIdentifier field and in the 2005 NEI Facility File.

4-3
4.1.5 Contact Standards
The contact standards provide a consistent method of describing the contact person
submitting data to the NEI. These standards include point of contact, address, and communication
information. All of these elements are found in the Transmittals table in the NIF structure.
4.2 NOF 3.0 and Data Standards
EPA distributes data in the NOF version 3.0. NOF contains the data standards listed above
as well as other data elements that help users understand the origin of the data.

5-1
5.0 REFERENCES
Pope, A., S. Finn, and D. Wilson. 2004. 2002 NEI for Point Sources: Integration of HAPs and
CAPs. Presented at the 13th International Emission Inventory Conference AWorking for Clean Air
in Clearwater.@ June 8-10, Clearwater, Florida.
U.S. Environmental Protection Agency. 2005. NEI Quality Assurance and Data Augmentation for
Point Sources. U.S. Environmental Protection Agency, Emissions Monitoring and Analysis
Division, Emission Inventory and Analysis Group, Research Triangle Park, North Carolina.
U.S. Environmental Protection Agency. 2007. 2005 Toxics Release Inventory, Public Data
Release. U.S. Environmental Protection Agency, Office of Environmental Information,
Washington, DC.

Appendix A
State, Local, and Tribal Database Summary Tables
for the 2005 Point Source NEI

A-1
Table A-1. State, Local, and Tribal Agency Contacts
State Agency Name Contact Name Contact E-Mail Address
Alabama
Alabama Department of Environmental
Management Lisa B. Cole [email protected]
Alabama Jefferson County Board of Health James E Wright [email protected]
Alaska
Alaska Department of Environmental
Conservation Kent Thomas [email protected]
Arizona
Arizona Department of Environmental
Quality Latha Toopal [email protected]
Arizona
Maricopa County Environmental Services
Department Bob Downing [email protected]
Arkansas
Arkansas Department of Environmental
Quality Evelyn M. Withers [email protected]
California California Air Resources Board Chris Nguyen [email protected]
Colorado1
Colorado Department of Public Health and
Environment David Thayer [email protected]
Delaware Delaware Department of Natural Resources John Outten [email protected]
District of Columbia District of Columbia Department of Health Deirdre Elvis-Peterson [email protected]
Florida
Florida Department of Environmental
Protection Yi Zhu [email protected]
Georgia Georgia Department of Natural Resources Byeong-Uk Kim [email protected]
Hawaii
Hawaii Department of Health, Clean Air
Branch Scott Takamoto [email protected]
Idaho
Idaho Department of Environmental
Quality Gary Reinbold [email protected]
Illinois Illinois Environmental Protection Agency Buzz Asselmeier [email protected]
Indiana
Indiana Department of Environmental
Management Jay Koch [email protected]
Iowa
Iowa Department of Natural Resources, Air
Quality Marnie Stein [email protected]

A-2
Table A-1. State, Local, and Tribal Agency Contacts (Cont.)
State Agency Name Contact Name Contact E-Mail Address
Kansas
Kansas Department of Health and
Environment Andy Hawkins [email protected]
Kentucky Jefferson County Air Pollution Control Marty Layman [email protected]
Kentucky Kentucky Division of Air Quality Andrea Smith [email protected]
Louisiana
Louisiana Department of Environmental
Quality Jackie Heber [email protected]
Maine
Maine Department of Environmental
Protection Richard T. Greves [email protected]
Maryland Maryland Department of Environment Roger Thunell [email protected]
Massachusetts
Massachusetts Department of
Environmental Protection Richard Hawkins [email protected]
Michigan
Michigan Department of Environmental
Quality - Air Quality Alan Ostrander [email protected]
Minnesota Minnesota Pollution Control Agency Chun Yi Wu [email protected]
Mississippi
Mississippi Department of Environmental
Quality Susan L. Holden [email protected]
Missouri Missouri Department of Natural Resources Patricia A. Tighe [email protected]
Montana
Montana Department of Environmental
Quality Debbie Linkenbach [email protected]
Nebraska City of Omaha Public Works Department Tim E. Burns [email protected]
Nebraska
Lincoln-Lancaster County Health
Department Gary R. Bergstrom, Jr. [email protected]
Nebraska
Nebraska Department of Environmental
Quality Dennis Burling [email protected]
Nevada
Clark County Department of Air Quality
and Management Zheng Li [email protected]
Nevada
Nevada Department of Environmental
Protection Corey Lynn Kern [email protected]
Nevada
Washoe County Air Quality Management
Division Yann Ling [email protected]
A-3
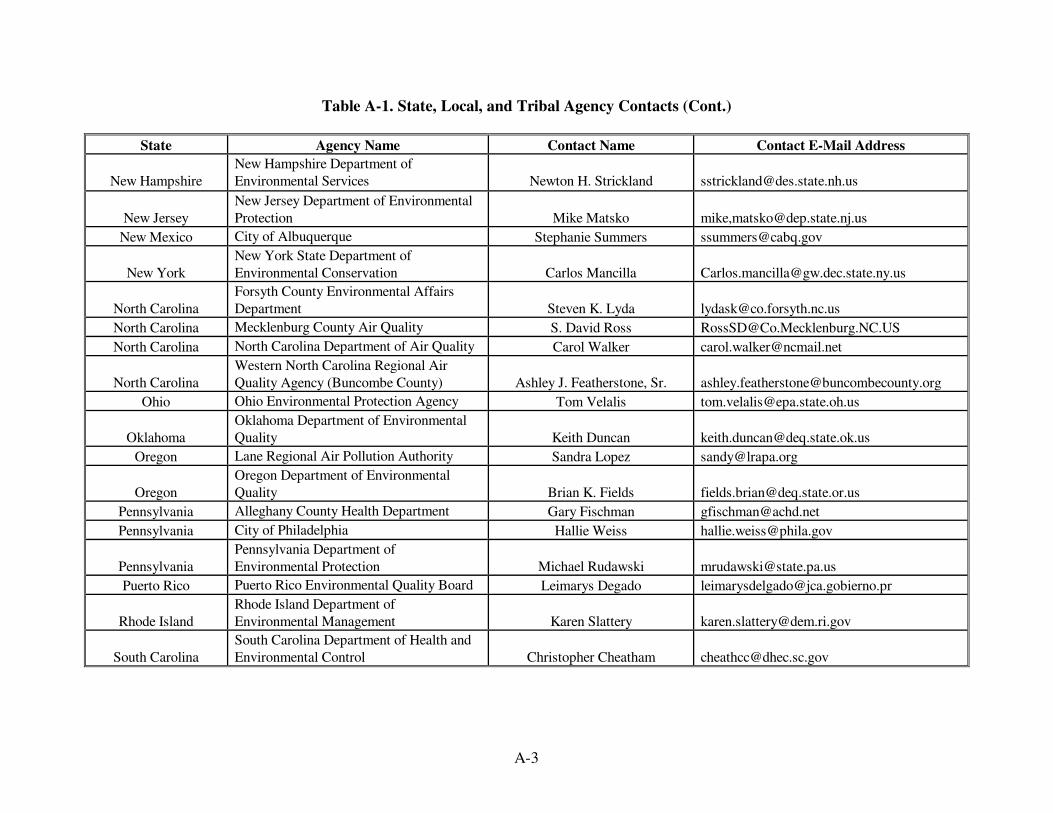
Table A-1. State, Local, and Tribal Agency Contacts (Cont.)
State Agency Name Contact Name Contact E-Mail Address
New Hampshire
New Hampshire Department of
Environmental Services Newton H. Strickland [email protected]
New Jersey
New Jersey Department of Environmental
Protection Mike Matsko mike,[email protected]
New Mexico City of Albuquerque Stephanie Summers [email protected]
New York
New York State Department of
Environmental Conservation Carlos Mancilla [email protected]
North Carolina
Forsyth County Environmental Affairs
Department Steven K. Lyda [email protected]
North Carolina Mecklenburg County Air Quality S. David Ross [email protected]
North Carolina North Carolina Department of Air Quality Carol Walker [email protected]
North Carolina
Western North Carolina Regional Air
Quality Agency (Buncombe County) Ashley J. Featherstone, Sr. [email protected]
Ohio Ohio Environmental Protection Agency Tom Velalis [email protected]
Oklahoma
Oklahoma Department of Environmental
Quality Keith Duncan [email protected]
Oregon Lane Regional Air Pollution Authority Sandra Lopez [email protected]
Oregon
Oregon Department of Environmental
Quality Brian K. Fields [email protected]
Pennsylvania Alleghany County Health Department Gary Fischman [email protected]
Pennsylvania City of Philadelphia Hallie Weiss [email protected]
Pennsylvania
Pennsylvania Department of
Environmental Protection Michael Rudawski [email protected]
Puerto Rico Puerto Rico Environmental Quality Board Leimarys Degado [email protected]
Rhode Island
Rhode Island Department of
Environmental Management Karen Slattery [email protected]
South Carolina
South Carolina Department of Health and
Environmental Control Christopher Cheatham [email protected]

A-4
Table A-1. State, Local, and Tribal Agency Contacts (Cont.)
State Agency Name Contact Name Contact E-Mail Address
South Dakota
South Dakota Department of Environment
and Natural Resources Stacy Froelich [email protected]
Tennessee
Chattanooga Hamilton County Air
Pollution Control Bureau Cynthia McDaniel [email protected]
Tennessee
Memphis and Shelby County Health
Department Christopher Boyd [email protected]
Tennessee
Metro Public Health Dept.
Nashville/Davidson County Fred Huggins [email protected]
Tennessee
Tennessee Department of Environment and
Conservation James Redus [email protected]
Texas
Texas Commission on Environmental
Quality Becky Kurka [email protected]
Tribal Fort Peck Tribe Angelique Luedeker [email protected]
Tribal
Navajo Nation Environmental Protection
Agency Deb S. Misra [email protected]
Tribal Sac and Fox Nation of Missouri Sarah Kelly [email protected]
Tribal Winnebago Tribe of Nebraska Angelique Ludeker [email protected]
Utah Utah Division of Air Quality Carol A. Nielsen [email protected]
Vermont
Vermont Department of Environmental
Quality Jeff Merrell [email protected]
Virginia
Virginia Department of Environmental
Quality Thomas C. Foster [email protected]
Washington Olympic Region Clean Air Agency Jim Wilson [email protected]
Washington Puget Sound Clean Air Agency Steve Van Slyke [email protected]
Washington Washington State Department of Ecology Sally A. Otterson [email protected]
West Virginia West Virginia Division of Air Quality David Porter [email protected]
Wisconsin
Wisconsin Department of Natural
Resources Ralph C. Patterson [email protected]
WRAP Western Regional Air Partnership Tom Moore [email protected] 1 Submitted complete inventory post NEI Version 2

A-5
Table A-2. Summary of State/Local/Tribal 2005 Point Source Data Submittals (June 2007)a
State Name
State
FIPS
File
Typeb
Total
Number
Counties
in State
County Count in
Submittal HAP Count
CAP
Count Emissions
AK Alaska 02 S 27 23 0 7 11,080
AL The County of Jefferson, Alabama 01 L 1 1 46 8 4,040
AL Alabama 01 S 67 61 129 8 29,800
AR Arkansas 05 S 75 58 227 8 22,794
AZ The County of Maricopa, Arizona 04 L 1 1 0 7 7,254
AZ Arizona 04 S 15 12 108 6 4,933
CA California 06 S 58 57 199 8 563,615
DC District of Columbia 11 S 1 1 0 12 507
DE Delaware 10 S 3 3 86 10 33,143
FL Florida 12 S 67 64 117 7 30,929
GA Georgia 13 S 159 84 1 9 13,268
HI Hawaii 15 S 5 4 0 12 4,149
IA Iowa 19 S 99 78 124 9 126,374
ID Idaho 16 S 44 7 12 11 797
IL Illinois 17 S 102 101 167 8 258,716
IN Indiana 18 S 92 85 132 10 46,058
KS Kansas 20 S 105 97 128 8 24,591
KY Kentucky 21 S 120 117 142 7 94,848
KY The County of Jefferson, Kentucky 21 L 1 1 90 8 3331
LA Louisiana 22 S 64 60 135 7 112,555
MA Massachusetts 25 S 14 14 67 10 55,333
MD Maryland 24 S 24 24 66 7 52,952
ME Maine 23 S 16 15 146 7 54,791
MI Michigan 26 S 83 83 146 9 258,267
MN Minnesota 27 S 87 87 199 8 162,057
MO Missouri 29 S 115 47 1 7 9,153
MS Mississippi 28 S 82 72 180 8 23,886
MT Montana 30 S 56 47 9 7 14,307
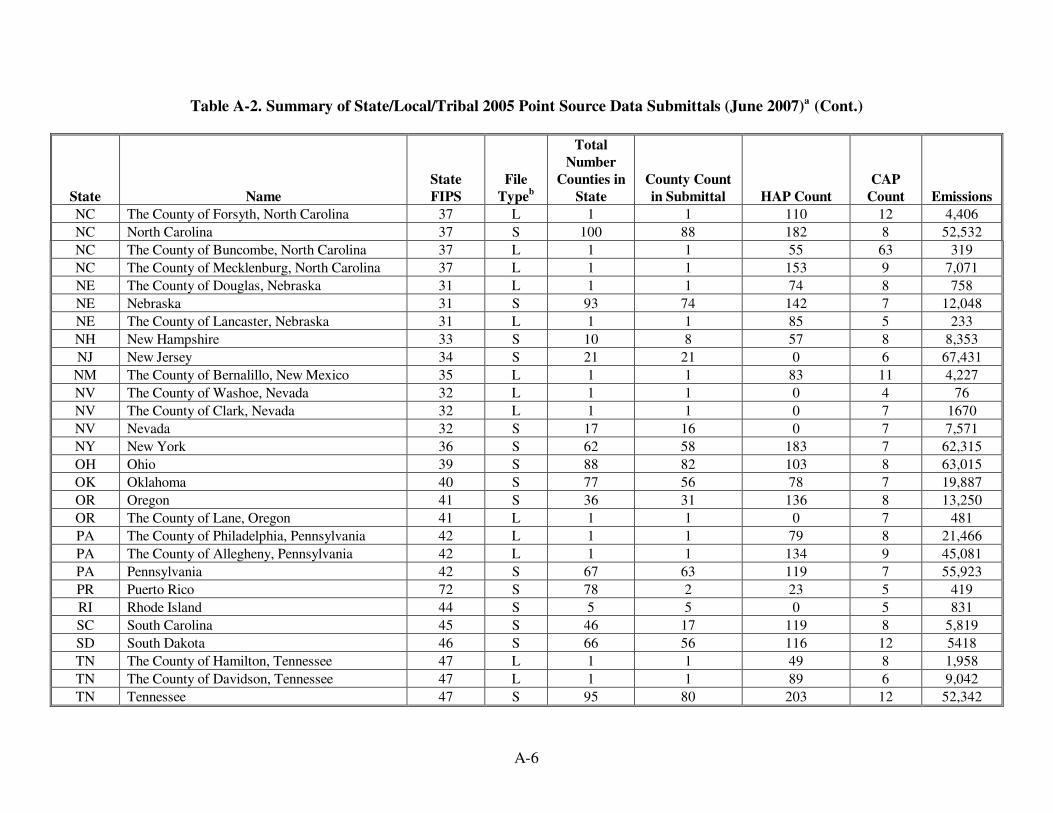
A-6
Table A-2. Summary of State/Local/Tribal 2005 Point Source Data Submittals (June 2007)a
(Cont.)
State Name
State
FIPS
File
Typeb
Total
Number
Counties in
State
County Count
in Submittal HAP Count
CAP
Count Emissions
NC The County of Forsyth, North Carolina 37 L 1 1 110 12 4,406
NC North Carolina 37 S 100 88 182 8 52,532
NC The County of Buncombe, North Carolina 37 L 1 1 55 63 319
NC The County of Mecklenburg, North Carolina 37 L 1 1 153 9 7,071
NE The County of Douglas, Nebraska 31 L 1 1 74 8 758
NE Nebraska 31 S 93 74 142 7 12,048
NE The County of Lancaster, Nebraska 31 L 1 1 85 5 233
NH New Hampshire 33 S 10 8 57 8 8,353
NJ New Jersey 34 S 21 21 0 6 67,431
NM The County of Bernalillo, New Mexico 35 L 1 1 83 11 4,227
NV The County of Washoe, Nevada 32 L 1 1 0 4 76
NV The County of Clark, Nevada 32 L 1 1 0 7 1670
NV Nevada 32 S 17 16 0 7 7,571
NY New York 36 S 62 58 183 7 62,315
OH Ohio 39 S 88 82 103 8 63,015
OK Oklahoma 40 S 77 56 78 7 19,887
OR Oregon 41 S 36 31 136 8 13,250
OR The County of Lane, Oregon 41 L 1 1 0 7 481
PA The County of Philadelphia, Pennsylvania 42 L 1 1 79 8 21,466
PA The County of Allegheny, Pennsylvania 42 L 1 1 134 9 45,081
PA Pennsylvania 42 S 67 63 119 7 55,923
PR Puerto Rico 72 S 78 2 23 5 419
RI Rhode Island 44 S 5 5 0 5 831
SC South Carolina 45 S 46 17 119 8 5,819
SD South Dakota 46 S 66 56 116 12 5418
TN The County of Hamilton, Tennessee 47 L 1 1 49 8 1,958
TN The County of Davidson, Tennessee 47 L 1 1 89 6 9,042
TN Tennessee 47 S 95 80 203 12 52,342

A-7
Table A-2. Summary of State/Local/Tribal 2005 Point Source Data Submittals (June 2007)a (Cont.)
State Name
State
FIPS
File
Typeb
Total
Number
Counties in
State
County Count
in Submittal HAP Count
CAP
Count Emissions
TN The County of Shelby, Tennessee 47 L 1 1 106 12 4,918
TR Fort Peck Tribe 0 B NA NA 33 10 393
TR Navajo Nation Environmental Protection Agency 0 B NA NA 13 11 859
TR Sac and Fox Nation of Missouri 0 B NA NA 0 6 18
TR Winnebago Tribe of Nebraska 0 B NA NA 8 6 15
TX Texas 48 S 254 199 225 7 784,610
UT Utah 49 S 29 20 19 7 12,082
VA Virginia 51 S 134 118 121 7 59,401
VT Vermont 50 S 14 13 0 5 1,370
WA Submitted by Olympic Region Clean Air Agency:
WA The County of Mason, Washington 53 L 1 1 20 7 83
WA The County of Clallam, Washington 53 L 1 1 24 7 135
WA The County of Grays Harbor, Washington 53 L 1 1 28 8 267
WA The County of Thurston, Washington 53 L 1 1 7 7 56
WA The County of Pacific, Washington 53 L 1 1 14 7 34
WA Submitted by Puget Sound Clean Air Agency:
WA The County of King, Washington 53 L 1 1 33 7 268
WA The County of Pierce, Washington 53 L 1 1 16 7 187
WA The County of Kitsap, Washington 53 L 1 1 92 5 307
WA The County of Snohomish, Washington 53 L 1 1 90 6 437
WA Washington 53 S 39 20 142 7 8271
WI Wisconsin 55 S 72 70 117 6 48,211
WV West Virginia 54 S 55 46 182 12 37,960 a These counts reflect adjustments for duplicates, non-HAPs and CAPs, and referential integrity errors.
b L = Local Agency Submittal
S = State Agency Submittal
B= Tribal Submittal

Appendix B
Quality Control Reports
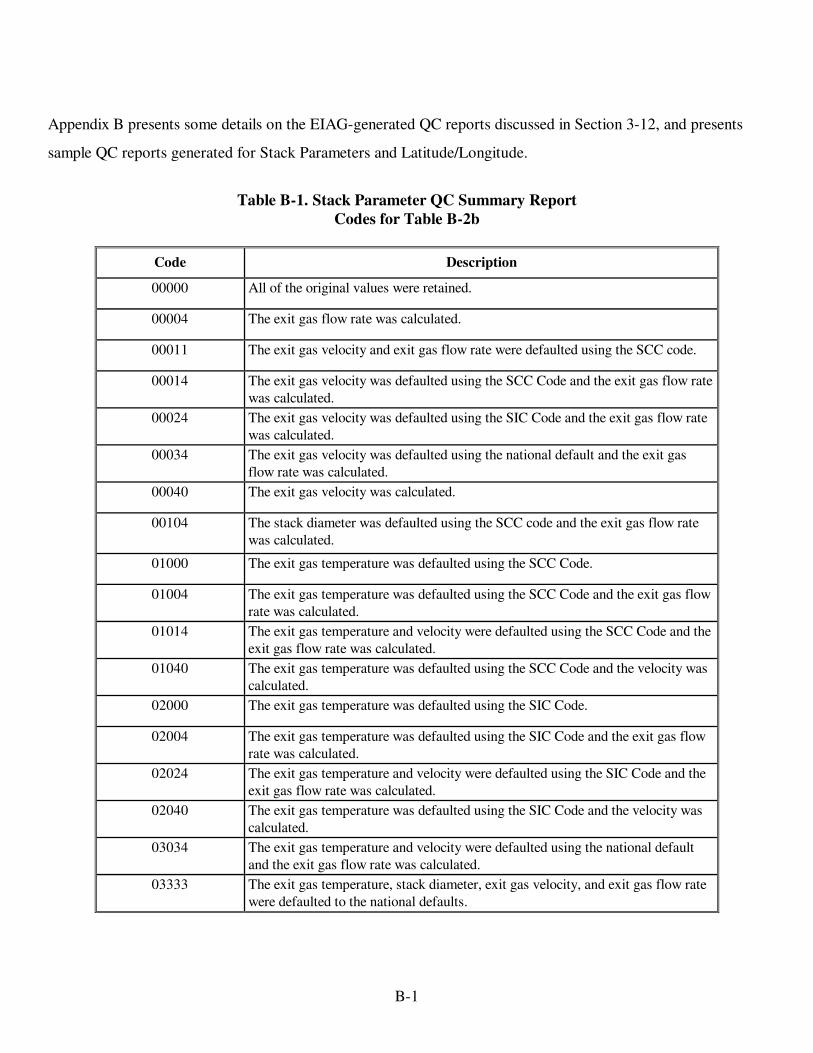
B-1
Appendix B presents some details on the EIAG-generated QC reports discussed in Section 3-12, and presents
sample QC reports generated for Stack Parameters and Latitude/Longitude.
Table B-1. Stack Parameter QC Summary Report
Codes for Table B-2b
Code
Description
00000 All of the original values were retained.
00004 The exit gas flow rate was calculated.
00011 The exit gas velocity and exit gas flow rate were defaulted using the SCC code.
00014 The exit gas velocity was defaulted using the SCC Code and the exit gas flow rate
was calculated.
00024 The exit gas velocity was defaulted using the SIC Code and the exit gas flow rate
was calculated.
00034 The exit gas velocity was defaulted using the national default and the exit gas
flow rate was calculated.
00040 The exit gas velocity was calculated.
00104 The stack diameter was defaulted using the SCC code and the exit gas flow rate
was calculated.
01000 The exit gas temperature was defaulted using the SCC Code.
01004 The exit gas temperature was defaulted using the SCC Code and the exit gas flow
rate was calculated.
01014 The exit gas temperature and velocity were defaulted using the SCC Code and the
exit gas flow rate was calculated.
01040 The exit gas temperature was defaulted using the SCC Code and the velocity was
calculated.
02000 The exit gas temperature was defaulted using the SIC Code.
02004 The exit gas temperature was defaulted using the SIC Code and the exit gas flow
rate was calculated.
02024 The exit gas temperature and velocity were defaulted using the SIC Code and the
exit gas flow rate was calculated.
02040 The exit gas temperature was defaulted using the SIC Code and the velocity was
calculated.
03034 The exit gas temperature and velocity were defaulted using the national default
and the exit gas flow rate was calculated.
03333 The exit gas temperature, stack diameter, exit gas velocity, and exit gas flow rate
were defaulted to the national defaults.
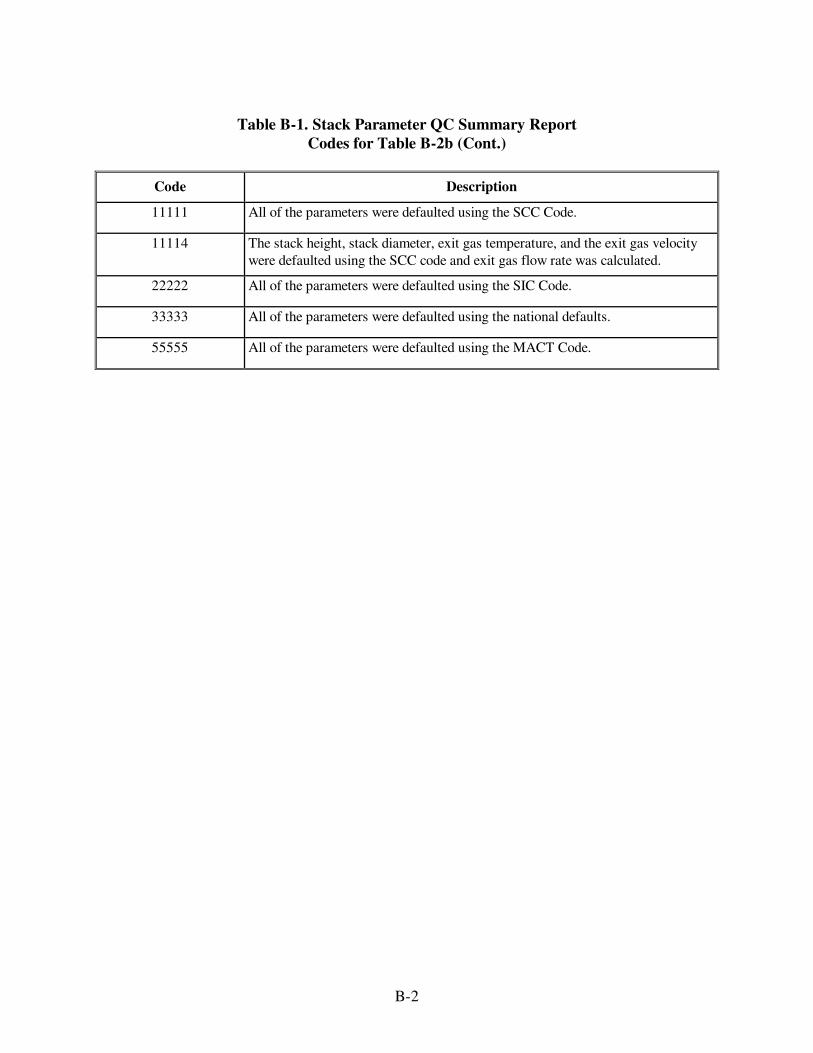
B-2
Table B-1. Stack Parameter QC Summary Report
Codes for Table B-2b (Cont.)
Code
Description
11111 All of the parameters were defaulted using the SCC Code.
11114 The stack height, stack diameter, exit gas temperature, and the exit gas velocity
were defaulted using the SCC code and exit gas flow rate was calculated.
22222 All of the parameters were defaulted using the SIC Code.
33333 All of the parameters were defaulted using the national defaults.
55555 All of the parameters were defaulted using the MACT Code.

B-3
Table B-2a. Count of Locational Coordinate Changes by State and Default Type
Tribal
Code
State
FIPS State Name
Total
Coordinates
QA’ed Null
GIS
Matched
Address
GIS
Matched
Street
Site
Average
County-
Centroid 2002NEI
RTR-
Revisions
Zipcode2-
Centroid
Zipcode3-
Centroid
Zipcode4-
Centroid
Zipcode5-
Centroid
000 01 Alabama 3,642 3,603 5 1 7 2 24
000 02 Alaska 1,757 1,613 3 80 45 14 2
000 04 Arizona 988 950 1 36 1
000 05 Arkansas 2,990 2,231 370 55 7 16 311
000 06 California 42,691 11,792 15,404 179 9,186 667 2,606 4 12 2,841
000 10 Delaware 958 952 6
000 11
District of
Columbia 26 21 5
000 12 Florida 3,496 3,454 23 19
000 13 Georgia 2,174 2,168 6
000 15 Hawaii 326 325 1
000 16 Idaho 168 158 10
000 17 Illinois 23,380 23,380
000 18 Indiana 4,955 4,496 386 5 31 1 2 34
000 19 Iowa 6,449 6,447 2
000 20 Kansas 3,355 3,353 1 1
000 21 Kentucky 12,861 12,841 16 4
000 22 Louisiana 11,342 9,816 168 1,358
000 23 Maine 575 573 2
000 24 Maryland 2,159 2,159
000 25 Massachusetts 3,787 3,706 74 1 6
000 26 Michigan 4,324 4,280 14 28 2
000 27 Minnesota 8,135 8,040 58 2 1 34
000 28 Mississippi 2,247 2,244 3
000 29 Missouri 2,101 2,073 28
000 30 Montana 508 272 85 17 134
000 31 Nebraska 497 416 36 1 5 4 5 1 29
000 32 Nevada 3,327 2,207 433 686 1
000 33 New Hampshire 157 157

B-4
Table B-2a. Count of Locational Coordinate Changes by State and Default Type (Cont.)
Tribal
Code
State
FIPS State Name
Total
Coordinates
QA’ed Null
GIS
Matched
Address
GIS
Matched
Street
Site
Average
County-
Centroid 2002NEI
RTR-
Revisions
Zipcode2-
Centroid
Zipcode3-
Centroid
Zipcode4-
Centroid
Zipcode5-
Centroid
000 34 New Jersey 9,190 9,190
000 35 New Mexico 492 446 46
000 36 New York 2,226 2,207 19
000 37 North Carolina 5,958 5,954 2 2
000 39 Ohio 6,676 5,233 1,048 220 34 141
000 40 Oklahoma 3,670 3,442 10 218
000 41 Oregon 355 318 32 2 3
000 42 Pennsylvania 9,605 9,597 7 1
000 44 Rhode Island 242 159 49 1 22 11
000 45 South Carolina 241 211 16 14
000 46 South Dakota 209 145 2 62
000 47 Tennessee 6,342 6,076 65 199 2
000 48 Texas 46,507 38,899 1,169 133 431 61 5,814
000 49 Utah 2,528 2,528
000 50 Vermont 85 85
000 51 Virginia 3,288 2,412 545 239 2 5 85

B-5
Table B-2b. Count of Emissions Release Point Changes by State and Default Type
State
FIPS State Name
Tribal
Code
Total Stack
Parameters
QA’ed 00000 00004 00011 00014 00024 00034 00040 00104 01000 01004 01014
01 Alabama 000 3,642 2,936 60 6 6 23 2 6
02 Alaska 000 1,757 369 313 82 10 66 53 30 111
04 Arizona 000 988 591 17 24 2 4 5 36
05 Arkansas 000 2,990 57 1,366 275 12 1 42 36
06 California 000 42,691 4,936 236 110 3 134 33 49 322
09 Connecticut 000 2 2
10 Delaware 000 958 461 15 3 11 1 1
11
District of
Columbia 000 26 19
12 Florida 000 3,496 1,633 24 223 5 14 85 3 346
13 Georgia 000 2,174 1,859 8 17
15 Hawaii 000 326 119 1 2
16 Idaho 000 168 123
17 Illinois 000 23,380 21,649 16 2 1 130 9
18 Indiana 000 4,955 325 24 26 2 12 32
19 Iowa 000 6,449 216 1,317 164 3 137 25 33
20 Kansas 000 3,355 246 877 8 4 10 3
21 Kentucky 000 12,861 4,207 886 298 40 102 150 20 27
22 Louisiana 000 11,342 2,210 1,557 8 982 52 77 8
23 Maine 000 575 227 115 1 4 82
24 Maryland 000 2,159 1,124 1 1 6 2
25 Massachusetts 000 3,787 13 851 184 1 31 18
26 Michigan 000 4,324 2,238 39 133 9 127 5 57
27 Minnesota 000 8,135 113 8 35 12 2,591 7 71
28 Mississippi 000 2,247 1,678 106 8 19 232
29 Missouri 000 2,101 573 253 91 15 10 11 58
30 Montana 000 508 98 59 7 1 2 1 33
31 Nebraska 000 497 21 9 3 2 2
32 Nevada 000 3,327 355 156 1 5

B-6
Table B-2b. Count of Emissions Release Point Changes by State and Default Type (Cont.)
State
FIPS State Name
Tribal
Code
Total Stack
Parameters
QA’ed 00000 00004 00011 00014 00024 00034 00040 00104 01000 01004 01014
33 New Hampshire 000 157 98 1 2
34 New Jersey 000 9,190 27 1 291 64 3,928 644
35 New Mexico 000 492 195 55 2 15 5 3
36 New York 000 2,226 1,335 113 69 7 27 23 7 396
37 North Carolina 000 5,958 3,484 19 10 6 2 62 1 7
39 Ohio 000 6,676 3,592 400 1 108 140
40 Oklahoma 000 3,670 1,839 100 21 7 7 14 2 6
41 Oregon 000 355 154 9 2 1
42 Pennsylvania 000 9,605 4,392 204 18 2 27 70 5 6
44 Rhode Island 000 242
45 South Carolina 000 241 28 91 1
46 South Dakota 000 209 101
47 Tennessee 000 6,342 777 3,304 7 6 106 14 45 442
48 Texas 000 46,507 21,376 146 409 10 58 5 283 1 83
49 Utah 000 2,528 740 6 37
50 Vermont 000 85 53 2 8 8
51 Virginia 000 3,288 1,967 148 1 21 40
53 Washington 000 632 64 7 143 1 87 15 1 13
54 West Virginia 000 2,339 506 277 51 3 11 14 19 168
55 Wisconsin 000 8,010 172 22 141 11 4,667 1 36
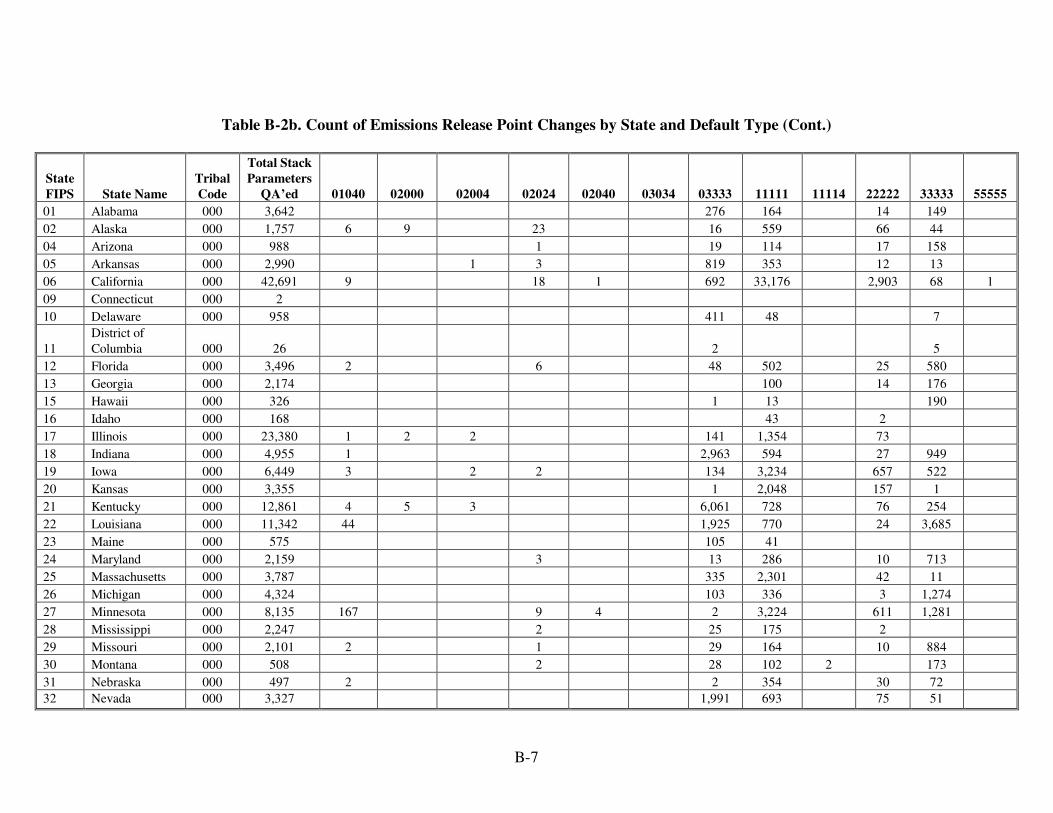
B-7
Table B-2b. Count of Emissions Release Point Changes by State and Default Type (Cont.)
State
FIPS State Name
Tribal
Code
Total Stack
Parameters
QA’ed 01040 02000 02004 02024 02040 03034 03333 11111 11114 22222 33333 55555
01 Alabama 000 3,642 276 164 14 149
02 Alaska 000 1,757 6 9 23 16 559 66 44
04 Arizona 000 988 1 19 114 17 158
05 Arkansas 000 2,990 1 3 819 353 12 13
06 California 000 42,691 9 18 1 692 33,176 2,903 68 1
09 Connecticut 000 2
10 Delaware 000 958 411 48 7
11
District of
Columbia 000 26 2 5
12 Florida 000 3,496 2 6 48 502 25 580
13 Georgia 000 2,174 100 14 176
15 Hawaii 000 326 1 13 190
16 Idaho 000 168 43 2
17 Illinois 000 23,380 1 2 2 141 1,354 73
18 Indiana 000 4,955 1 2,963 594 27 949
19 Iowa 000 6,449 3 2 2 134 3,234 657 522
20 Kansas 000 3,355 1 2,048 157 1
21 Kentucky 000 12,861 4 5 3 6,061 728 76 254
22 Louisiana 000 11,342 44 1,925 770 24 3,685
23 Maine 000 575 105 41
24 Maryland 000 2,159 3 13 286 10 713
25 Massachusetts 000 3,787 335 2,301 42 11
26 Michigan 000 4,324 103 336 3 1,274
27 Minnesota 000 8,135 167 9 4 2 3,224 611 1,281
28 Mississippi 000 2,247 2 25 175 2
29 Missouri 000 2,101 2 1 29 164 10 884
30 Montana 000 508 2 28 102 2 173
31 Nebraska 000 497 2 2 354 30 72
32 Nevada 000 3,327 1,991 693 75 51

B-8
Table B-2b. Count of Emissions Release Point Changes by State and Default Type (Cont.)
State
FIPS State Name
Tribal
Code
Total Stack
Parameters
QA’ed 01040 02000 02004 02024 02040 03034 03333 11111 11114 22222 33333 55555
33 New Hampshire 000 157 16 40
34 New Jersey 000 9,190 108 34 6 2 3,779 302 4
35 New Mexico 000 492 58 3 156
36 New York 000 2,226 23 2 1 20 1 45 148 4 5
37 North Carolina 000 5,958 1 1 970 937 81 377
39 Ohio 000 6,676 1,052 33 1,350
40 Oklahoma 000 3,670 1 29 305 7 1,332
41 Oregon 000 355 8 28 153
42 Pennsylvania 000 9,605 705 2,076 50 2,050
44 Rhode Island 000 242 5 68 169
45 South Carolina 000 241 98 18 5
46 South Dakota 000 209 2 1 105
47 Tennessee 000 6,342 2 3 49 354 674 39 520
48 Texas 000 46,507 3 1,020 14,327 780 8,006
49 Utah 000 2,528 1,677 67 1
50 Vermont 000 85 3 2 9
51 Virginia 000 3,288 967 139 3 2
53 Washington 000 632 13 2 6 18 185 15 62
54 West Virginia 000 2,339 1 7 696 400 30 156
55 Wisconsin 000 8,010 175 1 19 765 33 1,967


