
Doubling of Farmers’ Income in India:
Backdrop and Challenges
March 7, 2017
NCAER Research Team

NCAER Research Team Rajesh Chadha
Prem S Vashishtha
Devender Pratap
K Elumalai
Seema Bathla
Sanjib Pohit
Anjali Tandon
Ruchi Jain
Nishtha Ruhil
Gautam Kumar Das
Yashvardhan Singh Rathore

• India’s agricultural sector has made significant progress over time
• Low and volatile growth – serious concern
• Declining average size of operational holdings
• Growing disparity between agriculture and non-agriculture
incomes
• Rising aspirations among rural people
• Inadequate institutional arrangements to mitigate risk and crop
loss
• Persistent distress among agrarian society and lack of effective
mitigation policy
• Emerging entrepreneurship but lack of adequate investment in
agriculture-based activities
Background

Trend in Growth Rates (3-Year Moving
Average Series at 2011-12 Prices)
-2.0
0.0
2.0
4.0
6.0
8.0
10.0
12.0
19
92-9
3
1993
-94
1994
-95
1995
-96
19
96-9
7
19
97-9
8
19
98-9
9
19
99-0
0
20
00-0
1
20
01-0
2
20
02-0
3
20
03-0
4
20
04-0
5
20
05-0
6
20
06-0
7
20
07-0
8
20
08-0
9
20
09-1
0
20
10-1
1
20
11-1
2
20
12-1
3
20
13-1
4
20
14-1
5
Pe
r ce
nt
Agriculture & allied Non-agriculture Overall GDP
Source: Computed form CSO (various issues)

1.84
1.69
1.55
1.41 1.33
1.23 1.16
56.4
57.8
59.4
61.6
62.9
64.8
67
50
52
54
56
58
60
62
64
66
68
0
0.2
0.4
0.6
0.8
1
1.2
1.4
1.6
1.8
2
1980-81 1985-86 1990-91 1995-96 2000-01 2005-06 2010-11
Sh
are
of
Ma
rgin
al
Ho
ldin
gs
(%)
Av
erag
e H
old
ing
s S
ize
(h
a)
All Sizes Marginal
Average size of Operational Holdings
Source: Agricultural Census (various issues)

0
20
40
60
80
100
120
140
0
10
20
30
40
50
60
70
1991 2001 2011
La
bo
ure
rs (
Mil
lio
ns)
Sh
are
in
to
tal A
gri
cult
ura
l W
ork
ers
(%)
Labourers (Absolute) Cultivators Agricultural Labourers
Composition of Agricultural Workers
Source: Population Census

Strategy
• Irrigation- “Per Drop, More Crop”
• Quality seeds-Improving seed replacement rate
• Soil test based nutrient management- Distribution of soil health
cards
• Post-harvest crop losses- Large investments in warehousing and cold
chains
• Value addition to farmers
• Creation of a national agricultural market, removing distortions and e-
platform across 585 markets.
• New crop insurance scheme – Pradhan Mantri Fasal Bima Yojana-
Minimum Premium and Maximum Security.
• Promotion of ancillary activities- poultry, sericulture, beekeeping and
fisheries
PM’s Vision: Doubling Farmers’
Income by 2022/23

• Focus on doubling of farmers’ income, not farm income (base 2015-16)
• Farmers’ income to be doubled in real terms in 7 years (2016-17 to 2022-23)
• Agricultural household activities comprise of
Crop sector (field crops and horticulture)
Livestock sector (dairy, poultry, piggery, small ruminants)
Farm linked activities (mushroom, beekeeping, sericulture)
Post production activities (off-farm enterprises)
• Use technology to increase the productivity of food crops in a sustainable
way
• Give due emphasis to non-wheat, non-paddy and less water intensive crops
• High priority to diversification towards high value activities (Horticulture,
Dairying, Food Processing, etc.)
• Linking farmers and markets with integrated value chains
Committee on DFI
(Chairman Dr Ashok Dalwai)

Union Budgets: Agriculture Issues
Budget-2014-15
Established National Adaptation Fund for climate change
Set up Long-term Rural Credit Fund
Bhoomi Heen Kisan- Providing financial assistance to 5 lakh joint farming groups of Bhoomi Heen Kisan through NABARD
Launching of Soil Health Cards Set
up -100 Mobile Soil Testing
Laboratories
Pradhan Mantri Krishi Sinchayee
Yojana
Agri –Tech Infrastructure fund
Budget-2015-16
Emphasis on Rural Infrastructure Development
Long Term Rural Credit Fund
Short Term Cooperative Rural Credits Refinance Fund
Paramparagat Krishi Vikas Yojana
Budget-2016-17
Doubling Farmers’ Income by 2022
Long-term Irrigation Fund
Expansion of Soil Health Card Scheme
Continuation of Paramparagat Krishi Vikas Yojana
Organic Value Chain Development in North East

• Ensure adequate flow of credit to under serviced areas (Allocation: Rs 10 lakh crores) Agricultural
Credit
• Coverage of the scheme to be increased from 40% in 2016-17 to 50% in 2018-19 (Allocation: Rs. 9000 crores)
Pradhan Mantri Fasal Bima Yojana
• Establishment of mini labs in Krishi Vigyan Kendras (KVKs) and ensure 100% coverage of all 648 KVK
• 1000 mini labs will be set up by qualified local entrepreneurs.
Soil
Health
• Coverage of National Agricultural Market (e-NAM) is expanded from 250 to 585.
• curremt e-NAM
National
Agricultural
Market
• Corpus of long term irrigation fund has been doubled (Allocation- Rs. 20000 crores)
• A dedicated Micro Irrigation Fund will be setup in NABARD to achieve the goal, per drop more crop (Allocation- Rs. 5000 crores)
Irrigation
• Emphasis on contract farming for strengthening linkage between fruits & vegetable cultivators and agro processing units.
Agro
Processing
Units
• A dairy processing and infrastructure development fund would be set up in NABARD for modernising milk processing unit setup under operation flood programme (Allocation- Rs. 2000 crores)
Dairy
Union Budget: 2017-18

Definition of Agricultural Household
NSSO 70th Round (2012-13) IHDS-II (2011-12)
• An agricultural household is defined
as a household receiving more than
Rs.3000/- from agricultural activities
(e.g., cultivation of field crops,
horticultural crops, fodder crops,
plantation, animal husbandry, poultry,
fishery, piggery, bee-keeping,
sericulture etc.) and having at least
one member self employed in
agriculture either in the principal
status or in subsidiary status during
last 365 days.
• Agricultural households are drawn
from a sample of rural households in
IHDS subject to the condition that the
value of produce from agriculture and
allied activities is comparable to
NSSO definition.

Components of Agricultural
Household Income
NSSO 70th Round (2012-13) IHDS-II (2011-12)
Four component of income-
Cultivation, livestock, non-farm
business, and wages & salaries
Wages and salaries include
components such as agricultural
wages, remittances, pension, and
other miscellaneous sources
IHDS has 9 components of income
Agriculture wages, remittances &
pension are shown as separate
sources of income
Wages & salaries are collated
separately for farm-linked and non-
farm business
This highlights the role of farm-
linked activity to enhance income
and employment for agriculture
households

Share of Different Components in Total Income of
Agricultural Households, 2011-12 (IHDS)
38.73
6.33 7.60
0.36
24.78
0.21
8.36
6.94
6.68
Crop
Livestock
Agri wages
Non-agri wages+salary (farm linked)
Non-agri wages+salary (other than farm
linked)
Non-farm business (farm linked)
Non-farm business (other than farm linked)
Remittances
Other

NSSO- Agricultural Household Income
Components
of Income
Current Prices
(Rs)
Constant Prices
At (2011-12) Prices
(Rs)
Growth Rate
(%)
NSSO 50th
Round
(2002-03)
NSSO 70th
Round
(2012-13)
NSSO 50th
Round
(2002-03)
NSSO 70th
Round
(2012-13)
At Current
Prices
At 2011-12
Prices
Cultivation 11455 36950 21830 33383 12.4 4.3
Livestock 1189 10016 2266 9049 23.8 14.9
Non-Farm
Business 2786 6209 5309 5610 8.3 0.6
Wages &
Salary 9840 24801 18753 22407 9.7 1.8
Total
Annual Income 25271 77977 48160 70449 11.9 3.9

Source of Income of Agricultural Households
Land Size classes, 2012-13 (%)
0.0
20.0
40.0
60.0
80.0
100.0
120.0
Marginal Small Semi Medium Medium Large
% S
ha
re o
f In
com
e
Land Size
Cultivation Livestock Non-farm Business Wages & Salary

Ratio of Kharif to Rabi Income in 2012-13
Cultivation Livestock
Manipur (12.8) Manipur (11.9)
Chhattisgarh (7.0) Nagaland (4.0)
Himachal Pradesh (6.7) Arunachal Pradesh (1.8)
Jammu & Kashmir (4.5) Assam (1.7)
Maharashtra (3.4) West Bengal (1.6)
India (1.4) India (0.9)
Rajasthan (0.9) Meghalaya (0.7)
UP (0.9) Rajasthan (0.6)
Bihar (0.8) Chhattisgarh (0.5)
Tamil Nadu (0.8) Bihar (0.3)
Andhra Pradesh (0.7) Jharkhand (0.3)

Income to Value of Produce (%) :
Low Performing States in 2012-13

Composition of Inputs (expenditure) in
2012-13 (%)

UK
Odisha Assam
Bihar
Chhattishgarh
UP
Jharkhand
TelanganaRajasthan
Maharashtra
APGujarat
MP
North East
Karnataka
HP
TN
Kerala
-20
24
68
Ave
rage
_Gro
wth
_of_
NS
DP
50000 100000 150000Average_Income
Growth rate of NSDP (2004-05 to 2015-16) and average income per
agricultural household
(Benchmarking NSDP 2015-16 current prices)
# Punjab and Haryana are in low growth & high income group and not shown in the Graph
# Average growth rate of NSDP in India from 2004-05 to 2015-16 was 3.3 %
# Average real income of agricultural household in 2015-16 was Rs. 96703

Access to Technical Advice for Crops
All India, 2012-13 (%)
0.0 5.0 10.0 15.0 20.0 25.0
Agricultural University
NGO
Krishi Vigyan Kendra
Extension Agent
Private Commercial Agent
Radio/TV/Newpaper/Internet
Progressive Farmer

Technical Advice adopted by farmers
All India, 2012-13 (%)
0.0 20.0 40.0 60.0 80.0 100.0
Radio/TV/Newspaper/Internet
NGO
Agricultural Universiy
Krishi Vigyan Kendra
Extension Agent
Private Commercial Agent
Progressive Farmer
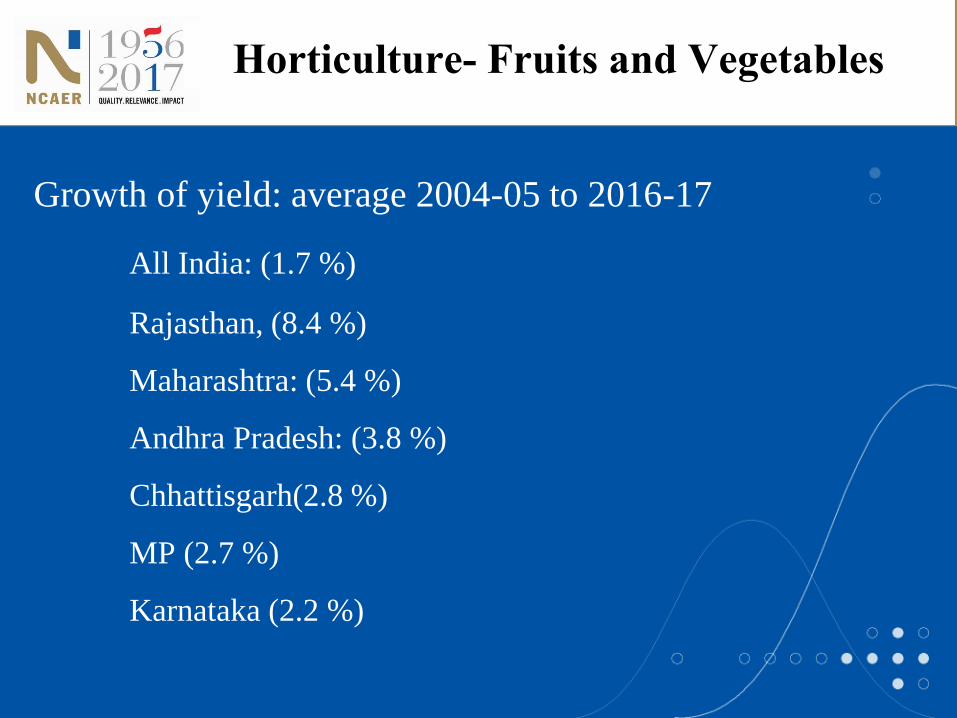
Growth of yield: average 2004-05 to 2016-17
All India: (1.7 %)
Rajasthan, (8.4 %)
Maharashtra: (5.4 %)
Andhra Pradesh: (3.8 %)
Chhattisgarh(2.8 %)
MP (2.7 %)
Karnataka (2.2 %)
Horticulture- Fruits and Vegetables

• Insurance against risk and post harvest management is the key to
improve production and productivity
High Volatility of Yield and Price
Coefficient of Variation
States Yield Implicit Price
Chhattisgarh 11.63 19.02
MP 14.97 25.55
Maharashtra 25.37 23.45
Rajasthan 19.98 38.23
UP 8.61 35.91
West Bengal 9.32 33.26
India 7.40 23.33

NCAER and NIAP – Work-in-Progress
• Background, Relevance and Scope for Doubling Farmers’ Income
• Agricultural Growth and Performance across states
• Status of Farm and Non-Farm Income across States
• Potential growth rates for DFI
• Role of Technology in Doubling of Farmers’ Income
• Role of Inputs: Gains from Irrigation
• Marketing, Prices and Trade
• Post-Harvest Management, Value addition and processing
• Role of Diversification
• Rural Credit and Investment in Agriculture
• Policy Interventions
Proposed Structure of the Report

Thank You


