Download - DriveWare User Manual - ABB Download Center

DriveWare User Manual
DriveStudio

2
DriveStudio
User Manual
Code: 3AFE 68749026 REV F EN
EFFECTIVE: 13.4.2012
PDM code: 00528248.DOC
2012 ABB Oy. All rights reserved.

3
Table of contents
Table of contents....................................................................................................................... 3
Introduction to the manual ....................................................................................................... 5
Compatibility................................................................................................................................ 5 Reader ........................................................................................................................................ 5 Contents ...................................................................................................................................... 5 Related documents ..................................................................................................................... 5
Chapter 1 - General ................................................................................................................... 6
What is DriveStudio ..................................................................................................................... 6 Hardware and software requirements .......................................................................................... 6 Installing and uninstalling ............................................................................................................ 7 Connecting to a drive ................................................................................................................ 12 On-line help ............................................................................................................................... 13
Chapter 2 – Main user interface components ....................................................................... 14
Overview ................................................................................................................................... 14 Title bar ..................................................................................................................................... 15 Menu bar ................................................................................................................................... 16 Drive Control Panel ................................................................................................................... 25 Drive List ................................................................................................................................... 26 Status Panel .............................................................................................................................. 27 Status bar .................................................................................................................................. 28 Window area ............................................................................................................................. 28
Chapter 3 – Parameter Browser view ..................................................................................... 29
Navigating parameters and groups ............................................................................................ 30 Working with files ...................................................................................................................... 30 Parameter subset ...................................................................................................................... 31 Pointer parameters .................................................................................................................... 31 Binary parameters ..................................................................................................................... 33 Search for groups and parameters ............................................................................................ 33
Chapter 4 – Data Logger view ................................................................................................ 34
Graph area ................................................................................................................................ 36 Logger Settings window ............................................................................................................ 36
Chapter 5 – Fault Logger view ................................................................................................ 41
Faults from all drives window .................................................................................................... 41
Chapter 6 – Monitor window ................................................................................................... 42
Graph area ................................................................................................................................ 44

4
General ..................................................................................................................................... 44 Monitor Settings window ........................................................................................................... 44
Chapter 7 – Data File Viewer window .................................................................................... 46
Graph area ............................................................................................................................... 47
Chapter 8 – Other functions ................................................................................................... 48
Graph area functions ................................................................................................................ 48 Zoom box tool ........................................................................................................................... 49 Comparing and copying parameters ......................................................................................... 49 Confirmation and Options ......................................................................................................... 50 Solution programming ............................................................................................................... 51 Backup and restore ................................................................................................................... 51 Rename the drive ..................................................................................................................... 56 Last parameter changes ........................................................................................................... 56 OPC server settings .................................................................................................................. 57 Wizards .................................................................................................................................... 57

5
Introduction to the manual
This manual gives you instructions on how to use the DriveStudio
commissioning and maintenance tool and how to access DriveSPC, Solution
Program Composer (SPC).
Compatibility
This manual is compatible with DriveStudio version 1.6.
Reader
The reader of this manual is expected to be an automation engineering
professional and familiar with drive products and the concepts regarding their
commissioning and operation, including the parameter system of ABB drives.
Contents
Chapter 1 – General briefly lists the main features of the DriveStudio software,
how and where it can be run, and how to get help and additional information.
Chapter 2 – Main User Interface Components describes the main user interface
components of DriveStudio, including the menus.
Chapter 3 – Parameter Browser View describes the Parameter Browser view
and its usage.
Chapter 4 – Data Logger View describes the Data Logger view and its usage.
Chapter 5 – Fault Logger View describes the Fault Logger view and its usage.
Chapter 6 – Monitor Window describes the Monitor window and its usage.
Chapter 7 – Data File Viewer Window describes the Data File Viewer window
and its usage.
Chapter 8 – Other Functions describes functions that are common to many
views and windows and ones that are not associated with any view or window.
Related documents
DriveStudio: Solution Program Composer User Manual
Control program Firmware Manual of the drive.

6
Chapter 1 - General
What is DriveStudio
DriveStudio is an easy-to-use 32-bit Windows application for commissioning
and maintaining ABB ACSM1 and similar type AC drives.
Highlights and features
Working simultaneously with multiple drives like master and follower drives
Signal monitoring in numerical and graphical (trending) format
Working with drive parameters
Viewing the actual status of the connected drive
OPC-based commissioning and maintenance tool
Includes an OPC server (DA 2.04) for ACSM1 and similar drives
Uses RS232 serial communication port
Modern graphical user interface
Runs in Windows 2000, XP, Vista and 7
Fully 32-bit code
DriveStudio functions
Control operations (start, stop, set reference, etc.)
View drive status
Monitoring (signals)
Parameters (changing values, comparing, groups)
Data logger (display data, controls)
Fault logger (display faults, controls)
Hardware and software requirements
DriveStudio hardware
One OPCA-02 cable for each drive to be connected
Computer hardware
IBM compatible PC
Pentium 800 MHz or faster processor recommended
256 MB RAM
1024 x 768 display resolution with 256 colors
At least 50 MB free hard disk space

7
CD Drive
One free serial port for each drive to be connected
Software
Operating system Windows 2000, XP, Vista or 7
Installing and uninstalling
Determining current DriveStudio version
The version of currently installed DriveStudio can be determined by selecting
the About DriveStudio command in the Help menu. The About DriveStudio
dialog box containing the DriveStudio version is shown.
Installing
Please read carefully the license agreement (License.pdf) before installing
DriveStudio. You should quit all applications before starting the installation. We
recommend that you uninstall all previous versions of DriveStudio before
installing.
Note! You must have Administrator privileges to be able to do the installing.
Your PC may be configured in such a way that when you insert the DriveStudio
installation CD into your CD drive, installation starts automatically. Answer the
questions and follow the instructions given by the installation program.
If the installation does not start automatically, you can start the SETUP program
from the Control Panel as follows.
Start the Control Panel program and double-click the Add or Remove Programs
icon.

8
Click the Add New Programs button, and then click the CD or Floppy button.
Insert the DriveStudio installation CD into your CD drive, and click the Next >
button.
If the proper SETUP was not found automatically, enter E:\SETUP.EXE in the
Command line for the installation program (assuming E: is your CD drive), or
click the Browse button and select the program by browsing. Finally, click the
Finish button, which will start the SETUP.
When the DriveStudio installation wizard window is shown, click the Next >
button.

9
The second screen asks where to install DriveStudio. If the default location is
OK, just click the Next > button to continue. Otherwise, click the Change button
to define another location.
A confirmation screen is shown. You can return to a previous screen and
change your selections by clicking the < Back button. Start the installation by
clicking the Install button.

10
After the files are copied to the specified location on your hard disk, click the
Finish button to end the installation procedure. DriveStudio is now ready for you
to use.
Installing hardware in Windows
In case you are using external serial ports, please follow the instructions given
by the manufacturer.
Note! You must have Administrator privileges to be able to finish the driver
installation.

11
Uninstalling DriveStudio
While in the Add or Remove Programs dialog box of the Control Panel, browse
for DriveStudio in the Currently installed programs list, select it by clicking, and
click Remove.
After you have confirmed that you want to remove the application by clicking the
Yes button, the uninstallation starts.

12
Wait until the wizard is done and then click the Finish button.
Note! You must have Administrator privileges to be able to complete the
uninstallation.
Connecting to a drive
To establish a connection between DriveStudio and a drive, you need to
connect an OPCA-02 cable between a serial (COM) port of the computer and
the panel link port of the drive. A USB-RS232 adapter (ABB product code
3AFE68583667) or a galvanic isolated USB-RS232 adapter (ABB product code
3AUA0000050176) can be used if the PC doesn‟t have any legacy interfaces or
enough of them.

13
On-line help
DriveStudio includes comprehensive on-line help. The user manual and the on-
line help contain the same information.
Opening help
To open help, select the Contents command in the Help menu. The Windows
Help program opens with its main dialog displayed. In the main dialog, you can
select to view the content, view the index, or search for specific words.
You can also start the Windows help program by pressing the shortcut key F1.
The Help program jumps directly inside DriveStudio help.
Context-sensitive help
To get help about a command on a menu or submenu, use the arrow keys to
highlight the command and press F1. To get help about a dialog box, press F1
while the dialog box is displayed. If there is no specific topic associated with the
object you requested help for, you are returned to the main page of DriveStudio
help.
There are links within on-line help. When you click text that is green and
underlined, the help program jumps to the topic linked to the text. You can go
back by clicking the Back button.
To view the drive‟s firmware manual about a parameter, a fault or a function
block (in DriveSPC), select it and press F3, or select Help / Firmware manual.
Help structure
Each part is organized as a separate “book”. A book always starts with the
contents of the part. The topics are ordered, so you can browse forward and
backward within a part.
See Also: Help Menu

14
Chapter 2 – Main user interface components
Overview
The user interface consists of the following parts:
1. Title Bar
2. Menu Bar
3. Drive Control Panel
4. Drive List
5. Status Panel
6. Status Bar
7. Window area
The panels and Status Bar can be individually hidden by the user. Some panels
can be dragged to different locations in the main window. Most windows that are
not maximized can be resized by dragging any of the sides or corners.
Scrollbars appear in a window if scrolling the content is possible.

15
Title bar
The title bar is located at the top of the main window. It consists of the following
parts:
1. System menu button
2. Application name and version number (DriveStudio)
3. Type, COM port number and node number of a drive or filename if one is
currently selected in the Drive List
4. Currently active window or view
5. Minimize button, same as Minimize in the System menu. Reduces the
main window to the Taskbar or a sub-window to the window area.
6. Maximize / Restore button (depends on the current maximized status of
the window) -- same as Maximize or Restore in the System menu.
7. Close button, same as Close in the System menu
To move the window, drag the title bar. You can also move dialog boxes by
dragging their title bars. Maximized or minimized windows cannot be moved.
On the Maximize/Restore button, Maximize enlarges the window to fill the
available space.
The Restore on the Maximize / Restore button returns the window to the size
and position it had before it was maximized.
You can also maximize or restore by double-clicking the title bar.
Clicking the Close button ends your DriveStudio session. DriveStudio possibly
warns you about releasing control, prompts you to save documents with
unsaved changes, or reminds you about unfinished printing.
You can also close DriveStudio by double-clicking the System menu button, by
selecting the Exit command in the File menu, by selecting Close in the System
menu, or by pressing the shortcut key Alt+F4.
System menu
You can open the System menu by left- or right-clicking the System menu
button, by pressing the shortcut key Alt+Spacebar, or by right-clicking within the
non-button area of the title bar.
Many dialog boxes also have simple system menus. You can open their System
menu, in addition to clicking the button, by right-clicking within the non-button
area of their title bar, or by pressing the shortcut key Alt+Spacebar.

16
The menu contains the following commands:
Restore command, the same as the Maximize / Restore button in the title
bar, when the window is maximized. Returns the window to its size and
position before you chose maximize.
Move command, similar to dragging the title bar. After selecting the
command, it is possible to move the window with the arrow keys. To finish
the move, press Enter. To cancel the move, press Esc.
Size command, similar to dragging any of the sides or corners of the window.
After selecting the command, it is possible to resize the window with the
arrow keys. To finish resizing, press Enter. To cancel resizing, press Esc.
Minimize command, same as the Minimize button in the title bar. Reduces
the window to the Taskbar or the window area.
Maximize command, same as the Maximize / Restore button in the title bar,
when the window is not maximized. Enlarges the window to fill the available
space.
Close command, same as the Close button in the title bar. Ends your
DriveStudio session. DriveStudio possibly warns you about releasing control,
prompts you to save documents with unsaved changes, or reminds you
about unfinished printing.
Menu bar
The menu bar is located immediately below the title bar. It always contains the
following drop-down main menus:
File
Edit
View
Drive
Window
Help
One of the following main menus is visible between the Drive and Window
menus only when a same kind of window is open and active:
Parameter Browser
Data Logger
Fault Logger
Monitor
Data File Viewer
To open a drop-down menu, click its name on the menu bar. You can also use
the underlined letter in the menu name. First press and hold down the Alt key,
then press the underlined letter and release both keys. For example, Alt+F
opens the File menu.
To execute a command from a menu, click its name on the menu. You can also
use the arrow keys to navigate within the menu bar and menus. The highlighted

17
command is executed by pressing Enter. Pressing the Esc key closes the
menu. You can also use the underlined access key in a command name to
execute the command. For example, pressing X, while the File menu is
displayed, executes Exit.
To get help about a command on a menu or submenu, use the arrow keys to
highlight the command, and press F1. Another method is to first press Shift+F1
while no menu is displayed. While a question mark is attached to the cursor,
open a menu or submenu and click the command you want help for.
Note! Shortcut keys other than F1 do not work while a drop-down menu is
open.
File menu
This menu is always located in the menu bar.
The menu contains the following commands:
Open… command opens a parameter or a signal data file. Keyboard shortcut
Ctrl+O.
Close command closes the active document window. Keyboard shortcut
Ctrl+W.
Save command saves parameters or logger data from the active window into
a file. Keyboard shortcut Ctrl+S.
Save As… command presents a dialog for saving the parameters or logger
data from the active window into a file with a new name. Keyboard shortcut
F12.
Print… command presents a dialog for printing the active document.
Keyboard shortcut Ctrl+P.
Print Setup… command presents a dialog for changing the printer and
printing options.
Exit command ends your DriveStudio session. DriveStudio possibly warns
you about releasing control, prompts you to save documents with unsaved
changes, or reminds you about unfinished printing. Keyboard shortcut
Alt+F4.

18
Edit menu
This menu is always located in the menu bar.
The menu contains the following commands:
Undo command cancels the latest command if it is possible. Keyboard
shortcut Ctrl+Z.
Cut command removes selected objects and puts them on the clipboard. Not
all objects can be cut and they vary between different views. Keyboard
shortcut Ctrl+X.
Copy command copies selected objects to the clipboard. Not all objects can
be copied and they vary between different views. Keyboard shortcut Ctrl+C.
Paste command inserts the clipboard contents. Availability of the command
depends on the active view and contents of the clipboard. Shortcut key
Ctrl+V.
Confirmation and Options command presents a dialog for setting DriveStudio
behavior.
OPC Server Settings… opens the dialog for modifying the OPC server
specific settings, such as node numbers and communication speeds.
View menu
This menu is always located in the menu bar.
The menu contains the following commands:

19
Refresh command updates the information in the active window or panel
(status information, connected drives, parameter values, etc.).
Parameter Browser command brings up a window for showing the
parameters of the selected drive and modifying their values.
Properties command brings up a window showing properties of the selected
drive.
Data Logger command brings up a window showing the data logger of the
selected drive.
Fault Logger command brings up a window showing the fault logger of the
selected drive.
Wizard... command opens the commissioning wizards of the selected drive (if
there are wizards available for the drive).
DriveSPC (Solution Program Composer) command launches the DriveSPC
software in a separate window (if DriveSPC is installed on the PC).
DriveCam command launches the DriveCam software in a separate window
(if DriveCam is installed on the PC).
Drive Control Panel command shows or hides the Drive Control Panel.
Drive List command shows or hides the Drive List.
Status Panel command shows or hides the Status Panel.
Status Bar command shows or hides the Status Bar on the bottom of the
main window.
All Faults in all drives command brings up the All Faults window which shows
the latest faults in all connected drives.
Monitor brings up the Monitor window.
Drive menu
This menu is always located in the menu bar.
The menu contains the following commands:
Take control command allows this software to control the selected drive. This
is the same command as the corresponding button in the Drive Control
Panel.

20
Release control command releases control of the selected drive from this
software. This is the same command as the corresponding button in the
Drive Control Panel.
Set new reference… command presents a dialog for setting a new value to
the drive reference of the currently controlled drive.
Start command starts rotating the motor connected to the currently controlled
drive. This is the same command as the corresponding button in the Drive
Control Panel.
Stop command stops rotating the motor connected to the currently controlled
drive. This is the same command as the corresponding button in the Drive
Control Panel.
Reset command resets the fault state of the currently selected drive if it has
one. This is the same command as the corresponding button in the Drive
Control Panel.
Backup command creates a backup of the selected drive. Backup includes
the parameters, the solution program and the cam file (if a cam file exists on
the drive)
Restore command restores the selected drive from the backup. There are
several options for restoring a drive. These will be described in the Chapter 8
– Other functions / Backup/Restore.
Read restore report command creates a report of the selected drive‟s
previous restore operation.
Parameter Browser menu
This menu is located in the menu bar when a same kind of window is open and
active.
The menu contains the following commands:
Parameter Subset… command displays a window where several parameters
can be chosen from several groups to be displayed in a separate subset
group.
Expand groups command shows all visible groups and their parameters in
the list.
Collapse groups command shows only the group names in the list.
Re-read all groups command reads all available groups and parameters from
the selected drive. This is needed when a parameter value modification hides
21
or reveals additional groups or parameters, or when e.g. the unit or a limit of
a parameter changes.
Re-read selected group command reads the available parameters of the
selected group of the selected drive.
Search groups and parameters command displays a dialog requesting for a
word to search for from the names of the visible parameters and groups.
Compare & Copy… command opens a dialog in which you can choose a
source and target for copying and comparing parameters. See Chapter 8 –
Other functions / Comparing and copying parameters for further information.
Last parameter changes… command opens a dialog showing the last
parameter value changes.
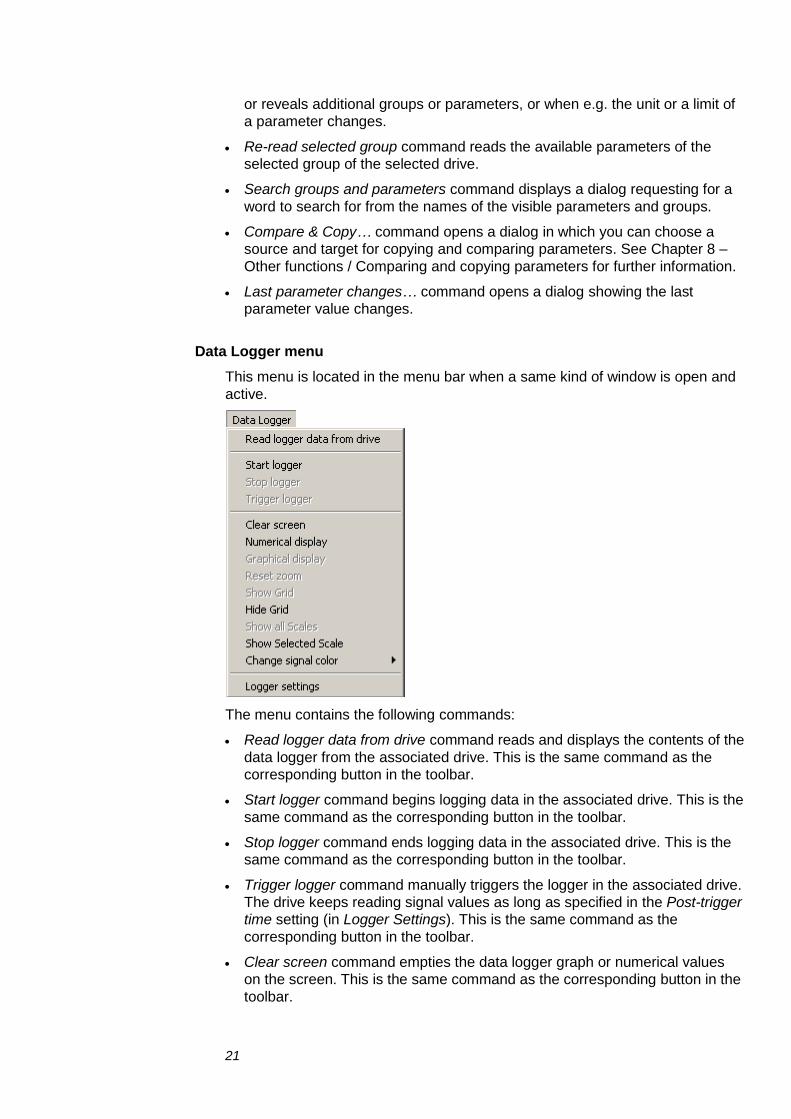
Data Logger menu
This menu is located in the menu bar when a same kind of window is open and
active.
The menu contains the following commands:
Read logger data from drive command reads and displays the contents of the
data logger from the associated drive. This is the same command as the
corresponding button in the toolbar.
Start logger command begins logging data in the associated drive. This is the
same command as the corresponding button in the toolbar.
Stop logger command ends logging data in the associated drive. This is the
same command as the corresponding button in the toolbar.
Trigger logger command manually triggers the logger in the associated drive.
The drive keeps reading signal values as long as specified in the Post-trigger
time setting (in Logger Settings). This is the same command as the
corresponding button in the toolbar.
Clear screen command empties the data logger graph or numerical values
on the screen. This is the same command as the corresponding button in the
toolbar.

22
Numerical display command shows the data logger data in numerical format.
This is the same command as the corresponding button in the toolbar.
Graphical display command shows the data logger data in graphical format.
This is the same command as the corresponding button in the toolbar.
Reset zoom command shows the graph in its original scale. This is the same
command as the corresponding button in the toolbar.
Show Grid command shows the grid lines on the graph area. This is the
same command as the corresponding button in the toolbar.
Hide Grid command removes the grid lines from the graph area. This is the
same command as the corresponding button in the toolbar.
Show all Scales command shows the minimum and maximum visible values
of the signals on the graph. This is the same command as the corresponding
button in the toolbar.
Show Selected Scale command shows the value of the selected signal on
each grid line. This is the same command as the corresponding button in the
toolbar.
Change signal color contains a submenu where the colors used in the graph
can be selected.
Logger Settings command brings up the Logger Settings window where the
data logger settings of the associated drive can be modified. This is the same
command as the corresponding button in the toolbar.
Fault Logger menu
This menu is located in the menu bar when a same kind of window is open and
active. See Chapter 5 for more information about the Fault Logger view.
The menu contains the following commands:
Short details command shows fault logger data of the associated drive with
short details. This is the same command as the corresponding button in the
toolbar.
Long details command shows fault logger data of the associated drive with
long details. This is the same command as the corresponding button in the
toolbar.
Clear fault logger command empties the fault logger data from the associated
drive. This is the same command as the corresponding button in the toolbar.
All faults in all drives command brings up the All Faults window, which shows
the latest faults in all connected drives.

23
Monitor menu
This menu is located in the menu bar when the same kind of window is open
and active.
The menu contains the following commands:
Start Monitoring command begins recording data in the selected drives and
displaying it on the screen, or resumes scrolling if paused. This is the same
command as the corresponding button in the toolbar.
Pause command continues recording, but pauses or resumes scrolling the
screen. This is the same command as the corresponding button in the
toolbar.
Stop Monitoring command ends recording data in the selected drives. This is
the same command as the corresponding button in the toolbar.
Clear Screen command empties the data graph or numerical values on the
screen. This is the same command as the corresponding button in the
toolbar.
Numerical Display command shows the data in numerical format. This is the
same command as the corresponding button in the toolbar.
Graphical Display command shows the data in graphical format. This is the
same command as the corresponding button in the toolbar.
Reset Zoom command shows the graph in its original scale. This is the same
command as the corresponding button in the toolbar.
Show Grid command shows the grid lines on the graph area. This is the
same command as the corresponding button in the toolbar.
Hide Grid command removes the grid lines from the graph area. This is the
same command as the corresponding button in the toolbar.
Show all Scales command shows the minimum and maximum visible values
of the signals on the graph. This is the same command as the corresponding
button in the toolbar.
Show Selected Scale command shows the value of the selected signal on
each grid line. This is the same command as the corresponding button in the
toolbar.

24
Change Signal Color contains a submenu where the colors used in the graph
can be selected.
Monitor Settings command brings up the Monitor Settings window where the
monitor settings can be modified. This is the same command as the
corresponding button in the toolbar.
Data File Viewer menu
This menu is located in the menu bar when a same kind of window is open and
active.
The menu contains the following commands:
Numerical display command shows the data in numerical format. This is the
same command as the corresponding button in the toolbar.
Graphical display command shows the data in graphical format. This is the
same command as the corresponding button in the toolbar.
Reset zoom command shows the graph in its original scale. This is the same
command as the corresponding button in the toolbar.
Show Grid command shows the grid lines on the graph area. This is the
same command as the corresponding button in the toolbar.
Hide Grid command removes the grid lines from the graph area. This is the
same command as the corresponding button in the toolbar.
Show all Scales command shows the minimum and maximum visible values
of the signals on the graph. This is the same command as the corresponding
button in the toolbar.
Show Selected Scale command shows the value of the selected signal on
each grid line. This is the same command as the corresponding button in the
toolbar.
Change signal color contains a submenu where the colors used in the graph
can be selected.
Compare & Copy menu
This menu is located in the menu bar when the same kind of window is open
and active.

25
Expand groups command shows all visible groups and their parameters in
the list.
Collapse groups command shows only the group names in the list.
Search groups and parameters… command displays a dialog requesting for
a word to search for from the names of the visible parameters and groups.
Window menu
This menu is always located in the menu bar.
The menu contains the following commands:
Cascade command arranges the open windows so that they overlap.
Help menu
This menu is always located in the menu bar.
The menu contains the following commands:
Contents command brings up the online help window and shows its topics.
Firmware manual command opens the firmware manual of the drive in a
separate window as a PDF file. If a parameter or some other significant item
was selected when this command was clicked or the F3 key was pressed,
the firmware manual displays the associated chapter.
About DriveStudio… command brings up a window displaying program
information, version number and copyright.
Drive Control Panel
The Drive Control Panel is located below the menu bar. It has buttons for
controlling a connected drive.
The panel contains the following buttons and items:
1. Name, COM port and node number of the currently controlled drive and an
indication if it is running.
2. Take control / Release control button allows this software to control the
selected drive or to release the control. The same command can be given in
the Drive menu.

26
3. Reset button sends a reset command to the drive and, if fault is no longer
active, the drive clears it. The same command can be given in the Drive
menu.
4. Start button starts the currently controlled drive. A motor connected to the
drive starts rotating according to the set reference value. The same
command can be given in the Drive menu.
5. Stop button stops rotating the motor connected to the currently controlled
drive. The same command can be given in the Drive menu.
6. Reference value field. You can enter a new reference value here. The up
and down arrow buttons increase and decrease the value respectively.
DriveStudio sends this reference value to the drive.
7. Active reference field. The reference, which is used in the drive, is shown
here.
8. Set new reference button enforces the value in the Reference value field in
the currently controlled drive.
See the firmware manual of the drive for parameters you must set before
starting. After that, click Take control, type in a reference value, press Enter or
click Set new reference, and finally click Start.
Drive List
The Drive List panel shows all connected drives and open files. Drives are
indicated with a motor icon, parameter files with a diskette icon with the letter P,
and data log files with a diskette icon with the letter L.
A stopped drive is indicated with a hollow black and white motor icon. Running
drives have filled black and green motor icons.
A drive that has faulted is indicated with a red background and white text.
A drive that has an alarm is shown with an orange background and black text.
If a connection to a drive breaks, the drive is indicated with a light grey
background and mid-grey text until connection is established again.
A drive is indicated by a black background, If a new drive with the same
port/node –combination is found. Before refreshing the drive list with F5, the
user can save all read data from the drive.
Each drive and parameter file is displayed as a tree that can be expanded and
collapsed by clicking the plus or minus icon. The items in the tree represent
different views that are shown in a window associated with the drive or file.

27
The views for a drive - Parameter Browser, Data Logger, Fault Logger,
Properties and Wizard (if such are available for the drive) - can be shown by
clicking the corresponding icons in the tree. Parameter files have only a
Parameter Browser view.
If an active window (the window on top) is associated with a drive or a file, the
corresponding tree item is highlighted in the Drive List.
This panel is initially docked on the left edge of the main window, but you can
drag it to the right edge, too. You can make it a floating window by dragging it
off the window edges and releasing the mouse button.
Status Panel
The Status Panel displays information about the drive highlighted in the Drive
List.
Click the tabs to show the Drive Status view or the Status Word view.
This panel is initially docked on the left edge of the main window, but you can
drag it to the right edge, too. You can make it a floating window by dragging it
off the window edges and releasing the mouse button.
You can adjust the widths of the columns by dragging the vertical lines in the
column headers.

28
The signal values in the DriveStatus view are cyclically updated. You can allow
or prevent the updating in the Confirmation and Options window.
Status bar
The status bar is situated at the bottom of the main window. It shows
informational and error messages in various situations.
Window area
The sub-windows of the main window are shown in this area. You can move the
windows freely within this area and resize most of them to suit your work needs.

29
Chapter 3 – Parameter Browser view
The Parameter Browser view displays parameter groups, parameters, and their
values of the associated drive or file.
The window consists of a tree of parameters and groups. It uses the following
icons to denote different kinds of parameters and groups:
Icon Parameter Group
Collapsed parameter group
Expanded parameter group
The Parameter Browser contains four different types of parameters. Some of
these types are identified by the icons shown in the table below:
Icon Parameter
Parameter
Signal or locked by the drive‟s DriveSPC program
Parameter signal
Value changed from the file
The most common type is the regular parameter. Parameters are normally
readable and writeable. However, when the drive is running, some parameters
may be write-protected. Parameter names, values, and units are shown in the
Parameter Browser. The value of a parameter is read only once. If you want to
update this value, you have to use the View / Refresh menu command. The
command is also available in the secondary mouse button shortcut menu.

30
Signals are like parameters, but you cannot edit their values. They are updated
cyclically in the Parameter Browser. You can allow or prevent the updating in
the Confirmation and Options window. See Chapter 8 – Other functions for
more information.
Parameter signals are also updated frequently, but you can edit their values.
When working on a parameter file, parameters are marked with a value
changed icon when a new value is written or a previously saved parameter file
is opened, but not yet copied to a drive.
Navigating parameters and groups
You can use the Parameter Browser to navigate parameters and signals and to
modify parameter values. Parameters are organized as groups in a tree
structure. Clicking the plus or minus icon expands or collapses the group.
Double-clicking on a parameter group name does the same. You can also
expand/collapse groups with the Enter key, or left or right cursor keys. All
parameter groups can be expanded with the Parameter Browser / Expand
groups menu command and collapsed with Parameter Browser / Collapse
groups.
Note! The parameters are read from the drive the first time a group is opened.
Expanding all groups at once may take a while, depending on the
communication speed. If the Parameter Browser is associated with a file, all
operations are instantaneous.
When the Parameter Browser is associated with a drive, the values shown
should match the values in the drive. Parameter values are updated if they are
edited. The signals are updated cyclically, so some delays may occur. You can update the values in the view at will with the View / Refresh menu command or
by pressing the F5 key.
In special cases where hidden parameters and groups become available by
modifying some parameter values, the Drive / Re-read selected group and Drive
/ Re-read all groups menu commands update the list of parameters and
groups. The same commands can also be found in the shortcut menu, which is
displayed by clicking the secondary mouse button.
Parameter values can be modified by double-clicking on the parameter or by
pressing Enter on a highlighted parameter.
You can change the format of how a parameter is displayed by clicking it with
the secondary mouse button, and selecting Default, Hexadecimal, Binary or
Decimal integer.
You can change the widths of the columns by dragging the vertical lines
between the column headers. Double-clicking a line automatically resizes the
column to accommodate its contents.
Working with files
You can save the parameter names and values in a DriveStudio Parameter file
(.DSP) with the File / Save or File / Save As… menu commands. The .DSP files
can be opened in Parameter Browser windows of their own. They can be
navigated and the parameter values modified just like with connected drives.

31
The file can be transferred into a connected drive with Parameter Browser /
Compare & copy… menu command. This is also known as downloading.
Note! DriveStudio doesn‟t check the drive type and software version when
copying parameters from a file to a drive.
Parameter subset
You can use the Parameter Browser / Parameter subset menu command to
create a virtual parameter group of your own. The command opens a Parameter
Browser – Parameter Subset Selection window where parameters from all
available groups can be selected. The created subset of parameters is shown
as the first group in the Parameter Browser.
Select the parameters you want to include in the subset from the Parameter List
and click the „>>‟ button to add them to the Selected Parameters list. The Ctrl
and Shift keys can be used to select multiple parameters. Selecting a parameter
group selects all parameters of that group. Removing parameters from the
subset is similarly done with the „<<‟ or „<< All‟ buttons.
Parameter subsets are saved in a subset.dss file. One subset for each drive
type is saved.
Pointer parameters
One special type of a parameter is a pointer parameter. The value of a pointer
parameter is read from the parameter it points to. Depending on the pointer
parameter, its target can be an entire other parameter or one of its bits. Some
pointer parameters can be assigned a constant value of true or false.

32
Modifying a pointer parameter is done in a Set Pointer Parameter window:
First choose if you want the parameter to point to a Constant true, Constant
false or another Parameter, and click an option button accordingly. You can
select a parameter in the list and then its bit from 0 to 31.
You can also enter a value there with the keyboard by manually selecting Edit.
The value must follow the form „P.#.#.#‟, where the first # is the parameter
group number, the second # is the parameter number and the third # is the bit
number without leading zeros. For example: P.2.1.2
Manually entered values for constants are C.True or C.False.
In some cases, the most common settings are offered as a selection list.
Note! In the parameter browser, the parameter numbers are replaced with the
actual parameter name as shown below.

33
Binary parameters
Binary parameters have a special meaning for each of their bits. These
parameters are edited in a special Set Binary Parameter dialog. The value can
be edited numerically in binary, hexadecimal or decimal format. You can also
edit the value bit–by-bit by selecting the value for each bit from the drop-down
list. If some of the bits are not allowed to be edited, those bits are shown
grayed.
Signal values, which are in binary format, can be viewed in a similar dialog.
Search for groups and parameters
You can search the names of parameters and groups with the Parameter
Browser / Search groups and parameters… menu command. Alternatively, you
can press Ctrl+F. The following window is shown:
Type the word to search in the Find what box. The word can be partial, but it
must appear exactly the same way in the parameter name. Upper or lower case
is considered only if you select the Match case checkbox.
When you click the Find Next button, DriveStudio searches the next parameter
up or down the parameter list depending on the selection in the Direction. The
found parameter is highlighted in the Parameter Browser. When the search
reaches the end of the browser, you can continue the search from the other
end.

34
Chapter 4 – Data Logger view
The drives have data logger(s) that can record data from various signals of the
drive even without being connected to a PC. They are operated with the Data
Logger view. This can be used for troubleshooting or diagnostics, for example.
Data collecting can be stopped by either a specific stop command or
automatically by a triggering condition becoming true in the drive. After
stopping, the collected data can be read to DriveStudio and studied. The Data
Logger view resembles the Monitor window in many aspects.
The Data Logger view is always associated with a single drive and resides in its
window. The window consists of the following parts:
Toolbar
Current logger selection
Graph area
Y-axis
X-axis
Legend area
Status bar
The toolbar has the following buttons:

35
Button Description
Logger Settings button brings up the Logger Settings window
where the logger settings can be modified and the logged
signals selected.
Save button saves the collected logger data to a signal data file.
Read logger data from drive button reads all logger data from
the selected logger of the associated drive and displays it in the
window.
Start button begins recording data in the current logger of the
drive.
Stop button ends recording data in the drive.
Trigger button triggers the associated logger.
Cursor tool button switches on the cursor tool.
Zoom box tool button switches on the zoom box tool that
enlarges a selected area of the graph or zooms in 50% when the
graph is clicked.
Zoom out button zooms out 100% when the graph is clicked.
Reset zoom button restores the original graph scale.
Show numerically button shows the signal values in text format.
Show graphically button shows the signal values in graphical
format.
Show/Hide grid button inserts or removes the graph area grid
lines.
Show all scales/Show selected scale button changes how the
scales are shown on the Y-axis. In All scales mode, DriveStudio
shows the min and max value for all signals. If the scale is
shown only for the selected signal, the value on each horizontal
grid line is also shown.
On the right of the toolbar buttons there are two drop-down menus. One is for
selecting the number of horizontal grid lines and the other selects the current
logger. If the drive supports more than one data logger, you can choose the one
you want to operate with.

36
Graph area
The graph area shows selected signal values. It offers similar functionality as
the Monitor and Data File Viewer windows. The common functionalities are
described in Chapter 8 – Other functions / Graph area functions.
Logger Settings window
The Logger Settings window contains two or more tabs, depending on the
number of supported loggers in the drive. The first tabs are called Logger N,
where N is the ordinal number of the associated logger. The Logger tabs have
some general settings, and you can select the signals that are to be logged. The
last tab is called Triggers, and there you can configure the triggering of the
drive‟s loggers.
Click the OK button to enforce any entered values and close the window. Press
Cancel to ignore changes in the Logger tabs.
In a Logger tab, you can select either Continuous or Single sweep Logger
mode. Single sweep stops recording data when the logger is filled to capacity.
Continuous overwrites the oldest data until the logger is stopped or triggered.
The Sample interval determines how often the logger reads samples of the
signal values in milliseconds. Time level shows the available lengths of the
internal cycle time of the drive. The Sample interval must be a multiple of the
Time level.

37
After triggering, the drive keeps reading the signal values as long as is specified
in the Post-trigger time field in milliseconds.
The Logger capacity panel on the right shows how many samples and how
much memory is consumed and how long the data logging can be done
according to the number of signals, the time level and the sample interval.
The Available signals panel displays a tree of all signals available for logging in
this drive. You can expand and collapse tree branches by clicking the plus and
minus icons, respectively. Click on a signal you want to record and then click
the „>>‟ button. You can also select several signals at once by holding down the
Ctrl key while clicking the tree items. Clicking a group name selects all its
signals.
The Logger signals panel shows a list of signals selected to be recorded. The
ordinal numbers correspond to the Signal colors panel. You can remove a
signal by clicking it to select it, and then clicking the „<<‟ button. The „<< All‟
button removes all signals from the list.
Note! The maximum number of signals that a logger can record at one time
depends on the drive.
The list of logger signals can be saved to a file by clicking the Save button and
retrieved later with the Open button. The Open button is split; clicking the down
arrow on the right displays a list of recently saved files.
If you want to change the color of a signal, click the corresponding square in the
Signal colors panel.
The Active triggers list on the bottom shows all triggers that are set for this
logger. You can select one and click the Edit button, which takes you to the
Triggers tab, where you can modify its settings. Double-clicking does the same.

38
In the Triggers tab, the Triggers list displays the triggers that are currently set in
the loggers of the associated drive. It also shows pending triggers, which have
been configured in DriveStudio but the configuration has not yet been sent to
the drive (by pressing OK). The status of active triggers is shown. Pending
triggers are indicated by a dash. You can select one trigger in the list and edit its
values in the Triggering condition setup panel or remove it with the Remove
button.
The trigger that caused the logger to stop is indicated with a red exclamation
mark. All triggers that have been triggered are indicated by italics.
Adding a trigger
Click the New button to add a new triggering condition. The Triggering condition
setup panel becomes enabled and you can enter the desired values there.
First choose the triggering condition in the Condition drop-down list from the
following choices (some may not be available at all times):
Fault, stops when the drive reports a fault.
Alarm, stops when the drive reports an alarm.
Level – rising edge, stops according to the selected signal, Triggering level
and Hysteresis values.
Level – falling edge, stops according to the selected signal, Triggering level
and Hysteresis values.
Sample count, stops when a set number of samples have been collected.

39
Limit, stops when the drive reports reaching a limit.
The Trigger interval determines how often the trigger conditions are checked.
Time is given in milliseconds. Trigger time level shows the available cycle times
in the drive. The Trigger interval must be a multiple of the Trigger time level.
Note! There is a limited number of triggers in the drive.
If the connected drive supports more than one data logger, you can choose one
in the Logger drop-down list.
With the Level – rising edge and Level – falling edge condition types, a signal
has to be selected in the Available signals panel. After that, enter values for the
Triggering level and Hysteresis. The panel above shows the maximum and
minimum values that can be used for the level condition with the selected
signal.
With the Sample count condition, the number of desired samples has to be
entered into the Number of Samples box.
When you finally click the Add to list button, the new triggering condition is
added to the Triggers list. The pending trigger conditions are sent to the drive
when the OK button is pressed. If the Cancel button is pressed when there are
pending trigger conditions in the Triggers list, those configurations are
discarded.
Similarly, when you click the Remove button, the selected trigger is removed
from the drive when the action is confirmed with the OK button. If the operation
is cancelled using the Cancel button, the trigger is not removed from the drive.
Using level triggers
Triggering to level can occur only after the function is woken up. When using
Level - rising edge condition, the function wakes up when the actual value of the
triggering signal is below the triggering level – hysteresis. In the same way,
when using the Level – falling edge condition, the function wakes up when the
actual value of the triggering signal is above the triggering level + hysteresis.
Note! With solution signals, you can select whether the triggering level and
hysteresis values are given in the internal or scaled float format.
Rising edge
Triggering signal is below triggering level when the data logger is started
triggering occurs when signal goes above the triggering level

40
Triggering signal is above triggering level when the data logger is started
triggering occurs when the signal goes above the triggering level, but
before that the signal must go below the triggering level – hysteresis
Falling edge
Triggering signal is above triggering level when the data logger is started
triggering occurs when signal goes below the triggering level
Triggering signal is below triggering level when data logger is started
triggering occurs when signal goes below the triggering level, but before
that the signal must go above the triggering level + hysteresis

41
Chapter 5 – Fault Logger view
The Fault Logger view displays the contents of the fault logger of a connected
drive.
The Fault Logger view is always associated with a single drive and resides in its
window. The window consists of the following parts:
Button bar
Short Details button shows only the basic information about the faults.
Long Details button shows all the information about the faults.
Clear logger button empties the contents of the fault logger in the drive and
the screen.
Fault list
To get help about the particular fault, click a fault and press F3.
Faults from all drives window
To view the latest faults from all drives at once in a separate window, select the
All faults in all drives menu command in the View menu or the Fault Logger
menu.
Placing and holding the cursor on a fault will display a tooltip containing the
details of the fault. If you double-click a drive, its own window with the iFault
Logger view is brought on top.

42
Chapter 6 – Monitor window
You can use DriveStudio to observe the operation of connected drives. The
Monitor window displays signal values in graphical or numerical format live as
new values are retrieved from connected drives. The monitor data can be saved
to a file for later use.
The Monitor window can be opened with the Monitor button below the Drive List
panel or the View / Monitor menu command.
The Monitor window consists of the following parts:
Toolbar
Graph area
Y-axis
X-axis
Legend area
Status bar

43
The toolbar has the following buttons:
Button Description
Monitor Settings button brings up the Monitor Settings window
where the monitor settings can be modified and the monitored
signals selected.
Save button saves the accumulated monitor data to a signal
data file.
Start button begins recording data in the selected drives and
displaying it on the screen.
Pause button continues recording but pauses or resumes
scrolling the screen.
Stop button ends recording data in the selected drives. The
graph or numerical values remain on the screen.
Cursor tool button switches on the cursor tool.
Zoom box tool button switches on the zoom box tool that
enlarges a selected area of the graph.
Zoom out button restores a previous zoom level.
Reset zoom button restores the original graph scale.
Clear screen button erases the graph or numerical values in the
window and clears the monitor data from computer memory.
Show numerically button shows the signal values in text format.
Show graphically button shows the signal values in graphical
format.
Show/Hide grid button inserts or removes the graph area grid
lines. The number of horizontal grid lines can be selected from
the selection box.
Show all scales/Show selected scale button changes how the
scales are shown on the Y-axis. In all scales mode, DriveStudio
shows the min and max value for all signals. If the scale is
shown only for the selected signal, the value on each horizontal
grid line is also shown.

44
Graph area
The graph area shows selected signal values. It offers similar functionality as
the Data Logger view and the Data File Viewer window. The common
functionalities are described in Chapter 8 – Other functions / Graph area
functions.
When you click the Show numerically button, the graph and legend areas are
replaced with textual values of the selected signals. New values are written to
the top or bottom of the window. You can flip the direction by clicking the Time
stamp header.
General
There is only one Monitor window instance. Saved data files are opened in their
own Data File Viewer windows, which work similarly to the Monitor except for
the Start, Pause and Stop commands.
Monitor Settings window
In the Monitor Settings window, the Signals tab is for some general settings and
selecting the signals that are to be monitored.
Click the OK button to enforce any entered values and close the window. Press
Cancel to ignore graph-related changes in the Signals tab.

45
In the Signals tab, the Available signals panel displays a tree of all connected
drives and their signals and parameters. You can expand and collapse the tree
branches by clicking the plus and minus icons, respectively. Click on a signal
you want to monitor and then click the „>>‟ button. You can also select several
signals at once by holding down the Ctrl key while clicking the tree items.
Clicking a group name selects all its signals
The Monitored signals panel shows a list of signals selected to be monitored.
Their drives are shown too. The ordinal numbers correspond to the Signal
colors panel. You can remove a signal by clicking it to select it, and then clicking
the „<<‟ button. The „<< All‟ button removes all signals from the list.
Note! Only a limited number of signals can be monitored at one time. Extra
signals will be removed from the list when this window is closed. Currently with
the ACSM1 drives, the limit is the first 8 signals.
The list of monitored signals can be saved to a file by clicking the Save button
and retrieved later with the Open button. The Open button is split and clicking
the down arrow on the right displays a list of recently saved files.
If you want to change the color of a signal, click the corresponding square in the
Signal colors panel.
You can set a value for the X-axis length in seconds. This determines how
much of the axis will be shown at one time.
Time level shows the length of the internal cycle of the drive and how often the
signals are updated. The Sample interval determines how often the monitor
reads samples of the signal values in milliseconds.
You can determine a buffer size in the computer‟s memory for storing the signal
values. Enter the number of samples in the Monitor RAM buffer. The Monitor
buffer capacity panel below shows how much memory it consumes and how
long the monitoring can be done according to the number of monitored signals
and the sample interval.

46
Chapter 7 – Data File Viewer window
With this window, you can view signal data files that have been saved in a Data
Logger view or the Monitor window.
This window looks and works almost the same as the Data Logger view or the
Monitor window. The saved file can be opened with the File / Open… menu
command. The window consists of the following parts:
Toolbar
Graph area
Y-axis
X-axis
Legend area
Status bar

47
The toolbar has the following buttons:
Button Description
Cursor tool button switches on the cursor tool.
Zoom box tool button switches on the zoom box tool that
enlarges a selected area of the graph.
Zoom out button restores a previous zoom level.
Reset zoom button restores the original graph scale.
Show numerically button shows the signal values in text format.
Show graphically button shows the signal values in graphical
format.
Show/Hide grid button inserts or removes the graph area grid
lines. The number of horizontal grid lines can be selected from
the selection box.
Show all scales/Show selected scale button changes how the
scales are shown on the Y-axis. In all scales mode, DriveStudio
shows the min and max value for all signals. If the scale is
shown only for the selected signal, the value on each horizontal
grid line is also shown.
Graph area
The graph area shows selected signal values. It offers similar functionality as
the Monitor window and the Data Logger view. The common functionalities are
described in Chapter 8 – Other functions / Graph area functions.

48
Chapter 8 – Other functions
Graph area functions
The Monitor window, Data Logger view and Data File Viewer window all have
similar graph area facilities for displaying signal values. Their usage is
described here.
Graph axes and legend
The graph area shows the selected signal values with different colors. Time
runs on the X-axis. The scales of the signals are shown on the Y-axis.
There are two modes for showing the scales. In the Show all scales mode, each
signal has its own minimum and maximum values on the Y-axis. In the Show
selected scale mode, the scale is shown for the signal, which is selected with
the radio button in front of the signals in the legend. If the grid lines are visible,
the signal‟s value on each horizontal grid line is also shown.
You can modify the minimum and maximum values by clicking them and typing
a new value on the keyboard. Press Enter to enforce the new value or press
Esc to return the previous value. The X-axis length can be modified in the same
way. Only a period is accepted as a decimal separator.
Note! X –axis length of the monitor window must be changed in the monitor
settings
An orange arrowhead on the X-axis indicates where a triggering has occurred.
The legend area below the graph area shows all signals that have been
selected to be monitored, logged or that exist in the data file. Select or clear the
checkbox in front of a signal if you want the signal to be drawn or not drawn,
respectively.
If you click the name of a signal in the legend area, it is highlighted and drawn
on top of the other signals in the graph area. If the Y=0 level of that signal falls
between the minimum and maximum values, it is indicated with a dashed line.
Clicking the signal again removes the highlight and the zero-level line.
Cursor tool
With the cursor tool, you can see the exact values of the signals at one or two
places in time and their differences. Click the Cursor tool button to activate it, if
it isn‟t already active, and move the mouse on the graph area. The mouse
pointer changes into a free cursor line. You can see the signal values in the
legend area in the Y1) column. The time stamp of that moment is shown in the
header.
If you click the primary mouse button in the graph area, a fixed cursor line is
placed at that timestamp. While the mouse button is pressed down, you can
move the cursor line left and right. The signal values at the fixed cursor line can be seen in the Y2) column of the legend area. The timestamp of that moment is
shown in the header.
The time and signal value differences between the free and fixed cursor lines are shown in legend area columns Y2-Y1) and Y1-Y2).

49
You can change the format in which the signal‟s value is shown by clicking the
signal in the legend or in the numerical view with the secondary mouse button.
The selection is used in both graphical and numerical views.
Zoom box tool
With the zoom box tool, you can enlarge the graph and take a closer look at
interesting details. Click the Zoom box tool button to activate it, if it isn‟t already
active. Place the mouse cursor in the graph area and press down the primary
mouse button. This is one of the desired corners. Drag to the opposite desired
corner, and release the button. Upon release, the part of the graph that was
inside the selection rectangle is enlarged to fill the graph area.
If you click the graph area without dragging, the graph is zoomed in by 50% and
the view will be centered on the clicked coordinates.
You can return to a previous zoom level by clicking the Zoom out button. You
can restore the initial scaling values by clicking the Reset zoom button.
Comparing and copying parameters
Using compare function you can find differences between two sets of
parameters. With the copy function, you can transfer parameter values between
drives and files.
These functions are initiated from the Parameter Browser / Compare & copy
parameters… menu command. This opens the following window:
First select Drive or Parameter File for the left and right sides of the dialog box.
The selection list includes all active drives as well as all opened parameter files.
A new file can be opened from the same selection list. You can also select
Compare to default. In this case, the drive or file in the other pane is compared
to its default values, and you can also copy the default values to the drive or file.
If the Linked scrolling and trees checkbox is checked, the parameter trees act
as one. That is, as you open or close a group in one pane, the group in the
other pane is also opened or closed, and the scrolling of a pane affects the
other pane so that the parameter trees stay aligned.

50
The comparison of parameters is done group by group as the groups are
browsed. You can also use the Compare all button to compare the complete
parameter lists at once. If the Show only differences checkbox is checked, only
those parameters or groups that differ are shown. These also include those
parameters and groups that only exist in the other drive or file.
Once you have selected the source or target for both sides of the dialog box,
you have the possibility to select needed parameters to be copied from the drive
or file on the left to the file or drive on the right, or vice versa. You can check the
All checkbox to select all parameters from the source, or you can select only
needed parameters or parameter groups. Note that only writeable parameters
have a checkbox. The checkbox is also missing, if the parameter is missing
from the other document.
All groups have a special checkbox in their row with three states:
empty means that no parameters of this group are checked
triangle means that one or more but not all parameters of this group are
checked
square means that all parameters of this group are selected
Confirmation and Options
You can open this dialog with the Edit / Confirmation and Options menu
command. Here you can set the DriveStudio behavior.
By default, a confirmation is requested only before the fault logger is cleared.
The parameter and status signal values are updated cyclically.

51
Solution programming
You can start the DriveSPC (Solution Program Composer) with the View /
DriveSPC menu command. DriveSPC opens in a new window as a separate
application. With DriveSPC, you can create and modify solution programs that
are executed in the drives.
For information about solution programming, please see the DriveSPC user
manual and the firmware manual of the drive.
Backup and restore
You can create a backup of a selected drive with the Drive / Backup menu
command.
By default, the filename of the backup is the name of the drive. You can select
the folder for backup. Clicking Save will display the following dialog. A typical
backup procedure takes about 30 seconds and ends with the following screen.

52
You can restore a selected drive with the Drive / Restore menu command. The
following screen appears.
Select the backup that you want to restore, and click Open. From the next
dialog, you can either start the restore using the default settings or configure a
custom restore. In a default restore, all available components are restored from
the backup file. Unavailable components are preserved as they are in the drive.
If you select to configure the restore operation, a dialog for doing that is opened.
Select Show file info to check information about the backup file. Here you can
see version information from the backup file and from the drive. Click OK to
continue.

53
Restore is divided into four different sections, and choices for each section can
be changed (if a cam file exists).
For Solution program selecting,
Restore, will restore the solution program from the backup file to the
drive
Preserve, will preserve the existing solution program if it exists in the
drive
Delete, will delete the solution program if it exists in the drive
For Parameters selecting,
All, will restore all parameters from the backup file (will also overwrite
parameters that are written by the solution program)
ID run results, will restore only ID run parameters
All but ID run results, will restore all except ID run results (will also
overwrite parameters that are written by the solution program)
None, will not restore any parameters
Customize, selecting Customize and Edit. Here parameters are divided
into three different groups.

54
ID run results
Fieldbus and encoder
Other Parameters
For each group, you can select the action taken on the restore from three
choices:
Restore: the parameter values are taken from the backup
Preserve: the current values in the drive are not changed
Default: the parameters are set to their default values
Selecting Overrun with application values, means that if there are parameters
that are used by the solution program, the value given by the solution is not
overwritten by other restore actions.
For User Sets, the default selection is to restore the sets from the backup. Use
the checkbox to delete the other sets (if they exist in the drive). Selecting
Customize and Edit, you can select how each user set should be handled with
restore.
For the Cam file, selecting
Restore, will restore the cam file from the backup to the drive
Preserve, will preserve the existing cam file in the drive
Delete, will delete the cam file from the drive

55
Clicking Start restore from the Restore definition screen will display the following
screen.
Clicking Continue opens a dialog indicating the progress of the restore
operation. This ends with the following screen.
If some parameter values could not be written to the drive in the restore, those
are listed after the restore. You can edit their values here.

56
Rename the drive
It is possible to rename the drive from the following dialog. You can activate the
dialog by right-clicking on the drive list tree.
The drive name cannot contain the following characters: { } “ * | < > ? : \ /
Last parameter changes
In the Last parameter changes dialog, you can view the latest parameter value
changes. The maximum number of parameters in the list depends on the drive.
The dialog is opened with the Parameter browser / Last parameter changes…
menu command. Select the drive from the selection list.

57
OPC server settings
In the OPC Server Settings dialog, you can adjust server-specific settings.
These include the modbus node number and the used communication speeds.
The settings can be done separately for each available COM port.
Scan speed is the communication speed DriveStudio uses while it searches for
available drives connected to the COM port. As the connection to a drive has
been established, the communication speed is changed to Comm speed. The
default speeds are 9600 bps for Scan speed and 57600 bps for Comm speed.
The dialog can be opened with the Edit / OPC Server Settings… menu
command.
Wizards
For some drive types, there are wizards to help the commissioning of the drive.
There may also be base-solution-specific wizards. If there are wizards available
for the drive, they can be launched either from the Wizard icon on the drive list
or with the View / Wizard… menu command. These first launch a dialog from
which you can choose which individual wizards to run.

58
Example of a wizard screen (from Profibus wizard):
As you have gone through all the wizards you‟ve selected, you have the
possibility to view a list of parameter value changes made with the wizards.

59
ABB Oy
AC Drives P.O.Box 184 FI-00381 HELSINKI FINLAND Telephone + 358 10 22 11 Fax + 358 10 22 22681 Internet http://www.abb.com
3A
FE
687
49
02
6 R
EV
F E
N
EF
FE
CT
IVE
: 13.4
.2012


