


For defense and commercial markets. Esterline excels whenever need and innovation intersect. When a pilot needs responsive control. When a coating needs to withstand incredible temperatures. When limitations need to be replaced with possibilities, and possibilites need to be realized.
Across technologies.
For defense and commercial markets, Esterline excels whenever need and innovation intersect. When a pilot needs responsive control. When a vital component needs to withstand incredible temperatures. When limitations need to be replaced with possibilities, and possibilites need to be realized.
Across technologies.

Esterline is wherever our customers need us. Not just by phone or fax or e-mail. But one-to-one. In person. From L.A. to London to Lanzhau. Andwe carry with us the expertise, ideas and energyof the more than 7,000 people who are Esterline.
Across borders.

Esterline is a global aerospace resource, offering
customers one-on-one collaborationand a universal toolkit built upon integrated sets of disciplines and experience. These attributes set us – and our ’05 results – apart.
TO OUR SHAREHOLDERS

4 | ESTERLINE 0 5 | To Our Shareholders
Our single-minded focus paid off well in fiscal 2005, with record performance: income from continuing operations was $51.0 million, or $2.02 per diluted share, on sales of $835.4 million. Some of this growth is from acquisitions, but it’s significant to point out that organic sales growth for the year was nearly 16 percent. Boiled down, Esterline’s performance reflects higher sales volumes – due to strengthening customer demand and market share gains – without a proportional increase in our operating expenses. Combined with these excellent financial results, our focus enables us to continue producing better solutions for our customers. That, in turn, allowed us to secure some significant contracts during 2005, including several contracts in which we are a prime or “Tier I” contractor. These projects are a significant step up for a company that has traditionally been a components and sub-systems provider. Even more important, these projects are another way we can meet our customers’ evolving needs.
A strong year across the board
We were very encouraged by the results across the full range of our business during 2005. All of our markets were strong and continue to look solid going forward. Our read on the overall state of the commercial aerospace industry is that we’re in the first stage of a major up-cycle. Despite the short-term disruption to domestic air traffic caused by 2005’s spate of bankruptcies at major air carriers, international and low cost carriers picked up the slack, with load factors and yields improving globally. Orders for new commercial aircraft – from wide bodies to business jets – reached record levels in 2005, and we expect a replacement cycle for North American carriers to kick in at some point, extending the cycle. We are well-positioned on every commercial aircraft platform – new and legacy – and are steadily increasing the amount of content we provide to our important OEM customers. Equally important is the follow-on spare parts business we provide to our airline customers around the world. On the defense side of our business, I believe Esterline is better positioned than many of our peers. We cover thousands of different programs with the U.S. Department of Defense. Similarly, but on a somewhat smaller scale, we are well-positioned with the British Ministry of Defence as well as many other friendly nations’ defense organizations. Our decades-long reputation for quality, safety, and on-time delivery has, in many cases, won for us long-term, sole-source contracts. And, as with our

$835MESTERLINE’S ANNUAL SALES REACHED A RECORD $835.4 MILLION IN FISCAL 2005 DUE TO STRONG DEMAND ACROSS ALL OUR
BUSINESSES, THE CONTRIBUTIONS OF KEY ACQUISITIONS, AND IMPROVEMENTS IN AEROSPACE MARKETS.
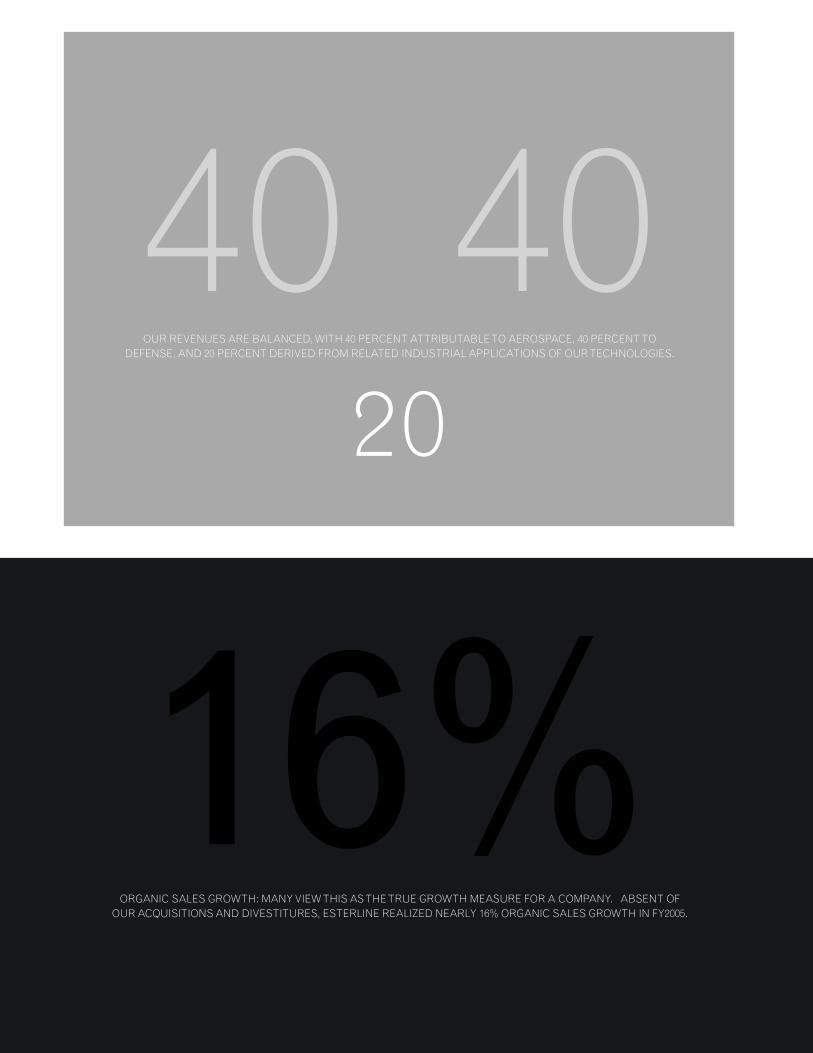
40 40 20
OUR REVENUES ARE BALANCED, WITH 40 PERCENT ATTRIBUTABLE TO AEROSPACE, 40 PERCENT TO DEFENSE, AND 20 PERCENT DERIVED FROM RELATED INDUSTRIAL APPLICATIONS OF OUR TECHNOLOGIES.
16%ORGANIC SALES GROWTH: MANY VIEW THIS AS THE TRUE GROWTH MEASURE FOR A COMPANY. ABSENT OF
OUR ACQUISITIONS AND DIVESTITURES, ESTERLINE REALIZED NEARLY 16% ORGANIC SALES GROWTH IN FY2005.

7 | ESTERLINE 0 5 | To Our Shareholders
commercial aerospace positions, whether it’s a new or a legacy program, our content is increasing as we strengthen our position in the marketplace by bringing more solutions to our customers. I am particularly encouraged by recent acquisitions – Leach International, Palomar Products and Darchem Limited. We’re now clearly seeing the leverage gained from the first two, and expect similar performance from Darchem, which was completed in late December 2005. Leach, acquired in late 2004, is now solidly outperforming our expectations in all significant financial metrics. This year, Leach took a major step forward as it was selected to supply the primary power distribution system on the Airbus A400M, a project I’ll come back to. Palomar was added during the third quarter of our fiscal 2005. Following the acquisition, Palomar announced a contract with Lockheed to provide the secure communications solution for the new US101 Presidential Helicopter program. And Darchem significantly expands our advanced materials capability and market coverage around the globe.
Meeting more of our customers’ needs
I think we are unique in that we are focused so strongly on our customers’ success. As we do things that make our customers more successful, we get pulled along with them in a way that contributes to our own success. And the cycle continues. Three recent project wins illustrate this nicely. In January 2005, we announced Esterline’s first Tier I project: supplying the cockpit control panels for the new Boeing 787 Dreamliner. As the primary integrator for the system, we are responsible for designing, manufacturing, managing sub-tier partners, and delivering the final products directly to Boeing. The panels located in the overhead section of the cockpit are complete systems that include the back-end electronics. The remaining panels, which are located throughout the cockpit, are control panel assemblies that comprise individual switches, lightplates, and knobs. Our major role in this project is enabling us to help produce a cockpit with a totally new look for Boeing. Much the way dashboards in new models of cars look different, the cockpit of the 787 will be rounder, sleeker, and more ergonomically correct. And, in response to Boeing’s call for reduced operating costs and greater efficiencies, we will be using a complete system design approach, meaning the modularity of our hardware and software will make it easier to repair, lowering our customers’ costs over the long term. And AVISTA, part of our Avionics & Controls division, is the primary software developer on the project.
8 | ESTERLINE 0 5 | To Our Shareholders
Our success with Boeing was followed by a second Tier I win, this time with the Rolls Royce-led engine consortium, Europrop International. The contract is to supply the entire sensor package for the TP400M turboprop, the world’s largest engine of its kind. This new engine will power the Airbus A400M Airlifter, Europe’s new tactical military transport. Our role in the project not only includes design and manufacture of the majority of the engine’s sensors, but also includes managing the design and supply of the balance of the full suite of sensor components through other U.S. and European sub-tier partners. Then in March, we were selected by Airbus – through our new Leach International sub-sidiary – to design and manufacture the primary electrical power distribution center for the A400M. This is the main switching system responsible for distributing electrical power from the aircraft’s generators to the main power supply. The assembly will consist of various types of high-amperage Leach power contactors that will include sophisticated levels of protection including monitoring wire thermal stress and sensing potential ground faults. These types of wins will increase engineering costs in the short term. However, it’s impor-tant to understand that this increase, especially as a percent of total sales, will be modest and that the long term potential return is high. I’ve been asked if Tier I projects are the beginning of a trend for Esterline. The answer is yes and no. We intend to be very selective about approaching and taking on these projects. For one thing, we continue to do a lot of work at the component and subassembly level – work that is vital to meeting our customers’ needs – and we recognize the dangers inherent in overextending our ca-pability and capacity. At the same time, we realize that our successes will present additional Tier I opportunities, and we expect to participate in those that make sense in terms of both our capabilities and our willingness to assume the associated risk.
Expanding our toolkit of solutions
Stepping up to Tier I is also another way of expanding our “toolkit of solutions” – our set of capabili-ties – that we are continually refining to help our customers be more successful. Part of this toolkit is the actual products we provide and part of it is the way we provide them. We understand very clearly

1X2OUR BUSINESS ACCOMPLISHED ANOTHER IMPORTANT MILESTONE IN 2005. ESTERLINE BECAME A TIER I SUPPLIER FOR THE
FIRST TIME. AND WE DID SO ON TWO DIFFERENT PLATFORMS: BOEING’S DREAMLINER AND THE AIRBUS AIRLIFTER.
nicheWE REMAIN FOCUSED ON NICHE MARKETS IN OUR COMMERCIAL & DEFENSE BUSINESSES – THESE ARE
DISTINCT MARKET SEGMENTS IN WHICH ESTERLINE CAN MAINTAIN A DOMINANT TECHNOLOGICAL POSITION.

60/40ESTERLINE STRIVES FOR BALANCE AND REDUCED RISK IN EVERY DIMENSION OF OUR BUSINESS. FISCAL 2005
RESULTS FOUND A 60/40 BALANCE BETWEEN U.S. AND FOREIGN GENERATED SALES, RESPECTIVELY.

that the better we are at doing our job, the better we can serve our customers. And the better we serve our customers, the more opportunities we will have to serve them in increasingly significant ways. Clearly, one important element of our toolkit is our manufacturing capability. It’s a func-tion of refined processes and response time combined with the efficiencies that come from being a dedicated lean enterprise. For example, a while back we acquired a product line of illuminated knobs used in avionic applications. At the time of the acquisition, it took 22 weeks to get the product to the customer after an order was placed. Today it takes less than a week. On a larger scale, in 2004 we combined the operations of Mason and Janco into one modern, lean facility. In 2005 we began to see many benefits from the introduction of lean to these two businesses, including higher quality yields, better on-time delivery, and shorter cycle times – all of which have led to improved profitability. These kinds of efficiency improvements are repeated across the company on a regular basis as we continue our lean journey. So it is not just products that go in the toolkit. It is improved systems that result in better delivery. It is increased capability, either through internal development or acqui-sition – such as adding more embedded software to our expanding solutions. It is improved training of our people to enable more efficient operations. In these ways, we keep expanding our capability – our definition of what is in our toolkit. And we continue to implement advanced lean processes in many areas of the company. These processes, of course, can be very effective in enabling us to reduce production costs while maintaining high quality and short cycle times. But of most importance to Esterline, the systems are highly flexible and responsive to customer requirements. Fundamentally, though, we are beyond lean manufacturing – Esterline is lean, period. At the corporate level, we have 40 people running a nearly billion dollar company. And we flow that lean thinking all the way down through the organization. It makes a huge difference because lean really needs to be defined as a culture, not just a process. A company can use lean tools, but unless lean becomes part of the fabric of the culture, lean efforts are destined to fail. So, while we talk about lean manufacturing a lot – and have, I believe, some world-class examples of lean manufacturing – one of the things that makes our financial results so consistent is our emphasis on lean throughout the organization. We are a lean enterprise, not just a lean manufac-turing company.
11 | ESTERLINE 0 5 | To Our Shareholders

Continuous improvement
Esterline has every reason to look ahead to a very positive future. We expect that our bookings, rev-enues, and operating profits will continue to grow. Our research and development activities are strong and not only focused on delivering results for the new programs I’ve already outlined but are designed to be leveraged well into the future. These factors, combined with new business inquiry activity and solid orders across the board, promise strength and new opportunities for next year and beyond. But the biggest reason for my confidence in the future is the more than 7,000 Esterline employees around the world. Every day, across markets, across technologies and across borders, they prove that focusing on our customers’ success ensures our own. A portfolio manager recently said to me, “You just continue to do what you said you would do.” It was the highest possible praise. Esterline’s reputation with our investors and customers is built around the drive for consistent performance – just doing what we say we’re going to do a little bit better every day. And so, to that portfolio manager and to everyone else involved with our company, I can assure you that we intend to keep doing what we say we will do. And we will continue to do it in ways that provide our customers with better and better solutions.
Robert W. CreminChairman, President and Chief Executive Officer
12 | ESTERLINE 0 5 | To Our Shareholders
05

To any place. At any time.For every customer.
Begin with the customer. Face to face. Person to person. One on one. Every Esterline solution begins with this kind of close collaboration between our applications engineers and our customers. Collaboration that continues through research and development, manu-facturing, testing, and delivery. Collaboration that can develop beyond the customer to include other Esterline applica-tions engineers. Sharing knowledge across product lines and company boundaries enables us to expand the reach of our technologies and produce a broader toolkit of solutions. That’s true whether we’re developing infrared decoy flares in Arkansas, aircraft power distribution systems in France, or input panels for medical devices in China. And it’s true for every customer, every time.
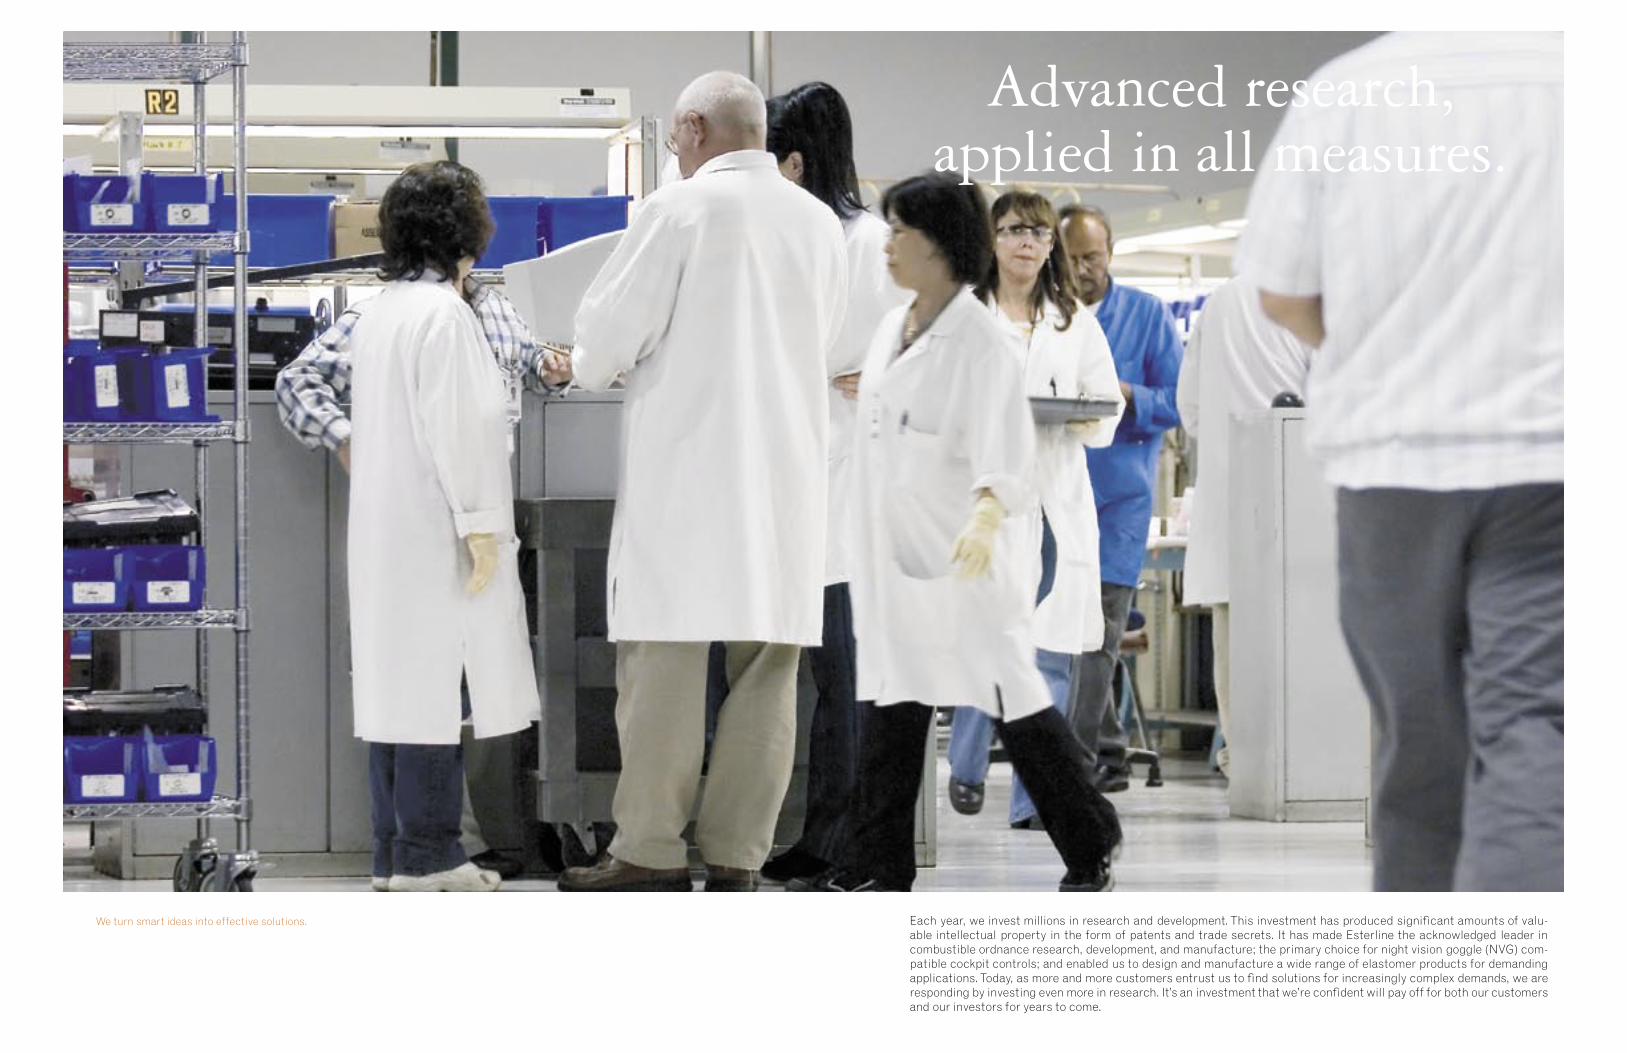
Advanced research, applied in all measures.
We turn smart ideas into effective solutions. Each year, we invest millions in research and development. This investment has produced significant amounts of valu-able intellectual property in the form of patents and trade secrets. It has made Esterline the acknowledged leader in combustible ordnance research, development, and manufacture; the primary choice for night vision goggle (NVG) com-patible cockpit controls; and enabled us to design and manufacture a wide range of elastomer products for demanding applications. Today, as more and more customers entrust us to find solutions for increasingly complex demands, we are responding by investing even more in research. It’s an investment that we’re confident will pay off for both our customers and our investors for years to come.

Solutions, developedand engineered to deliver.
More than 10,000 Esterline solutions – and counting. Esterline solutions don’t just have to work. They have to work without fail. And they have to work without fail under the most demanding conditions imaginable. On commercial airliners. Inside sophisticated jet engines. On military fighters, transports, and helicopters. In the heat of battle. Our products need to withstand extraordinary temperature extremes, harsh environments, vibration, sometimes even nuclear, biological and chemical warfare. And they do. Time after time, solution after solution. The reason is simple: that’s how we engineer them. This is why Boeing trusts Esterline to provide more than 80 components in critical areas of the F-18 Super Hornet, its premier strike fighter. It’s just one of the more than 10,000 Esterline solutions that are developed and engineered to deliver.

Efficient manufacturemeets unerring accuracy.
Techniques that spell lean. Lean manufacturing is a concept that has been tossed around so much it has almost lost its meaning. Not to us. At Esterline, we believe in lean because it works. But only if it’s part of the fabric of the entire enterprise. And, at Esterline, it is. It starts with an open environment in which everyone helps determine the best, most efficient way to produce a given product. An environment in which people are fully engaged in the entire production process. When that happens, delivery times improve. Response times improve. And quality improves. This kind of environment is critically important in a business where there is simply no room for error. After all, we understand that lean isn’t just about doing things more efficiently. It’s about doing them better.

Matching our expectationsto those of our customers.
Maintaining high quality and consistency across decades. Our customers are very clear about their expectations: they expect the best. Understandable, since lives are riding on virtually every solution we provide. But, more and more, a single best product isn’t enough. Our customers expect fewer sources to provide them with more comprehensive solutions. We’ve met those expectations by developing the ability to not just deliver products, but entire projects. That’s why Boeing selected us to provide cockpit control panels for the new Boeing 787. And why Rolls Royce is contracting with us to supply the entire suite of sensors for the TP400 turboprop, the engine that will power Europe’s new tactical military transport, the Airbus A400M Airlifter. In every measure, customers expect our solutions to not just meet standards, but set them.

Living the cliché:On time and on budget.
It means constant collaboration – always searching for ways to do our work better. To others it may be a cliché. But to us it’s a mantra. In our world, schedule and budget tolerances are as tight as those on the highly engineered products we manufacture. So we’re relentless not just about delivering products of the highest quality, but also about delivering them when and how the customer expects them. That means always looking for ways to do things better. Case in point: after acquiring a product line of avionic illuminated knobs, we cut the time it took to get a product to the customer from 22 weeks to less than one. If it touches any of our stakeholders – customers, investors, or employees – we’re never satisfied with less than top performance. On time. On budget. On every product. It may be a cliché, but it’s one we live by.

So that our customers remain our customers.
Stay with the customer. Our best path to growth is to ensure that our existing customers remain our customers. That’s why we work so hard to deliver what we say we will. It’s the only way that will bring them back to Esterline for even more solutions. Our steadfast insistence on “customer first” has earned Esterline valued relationships that go back decades. Our solutions have been part of every Boeing commercial aircraft platform manufactured in the past 65 years. And we have provided innovative aerospace clamping solutions for commercial and defense programs for more than 50 years. Yet we realize that every delivery is really a new beginning. An opportunity to set out on a journey of collaboration and innovation that will lead to a new solution. A journey we will take to any place, at any time, for every customer.

01 02 03 04 05 01 02 03 04 05
Financial Charts. Fiscal 2001 - 2005.
Net Sales in millions
413.2 421.7
549.1613.6
$ 835.4
Income fromContinuingOperationsin millions
46.2
28.5 28.1 29.4
$ 51.0
Diluted EPS fromContinuing Operations in dollars
2.31
1.35 1.33 1.37
$2.02
Shareholders’ Equity in millions
351.8 357.2396.1
461.0
$620.9

Esterline 2005 Financial Report

31 | Management’s Discussion & Analysis 50 | Selected Financial Data 52 | Consolidated Statements59 | Notes to Consolidated Financial Statements 96 | Directors and Officers 97 | Investor Information 98 | Operations
05

31 | ESTERLINE 0 5 | Management’s Discussion and Analysis
Management’s Discussion and Analysis of Financial Condition and Results of Continuing Operations
Overview
We operate our businesses in three segments: Avionics & Controls, Sensors & Systems and Advanced Materials.
The Avionics & Controls segment designs and manufactures technology interface systems for military and
commercial aircraft and land- and sea-based military vehicles, secure communications systems, specialized
medical equipment, and other industrial applications. The Sensors & Systems segment produces high-precision
temperature and pressure sensors, micro-motors, motion control sensors, and other related systems, principally
for aerospace and defense customers. The Advanced Materials segment develops and manufactures high-
performance elastomer products used in a wide range of commercial aerospace and military applications and
combustible ordnance components and electronic warfare countermeasure devices for military customers. Sales
in all segments include domestic, international, defense and commercial customers.
Our current business and strategic plan focuses on the continued development of our products in three key
technology segments: avionics and controls, sensors and systems and specialized high-performance elastomers
and other complex materials, principally for aerospace and defense markets. We are concentrating our efforts to
expand our capabilities in these markets and to anticipate the global needs of our customers and respond to such
needs with comprehensive solutions. These efforts focus on continuous research and new product development,
acquisitions and strategic realignments of operations to expand our capabilities as a more comprehensive supplier
to our customers across our entire product offering. On December 16, 2005, we acquired all of the outstanding
capital stock of Darchem Holdings Limited (Darchem), a $70 million (estimated annual sales) manufacturer of
thermally engineered components for critical aerospace applications for U.K. £67.5 million in cash (approximately
$120.0 million), subject to adjustment based on the amount of cash and net working capital of Darchem as of closing.
Darchem holds a leading position in its niche market and fits our engineered-to-order model and will be included
in our Advanced Materials segment. On June 3, 2005, we acquired all of the outstanding capital stock of Palomar
Products, Inc. (Palomar), a $25 million (estimated annual sales) manufacturer of secure military communications
products, for approximately $21.3 million in cash before a $4.2 million escrow deposit, acquisition costs and the
estimated change in net equity value from December 31, 2004 to closing. A purchase price adjustment is payable to
the seller contingent upon achievement of financial results through December 31, 2005. Palomar’s products extend
the Company’s avionics and controls product lines.
On January 28, 2005, we completed the sale of the outstanding stock of our wholly owned subsidiary Fluid
Regulators Corporation (Fluid Regulators), which was included in our Sensors & Systems segment, for
approximately $23.7 million. As a result of the sale, we recorded a gain of approximately $7.0 million, net of tax of
$2.4 million, in the first fiscal quarter of 2005.
On July 25, 2002, our Board of Directors adopted a formal plan for the sale of the assets and operations of our
former Automation segment. Upon the final disposition of our discontinued Automation operations in the fourth
fiscal quarter of 2004, we recorded an $8.0 million gain, net of $4.5 million in tax, including the reversal of estimated
reserves, which were recognizable upon the sale of the business.
On May 13, 2005, we closed a small unit in our Other segment and incurred $0.4 million in severance, net of
$0.2 million in tax, in the second quarter of fiscal 2005.
The dispositions and closure described above are reported as discontinued operations and the consolidated
financial statements for all prior periods have been adjusted to reflect this presentation.

32 | ESTERLINE 0 5 | Management’s Discussion and Analysis
Results of Continuing Operations
Fiscal 2005 Compared with Fiscal 2004Sales for fiscal 2005 increased 36.1% over the prior year. Sales by segment were as follows:
Increase (Decrease)
Dollars In Thousands From Prior Year 2005 2004
Avionics & Controls 24.8% $ 261,550 $ 209,498
Sensors & Systems 76.8% 319,539 180,768
Advanced Materials 13.9% 254,314 223,344
Total $ 835,403 $ 613,610
The 24.8% increase in Avionics & Controls reflected incremental sales from the Leach medical and Palomar
business units, higher sales of cockpit controls, and increased sales volumes of aftermarket cockpit switches.
These increases were partially offset by lower sales of technology interface systems for land-based military
vehicles.
The 76.8% increase in Sensors & Systems principally reflected $107.7 million in incremental sales from the
Leach acquisition, enhanced sales of temperature and pressure sensors, and motion control distribution sales
to the British Ministry of Defence (British MoD). The increase also reflected a stronger euro relative to the U.S.
dollar, as the average exchange rate from the euro to the U.S. dollar increased from 1.22 in fiscal 2004 to 1.27 in fiscal
2005.
The 13.9% increase in Advanced Materials reflected higher sales of flare countermeasure devices, elastomer
material and increased sales at our metal finishing unit. These increases were partially offset by lower sales of
combustible ordnance due to reduced U.S. Army requirements.
Sales to foreign customers, including export sales by domestic operations, totaled $345.8 million and
$244.2 million, and accounted for 41.4% and 39.8% of our sales for fiscal 2005 and 2004, respectively.
Overall, gross margin as a percentage of sales was 31.4% and 31.8% for fiscal 2005 and 2004, respectively.
Avionics & Controls segment gross margin was 33.3% and 33.7% for fiscal 2005 and 2004, respectively, reflecting
a higher mix of lower margin medical equipment sales. The impact from medical equipment sales was partially
offset by a higher mix of aftermarket product and cockpit controls sales and software support services performed
by our AVISTA unit. Additionally, gross margin in fiscal 2004 reflected plant relocations and consolidation of
facilities. Mason Electric Co. and Janco Corporation moved from their respective facilities to one new facility.
This move required more time to execute than originally anticipated, resulting in higher than expected moving
expenses, operating inefficiencies and delayed shipments. Sensors & Systems segment gross margin was 34.5%
and 36.5% for fiscal 2005 and 2004, respectively. The decrease in Sensors & Systems gross margin from fiscal 2004
was largely a result of a higher sales mix of electrical power switching, control and data communication devices
sold by Leach. Leach products tend to have a lower gross margin on average than other products included in the
Sensors & Systems segment. A loss provision on shipments of off-spec products also contributed to the decrease
in gross margin. Gross margin was also impacted by a weaker U.S. dollar compared to the euro on U.S. dollar-
denominated sales and euro-based cost of sales. Advanced Materials segment gross margin was 25.3% and 26.1%
for fiscal 2005 and 2004, respectively. Lower sales volumes of combustible ordnance and incremental start-up costs
on certain flare countermeasure devices were partially offset by improved gross margins at our elastomer material
and metal finishing operations. Comparing fiscal 2005 and fiscal 2004, our elastomer material gross margins were
aided by lower integration and workers’ compensation expenses and higher sales volumes to aerospace customers,
resulting in an increased recovery of fixed expenses. In fiscal 2004, our elastomer material operations were impacted
by certain operational inefficiencies from integrating acquired businesses, which resulted in higher labor costs.
Improved gross margins at our metal finishing operations reflected an improved recovery of fixed expenses due to
higher sales and increased selling prices.

33 | ESTERLINE 0 5 | Management’s Discussion and Analysis
Selling, general and administrative expenses (which include corporate expenses) increased to $137.4 million in
fiscal 2005 compared with $118.7 million in fiscal 2004. Selling, general and administrative expenses include stock
option expense of $2.8 million and $4.3 million in fiscal 2005 and 2004, respectively. These are non-cash charges
resulting from mark-to-market adjustments under the variable method of accounting. The increase in selling,
general and administrative expenses primarily reflected incremental selling, general and administrative expenses
from the Leach acquisition partially offset by certain expense reductions at Sensors & Systems operations and the
decrease in stock option expense. As a percentage of sales, selling, general and administrative expenses were
16.5% and 19.4% in fiscal 2005 and 2004, respectively. The decrease in selling, general and administrative expense
as a percentage of sales principally reflected $4.5 million in severance expense in our Sensors & Systems segment
incurred in the prior-year period, lower stock option expense and higher sales volumes without a proportional
increase in the expense during fiscal 2005.
Research, development and related engineering spending increased to $42.2 million, or 5.1% of sales, in fiscal
2005 compared with $25.9 million, or 4.2% of sales, in fiscal 2004. The increase in research, development and related
engineering largely reflects spending on the A400 primary power distribution assembly, TP400 engine sensors, 787
overhead panel control and 787 environmental control programs. Research, development and related engineering
spending is expected to continue to increase in fiscal 2006 before returning to more historical levels.
Segment earnings (which exclude corporate expenses) increased 55.8% during fiscal 2005 to $105.8 million
compared to $67.9 million in the prior year. Avionics & Controls segment earnings were $37.3 million for fiscal 2005
compared with $32.1 million in fiscal 2004 and reflected increased earnings from higher sales of cockpit controls
to the aftermarket and OEM customers. These earnings included a $3.1 million increase in research, development
and engineering spending. Avionics & Controls results were partially offset by weaker earnings from medical
equipment operations. Comparatively, fiscal 2004 Avionics & Controls earnings were impacted by the relocation
and consolidation of facilities. Stock option expense was $0.7 million and $1.0 million in fiscal 2005 and 2004,
respectively.
Sensors & Systems segment earnings were $34.5 million for fiscal 2005 compared with $7.8 million in fiscal
2004. The increase in Sensors & Systems earnings from fiscal 2004 reflected incremental earnings from the Leach
acquisition, higher sales volumes, and lower severance expenses. Sensors & Systems earnings also reflected a
$13.1 million increase in research, development and engineering spending which was principally incurred by our
Leach units. The decrease in severance expense compared with fiscal 2004 reflected $4.5 million in severance and
legal costs incurred in the first fiscal quarter of 2004. Sensors & Systems earnings also reflected the impact of a
weaker U.S. dollar relative to the euro on U.S. dollar-denominated sales and euro-based operating expenses. Stock
option expense was $0.4 million and $0.8 million in fiscal 2005 and 2004, respectively.
Advanced Materials segment earnings were $34.0 million for fiscal 2005 compared with $28.0 million for fiscal
2004. Advanced Materials earnings reflected higher sales and earnings from our elastomer and metal finishing
operations. Advanced Materials earnings were impacted by lower sales and earnings at our combustible ordnance
operations, and higher operating expenses at our flare countermeasure operations. Stock option expense was
$1.3 million and $1.5 million in fiscal 2005 and 2004, respectively.
During the fourth quarter of fiscal 2004, we sold a product line in our Sensors & Systems segment and recorded
a gain of $3.4 million. The gain is reflected in Other Expense, Net.
Interest income increased to $4.1 million during fiscal 2005 compared with $2.0 million in fiscal 2004, reflecting
interest earned on increased balances of cash and cash equivalents and short-term investments. Interest expense
increased to $18.2 million during fiscal 2005 compared with $17.3 million in the prior year, due to the increased
interest rate on our variable rate borrowing. In September 2003, we entered into an interest rate swap agreement
on $75.0 million of our Senior Subordinated Notes due in 2013. The swap agreement exchanged the fixed interest
rate for a variable interest rate on $75.0 million of the $175.0 million principal amount outstanding.
The effective income tax rate for continuing operations for fiscal 2005 was 24.1% compared with 24.6% in fiscal
2004. The effective tax rate was lower than the statutory rate, as both years benefited from various tax credits and
deductions. In addition, in fiscal 2005, we recognized a $2.0 million reduction of previously estimated tax liabilities

34 | ESTERLINE 0 5 | Management’s Discussion and Analysis
due to the expiration of the statute of limitations and adjustments resulting from a reconciliation of U.S. and non-
U.S. tax returns to the provision for income taxes. In fiscal 2004, we recognized a $1.9 million reduction of previously
estimated tax liabilities as a result of receiving a Notice of Proposed Adjustment (NOPA) from the Internal Revenue
Service covering the audit of research and development tax credits for fiscal years 1997 through 1999. Due to the
NOPA and the expectation of a similar result for fiscal years 2000 through 2003, we revised our estimated liability
for income taxes as of January 30, 2004. The current year’s results benefited from the 18-month extension by the
U.S. Congress of the Research and Experimentation Credit (R&D credit) from June 30, 2004 to December 31, 2005.
As the R&D credit is scheduled to expire on December 31, 2005, we anticipate a significantly reduced benefit in
fiscal 2006. In addition, the U.S. Congress passed a bill that phases out certain export incentives beginning in fiscal
2005, which will slightly increase our effective tax rate. We expect this increase to be more than offset beginning in
fiscal 2006 by the phase-in of tax incentives for domestic manufacturing. While one of the provisions of this tax bill
allows for the repatriation of undistributed earnings of foreign subsidiaries at potentially favorable rates through
fiscal 2005, our accumulated earnings of foreign subsidiaries are considered indefinitely reinvested. Accordingly,
Esterline will not repatriate funds and take advantage of these favorable repatriation rules.
Income from continuing operations was $51.0 million, or $2.02 per share on a diluted basis, compared with
$29.4 million, or $1.37 per share, in fiscal 2004. Net earnings were $58.0 million, or $2.29 per share on a diluted basis
in fiscal 2005, compared with net earnings of $39.6 million, or $1.84 per share, in fiscal 2004. Net earnings in fiscal
2005 included net income of $7.0 million, or $.27 per share, from discontinued operations. Net earnings in fiscal 2004
included net income of $10.2 million, or $.47 per share, from discontinued operations.
New orders for fiscal 2005 were $894.4 million compared with $742.8 million for fiscal 2004. Avionics & Controls
orders for fiscal 2005 increased 24.4% from the prior-year period and reflected the acquisitions of the Leach
medical and Palomar units. Sensors & Systems orders for fiscal 2005 increased 26.5% from the prior-year period
and reflected the acquisition of Leach. Advanced Materials orders for fiscal 2005 increased 9.1% from the prior-
year period and reflected increased aerospace orders and was partially offset by lower program requirements for
combustible ordnance. Backlog at the end of fiscal 2005 was $482.8 million compared with $423.8 million at the end
of the prior year. The increase in backlog principally reflects the Palomar acquisition. Approximately $234.6 million
is scheduled to be delivered after fiscal 2006. Backlog is subject to cancellation until delivery.
Fiscal 2004 Compared with Fiscal 2003Sales for fiscal 2004 increased 11.7% over the prior year. Sales by segment were as follows:
Increase (Decrease)
Dollars In Thousands From Prior Year 2004 2003
Avionics & Controls 5.7% $ 209,498 $ 198,249
Sensors & Systems 34.7% 180,768 134,228
Advanced Materials 3.1% 223,344 216,655
Total $ 613,610 $ 549,132
The 5.7% increase in Avionics & Controls principally reflected incremental sales from the Leach medical unit
and AVISTA acquisitions, increased sales of technology interface systems for land-based military vehicles, higher
sales of cockpit grips and controls, and increased sales volumes of aftermarket cockpit switches. These increases
were partially offset by lower sales volumes of specialized medical equipment and, specifically, defense related
cockpit switch sales which last year benefited from a defense retrofit program.
The 34.7% increase in Sensors & Systems principally reflected $63.8 million in incremental sales from the Leach
and Weston Group acquisitions, and was partially offset by a reduction in distribution sales to the British Ministry
of Defence (British MoD) and the sale of two small product lines in the second quarter of fiscal 2003 and fourth
quarter of fiscal 2004, respectively. The increase also reflected a stronger euro relative to the U.S. dollar, as the
average exchange rate from the euro to the U.S. dollar increased from 1.09 in fiscal 2003 to 1.22 in fiscal 2004.

35 | ESTERLINE 0 5 | Management’s Discussion and Analysis
The 3.1% increase in Advanced Materials reflected higher sales of flare countermeasure devices and elastomer
sales to aerospace and industrial commercial customers and was partially offset by lower sales of combustible
ordnance due to reduced U.S. Army requirements. Additionally, certain elastomer material sales declined due to
lower requirements from defense customers.
Sales to foreign customers, including export sales by domestic operations, totaled $244.2 million and
$184.3 million, and accounted for 39.8% and 33.6% of our sales for fiscal 2004 and 2003, respectively.
Overall, gross margin as a percentage of sales was 31.8% and 31.4% for fiscal 2004 and 2003, respectively.
Avionics & Controls segment gross margin was 33.7% for both fiscal 2004 and 2003, reflecting lower sales volumes
and margins on specialized medical equipment and cockpit switches, offset by a higher mix of aftermarket product
sales, incremental gross margin from the AVISTA acquisition and strong fourth quarter performance at our
Mason Electric (Mason) operation. In the third quarter of fiscal 2004, Mason and Janco Corporation moved from
their separate facilities to one new facility. This move required more time and expense to execute than originally
anticipated, resulting in higher than expected moving expenses, operating inefficiencies and delayed shipments.
By the fourth quarter, the combined operation had substantially reduced delinquent shipments and operating
inefficiencies which had resulted from the move. Sensors & Systems segment gross margin was 36.5% and 32.8%
for fiscal 2004 and 2003, respectively. The increase in Sensors & Systems gross margin from fiscal 2003 was largely
due to the Weston Group acquisition and its higher margin product mix. Gross margin was also impacted by a
weaker U.S. dollar compared to the euro on U.S. dollar-denominated sales and euro-based cost of sales. Advanced
Materials segment gross margin was 26.1% and 28.3% for fiscal 2004 and 2003, respectively. The decrease in Advanced
Materials gross margin from fiscal 2003 reflected an unfavorable sales mix of lower margin countermeasure devices
and certain operational inefficiencies from integrating acquired businesses, which resulted in higher labor costs at
our elastomer operations.
Selling, general and administrative expenses (which include corporate expenses) increased to $118.7 million in
fiscal 2004 compared with $105.3 million in fiscal 2003. Selling, general and administrative expenses include stock
option expense of $4.3 million and $1.4 million in fiscal 2004 and 2003, respectively, which are non-cash charges
resulting from mark-to-market adjustments under the variable method of accounting. The increase in selling,
general and administrative expenses primarily reflected incremental selling, general and administrative expenses
from the Leach, Weston Group and AVISTA acquisitions and the increase in stock option expense, partially offset
by expense reductions at Sensors & Systems and our Advanced Materials elastomer operations. As a percentage
of sales, selling, general and administrative expenses were 19.4% and 19.2% in fiscal 2004 and 2003, respectively.
Research, development and related engineering spending increased to $25.9 million, or 4.2% of sales, in fiscal
2004 compared with $17.8 million, or 3.2% of sales, in fiscal 2003. This is consistent with our philosophy of continually
investing in new products and capabilities regardless of the business cycle. Additionally, the increase in research,
development and related engineering expense reflects the requirement to fund development for new programs for
our OEM customers.
Segment earnings (which exclude corporate expenses) increased 2.1% during fiscal 2004 to $67.9 million
compared to $66.5 million in fiscal 2003. Avionics & Controls segment earnings were $32.1 million for fiscal 2004
compared with $29.5 million in fiscal 2003. The increase in Avionics & Controls reflected incremental earnings
from the AVISTA acquisition, higher sales of controls and grips, and technology interface systems for land-based
military vehicles. Avionics & Controls earnings were impacted by the shipment of acquired inventories of the
Leach medical unit, which were valued at fair market value at acquisition in accordance with generally accepted
accounting principles. Stock option expense was $1.0 million and $0.3 million in fiscal 2004 and 2003, respectively.
Sensors & Systems segment earnings were $7.8 million for fiscal 2004 compared with $8.3 million in fiscal 2003.
The decrease in Sensors & Systems earnings reflected $4.5 million in severance and early retirement expense,
including legal expenses covering 55 employees in engineering, production, quality, research and development and
administration functions. Sensors & Systems earnings reflected a decline in temperature and pressure sensors
sales and sales to the British MoD for which we act as a distributor, as well as higher selling and engineering

36 | ESTERLINE 0 5 | Management’s Discussion and Analysis
development expenses for motion control products. Furthermore, Sensors & Systems earnings were impacted by
the shipment of acquired inventories of the Leach acquisition, which were valued at fair market value at acquisition,
as well as the effect of a weaker U.S. dollar relative to the euro on U.S. dollar-denominated sales and euro-based
operating expenses. These decreases were partially offset by incremental earnings from the Weston Group
acquisition and the impact of the shipment in fiscal 2003 of acquired inventories of the Weston Group, which were
valued at fair market value at acquisition. Stock option expense was $0.8 million and $0.2 million in fiscal 2004 and
2003, respectively.
Advanced Materials segment earnings were $28.0 million for fiscal 2004 compared with $28.7 million in
fiscal 2003. The decrease in Advanced Materials earnings reflected mixed results. Combustible ordnance and
countermeasure operations were impacted by lower sales volumes of higher margin combustible ordnance and
increased maintenance expenses at our flare countermeasure operation. Additionally, our elastomer material
operations were impacted by acquisition integration expenses, production inefficiencies and higher workers’
compensation expenses, while earnings from our specialized metal finishing unit were favorably impacted by the
elimination of redundant facilities, improved cost control and increased sales prices. Stock option expense was
$1.5 million and $0.5 million in fiscal 2004 and 2003, respectively.
During the fourth quarter of fiscal 2004, we sold a product line in our Sensors & Systems segment and recorded
a gain of $3.4 million. During the third quarter of fiscal 2003, we recorded a foreign currency gain of approximately
$2.7 million upon the settlement of foreign currency forward contracts related to the completion of the Weston
acquisition. These gains are reflected in Other Expense, Net.
Interest income increased to $2.0 million during fiscal 2004 compared with $0.9 million in fiscal 2003, reflecting
interest earned on a U.S. income tax refund. Interest expense increased to $17.3 million during fiscal 2004
compared with $12.0 million in fiscal 2003, due to the full year effect of the issuance of $175.0 million in 7.75% Senior
Subordinated Notes due June 15, 2013. In September 2003, we entered into an interest rate swap agreement on
$75.0 million of our Senior Subordinated Notes due in 2013. The swap agreement exchanged the fixed interest rate
for a variable interest rate on $75.0 million of the $175.0 million principal amount outstanding.
The effective income tax rate for continuing operations for fiscal 2004 was 24.6% compared with 30.7% in fiscal
2003. On February 4, 2004, we received a Notice of Proposed Adjustment (NOPA) from the Internal Revenue Service
covering the audit of research and development tax credits for fiscal years 1997 through 1999. As a result of the
NOPA and the expectation of a similar result for fiscal years 2000 through 2003, we revised our estimated liability
for income taxes during the first quarter of fiscal 2004. The revision resulted in a $1.9 million reduction of previously
estimated tax liabilities. The effective tax rate differed from the statutory rate in fiscal 2004 and 2003, as both years
benefited from various tax credits. The current year’s results benefited from the 18-month extension by the U.S.
Congress of the Research and Experimentation Credit from June 30, 2004 to December 31, 2005.
Income from continuing operations was $29.4 million, or $1.37 per share on a diluted basis, compared with
$28.1 million, or $1.33 per share, in fiscal 2003. Net earnings were $39.6 million, or $1.84 per share on a diluted basis
in fiscal 2004, compared with net earnings of $22.8 million, or $1.08 per share, in the prior year. Net earnings in fiscal
2004 included net income of $10.2 million, or $.47 per share, from discontinued operations. Net earnings in fiscal
2003 included a loss of $5.3 million, or ($.25) per diluted share, from discontinued operations.
New orders for fiscal 2004 were $742.8 million compared with $567.8 million for fiscal 2003. Avionics & Controls
orders for fiscal 2004 increased 34.8% from fiscal 2003 and reflected the acquisition of the Leach medical unit and
AVISTA and a $7.3 million cockpit panel retrofit order. Sensors & Systems orders for fiscal 2004 increased 89.6%
from fiscal 2003 and reflected the acquisitions of Leach and Weston. Advanced Materials orders for fiscal 2004
decreased 6.2% from fiscal 2003 and reflected lower program requirements for combustible ordnance. Backlog at
the end of fiscal 2004 was $423.8 million compared with $294.6 million at the end of the prior year. The increase in
backlog principally reflects the Leach acquisition.

37 | ESTERLINE 0 5 | Management’s Discussion and Analysis
Liquidity and Capital Resources
Working Capital and Statement of Cash Flows
Cash and cash equivalents and short-term investments at the end of fiscal 2005 totaled $181.0 million, an increase
of $151.5 million from the prior year. Net working capital increased to $265.2 million at the end of fiscal 2005 from
$173.0 million at the end of the prior year. Sources of cash flows from operating activities principally consist of cash
received from the sale of products offset by cash payments for material, labor and operating expenses. Cash flows
from operating activities were $76.4 million and $63.3 million in fiscal 2005 and 2004, respectively. The increase
principally reflected higher net earnings and an increase in accrued liabilities. Cash flows used by investing activities
were $91.5 million and $144.7 million in fiscal 2005 and 2004, respectively. Cash used for acquisitions of businesses
decreased by $110.6 million and purchases of short-term investments increased by $173.3 million in fiscal 2005
compared to fiscal 2004. Additionally, proceeds from the sale of short-term investments increased $99.2 million and
proceeds from the sale of discountinued operations increased by $11.4 million in fiscal 2005 compared with fiscal
2004. The increase in cash provided by financing activities principally reflected the net proceeds of $108.5 million
from our public offering of 3.7 million shares of common stock completed on November 24, 2004, partially offset by
the repayment of $30.0 million of the 1999 Senior Notes in accordance with their terms in the prior-year period.
Subsequent to October 28, 2005, we increased our U.S. credit facility from $60.0 million to $100.0 million. The
credit facility is secured by substantially all of Esterline’s assets. The credit agreement contains covenants,
including but not limited to, restrictions on liens, making certain investments in third parties, capital expenditures,
incurrence of additional indebtedness, repurchase of our common stock, declaration of dividends, and certain asset
dispositions. In addition, the credit agreement requires that we comply with certain financial covenants, including
maximum leverage ratio and a fixed charge coverage ratio.
Capital Expenditures
Net property, plant and equipment was $138.2 million at the end of fiscal 2005 compared with $145.1 million at the
end of the prior year. Capital expenditures for fiscal 2005 were $23.8 million (excluding acquisitions) and included
machinery and equipment and enhancements to information technology systems. Capital expenditures are
anticipated to approximate $22.0 million for fiscal 2006. We will continue to support expansion through investments
in infrastructure including machinery, equipment, buildings and information systems.
Debt Financing
Total debt decreased $8.4 million from the prior year to $248.6 million at the end of fiscal 2005. Total debt outstanding
at the end of fiscal 2005 consisted of $175.0 million under our Senior Subordinated Notes, $70.0 million under our
1999 Senior Notes and $3.6 million under our credit facility and various foreign currency debt agreements, including
capital lease obligations. The Senior Subordinated Notes are due June 15, 2013 at an interest rate of 7.75%. In
September 2003, we entered into an interest rate swap agreement on $75.0 million of our Senior Subordinated
Notes due in 2013. The swap agreement exchanged the fixed interest rate for a variable interest rate on $75.0 million
of the $175.0 million principal amount outstanding. On November 15, 2005, $30.0 million of the 6.4% Senior Notes
matured and was paid. Additionally, on November 15, 2005, we exercised our option under the terms of the Note
Purchase Agreement, dated as of November 1, 1998, to prepay the outstanding principal amount of $40.0 million
of the 6.77% Senior Notes due November 15, 2008. Under the terms of the Note Purchase Agreement, we paid an
additional $2.0 million to the holders of the 6.77% Senior Notes as a prepayment penalty. The payment of the $2.0
million prepayment penalty will be accounted for as a loss on extinguishment of debt in the first quarter of fiscal
2006.
On December 16, 2005, we acquired all of the outstanding capital stock of Darchem Holdings Limited. We financed
the Darchem acquisition using cash on hand and approximately $80.0 million provided through a December 15, 2005
draw on our $100.0 million credit facility made available through a group of banks, with Wachovia Bank acting as
administrative and collateral agent. The amount drawn is due on February 15, 2006, which date may be extended by
us, and accrues interest at the rate of 5.19% per annum. If so extended, the interest rate will be equal to LIBOR plus
the margin as set forth under the terms of the credit agreement.

38 | ESTERLINE 0 5 | Management’s Discussion and Analysis
We believe cash on hand, funds generated from operations and other available debt facilities are sufficient to
fund operating cash requirements and capital expenditures through fiscal 2006. In addition, we believe we have
adequate access to capital markets to fund future acquisitions.
Pension Obligations
Our pension plans, which principally include a U.S. pension plan maintained by Esterline and U.S. and non-U.S. plans
maintained by Leach, are under-funded $34.9 million at October 28, 2005. This under-funding principally resulted
from the acquisition of Leach and assumption of its under-funded pension plans. We account for pension expense
using the end of the fiscal year as our measurement date and we make actuarially computed contributions to our
pension plans as necessary to adequately fund benefits. Our funding policy is consistent with the minimum funding
requirements of ERISA. In fiscal 2005, operating cash flow included $5.2 million of cash funding to these pension
plans. We expect pension funding requirements to be approximately $0.5 million in fiscal 2006; the U.S. Esterline
pension plan is not expected to require any contributions in 2006. The rate of increase in future compensation
levels is consistent with our historical experience and salary administration policies. The expected long-term rate
of return on plan assets is based on long-term target asset allocations of 70% equity and 30% fixed income. We
periodically review allocations of plan assets by investment type and evaluate external sources of information
regarding long-term historical returns and expected future returns for each investment type and, accordingly,
believe an 8.5% assumed long-term rate of return on plan assets is appropriate. Current allocations are consistent
with the long-term targets.
We made the following assumptions with respect to our pension obligation in 2005 and 2004:
2005 2004
Principal assumptions as of fiscal year end:
Discount Rate 5.5% 6.0%
Rate of increase in future compensation levels 4.5% 4.5%
Assumed long-term rate of return on plan assets 8.5% 8.5%
We use a discount rate for expected returns that is based on a point-in-time estimate as of each fiscal year end
measurement date. Although future changes to the discount rate are unknown, had the discount rate increased or
decreased by 25 basis points, pension liabilities in total would have decreased $5.5 million or increased $5.8 million,
respectively. We are not aware of any legislative or other initiatives or circumstances that will significantly impact
our pension obligations in fiscal 2006.
Research and Development Expense
For the three years ended October 28, 2005, research and development expense has averaged 4.2% of sales. In fiscal
2005 and 2004, we began bidding and winning new aerospace programs which will result in increased company-
funded research and development. These programs included the A400 primary power distribution assembly, TP400
engine sensors, 787 overhead panel control and 787 environmental control programs. We estimate that research and
development expense will be within a range of 5.75% to 6.5% of sales in fiscal 2006.
Acquisitions
On June 3, 2005, we acquired all of the outstanding capital stock of Palomar Products, Inc. (Palomar), a $25 million
(estimated annual sales) California-based manufacturer of secure military communications products, for
$21.3 million in cash, before a $4.2 million escrow deposit, acquisition costs and the change in net equity value from
December 31, 2004 to closing. A purchase price adjustment is payable to the seller contingent upon achievement of
financial results through December 31, 2005, as described in the Stock Purchase Agreement. Palomar’s products
extend our avionics and controls product lines. Palomar is included in the Avionics & Controls segment and the
results of its operations were included from the effective date of the acquisition.

39 | ESTERLINE 0 5 | Management’s Discussion and Analysis
On August 27, 2004, we acquired all of the outstanding capital stock of Leach Holding Corporation (Leach), a
$119 million (sales) manufacturer of electrical power switching, control, and data communication devices for the
aerospace industry, for approximately $145.0 million in cash before acquisition costs and an adjustment for the
change in working capital from December 31, 2003 to closing, pursuant to an Agreement and Plan of Merger dated
as of July 8, 2004. Leach also manufactures medical diagnostic, therapeutic and patient monitoring devices, and
analytical, optical and biosensor instruments for medical, laboratory and industrial applications. The acquisition
expands our capabilities in providing solutions to our customers’ complex engineering requirements. The aerospace
business is included in the Sensors & Systems segment and the medical business is included in the Avionics &
Controls segment. We used existing cash and our credit facilities to finance the acquisition.
On December 1, 2003, we acquired all of the outstanding capital stock of AVISTA, a $10 million (sales)
Wisconsin-based developer of embedded avionics software, for approximately $6.5 million. A contingent purchase
price is payable to the seller in December 2004 and 2005 based upon the achievement of financial results as defined
in the Stock Purchase Agreement. The December 2004 purchase price adjustment was approximately $3.3 million
and the December 2005 purchase price adjustment was approximately $3.5 million, and was recorded in the first
quarter of fiscal 2006 as additional consideration for the acquired assets. AVISTA provides a software engineering
center to support our customers with such applications as primary flight displays, flight management systems, air
data computers and engine control systems. AVISTA is included in our Avionics & Controls segment.
On June 11, 2003, we acquired the Weston Group from The Roxboro Group PLC for U.K. £55.0 million in cash
(approximately $94.6 million based on the closing exchange rate and including acquisition costs). The acquisition
was financed with a portion of the proceeds from the issuance of $175.0 million in 7.75% Senior Subordinated Notes
due June 15, 2013. The Weston Group is included in the Sensors & Systems segment.
On December 16, 2005, we acquired all of the outstanding capital stock of Darchem Holdings Limited for U.K.
£67.5 million (approximately $120.0 million), subject to adjustment based on the amount of cash and net working
capital of Darchem as of closing. Darchem will be included in the Advanced Materials segment.
Equity Offering
On August 3, 2004, we filed a shelf registration statement on Form S-3 registering $300.0 million of equity and debt
securities, which was declared effective on August 25, 2004. The shelf registration statement enables us to issue
equity and debt securities in response to market conditions. On November 24, 2004 we completed a public offering
of 3.7 million shares of common stock, including shares sold under the underwriters’ over-allotment option, priced at
$31.25 per share, generating net proceeds of $108.5 million, of which $5.0 million was used to pay off existing credit
facilities. The funds provide additional financial resources for acquisitions and general corporate purposes.
Contractual Obligations
The following table summarizes our outstanding contractual obligations as of fiscal year end.
Less than 1-3 4-5 After 5
In Thousands Total 1 year years years years
Long-term debt $ 246,616 $ 69,922 $ 1,227 $ 412 $ 175,055
Credit facilities 2,031 2,031 — — —
Operating lease obligations 57,312 9,257 16,297 14,186 17,572
Purchase obligations
Not recorded on balance sheet 93,501 75,958 14,233 3,310 —
Recorded on balance sheet 160,568 160,568 — — —
Total contractual obligations $ 560,028 $ 317,736 $ 31,757 $ 17,908 $ 192,627

40 | ESTERLINE 0 5 | Management’s Discussion and Analysis
Seasonality
The timing of our revenues is impacted by the purchasing patterns of our customers and, as a result, we do not
generate revenues evenly throughout the year. Moreover, our first fiscal quarter, November through January,
includes significant holiday vacation periods in both Europe and North America. This leads to decreased order and
shipment activity; consequently, first quarter results are typically weaker than other quarters and not necessarily
indicative of our performance in subsequent quarters.
Disclosures About Market Risk
Interest Rate Risks
Our debt obligations are principally at a fixed rate and, accordingly, we are not subject to interest rate risk on these
obligations. However, we are subject to interest rate risk on $75.0 million of our Senior Subordinated Notes due
in 2013. We hold an interest rate swap agreement, which exchanged the fixed interest rate for a variable rate on
$75.0 million of the $175.0 million principal amount outstanding under our Senior Subordinated Notes due in 2013.
The following table provides information about our derivative financial instruments and other financial instruments
that are sensitive to changes in interest rates. For long-term debt, the table presents principal cash flows and the
related weighted-average interest rates by contractual maturities. For our interest rate swap, the following tables
present notional amounts and, as applicable, the interest rate by contractual maturity date at October 28, 2005 and
October 29, 2004.
At October 28, 2005Dollars In Thousands
Long-Term Debt – Fixed Rate Interest Rate Swap
Principal Average Notional Average Average
Maturing in: Amount Rates Amount Pay Rate (1) Receive Rate
2006 $ 70,934 6.62% $ — * 7.75%
2007 763 5.79% — * 7.75%
2008 464 7.20% — * 7.75%
2009 390 7.08% — * 7.75%
2010 22 7.18% — * 7.75%
Thereafter 175,055 7.75% 75,000 * 7.75%
Total $ 247,628 $ 75,000
Fair Value at
10/28/2005 $ 252,330 $ (1,012)
(1) The average pay rate is LIBOR plus 2.56%.

41 | ESTERLINE 0 5 | Management’s Discussion and Analysis
At October 29, 2004Dollars In Thousands
Long-Term Debt – Fixed Rate Interest Rate Swap
Principal Average Notional Average Average
Maturing in: Amount Rates Amount Pay Rate (1) Receive Rate
2005 $ 1,031 7.40% $ — * 7.75%
2006 30,763 6.40% — * 7.75%
2007 502 7.00% — * 7.75%
2008 438 7.00% — * 7.75%
2009 40,437 6.80% — * 7.75%
Thereafter 175,147 7.75% 75,000 * 7.75%
Total $ 248,318 $ 75,000
Fair Value at
10/29/2004 $ 271,069 $ 1,769
(1) The average pay rate is LIBOR plus 2.56%.
Currency Risks
To the extent that sales are transacted in a foreign currency, we are subject to foreign currency fluctuation risk.
Furthermore, we have assets denominated in foreign currencies that are not offset by liabilities in such foreign
currencies. Although we own significant operations in France, Germany and the United Kingdom, historically we
have not experienced material gains or losses due to interest rate or foreign exchange fluctuations. Comparing
October 28, 2005 and October 29, 2004, the foreign exchange rate for the euro decreased 5.7% relative to the U.S.
dollar. Comparing October 29, 2004 to October 31, 2003, the foreign exchange rate for the euro increased 10.5%
relative to the U.S. dollar.
The following tables provide information about our derivative financial instruments, including foreign currency
forward exchange agreements and certain firmly committed sales transactions denominated in currencies
other than the functional currency at October 28, 2005 and October 29, 2004. The information about certain firmly
committed sales contracts and derivative financial instruments is in U.S. dollar equivalents. For forward foreign
currency exchange agreements, the following tables present the notional amounts at the current exchange rate and
weighted-average contractual foreign currency exchange rates by contractual maturity dates. The tables do not
include firmly committed transactions that have not been hedged.

42 | ESTERLINE 0 5 | Management’s Discussion and Analysis
Firmly Committed Sales ContractsOperations with Foreign Functional Currency at October 28, 2005
Principal Amount by Expected Maturity
Average Foreign Currency Exchange Rate (USD/Foreign Currency)
In Thousands
Euro U.K. Pound Firmly Committed Firmly Committed Sales Contracts Sales ContractsFiscal Years United States Dollar United States Dollar
2006 $ 26,883 $ 15,705
2007 6,153 2,072
2008 2,094 402
2009 — 2,909
2010 — 46
Total $ 35,130 $ 21,134
Derivative ContractsOperations with Foreign Functional Currency at October 28, 2005
Notional Amount by Expected Maturity
Average Foreign Currency Exchange Rate (USD/Foreign Currency)(1)
Related Forward Contracts to Sell U.S. Dollar for Euro
Dollars In Thousands United States Dollar
Fiscal Years Notional Amount Avg. Contract Rate
2006 $ 17,800 1.266
2007 2,090 1.244
Total $ 19,890
Fair Value at 10/28/2005 $ (501)
Related Forward Contracts to Sell U.S. Dollar for U.K. Pound
United States Dollar
Fiscal Years Notional Amount Avg. Contract Rate
2006 $ 16,370 1.824
2007 2,240 1.800
Total $ 18,610
Fair Value at 10/28/2005 $ (433)
(1 ) The Company has no derivative contracts maturing after fiscal 2007.

43 | ESTERLINE 0 5 | Management’s Discussion and Analysis
Firmly Committed Sales ContractsOperations with Foreign Functional Currency at October 29, 2004
Principal Amount by Expected Maturity
Average Foreign Currency Exchange Rate (USD/Foreign Currency)
In Thousands
Euro U.K. Pound
Firmly Committed Firmly Committed Sales Contracts Sales Contracts
Fiscal Years United States Dollar United States Dollar
2005 $ 18,199 $ 10,816
2006 5,205 101
2007 5,452 149
2008 3 —
2009 2 —
Total $ 28,861 $ 11,066
Derivative ContractsOperations with Foreign Functional Currency at October 29, 2004
Notional Amount by Expected Maturity
Average Foreign Currency Exchange Rate (USD/Foreign Currency)(1)
Related Forward Contracts to Sell U.S. Dollar for Euro
Dollars In Thousands United States Dollar
Fiscal Years Notional Amount Avg. Contract Rate
2005 $ 13,340 1.204
2006 1,700 1.218
Total $ 15,040
Fair Value at 10/29/2004 $ 855
Related Forward Contracts to Sell U.S. Dollar for U.K. Pound
United States Dollar
Fiscal Years Notional Amount Avg. Contract Rate
2005 $ 10,575 1.782
2006 900 1.754
Total $ 11,475
Fair Value at 10/29/2004 $ 241
(1 ) The Company has no derivative contracts maturing after fiscal 2006.

Critical Accounting Policies
Our financial statements and accompanying notes are prepared in accordance with U.S. generally accepted
accounting principles. Preparing financial statements requires management to make estimates and assumptions
that affect the reported amounts of assets, liabilities, revenues and expenses. Actual results may differ from
estimates under different assumptions or conditions. These estimates and assumptions are affected by our
application of accounting policies. Our critical accounting policies include revenue recognition, accounting for the
allowance for doubtful accounts receivable, accounting for inventories at the lower of cost or market, accounting for
goodwill and intangible assets in business combinations, impairment of goodwill and intangible assets, accounting
for legal contingencies, and accounting for income taxes.
Revenue Recognition
We recognize revenue when the title and risk of loss have passed to the customer, there is persuasive evidence of
an agreement, delivery has occurred or services have been rendered, the price is determinable, and the collectibility
is reasonably assured. We recognize product revenues at the point of shipment or delivery in accordance with
the terms of sale. Sales are net of returns and allowances. Returns and allowances are not significant because
products are manufactured to customer specification and are covered by the terms of the product warranty.
Revenues and profits on fixed-price contracts with significant engineering as well as production requirements
are recorded based on the ratio of total actual incurred costs to date to total estimated costs for each contract
(cost-to-cost method) in accordance with the American Institute of Certified Public Accountants Statement of
Position 81-1, “Accounting for Performance of Construction-Type and Certain Production-Type Contracts.” We
review cost performance and estimates to complete on our ongoing contracts at least quarterly. The impact of
revisions of profit estimates are recognized on a cumulative catch-up basis in the period in which the revisions are
made. Provisions for anticipated losses on contracts are recorded in the period they become evident. Amounts
representing contract change orders, claims or other items are included in revenue only when they can be reliably
estimated and realization is probable, and are determined on a percentage-of-completion basis measured by the
cost-to-cost method.
Allowance for Doubtful Accounts
We establish an allowance for doubtful accounts for losses expected to be incurred on accounts receivable
balances. Judgment is required in estimation of the allowance and is based upon specific identification, collection
history and creditworthiness of the debtor.
Inventories
We account for inventories on a first-in, first-out or average cost method of accounting at the lower of its cost
or market as required under Accounting Research Bulletin No. 43 (ARB No. 43). The application of ARB No. 43
requires judgment in estimating the valuation of inventories. Such valuations require judgment in estimating future
demand, selling prices and cost of disposal.
44 | ESTERLINE 0 5 | Management’s Discussion and Analysis

Goodwill and Intangible Assets in Business Combinations
We account for business combinations, goodwill and intangible assets in accordance with Financial Accounting
Standards No. 141, “Business Combinations” (Statement No. 141) and Financial Accounting Standards No. 142,
“Goodwill and Other Intangible Assets” (Statement No. 142). Statement No. 141 specifies the types of acquired
intangible assets that are required to be recognized and reported separately from goodwill.
Impairment of Goodwill and Intangible Assets
Statement No. 142 requires goodwill and certain intangible assets to be no longer amortized, but instead be tested
for impairment at least annually. We are also required to test goodwill for impairment between annual tests if events
occur or circumstances change that would more likely than not reduce our enterprise fair value below its book value.
These events or circumstances could include a significant change in the business climate, including a significant
sustained decline in an entity’s market value, legal factors, operating performance indicators, competition, sale or
disposition of a significant portion of the business, or other factors.
The valuation of reporting units requires judgment in estimating future cash flows, discount rates and estimated
product life cycles. In making these judgments, we evaluate the financial health of the business, including such
factors as industry performance, changes in technology and operating cash flows.
Statement No. 142 outlines a two-step process for testing goodwill for impairment. The first step (Step One) of
the goodwill impairment test involves estimating the fair value of a reporting unit. Statement No. 142 defines fair
value (Fair Value) as “the amount at which an asset (or liability) could be bought (or incurred) or sold (or settled)
in a current transaction between willing parties, that is, other than in a forced liquidation sale.” A reporting unit is
generally defined at the operating segment level or at the component level one level below the operating segment,
if said component constitutes a business. The Fair Value of a reporting unit is then compared to its carrying value,
which is defined as the book basis of total assets less total liabilities. In the event a reporting unit’s carrying value
exceeds its estimated Fair Value, evidence of potential impairments exists. In such a case, the second step (Step
Two) of the impairment test is required, which involves allocating the Fair Value of the reporting unit to all of the
assets and liabilities of that unit, with the excess of Fair Value over allocated net assets representing the Fair Value
of goodwill. An impairment loss is measured as the amount by which the carrying value of the reporting unit’s
goodwill exceeds the estimated Fair Value of goodwill.
As we have grown through acquisitions, we have accumulated $261.2 million of goodwill and $21.9 million of
indefinite-lived intangible assets out of total assets of $1,115.2 million at October 28, 2005. As a result, the amount
of any annual or interim impairment could be significant and could have a material adverse effect on our reported
financial results for the period in which the charge is taken.
We performed our impairment review for fiscal 2005 as of July 30, 2005, and our Step One analysis indicates that
no impairment of goodwill exists in any of the Company’s reporting units. Our Step One test was based upon a
market and discounted cash flow valuation method.
45 | ESTERLINE 0 5 | Management’s Discussion and Analysis

46 | ESTERLINE 0 5 | Management’s Discussion and Analysis
Impairment of Long-lived Assets
We account for the impairment of long-lived assets to be held and used in accordance with Financial Accounting
Standards No. 144, “Accounting for the Impairment or Disposal of Long-Lived Assets” (Statement No. 144).
Statement No. 144 requires that a long-lived asset to be disposed of be reported at the lower of its carrying amount
or fair value less cost to sell. For business segments disposed of prior to the implementation of Statement
No. 144 in fiscal 2003, namely the Automation segment, we accounted for discontinued operations in accordance
with Accounting Principles Board Opinion No. 30, “Reporting the Results of Operations – Reporting the Effects
of Disposal of a Segment of a Business and Extraordinary, Unusual and Infrequently Occurring Events and
Transactions” (APB No. 30). APB No. 30 requires that if a loss is expected, it should be recorded at the measurement
date when management commits to a plan to dispose of a segment of a business. The loss from discontinuance
is based upon estimates of net realizable value and estimated losses from the measurement date to the expected
disposal date. Judgment is required to estimate the selling price, selling expenses and future losses of the
segment. Statement No. 144 broadens the definition of a segment of a business to include a “component of an
entity.” Further, Statement No. 144 requires operating losses from a “component of an entity” to be recognized in
the period(s) in which they occur (rather than as of the measurement date as previously required by APB No. 30).
Contingencies
We are party to various lawsuits and claims, both as plaintiff and defendant, and have contingent liabilities
arising from the conduct of business. We are covered by insurance for general liability, product liability, workers’
compensation and certain environmental exposures, subject to certain deductible limits. We are self-insured for
amounts less than our deductible and where no insurance is available. Financial Accounting Standards No. 5,
“Accounting for Contingencies,” requires that an estimated loss from a contingency should be accrued by a charge
to income if it is probable that an asset has been impaired or a liability has been incurred and the amount of the loss
can be reasonably estimated. Disclosure of a contingency is required if there is at least a reasonable possibility that
a loss has been incurred. We evaluate, among other factors, the degree of probability of an unfavorable outcome
and the ability to make a reasonable estimate of the amount of loss.
Income Taxes
We account for income taxes in accordance with Financial Accounting Standards No. 109, “Accounting for Income
Taxes.” The objectives of accounting for income taxes are to recognize the amount of taxes payable or refundable
for the current year and deferred tax liabilities and assets for the future tax consequences of events that have been
recognized in our financial statements or tax returns. Judgment is required in assessing the future tax consequences
of events that have been recognized in our financial statements or tax returns. Variations in the actual outcome of
these future tax consequences could materially impact our financial position and results of operations.
Recent Accounting Pronouncements
On December 16, 2004, the Financial Accounting Standards Board issued Statement of Financial Accounting
Standards No 123(R), “Share-Based Payment,” which is a revision of Statement No. 123. Statement 123(R)
supersedes APB Opinion No. 25 and amends Statement of Financial Accounting Standards No. 95, “Statement of

Cash Flows.” Generally, the approach in Statement 123(R) is similar to the approach described in Statement 123.
However, Statement 123(R) requires all share-based payments to employees, including grants of employee stock
options, to be recognized in the income statement based on their fair values. Pro forma disclosure is no longer an
alternative.
Statement 123(R) originally required adoption no later than July 30, 2005. In April 2005, the Securities and
Exchange Commission (SEC) issued a release that amends the compliance dates for Statement 123(R). Under the
SEC’s new rule, the Company will be required to apply Statement 123(R) as of October 29, 2005.
Statement 123(R) permits public companies to adopt its requirements using one of two methods:
A “modified prospective” method in which compensation cost is recognized beginning with the effective date
(a) based on the requirements of Statement 123(R) for all share-based payments granted after the effective
date and (b) based on the requirements of Statement 123 for all awards granted to employees prior to the
effective date of Statement 123(R) that remain unvested on the effective date.
A “modified retrospective” method which includes the requirements of the modified prospective method
described above, but also permits entities to restate, based on the amounts previously recognized under
Statement 123 for purposes of pro forma disclosures, either (a) all prior periods presented or (b) prior interim
periods of the year of adoption. The Company will adopt Statement 123(R) using the “modified prospective”
method.
As permitted by Statement 123, we currently account for share-based payments to employees in accordance
with APB No. 25. The variable method of accounting is used to account for stock option plans where the option
holders are permitted to exercise options by surrendering the option subject to the grant in payment of the exercise
price of the option and the related statutory taxes. The adoption of Statement 123(R)’s fair value method will have
no impact on the Company’s overall financial position. The impact of adoption of Statement 123(R) on the income
statement cannot be predicted at this time because it will depend on levels of share-based payments granted in the
future. However, had the Company adopted Statement 123(R) in prior periods, the impact of that standard would
have approximated the impact of Statement 123 as described above in the disclosure of pro forma net income and
earnings per share.
In March 2005, the Financial Accounting Standards Board issued FASB Interpretation No. (FIN) 47 – “Accounting
for Conditional Asset Retirement Obligations, an interpretation of FASB Statement No. 143,” which clarifies
the term “conditional asset retirement obligation” as used in SFAS No. 143, “Accounting for Asset Retirement
Obligations.” Specifically, FIN 47 provides that an asset retirement obligation is conditional when either the timing
and (or) method of settling the obligation is conditioned on a future event. Accordingly, an entity is required to
recognize a liability for the fair value of a conditional asset retirement obligation if the fair market value of the
liability can be reasonably estimated. Uncertainty about the timing and (or) method of settlement of a conditional
asset retirement obligation should be factored into the measurement of the liability when sufficient information
exists. This interpretation also clarifies when an entity would have sufficient information to reasonably estimate
the fair value of an asset retirement obligation. FIN 47 is effective for fiscal years ending after December 15, 2005.
We do not believe that the adoption of FIN 47 will have a material impact on our consolidated results of operations
and financial condition.
47 | ESTERLINE 0 5 | Management’s Discussion and Analysis

48 | ESTERLINE 0 5 | Management’s Discussion and Analysis
In November 2004, the Financial Accounting Standards Board issued Statement of Financial Accounting
Standards No. 151, “Inventory Costs – An Amendment of ARB No. 43, Chapter 4.” Statement No. 151 amends the
guidance in ARB No. 43, Chapter 4, “Inventory Pricing,” to clarify the accounting for abnormal amounts of idle
facility expense, freight, handling costs and wasted material (spoilage). Among other provisions, the new rule
requires that items, such as idle facility expense, excessive spoilage, double freight and rehandling costs, be
recognized as current period charges regardless of whether they meet the criterion of “so abnormal” as stated in
ARB No. 43. Additionally, Statement No. 151 requires that the allocation of fixed production overheads to the costs
of conversion be based on the normal capacity of the production facilities. Statement No. 151 is effective for fiscal
years beginning after June 15, 2005 and is required to be adopted by the Company in the first quarter of fiscal 2006.
We do not believe that the adoption of Statement No. 151 will have a material impact on our consolidated results of
operations and financial condition.

49 | ESTERLINE 0 5 | Statements
Market Price of Esterline Common Stock In Dollars
For Fiscal Years
2005 2004 High Low High Low
Quarter
First $ 36.62 $ 28.70 $ 29.55 $ 21.71
Second 36.52 29.20 29.80 23.00
Third 43.01 31.60 31.70 22.52
Fourth 44.27 35.85 34.19 27.83
Principal Market – New York Stock Exchange
At the end of fiscal 2005, there were approximately 544 holders of record of the Company’s common stock.
No cash dividends were paid during fiscal 2005 and 2004. We currently intend to retain all future earnings for use
to expand the business or retire debt. We are restricted from paying dividends under our current credit facility and
do not anticipate paying any dividends in the foreseeable future.

Selected Financial Data In Thousands, Except Per Share Amounts
For Fiscal Years 2005 2004 2003 2002 2001
Operating Results(1)
Net sales $ 835,403 $ 613,610 $ 549,132 $ 421,706 $ 413,220
Cost of sales 573,453 418,590 376,931 285,900 261,422
Selling, general and administrative 137,426 118,746 105,301 79,085 67,586
Research, development and engineering 42,238 25,856 17,782 13,829 12,443
Other (income) expense 514 (509) — — —
Loss (gain) on sale of product line — (3,434) 66 — —
Insurance settlement — — — — (4,631)
Loss (gain) on derivative
financial instruments — — (2,676) 1 (786)
Interest income (4,057) (1,964) (868) (1,814) (3,307)
Interest expense 18,159 17,336 11,991 7,117 7,658
Income from continuing operations
before income taxes 67,670 38,989 40,605 37,588 72,835
Income tax expense 16,301 9,592 12,458 9,111 26,589
Income from continuing operations 51,034 29,375 28,147 28,477 46,246
Income (loss) from discontinued
operations, net of tax 6,992 10,208 (5,312) (25,264) (9,294)
Cumulative effect of a change in
accounting principle — — — (7,574) (403)
Net earnings (loss) 58,026 39,583 22,835 (4,361) 36,549
Earnings (loss) per share – diluted:
Continuing operations $ 2.02 $ 1.37 $ 1.33 $ 1.35 $ 2.31
Discontinued operations .27 .47 (.25) (1.20) (.46)
Cumulative effect of a change in
accounting principle — — — (.36) (.02)
Earnings (loss) per share – diluted 2.29 1.84 1.08 (.21) 1.83
Financial Structure
Total assets $ 1,115,248 $ 935,348 $ 802,827 $ 573,678 $ 561,306
Long-term debt, net 175,682 249,056 246,792 102,133 102,125
Shareholders’ equity 620,864 461,028 396,069 357,164 351,793
Weighted average shares
outstanding – diluted 25,302 21,539 21,105 21,021 20,014
(1) Operating results for 2005 through 2001 and balance sheet items for 2003 through 2002 reflect the segregation of continuing operations from discontinued operations. See Note 2 to the Consolidated Financial Statements.
50 | ESTERLINE 0 5 | Statements

51 | ESTERLINE 0 5 | Statements
For Fiscal Years 2005 2004 2003 2002 2001
Other Selected Data(2)
EBITDA from continuing operations $ 119,326 $ 83,497 $ 73,984 $ 61,732 $ 82,214
Stock option expense (income) 2,799 4,326 1,428 4,711 (6,385)
Capital expenditures 23,730 21,800 16,764 15,008 15,319
Interest expense 18,159 17,336 11,991 7,117 7,658
Depreciation and amortization from
continuing operations 34,241 28,753 23,438 14,129 16,830
EBITDA from continuing operations is a measurement not calculated in accordance with GAAP. We define EBITDA from continuingoperations as operating earnings from continuing operations plus stock option expense and depreciation and amortization (excluding amortization of debt issuance cost). We do not intend EBITDA from continuing operations to represent cash flows from continuing op-erations or any other items calculated in accordance with GAAP, or as an indicator of Esterline’s operating performance. Our definition of EBITDA from continuing operations may not be comparable with EBITDA from continuing operations as defined by other companies. We believe EBITDA is commonly used by financial analysts and others in the aerospace and defense industries and thus provides useful information to investors. Our management and certain financial creditors use EBITDA as one measure of our leverage capacity and debt servicing ability, and is shown here with respect to Esterline for comparative purposes. EBITDA is not necessarily indicative of amounts that may be available for discretionary uses by us. The following table reconciles operating earnings from continuing operations to
EBITDA from continuing operations.
For Fiscal Years 2005 2004 2003 2002 2001
Operating earnings from continuing
operations $ 82,286 $ 50,418 $ 49,118 $ 42,892 $ 71,769
Stock option expense 2,799 4,326 1,428 4,711 (6,385)
Depreciation and amortization from
continuing operations 34,241 28,753 23,438 14,129 16,830
EBITDA from continuing operations $ 119,326 $ 83,497 $ 73,984 $ 61,732 $ 82,214
(2)

52 | ESTERLINE 0 5 | Statements
Consolidated Statement of Operations In Thousands, Except Per Share Amounts
For Each of the Three Fiscal Years in the Period Ended October 28, 2005 2005 2004 2003
Net Sales $ 835,403 $ 613,610 $ 549,132
Cost of Sales 573,453 418,590 376,931
261,950 195,020 172,201
Expenses
Selling, general and administrative 137,426 118,746 105,301
Research, development and engineering 42,238 25,856 17,782
Total Expenses 179,664 144,602 123,083
Operating Earnings From Continuing Operations 82,286 50,418 49,118
Other (income) expense 514 (509) —
Loss (gain) on sale of product line — (3,434) 66
Gain on derivative financial instruments — — (2,676)
Interest income (4,057) (1,964) (868)
Interest expense 18,159 17,336 11,991
Other Expense, Net 14,616 11,429 8,513
Income From Continuing Operations Before Income Taxes 67,670 38,989 40,605
Income Tax Expense 16,301 9,592 12,458
Income From Continuing Operations Before Minority Interest 51,369 29,397 28,147
Minority Interest (335) (22) —
Income From Continuing Operations 51,034 29,375 28,147
Income (Loss) From Discontinued Operations, Net of Tax 6,992 10,208 (5,312)
Net Earnings $ 58,026 $ 39,583 $ 22,835
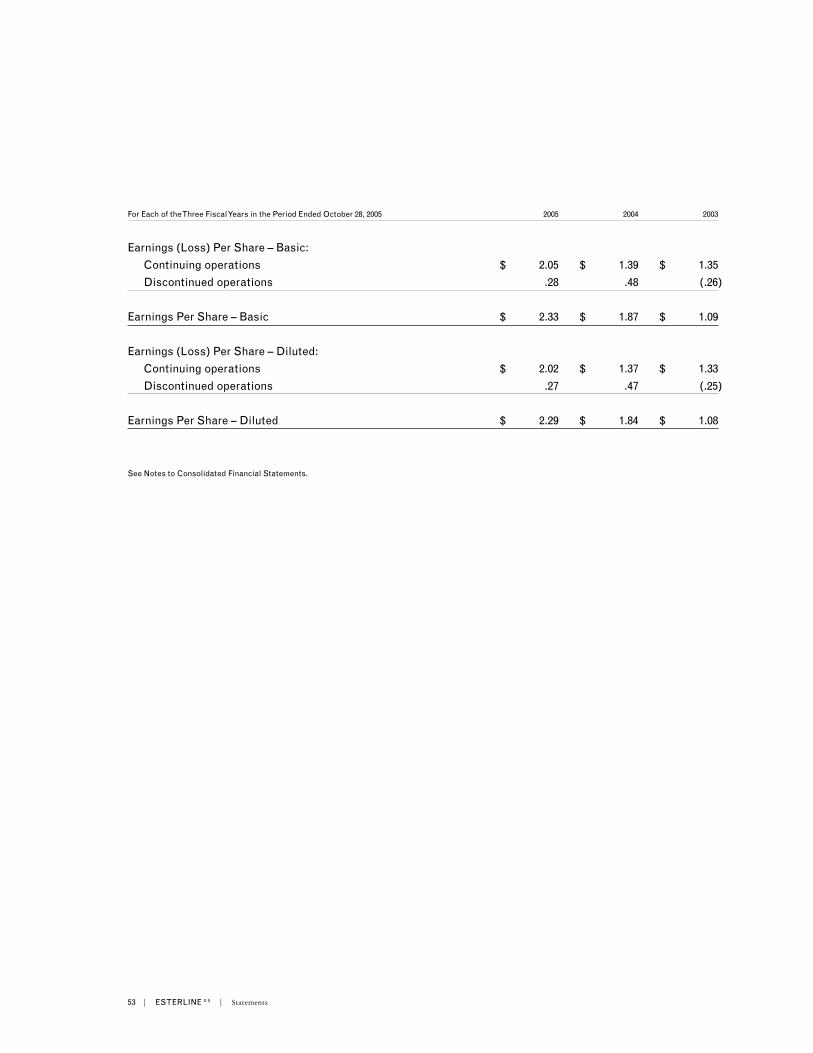
53 | ESTERLINE 0 5 | Statements
For Each of the Three Fiscal Years in the Period Ended October 28, 2005 2005 2004 2003
Earnings (Loss) Per Share – Basic:
Continuing operations $ 2.05 $ 1.39 $ 1.35
Discontinued operations .28 .48 (.26)
Earnings Per Share – Basic $ 2.33 $ 1.87 $ 1.09
Earnings (Loss) Per Share – Diluted:
Continuing operations $ 2.02 $ 1.37 $ 1.33
Discontinued operations .27 .47 (.25)
Earnings Per Share – Diluted $ 2.29 $ 1.84 $ 1.08
See Notes to Consolidated Financial Statements.

54 | ESTERLINE 0 5 | Statements
Consolidated Balance Sheet In Thousands, Except Per Share Amounts
As of October 28, 2005 and October 29, 2004 2005 2004
Assets
Current Assets
Cash and cash equivalents $ 118,304 $ 29,479
Cash in escrow 11,918 8,511
Short-term investments 62,656 —
Accounts receivable, net of allowances
of $4,462 and $3,687 149,751 132,206
Inventories 130,469 119,054
Deferred income tax benefits 26,868 23,499
Prepaid expenses 7,533 9,441
Other current assets — 435
Total Current Assets 507,499 322,625
Property, Plant and Equipment
Land 15,869 17,341
Buildings 79,219 80,998
Machinery and equipment 187,022 177,098
282,110 275,437
Accumulated depreciation 143,896 130,302
138,214 145,135
Other Non-Current Assets
Goodwill 261,167 247,817
Intangibles, net 166,118 169,876
Debt issuance costs, net of accumulated
amortization of $1,602 and $928 5,144 5,818
Deferred income tax benefits 13,320 11,216
Other assets 23,786 32,861
Total Assets $ 1,115,248 $ 935,348
See Notes to Consolidated Financial Statements.

55 | ESTERLINE 0 5 | Statements
As of October 28, 2005 and October 29, 2004 2005 2004
Liabilities and Shareholders’ Equity
Current Liabilities
Accounts payable $ 41,453 $ 37,867
Accrued liabilities 119,115 97,038
Credit facilities 2,031 6,977
Current maturities of long-term debt 70,934 1,031
Federal and foreign income taxes 8,798 6,678
Total Current Liabilities 242,331 149,591
Long-Term Liabilities
Long-term debt, net of current maturities 175,682 249,056
Deferred income taxes 46,421 43,443
Other liabilities 27,237 29,852
Commitments and Contingencies — —
Minority Interest 2,713 2,378
Shareholders’ Equity
Common stock, par value $.20 per share,
authorized 60,000,000 shares, issued and
outstanding 25,319,892 and 21,319,698 shares 5,064 4,264
Additional paid-in capital 260,095 144,879
Retained earnings 345,370 287,344
Accumulated other comprehensive income 10,335 24,541
Total Shareholders’ Equity 620,864 461,028
Total Liabilities and Shareholders’ Equity $ 1,115,248 $ 935,348
See Notes to Consolidated Financial Statements.

56 | ESTERLINE 0 5 | Statements
Consolidated Statement of Cash Flows In Thousands
For Each of the Three Fiscal Years in the Period Ended October 28, 2005 2005 2004 2003
Cash Flows Provided (Used) by Operating Activities
Net earnings $ 58,026 $ 39,583 $ 22,835
Minority interest 335 22 —
Depreciation and amortization 35,308 31,145 26,215
Deferred income tax (4,501) 3,264 9,235
Stock-based compensation 2,799 4,326 1,428
Loss (gain) on disposal and holding period
loss on discontinued operations — (12,521) 9,282
Gain on sale of discontinued operations (9,456) — —
Loss on sale of building 59 — —
Gain on sale of land — (892) —
Loss (gain) on sale of product line — (3,434) 66
Gain on sale of short-term investments (1,397) — —
Working capital changes, net of effect of acquisitions
Accounts receivable (17,645) (9,032) (9,516)
Inventories (11,636) (9,095) 6,322
Prepaid expenses 1,702 (659) 117
Other current assets 435 — —
Accounts payable 4,166 2,600 (4,396)
Accrued liabilities 19,916 10,240 4,926
Federal and foreign income taxes 5,169 8,951 (923)
Other liabilities (6,414) 4,359 —
Other, net (454) (5,530) 197
76,412 63,327 65,788
Cash Flows Provided (Used) by Investing Activities
Purchases of capital assets (23,776) (22,126) (17,130)
Proceeds from sale of discontinued operations 21,421 10,000 3,850
Proceeds from sale of building 2,319 — —
Proceeds from sale of product line — 3,475 5,630
Proceeds from sale of land — 1,654 —
Escrow deposit (4,207) (12,500) (1,036)
Proceeds from sale of capital assets 2,312 778 766
Purchase of short-term investments (173,273) — (12,797)
Proceeds from sale of short-term investments 112,014 12,797 —
Acquisitions of businesses, net of cash acquired (28,261) (138,811) (111,735)
(91,451) (144,733) (132,452)

57 | ESTERLINE 0 5 | Statements
For Each of the Three Fiscal Years in the Period Ended October 28, 2005 2005 2004 ` 2003
Cash Flows Provided (Used) by Financing Activities
Proceeds provided by stock issuance
under employee stock plans 4,727 2,807 2,424
Proceeds provided by sale of common stock 108,490 — —
Net change in credit facilities (4,829) 4,122 2,279
Repayment of long-term debt, net (3,302) (29,429) (732)
Debt and other issuance costs — (268) (7,735)
Proceeds from note issuance — — 175,000
105,086 (22,768) 171,236
Effect of foreign exchange rates on cash (1,222) 2,290 4,280
Net increase (decrease) in
cash and cash equivalents 88,825 (101,884) 108,852
Cash and cash equivalents – beginning of year 29,479 131,363 22,511
Cash and cash equivalents – end of year $ 118,304 $ 29,479 $ 131,363
Supplemental Cash Flow Information
Cash paid for interest $ 16,610 $ 17,394 $ 6,945
Cash paid (refunded) for taxes 14,193 (1,909) (558)
See Notes to Consolidated Financial Statements.

58 | ESTERLINE 0 5 | Statements
Consolidated Statement of Shareholders’ Equity & Comprehensive Income In Thousands, Except Per Share Amounts
For Each of the Three Fiscal Years in the Period Ended October 28, 2005 2005 2004 2003
Common Stock, Par Value $.20 Per Share
Beginning of year $ 4,264 $ 4,213 $ 4,157
Shares issued under stock option plans 64 51 56
Shares issued under equity offering 736 — —
End of year 5,064 4,264 4,213
Additional Paid-in Capital
Beginning of year 144,879 137,797 134,001
Shares issued under stock option plans 4,663 2,756 2,368
Shares issued under equity offering 107,754 — —
Stock-based compensation expense 2,799 4,326 1,428
End of year 260,095 144,879 137,797
Retained Earnings
Beginning of year 287,344 247,761 224,926
Net earnings 58,026 39,583 22,835
End of year 345,370 287,344 247,761
Accumulated Other Comprehensive Gain (Loss)
Beginning of year 24,541 6,298 (5,920)
Change in fair value of derivative
financial instruments, net of tax 43 581 61
Adjustment for supplemental executive
pension liability, net of tax (75) (850) —
Foreign currency translation adjustment (14,174) 18,512 12,157
End of year 10,335 24,541 6,298
Total Shareholders’ Equity $ 620,864 $ 461,028 $ 396,069
Comprehensive Income
Net earnings $ 58,026 $ 39,583 $ 22,835
Change in fair value of derivative
financial instruments, net of tax 43 581 61
Adjustment for supplemental executive
pension liability, net of tax (75) (850) —
Foreign currency translation adjustment (14,174) 18,512 12,157
Comprehensive Income $ 43,820 $ 57,826 $ 35,053
See Notes to Consolidated Financial Statements.

59 | ESTERLINE 0 5 | Notes
Notes to Consolidated Financial Statements
Note One. Accounting Policies
Nature of Operations
Esterline Technologies Corporation (the Company) designs, manufactures and markets highly engineered prod-
ucts. The Company serves the aerospace and defense industry, primarily in the United States and Europe. The
Company also serves the industrial/commercial and medical markets.
Principles of Consolidation and Basis of Presentation
The consolidated financial statements include the accounts of the Company and all subsidiaries. All significant
intercompany accounts and transactions have been eliminated. Classifications have been changed for certain
amounts in prior periods to conform with the current year’s presentation. The Company’s fiscal year ends on the
last Friday of October.
Management Estimates
To prepare financial statements in conformity with U.S. generally accepted accounting principles, management is
required to make estimates and assumptions that affect the reported amounts of assets and liabilities, disclosure
of contingent assets and liabilities at the date of the financial statements, and the reported amounts of revenues
and expenses during the reporting period. Actual results could differ from those estimates.
Revenue Recognition
The Company recognizes revenue when the title and risk of loss have passed to the customer, there is persuasive
evidence of an agreement, delivery has occurred or services have been rendered, the price is determinable, and
the collectibility is reasonably assured. The Company recognizes product revenues at the point of shipment or de-
livery in accordance with the terms of sale. Sales are net of returns and allowances. Returns and allowances are
not significant because products are manufactured to customer specification and are covered by the terms of the
product warranty.
Revenues and profits on fixed-price contracts with significant engineering as well as production requirements
are recorded based on the ratio of total actual incurred costs to date to total estimated costs for each contract
(cost-to-cost method) in accordance with the American Institute of Certified Public Accountants Statement of
Position 81-1, “Accounting for Performance of Construction-Type and Certain Production-Type Contracts.” The
Company reviews cost performance and estimates to complete on its ongoing contracts at least quarterly. The
impact of revisions of profit estimates are recognized on a cumulative catch-up basis in the period in which the
revisions are made. Provisions for anticipated losses on contracts are recorded in the period they become evident.
Amounts representing contract change orders, claims or other items are included in revenue only when they can be
reliably estimated and realization is probable, and are determined on a percentage-of-completion basis measured
by the cost-to-cost method.
60 | ESTERLINE 0 5 | Notes
Financial Instruments
Fair Value of Financial Instruments
The Company’s financial instruments consist primarily of cash and cash equivalents, accounts receivable, ac-
counts payable, short-term borrowings, long-term debt, foreign currency forward contracts, and an interest rate
swap agreement. The carrying amounts of cash and cash equivalents, accounts receivable, and accounts payable
approximate their respective fair values because of the short-term maturities or expected settlement dates of these
instruments. The fair market value of the Company’s long-term debt and short-term borrowings was estimated at
$252.3 million and $271.1 million, at fiscal year end 2005 and 2004, respectively. These estimates were derived us-
ing discounted cash flows with interest rates currently available to the Company for issuance of debt with similar
terms and remaining maturities.
Foreign Currency Exchange Risk Management
The Company is subject to risks associated with fluctuations in foreign currency exchange rates from the sale of
products in currencies other than its functional currency. The Company’s policy is to hedge a portion of its fore-
casted transactions using forward exchange contracts, with maturities up to fifteen months. These forward con-
tracts have been designated as cash flow hedges. The portion of the net gain or loss on a derivative instrument that
is effective as a hedge is reported as a component of other comprehensive income in shareholders’ equity and is
reclassified into earnings in the same period during which the hedged transaction affects earnings. The remaining
net gain or loss on the derivative in excess of the present value of the expected cash flows of the hedged transac-
tion is recorded in earnings immediately. If a derivative does not qualify for hedge accounting, or a portion of the
hedge is deemed ineffective, the change in fair value is recorded in earnings. The amount of hedge ineffectiveness
has not been material in any of the three fiscal years in the period ended October 28, 2005. At October 28, 2005 and
October 29, 2004, the notional value of foreign currency forward contracts was $38.5 million and $26.5 million, re-
spectively. The fair value of these contracts at October 28, 2005 and October 29, 2004 was a $0.9 million liability and
a $1.1 million asset, respectively. The Company does not enter into any forward contracts for trading purposes.
Interest Rate Risk Management
Depending on the interest rate environment, the Company may enter into interest rate swap agreements to convert
the fixed interest rates on notes payable to variable interest rates or terminate any swap agreements in place.
These interest rate swap agreements have been designated as fair value hedges. Accordingly, gain or loss on
swap agreements as well as the offsetting loss or gain on the hedged portion of notes payable are recognized in in-
terest expense during the period of the change in fair values. The Company attempts to manage exposure to coun-
terparty credit risk by only entering into agreements with major financial institutions which are expected to be able
to fully perform under the terms of the agreement. In September 2003, the Company entered into an interest rate
swap agreement on $75.0 million of its Senior Subordinated Notes due in 2013. The swap agreement exchanged
the fixed interest rate for a variable interest rate on $75.0 million of the $175.0 million principal amount outstand-
ing. The fair market value of the Company’s interest rate swap was a $1.0 million liability and a $1.8 million asset at
October 28, 2005 and October 29, 2004, respectively. The fair market value was estimated by discounting expected
cash flows using quoted market interest rates.
Foreign Currency Translation
Foreign currency assets and liabilities are translated into their U.S. dollar equivalents based on year-end exchange
rates. Revenue and expense accounts are translated at average exchange rates. Aggregate exchange gains and
losses arising from the translation of foreign assets and liabilities are included in shareholders’ equity as a compo-
nent of comprehensive income. Foreign currency transaction gains and losses are included in results of operations
and have not been significant in amount in any of the three fiscal years in the period ended October 28, 2005
Cash Equivalents and Cash in Escrow
Cash equivalents consist of highly liquid investments with maturities of three months or less at the date of pur-
chase. Fair value of cash equivalents approximates carrying value. Cash in escrow represents amounts held in
escrow pending finalization of a purchase transaction.

61 | ESTERLINE 0 5 | Notes
Short-term Investments
Short-term investments consist of highly liquid debt securities with maturities of more than three months at the
date of purchase. Short-term investments are classified as available for sale securities and are carried at fair
value. Unrealized gains and losses are reported as a net amount in a separate component of stockholders’ equity
until realized. The gains or losses on short-term securities sold were determined under the specific identification
method. Unrealized gains and losses were not significant at October 28, 2005. Short-term investments having ma-
turities within one year aggregate $28.9 million, after one year through five years aggregate $1.0 million and after
ten years aggregate $32.8 million.
Accounts Receivable
Accounts receivable are recorded at the net invoice price for sales billed to customers. Accounts receivable are
considered past due when outstanding more than normal trade terms allow. An allowance for doubtful accounts
is established when losses are expected to be incurred. Accounts receivable are written off to the allowance for
doubtful accounts when the balance is considered to be uncollectible.
Inventories
Inventories are stated at the lower of cost or market using the first-in, first-out (FIFO) or average cost method.
Inventory cost includes material, labor and factory overhead.
Property, Plant and Equipment, and Depreciation
Property, plant and equipment is carried at cost and includes expenditures for major improvements. Depreciation
is generally provided on the straight-line method based upon estimated useful lives ranging from 15 to 30 years for
buildings, and 3 to 10 years for machinery and equipment. Depreciation expense was $23,578,000, $21,609,000 and
$17,510,000 for fiscal years 2005, 2004 and 2003, respectively.
Debt Issuance Costs
Costs incurred to issue debt are deferred and amortized as interest expense over the term of the related debt using
a method that approximates the effective interest method.
Long-lived Assets
The carrying amount of long-lived assets is reviewed periodically for impairment. An asset (other than goodwill
and indefinite lived intangible assets) is considered impaired when estimated future cash flows are less than the
carrying amount of the asset. In the event the carrying amount of such asset is not deemed recoverable, the asset
is adjusted to its estimated fair value. Fair value is generally determined based upon estimated discounted future
cash flows.
Goodwill and Intangibles
Beginning in fiscal 2002 with the adoption of Statement No. 142, goodwill is no longer amortized, but instead tested
for impairment at least annually. A reporting unit is generally defined at the operating segment level or at the
component level one level below the operating segment, if said component constitutes a business. Goodwill and in-
tangible assets are allocated to reporting units based upon the purchase price of the acquired unit, the valuation of
acquired tangible and intangible assets, and liabilities assumed. When a reporting unit’s carrying value exceeds its
estimated fair value, an impairment test is required. This test involves allocating the fair value of the reporting unit
to all of the assets and liabilities of that unit, with the excess of fair value over allocated net assets representing
the fair value of goodwill. An impairment loss is measured as the amount by which the carrying value of goodwill
exceeds the estimated fair value of goodwill. Prior to fiscal 2002, goodwill was amortized on a straight-line basis
over the period of expected benefit which ranged from 10 to 40 years.

62 | ESTERLINE 0 5 | Notes
Intangible assets are amortized using the straight-line method over their estimated period of benefit, ranging
from 2 to 20 years. The Company periodically evaluates the recoverability of intangible assets and takes into account
events or circumstances that warrant revised estimates of useful lives or that indicate that an impairment exists.
Indefinite lived intangible assets (other than goodwill) are tested annually for impairment or more frequently on
an interim basis if circumstances require. This test is comparable to the impairment test for goodwill described
above.
Environmental
Environmental exposures are provided for at the time they are known to exist or are considered probable and rea-
sonably estimable. No provision has been recorded for environmental remediation costs which could result from
changes in laws or other circumstances currently not contemplated by the Company. Costs provided for future
expenditures on environmental remediation are not discounted to present value.
Stock-based Compensation
The Company accounts for its stock-based compensation plans in accordance with Accounting Principles Board
Opinion No. 25. The variable method of accounting is used to account for stock option plans where the option hold-
ers are permitted to exercise options by surrendering the option subject to the grant in payment of the exercise
price of the option and the related statutory taxes. No compensation cost is recognized at the grant date because
the exercise price of all stock option grants is equal to the market price of the Company’s common stock as of the
date of the grant. However, subsequent changes in the market price of the Company’s common stock to the date
of exercise or forfeiture results in a change in measure of compensation cost. Additional disclosures as required
under Financial Accounting Standards No. 123, “Accounting for Stock-Based Compensation” (Statement No. 123),
are included below. Options granted become exercisable ratably over a period of four years following the date of
the grant and expire on the tenth anniversary of the grant. The Black-Scholes option-pricing model was used to
calculate the estimated compensation expense that would have been recognized under these guidelines for each
vesting tranche.
As prescribed by Statement No. 123, including compensation cost for the Company’s stock option and employee
stock purchase plans, pro forma disclosures for fiscal years 2005, 2004 and 2003 would have been:
In Thousands, Except Per Share Amounts 2005 2004 2003
Net earnings as reported $ 58,026 $ 39,583 $ 22,835
Stock-based compensation cost, net of income tax included
in net earnings as reported 1,862 2,906 1,061
Stock-based compensation cost, net of income tax under
the fair value method of accounting (2,504) (1,784) (1,295)
Pro forma net earnings 57,384 40,705 22,601
Basic earnings per share as reported $ 2.33 $ 1.87 $ 1.09
Pro forma basic earnings per share 2.30 1.92 1.08
Diluted earnings per share as reported $ 2.29 $ 1.84 $ 1.08
Pro forma diluted earnings per share 2.26 1.89 1.07

63 | ESTERLINE 0 5 | Notes
The weighted average Black-Scholes value of options granted during fiscal years 2005, 2004 and 2003 was $19.56,
$12.81 and $9.72, respectively. The assumptions used in the Black-Scholes option-pricing model for fiscal years
2005, 2004 and 2003 were as follows:
2005 2004 2003
Volatility 45.3% 47.1% 48.5%
Risk-free interest rate 4.48 – 4.60% 3.12 – 3.84% 2.88 – 3.94%
Expected life (years) 6 – 9 5 – 8 5 – 8
Dividends — — —
Product Warranties
Estimated product warranty expenses are recorded when the covered products are shipped to customers and rec-
ognized as revenue. Product warranty expense is estimated based upon the terms of the warranty program.
Earnings Per Share
Basic earnings per share is computed on the basis of the weighted average number of common shares outstanding
during the year. Diluted earnings per share also includes the dilutive effect of stock options. The weighted average
number of shares outstanding used to compute basic earnings per share was 24,927,000, 21,195,000 and 20,900,000
for the fiscal years 2005, 2004 and 2003, respectively. The weighted average number of shares outstanding used to
compute diluted earnings per share was 25,302,000, 21,539,000 and 21,105,000 for the fiscal years 2005, 2004 and 2003,
respectively.
Recent Accounting Pronouncements
On December 16, 2004, the Financial Accounting Standards Board issued Statement of Financial Accounting Stan-
dards No. 123(R), “Share-Based Payment,” which is a revision of Statement No. 123. Statement 123(R) supersedes
APB Opinion No. 25 and amends Statement of Financial Accounting Standards No. 95, “Statement of Cash Flows.”
Generally, the approach in Statement 123(R) is similar to the approach described in Statement 123. However,
Statement 123(R) requires all share-based payments to employees, including grants of employee stock options, to
be recognized in the income statement based on their fair values. Pro forma disclosure is no longer an alternative.
Statement 123(R) originally required adoption no later than July 30, 2005. In April 2005, the Securities and Ex-
change Commission (SEC) issued a release that amends the compliance dates for Statement 123(R). Under the
SEC’s new rule, the Company will be required to apply Statement 123(R) as of October 29, 2005. The Company will
adopt Statement 123(R) on October 29, 2005.
Statement 123(R) permits public companies to adopt its requirements using one of two methods:
A “modified prospective” method in which compensation cost is recognized beginning with the effective date
(a) based on the requirements of Statement 123(R) for all share-based payments granted after the effective
date and (b) based on the requirements of Statement 123 for all awards granted to employees prior to the
effective date of Statement 123(R) that remain unvested on the effective date.
A “modified retrospective” method which includes the requirements of the modified prospective method
described above, but also permits entities to restate, based on the amounts previously recognized under
Statement 123 for purposes of pro forma disclosures, either (a) all prior periods presented or (b) prior interim
periods of the year of adoption. The Company will adopt Statement 123 using the “modified prospective”
method.

64 | ESTERLINE 0 5 | Notes
As permitted by Statement 123, the Company currently accounts for share-based payments to employees in ac-
cordance with APB No. 25. The variable method of accounting is used to account for stock option plans where the
option holders are permitted to exercise options by surrendering the option subject to the grant in payment of the
exercise price of the option and the related statutory taxes. The adoption of Statement 123(R)’s fair value method
will have no impact on the Company’s overall financial position. The impact of adoption of Statement 123(R) on
the income statement cannot be predicted at this time because it will depend on levels of share-based payments
granted in the future. However, had the Company adopted Statement 123(R) in prior periods, the impact of that
standard would have approximated the impact of Statement 123 as described above in the disclosure of pro forma
net income and earnings per share.
In March 2005, the Financial Accounting Standards Board issued FASB Interpretation No. (FIN) 47 – “Account-
ing for Conditional Asset Retirement Obligations, an interpretation of FASB Statement No. 143,” which clarifies
the term “conditional asset retirement obligation” as used in SFAS No. 143, “Accounting for Asset Retirement
Obligations.” Specifically, FIN 47 provides that an asset retirement obligation is conditional when either the tim-
ing and (or) method of settling the obligation is conditioned on a future event. Accordingly, an entity is required
to recognize a liability for the fair value of a conditional asset retirement obligation if the fair market value of the
liability can be reasonably estimated. Uncertainty about the timing and (or) method of settlement of a conditional
asset retirement obligation should be factored into the measurement of the liability when sufficient information
exists. This interpretation also clarifies when an entity would have sufficient information to reasonably estimate
the fair value of an asset retirement obligation. FIN 47 is effective for fiscal years ending after December 15, 2005.
Management does not believe that the adoption of FIN 47 will have a material impact on the consolidated results of
operations and financial condition.
In November 2004, the Financial Accounting Standards Board issued Statement of Financial Accounting Stan-
dards No. 151, “Inventory Costs – An Amendment of ARB No. 43, Chapter 4.” Statement No. 151 amends the guid-
ance in ARB No. 43, Chapter 4, “Inventory Pricing,” to clarify the accounting for abnormal amounts of idle facility
expense, freight, handling costs and wasted material (spoilage). Among other provisions, the new rule requires
that items, such as idle facility expense, excessive spoilage, double freight and rehandling costs, be recognized as
current period charges regardless of whether they meet the criterion of “so abnormal” as stated in ARB No. 43. Ad-
ditionally, Statement No. 151 requires that the allocation of fixed production overheads to the costs of conversion be
based on the normal capacity of the production facilities. Statement No. 151 is effective for fiscal years beginning
after June 15, 2005 and is required to be adopted by the Company in the first quarter of fiscal 2006. Management
does not believe that the adoption of Statement No. 151 will have a material impact on the consolidated results of
operations and financial condition.

65 | ESTERLINE 0 5 | Notes
Note Two. Discontinued Operations
On July 25, 2002, the Board of Directors adopted a formal plan for the sale of the assets and operations of the
Company’s Automation segment. As a result, the consolidated financial statements present the Automation seg-
ment as a discontinued operation. The Company recorded an after-tax loss from discontinued operations of $5.8
million in fiscal 2003. On July 23, 2003, the Company sold the assets of its Excellon Automation subsidiary. On
August 31, 2004, the Company sold the stock of W. A. Whitney for $10.0 million in cash. Upon the final disposition
of its discontinued operations, the Company recorded an $8.0 million gain, net of $4.5 million in tax, including the
reversal of estimated reserves, which were recognizable upon the sale of the business. On January 28, 2005, the
Company completed the sale of the outstanding stock of its wholly owned subsidiary Fluid Regulators Corporation
(Fluid Regulators), which was included in the Sensors & Systems segment, for approximately $23.7 million. As a
result of the sale, the Company recorded a gain of approximately $7.0 million, net of tax of $2.4 million, in the first
fiscal quarter of 2005. On May 13, 2005, the Company closed a small unit in its Other segment and incurred $0.4 mil-
lion in severance, net of $0.2 million in tax, in the second quarter of fiscal 2005.
Sales of the discontinued operations were $4,421,000, $31,451,000 and $36,264,000 in fiscal years 2005, 2004 and
2003, respectively. The operating results of the discontinued segment for fiscal years 2005, 2004 and 2003 consist of
the following:
In Thousands 2005 2004 2003
Income (loss) before taxes $ (52) $ 3,261 $ 789
Tax expense (benefit) (13) 1,067 293
Net income (loss) (39) 2,194 496
Gain (loss) on disposal,
including tax expense (benefit)
of $2,435, $4,507 and $(3,474) 7,031 8,014 (5,808)
Income (loss) from discontinued operations $ 6,992 $ 10,208 $ (5,312)
Note Three. Inventories
Inventories at the end of fiscal 2005 and 2004 consisted of the following:
In Thousands 2005 2004
Raw materials and purchased parts $ 64,377 $ 58,736
Work in process 45,798 43,326
Finished goods 20,294 16,992
$ 130,469 $ 119,054
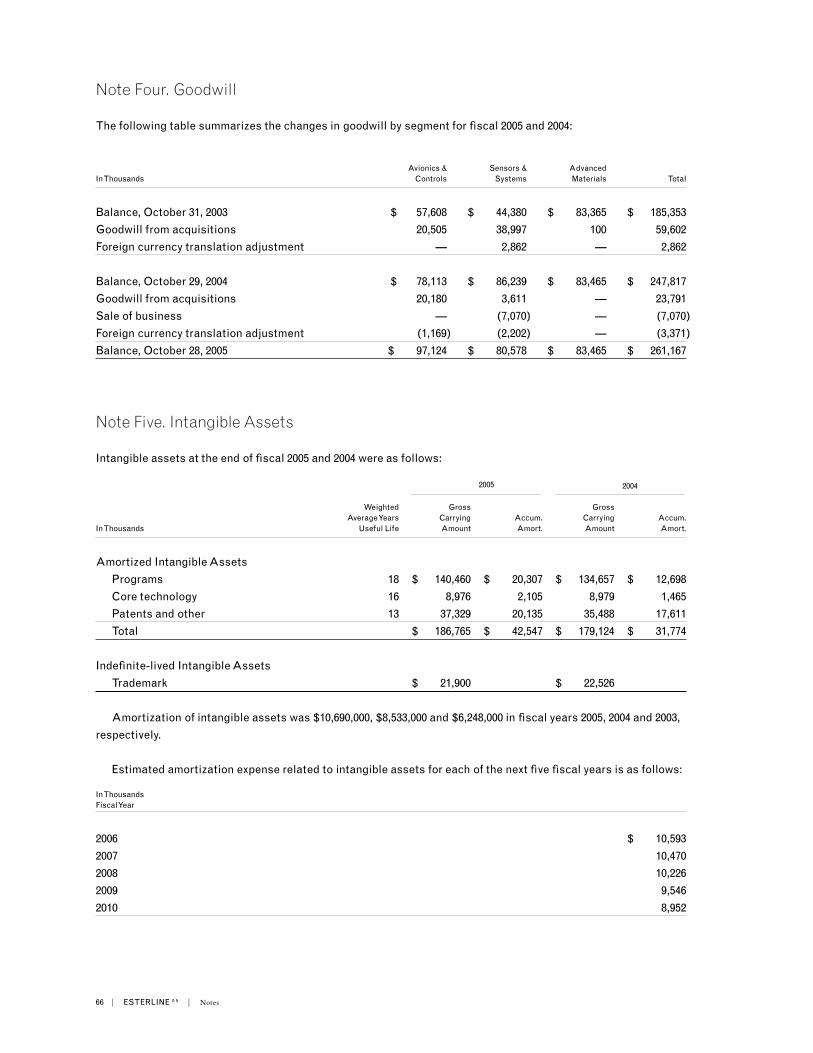
66 | ESTERLINE 0 5 | Notes
Note Four. Goodwill
The following table summarizes the changes in goodwill by segment for fiscal 2005 and 2004:
Avionics & Sensors & Advanced
In Thousands Controls Systems Materials Total
Balance, October 31, 2003 $ 57,608 $ 44,380 $ 83,365 $ 185,353
Goodwill from acquisitions 20,505 38,997 100 59,602
Foreign currency translation adjustment — 2,862 — 2,862
Balance, October 29, 2004 $ 78,113 $ 86,239 $ 83,465 $ 247,817
Goodwill from acquisitions 20,180 3,611 — 23,791
Sale of business — (7,070) — (7,070)
Foreign currency translation adjustment (1,169) (2,202) — (3,371)
Balance, October 28, 2005 $ 97,124 $ 80,578 $ 83,465 $ 261,167
Note Five. Intangible Assets
Intangible assets at the end of fiscal 2005 and 2004 were as follows:
2005
2004
Weighted Gross Gross Average Years Carrying Accum. Carrying Accum.
In Thousands Useful Life Amount Amort. Amount Amort.
Amortized Intangible Assets
Programs 18 $ 140,460 $ 20,307 $ 134,657 $ 12,698
Core technology 16 8,976 2,105 8,979 1,465
Patents and other 13 37,329 20,135 35,488 17,611
Total $ 186,765 $ 42,547 $ 179,124 $ 31,774
Indefinite-lived Intangible Assets
Trademark $ 21,900 $ 22,526
Amortization of intangible assets was $10,690,000, $8,533,000 and $6,248,000 in fiscal years 2005, 2004 and 2003,
respectively.
Estimated amortization expense related to intangible assets for each of the next five fiscal years is as follows:
In ThousandsFiscal Year
2006 $ 10,593
2007 10,470
2008 10,226
2009 9,546
2010 8,952

67 | ESTERLINE 0 5 | Notes
Note Six. Accrued Liabilities
Accrued liabilities at the end of fiscal 2005 and 2004 consisted of the following:
In Thousands 2005 2004
Payroll and other compensation $ 47,781 $ 39,316
Casualty and medical 13,022 11,940
Interest 6,962 6,338
Warranties 8,811 6,633
State and other tax accruals 13,537 9,001
Acquisition related payments 7,895 8,510
Customer deposits 6,203 —
Other 14,904 15,300
$ 119,115 $ 97,038
Note Seven. Other Liabilities
Other liabilities at the end of fiscal 2005 and 2004 consisted of the following:
In Thousands 2005 2004
Pension obligation $ 22,994 $ 24,852
Acquisition related payments 4,243 5,000
$ 27,237 $ 29,852
Note Eight. Retirement Benefits
Pension benefits are provided for approximately 37% of all U.S. employees under the Esterline contributory pension
plan or the Leach noncontributory defined benefit pension plan.
Under the Esterline plan, pension benefits are based on years of service and five-year average compensation
or under a cash balance formula, with annual pay credits ranging from 2% to 6% of salary. Esterline amended its
defined benefit plan to add the cash balance formula effective January 1, 2003. Participants elected either to con-
tinue earning benefits under the current plan formula or to earn benefits under the cash balance formula. Effec-
tive January 1, 2003, all new participants are enrolled in the cash balance formula. Esterline also has an unfunded
supplemental retirement plan for key executives providing for periodic payments upon retirement.
Under the Leach noncontributory defined benefit pension plan, benefits are based on an employee’s years of
service and the highest five consecutive years’ compensation during the last ten years of employment. Leach’s
non-U.S. subsidiaries have retirement plans covering substantially all of its employees. Benefits become vested
after ten years of employment and are due in full upon retirement, disability or death of the employee. Leach also
has a supplemental retirement plan which provides supplemental pension benefits to key management in addition
to amounts received under the Company’s existing retirement plan.
The Company accounts for pension expense using the end of the fiscal year as its measurement date. In addi-
tion, the Company makes actuarially computed contributions to these plans as necessary to adequately fund ben-
efits. The Company’s funding policy is consistent with the minimum funding requirements of ERISA. The Esterline

68 | ESTERLINE 0 5 | Notes
plan will require no contributions in fiscal 2006. Effective December 2003, the Leach plan was frozen and employees
no longer accrue benefits for future services. The accumulated benefit obligation and projected benefit obligation
for the Leach plans are $46,006,000 and $46,471,000, respectively, with plan assets of $23,172,000 as of October 28,
2005. The accrued benefit liabilities for these Leach plans are $17,403,000 at October 28, 2005. Contributions to the
Leach plans totaled $5,196,000 in fiscal 2005. No contributions are required for fiscal 2006.
Principal assumptions as of fiscal year end: 2005 2004
Principal assumptions as of fiscal year end:
Discount Rate 5.5% 6.0%
Rate of increase in future compensation levels 4.5% 4.5%
Assumed long-term rate of return on plan assets 8.5% 8.5%
Plan assets are invested in a diversified portfolio of equity and debt securities, consisting primarily of common
stocks, bonds and government securities. The objective of these investments is to maintain sufficient liquidity to
fund current benefit payments and achieve targeted risk-adjusted returns. Management periodically reviews al-
locations of plan assets by investment type and evaluates external sources of information regarding the long-term
historical returns and expected future returns for each investment type and, accordingly, believes an 8.5% assumed
long-term rate of return on plan assets is appropriate. Allocations by investment type are as follows:
Actual
Plan assets allocation as of fiscal year end: Target 2005 2004
Equity securities 65 – 75% 65.4% 67.4%
Debt securities 25 – 35% 32.2% 32.6%
Cash 0% 2.4% —
Total 100.0% 100.0%
Net periodic pension cost for the Company’s defined benefit plans at the end of each fiscal year consisted of the
following:
In Thousands 2005 2004 2003
Components of Net Periodic Cost
Service cost $ 3,537 $ 3,838 $ 3,524
Interest cost 10,055 7,618 7,088
Expected return on plan assets (11,851) (9,766) (8,416)
Amortization of transition asset — — 77
Amortization of prior service cost 18 19 18
Amortization of actuarial loss 1,260 468 1,596
Net periodic cost $ 3,019 $ 2,177 $ 3,887

The funded status of the defined benefit pension plans at the end of fiscal 2005 and 2004 were as follows:
In Thousands 2005 2004
Benefit Obligation
Beginning balance $ 166,328 $ 114,196Currency translation adjustment (325) —Service cost 3,537 3,838Interest cost 10,055 7,620Actuarial loss 19,412 7,300Acquisitions 1,127 40,542Benefits paid (9,805) (7,168)Ending balance $ 190,329 $ 166,328
Plan Assets – Fair Value
Beginning balance $ 142,311 $ 115,202Actual gain on plan assets 17,357 14,577Acquisitions 976 19,141Company contributions 5,232 559Benefits paid (10,412) (7,168)Ending balance $ 155,464 $ 142,311
Reconciliation of Funded Status to Net Amount Recognized
Funded status – plan assets relative to benefit obligation $ (34,865) $ (24,017)Unrecognized net actuarial loss 31,119 17,910Unrecognized prior service benefit (31) (12)Unrecognized net loss 27 (31)Net amount recognized $ (3,750) $ (6,150)
Amount Recognized in the Consolidated Balance Sheet
Prepaid benefit cost $ 16,129 $ 17,647Accrued benefit liability (21,461) (25,277)Additional minimum liability (5,872) —Intangible assets 107 141Accumulated other comprehensive income 7,347 1,339Net amount recognized $ (3,750) $ (6,150)
The accumulated benefit obligation for all pension plans was $180,844,351 at October 28, 2005 and $159,689,514
at October 29, 2004.
Estimated future benefit payments expected to be paid from the plan or from our assets are as follows:
In Thousands
2006 $ 10,733
2007 11,132
2008 11,648
2009 12,099
2010 12,441
2011 - 2015 68,005
Employees may participate in certain defined contribution plans. The Company’s contribution expense under
these plans totaled $7,133,000, $5,796,000 and $4,790,000 in fiscal 2005, 2004 and 2003, respectively.
69 | ESTERLINE 0 5 | Notes

70 | ESTERLINE 0 5 | Notes
Note Nine. Income Taxes
Income tax expense from continuing operations for each of the fiscal years consisted of:
In Thousands 2005 2004 2003
Current
U.S. Federal $ 13,726 $ 7,835 $ 10,063
State 2,657 1,000 600
Foreign 4,419 284 2,230
20,802 9,119 12,893
Deferred
U.S. Federal (1,656) 3,705 (1,435)
State (1,104) 847 (180)
Foreign (1,741) (4,079) 1,180
(4,501) 473 (435)
Income tax expense $ 16,301 $ 9,592 $ 12,458
U.S. and foreign components of income from continuing operations before income taxes for each of the fiscal
years were:
In Thousands 2005 2004 2003
U.S. $ 40,162 $ 32,705 $ 33,896
Foreign 27,508 6,284 6,709
Income from continuing operations,
before income taxes $ 67,670 $ 38,989 $ 40,605
Primary components of the Company’s deferred tax assets (liabilities) at the end of the fiscal year resulted from
temporary tax differences associated with the following:
In Thousands 2005 2004
Reserves and liabilities $ 18,320 $ 12,667
NOL carryforwards 11,343 13,677
Tax credit carryforwards 2,274 2,116
Employee benefits 5,689 3,740
Non-qualified stock options 2,066 2,515
Other 496 1,158
Total deferred tax assets 40,188 35,873
Depreciation and amortization (17,083) (14,851)
Intangibles and amortization (29,338) (25,310)
Retirement benefits — (4,440)
Other — —
Total deferred tax liabilities (46,421) (44,601)
Net deferred tax liabilities $ (6,233) $ (8,728)

71 | ESTERLINE 0 5 | Notes
In connection with the Leach acquisition in fiscal 2004, the Company assumed a U.S. net operating loss (NOL)
of $38.6 million which can be carried forward to subsequent years, subject to limitations under Internal Revenue
Code Section 382. Approximately $2.4 million of the tax benefit associated with the NOL carryforward is included
in current deferred income tax benefits each year, reflecting the amount of NOL available in the current year under
Section 382. The remainder is reported as non-current deferred income tax benefits, reflecting the amount of the
NOL that is expected to be utilized in future fiscal years. The non-current deferred income tax benefit associated
with the NOL was $9.0 million and $11.2 million at the end of fiscal 2005 and 2004, respectively. The NOL expires
beginning in 2022.
The incremental tax benefit received by the Company upon exercise of non-qualified employee stock options
was $1.2 million and $0.5 million in fiscal 2005 and 2004, respectively. There was no incremental tax benefit in fiscal
2003.
No valuation allowance was considered necessary on deferred tax assets.
The statute of limitation for U.S. federal income taxes for fiscal years ended 2002, 2003 and 2004 remain open for
examination. Additionally, various state and foreign income tax returns are open to or are presently under exami-
nation. Such examinations could result in challenges to tax positions taken and, accordingly, the Company may
record adjustments to provisions based on the outcomes of such matters. However, the Company believes that
the resolution of these matters, after considering amounts accrued, will not have a material adverse effect on its
consolidated financial statements.
A reconciliation of the U.S. federal statutory income tax rate to the effective income tax rate for each of the fis-
cal years was as follows:
2005 2004 2003
U.S. statutory income tax rate 35.0% 35.0% 35.0%
State income taxes 1.5 1.7 1.0
Foreign taxes (6.6) (5.8) (0.7)
Export sales benefit (1.2) (1.7) (2.0)
Pass-through entities 0.9 6.8 —
Foreign tax credits — (5.6) —
Research & development credits (3.8) (4.4) (5.1)
Tax accrual adjustment (2.5) (1.8) 2.0
Other, net 0.8 0.4 0.5
Effective income tax rate 24.1% 24.6% 30.7%
The effective tax rate differed from the statutory rate in fiscal 2005, 2004 and 2003, as all years benefited from
various tax credits and export sales incentives. In fiscal 2005, the Company recognized a $2.0 million reduction of
previously estimated tax liabilities due to the expiration of the statute of limitations and adjustments resulting
from a reconciliation of U.S. and non-U.S. tax returns to the provision for income taxes. In fiscal 2004 the Company
recognized a $1.9 million reduction in income taxes associated with the favorable resolution of ongoing income tax
audits.
In fiscal 2005, the Company completed its evaluation of the repatriation provision of the American Jobs Cre-
ation Act (the Act), signed into law on October 22, 2004. The Act created a special one-time deduction related to
the repatriation of certain foreign earnings. Based upon its evaluation, the Company has elected to not repatriate
earnings from its foreign subsidiaries.
No provision for federal income taxes has been made on accumulated earnings of foreign subsidiaries, since
such earnings are considered indefinitely reinvested. The amount of the unrecognized deferred tax liability for
temporary differences related to investments in foreign subsidiaries is not practical to determine because of the
complexities regarding the calculation of unremitted earnings and the potential for tax credits.
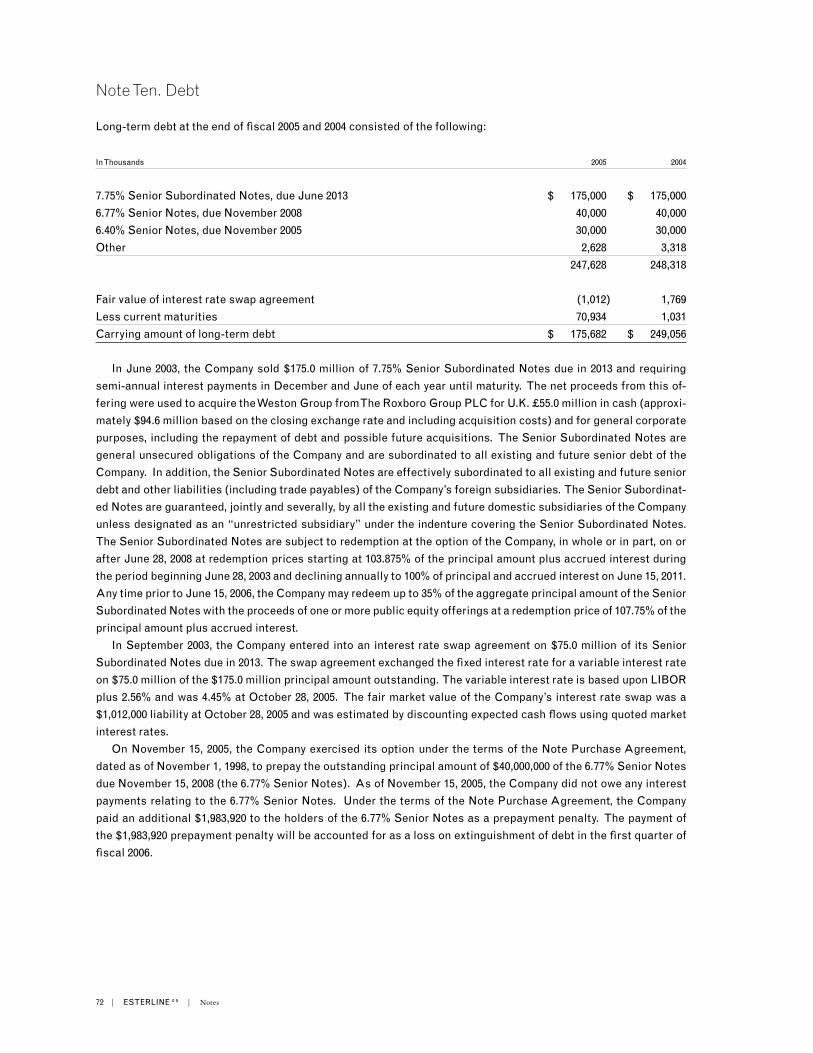
72 | ESTERLINE 0 5 | Notes
Note Ten. Debt
Long-term debt at the end of fiscal 2005 and 2004 consisted of the following:
In Thousands 2005 2004
7.75% Senior Subordinated Notes, due June 2013 $ 175,000 $ 175,000
6.77% Senior Notes, due November 2008 40,000 40,000
6.40% Senior Notes, due November 2005 30,000 30,000
Other 2,628 3,318
247,628 248,318
Fair value of interest rate swap agreement (1,012) 1,769
Less current maturities 70,934 1,031
Carrying amount of long-term debt $ 175,682 $ 249,056
In June 2003, the Company sold $175.0 million of 7.75% Senior Subordinated Notes due in 2013 and requiring
semi-annual interest payments in December and June of each year until maturity. The net proceeds from this of-
fering were used to acquire the Weston Group from The Roxboro Group PLC for U.K. £55.0 million in cash (approxi-
mately $94.6 million based on the closing exchange rate and including acquisition costs) and for general corporate
purposes, including the repayment of debt and possible future acquisitions. The Senior Subordinated Notes are
general unsecured obligations of the Company and are subordinated to all existing and future senior debt of the
Company. In addition, the Senior Subordinated Notes are effectively subordinated to all existing and future senior
debt and other liabilities (including trade payables) of the Company’s foreign subsidiaries. The Senior Subordinat-
ed Notes are guaranteed, jointly and severally, by all the existing and future domestic subsidiaries of the Company
unless designated as an “unrestricted subsidiary” under the indenture covering the Senior Subordinated Notes.
The Senior Subordinated Notes are subject to redemption at the option of the Company, in whole or in part, on or
after June 28, 2008 at redemption prices starting at 103.875% of the principal amount plus accrued interest during
the period beginning June 28, 2003 and declining annually to 100% of principal and accrued interest on June 15, 2011.
Any time prior to June 15, 2006, the Company may redeem up to 35% of the aggregate principal amount of the Senior
Subordinated Notes with the proceeds of one or more public equity offerings at a redemption price of 107.75% of the
principal amount plus accrued interest.
In September 2003, the Company entered into an interest rate swap agreement on $75.0 million of its Senior
Subordinated Notes due in 2013. The swap agreement exchanged the fixed interest rate for a variable interest rate
on $75.0 million of the $175.0 million principal amount outstanding. The variable interest rate is based upon LIBOR
plus 2.56% and was 4.45% at October 28, 2005. The fair market value of the Company’s interest rate swap was a
$1,012,000 liability at October 28, 2005 and was estimated by discounting expected cash flows using quoted market
interest rates.
On November 15, 2005, the Company exercised its option under the terms of the Note Purchase Agreement,
dated as of November 1, 1998, to prepay the outstanding principal amount of $40,000,000 of the 6.77% Senior Notes
due November 15, 2008 (the 6.77% Senior Notes). As of November 15, 2005, the Company did not owe any interest
payments relating to the 6.77% Senior Notes. Under the terms of the Note Purchase Agreement, the Company
paid an additional $1,983,920 to the holders of the 6.77% Senior Notes as a prepayment penalty. The payment of
the $1,983,920 prepayment penalty will be accounted for as a loss on extinguishment of debt in the first quarter of
fiscal 2006.

73 | ESTERLINE 0 5 | Notes
Maturities of long-term debt at October 28, 2005, were as follows:
In ThousandsFiscal Year
2006 $ 70,934
2007 763
2008 464
2009 390
2010 22
2011 and thereafter 175,055
$ 247,628
Short-term credit facilities at the end of fiscal 2005 and 2004 consisted of the following:
2005 2004
Outstanding Interest Outstanding Interest
In Thousands Borrowings Rate Borrowings Rate
U.S. $ — — $ 5,000 3.46%
Foreign 2,031 2.76% 1,977 2.72%
$ 2,031 $ 6,977
At October 28, 2005, the Company’s primary U.S. dollar credit facility totals $60,000,000 and is made available
through a group of banks. The credit agreement is secured by substantially all of the Company’s assets and inter-
est is based on standard inter-bank offering rates. An additional $11,559,000 of unsecured foreign currency credit
facilities have been extended by foreign banks for a total of $71,559,000 available companywide. Subsequent to
year-end, the U.S. credit facility was increased to $100,000,000.
A number of underlying agreements contain various covenant restrictions which include maintenance of net
worth, payment of dividends, interest coverage and limitations on additional borrowings. The Company was in com-
pliance with these covenants at October 28, 2005. Available credit under the above credit facilities was $58,370,000
at fiscal 2005 year end, when reduced by outstanding borrowings of $2,031,000 and letters of credit of $11,158,000.
The fair market value of the Company’s long-term debt and short-term borrowings was estimated at $252,330,000
and $271,069,000 at fiscal year end 2005 and 2004, respectively. These estimates were derived using discounted cash
flows with interest rates currently available to the Company for issuance of debt with similar terms and remaining
maturities.

74 | ESTERLINE 0 5 | Notes
Note Eleven. Commitments and Contingencies
Rental expense for operating leases totaled $9,651,000, $9,482,000 and $7,961,000 in fiscal years 2005, 2004 and 2003,
respectively.
At October 28, 2005, the Company’s rental commitments for noncancelable operating leases with a duration in
excess of one year were as follows:
In ThousandsFiscal Year
2006 $ 9,257
2007 8,809
2008 7,488
2009 7,291
2010 6,895
2011 and thereafter 17,572
$ 57,312
The Company is a party to various lawsuits and claims, both as plaintiff and defendant, and has contingent li-
abilities arising from the conduct of business, none of which, in the opinion of management, is expected to have
a material effect on the Company’s financial position or results of operations. The Company believes that it has
made appropriate and adequate provisions for contingent liabilities.
Approximately 974 U.S.-based employees or 22% of total U.S.-based employees were represented by various
labor unions. In April 2005, a collective bargaining agreement covering about 100 employees expired and a succes-
sor agreement was reached with the labor union. Additionally, a collective bargaining agreement covering about
100 employees was reached in June 2005. A third agreement covering about 200 employees will expire in June 2006
and a fourth agreement covering about 100 employees will expire in September 2006. Management believes that
the Company has established a good relationship with these employees and their union. The Company’s European
operations are subject to national trade union agreements and to local regulations governing employment.
Note Twelve. Employee Stock Plans
In March 2002, the Company’s shareholders approved the establishment of an Employee Stock Purchase Plan
(ESPP) under which 300,000 shares of the Company’s common stock are reserved for issuance to employees. The
plan qualifies as a noncompensatory employee stock purchase plan under Section 423 of the Internal Revenue
Code. Employees are eligible to participate through payroll deductions subject to certain limitations.
At the end of each offering period, usually six months, shares are purchased by the participants at 85% of the
lower of the fair market value on the first day of the offering period or the purchase date. During fiscal 2005, em-
ployees purchased 63,209 shares at a fair market value price of $29.34 per share, leaving a balance of 122,978 shares
available for issuance in the future. As of October 28, 2005, deductions aggregating $767,465 were accrued for the
purchase of shares on December 15, 2005.
The Company also provides a nonqualified stock option plan for officers and key employees. At the end of fis-
cal 2005, the Company had 1,677,450 shares reserved for issuance to officers and key employees, of which 276,350
shares were available to be granted in the future.
The Board of Directors authorized the Compensation Committee to administer option grants and their terms.
Awards under the 2004 plan may be granted to eligible employees of the Company over the 10-year period ending
March 3, 2014. Options granted become exercisable ratably over a period of four years following the date of grant
and expire on the tenth anniversary of the grant. Option exercise prices are equal to the fair market value of the
Company’s common stock on the date of grant.
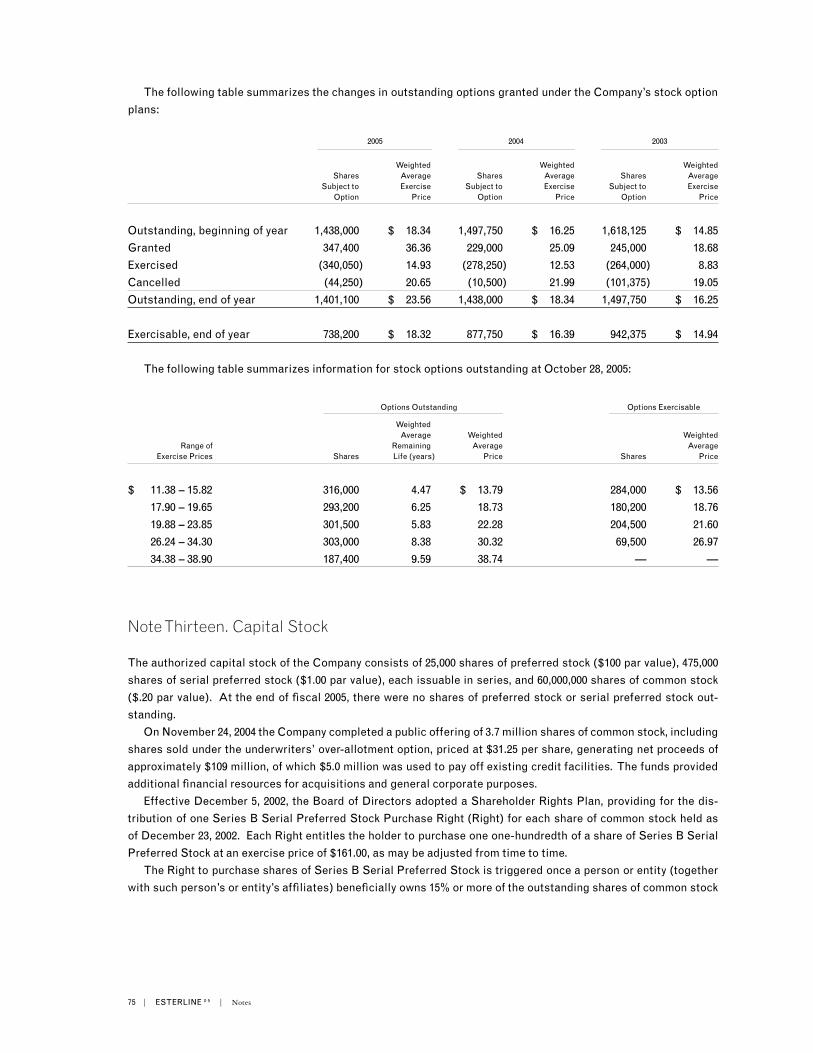
75 | ESTERLINE 0 5 | Notes
The following table summarizes the changes in outstanding options granted under the Company’s stock option
plans:
2005 2004 2003
Weighted Weighted Weighted
Shares Average Shares Average Shares Average Subject to Exercise Subject to Exercise Subject to Exercise
Option Price Option Price Option Price
Outstanding, beginning of year 1,438,000 $ 18.34 1,497,750 $ 16.25 1,618,125 $ 14.85
Granted 347,400 36.36 229,000 25.09 245,000 18.68
Exercised (340,050) 14.93 (278,250) 12.53 (264,000) 8.83
Cancelled (44,250) 20.65 (10,500) 21.99 (101,375) 19.05
Outstanding, end of year 1,401,100 $ 23.56 1,438,000 $ 18.34 1,497,750 $ 16.25
Exercisable, end of year 738,200 $ 18.32 877,750 $ 16.39 942,375 $ 14.94
The following table summarizes information for stock options outstanding at October 28, 2005:
Options Outstanding Options Exercisable
Weighted
Average Weighted Weighted Range of Remaining Average Average
Exercise Prices Shares Life (years) Price Shares Price
$ 11.38 – 15.82 316,000 4.47 $ 13.79 284,000 $ 13.56
17.90 – 19.65 293,200 6.25 18.73 180,200 18.76
19.88 – 23.85 301,500 5.83 22.28 204,500 21.60
26.24 – 34.30 303,000 8.38 30.32 69,500 26.97
34.38 – 38.90 187,400 9.59 38.74 — —
Note Thirteen. Capital Stock
The authorized capital stock of the Company consists of 25,000 shares of preferred stock ($100 par value), 475,000
shares of serial preferred stock ($1.00 par value), each issuable in series, and 60,000,000 shares of common stock
($.20 par value). At the end of fiscal 2005, there were no shares of preferred stock or serial preferred stock out-
standing.
On November 24, 2004 the Company completed a public offering of 3.7 million shares of common stock, including
shares sold under the underwriters’ over-allotment option, priced at $31.25 per share, generating net proceeds of
approximately $109 million, of which $5.0 million was used to pay off existing credit facilities. The funds provided
additional financial resources for acquisitions and general corporate purposes.
Effective December 5, 2002, the Board of Directors adopted a Shareholder Rights Plan, providing for the dis-
tribution of one Series B Serial Preferred Stock Purchase Right (Right) for each share of common stock held as
of December 23, 2002. Each Right entitles the holder to purchase one one-hundredth of a share of Series B Serial
Preferred Stock at an exercise price of $161.00, as may be adjusted from time to time.
The Right to purchase shares of Series B Serial Preferred Stock is triggered once a person or entity (together
with such person’s or entity’s affiliates) beneficially owns 15% or more of the outstanding shares of common stock

76 | ESTERLINE 0 5 | Notes
of the Company (such person or entity, an Acquiring Person). When the Right is triggered, the holder may pur-
chase one one-hundredth of a share of Series B Serial Preferred Stock at an exercise price of $161.00 per share.
If after the Rights are triggered, (i) the Company is the surviving corporation in a merger or similar transac-
tion with an Acquiring Person, (ii) the Acquiring Person beneficially owns more than 15% of the outstanding
shares of common stock or (iii) the Acquiring Person engages in other “self-dealing” transactions, holders of
the Rights can elect to purchase shares of common stock of the Company with a market value of twice the exer-
cise price. Similarly, if after the Rights are triggered, the Company is not the surviving corporation of a merger
or similar transaction or the Company sells 50% or more of its assets to another person or entity, holders of the
Rights may elect to purchase shares of common stock of the surviving corporation or that person or entity who
purchased the Company’s assets with a market value of twice the exercise price.
Note Fourteen. Acquisitions and Divestitures
Acquisitions
On June 3, 2005, the Company acquired all of the outstanding capital stock of Palomar Products, Inc. (Palomar), a
$25 million (estimated annual sales) California-based manufacturer of secure military communications products,
for $21.3 million before a $4.2 million escrow deposit, acquisition costs and the change in net equity value from
December 31, 2004 to close. A purchase price adjustment is payable to the seller contingent upon achievement of
financial results through December 31, 2005, as described in the Stock Purchase Agreement. Palomar’s products
extend the Company’s avionics and controls product lines. Palomar is included in the Avionics & Controls segment
and the results of its operations were included from the effective date of the acquisition.
The following summarizes the estimated fair market value of the assets acquired and liabilities assumed at
the date of acquisition. The allocation of the purchase price was based upon a preliminary valuation report and is
subject to refinement regarding the tax basis of assets acquired. The amount allocated to goodwill is not expected
to be deductible for income tax purposes.
In ThousandsAs of June 3, 2005
Current Assets $ 8,079
Property, plant and equipment 2,151
Intangible assets subject to amortization
Programs (16 year weighted average useful life) 9,001
Patents (15 year weighted average useful life) 2,082
Other (3 year useful life) 5
11,088
Deferred income tax benefits 1,526
Goodwill 17,166
Total assets acquired 40,010
Current liabilities assumed 6,571
Deferred tax liabilities 4,317
Net assets acquired $ 29,122

77 | ESTERLINE 0 5 | Notes
On August 27, 2004, the Company acquired all of the outstanding capital stock of Leach Holding Corporation
(Leach), a $119 million (sales) manufacturer of electrical power switching, control and data communication de-
vices for the aerospace industry for approximately $145.0 million (approximately $147.0 million including acquisition
costs) before an adjustment for the change in working capital from December 31, 2003 to closing, pursuant to an
Agreement and Plan of Merger dated as of July 8, 2004 (Agreement). Leach also manufactures medical diagnostic,
therapeutic and patient monitoring devices, and analytical, optical and biosensor instruments for medical, labora-
tory and industrial applications. The acquisition was funded with available cash and a draw on the Company’s
credit facility.
An escrow account for $12.5 million was established under the Agreement, which is payable to the shareholders
of Leach, subject to certain Leach shareholder indemnifications. As of October 28, 2005 the escrow balance was
$7.5 million. The acquisition expands the Company’s capabilities in providing solutions to its customers’ power
distribution and diagnostic monitoring requirements.
The aerospace business is included in the Sensors & Systems segment and the medical business is included in
the Avionics & Controls segment.
The following summarizes the estimated fair market value of the assets acquired and liabilities assumed at the
date of acquisition. The amount allocated to goodwill is not expected to be deductible for income tax purposes.
In ThousandsAs of August 27, 2004
Current Assets $ 50,977
Property, plant and equipment 24,380
Intangible assets subject to amortization
Programs (20 year weighted average useful life) 30,117
Patents (15 year weighted average useful life) 2,235
Leasehold interest (64 year remaining term of lease) 4,300
Other (10 year useful life) 4,721
41,373
Trade names (not subject to amortization) 13,720
Deferred income tax benefits 14,123
Goodwill 56,441
Other assets 4,259
Total assets acquired 205,273
Current liabilities assumed 20,631
Long-term debt 2,192
Pension and other liabilities 20,144
Deferred tax liabilities 12,511
Minority interest 2,356
Net assets acquired $ 147,439
On December 1, 2003, the Company acquired all of the outstanding capital stock of AVISTA, Incorporated
(AVISTA), a $10 million (sales) Wisconsin-based developer of embedded avionics software, for approximately $6.5
million in cash. A purchase price adjustment is payable to the seller in December 2004 and 2005 contingent upon the
achievement of financial results as defined in the Stock Purchase Agreement. The December 2004 purchase price
adjustment was approximately $3.3 million and the December 2005 purchase price adjustment was approximately
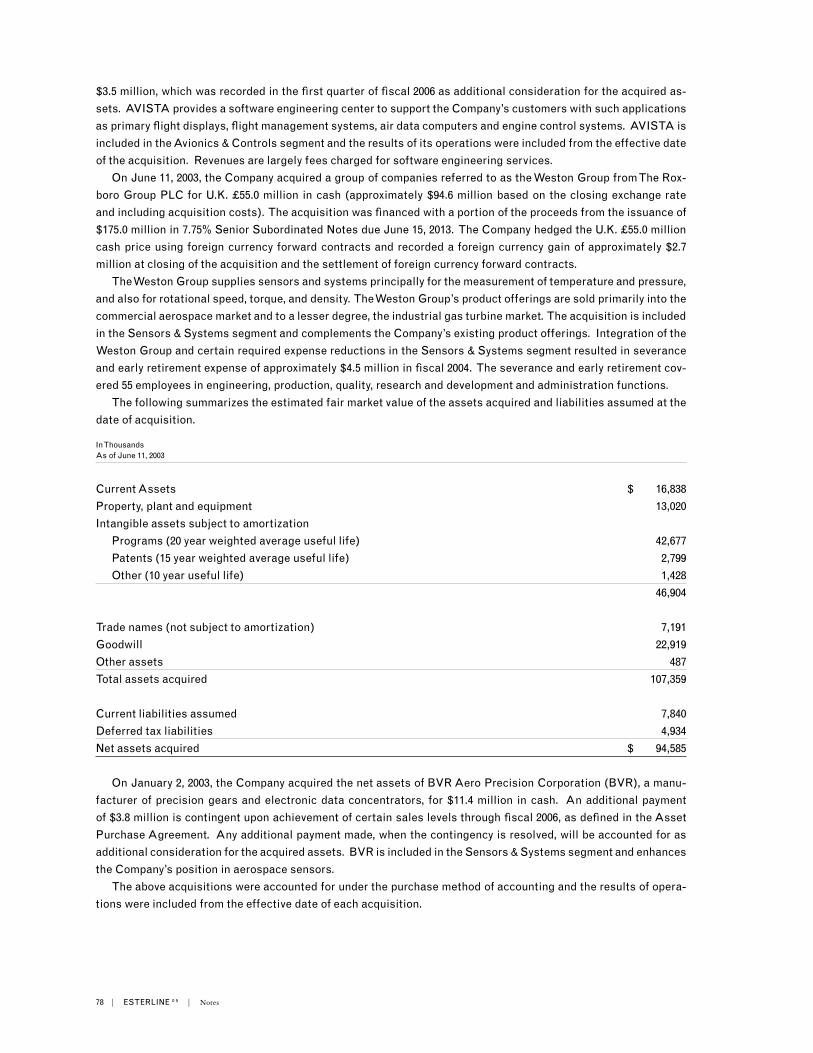
78 | ESTERLINE 0 5 | Notes
$3.5 million, which was recorded in the first quarter of fiscal 2006 as additional consideration for the acquired as-
sets. AVISTA provides a software engineering center to support the Company’s customers with such applications
as primary flight displays, flight management systems, air data computers and engine control systems. AVISTA is
included in the Avionics & Controls segment and the results of its operations were included from the effective date
of the acquisition. Revenues are largely fees charged for software engineering services.
On June 11, 2003, the Company acquired a group of companies referred to as the Weston Group from The Rox-
boro Group PLC for U.K. £55.0 million in cash (approximately $94.6 million based on the closing exchange rate
and including acquisition costs). The acquisition was financed with a portion of the proceeds from the issuance of
$175.0 million in 7.75% Senior Subordinated Notes due June 15, 2013. The Company hedged the U.K. £55.0 million
cash price using foreign currency forward contracts and recorded a foreign currency gain of approximately $2.7
million at closing of the acquisition and the settlement of foreign currency forward contracts.
The Weston Group supplies sensors and systems principally for the measurement of temperature and pressure,
and also for rotational speed, torque, and density. The Weston Group’s product offerings are sold primarily into the
commercial aerospace market and to a lesser degree, the industrial gas turbine market. The acquisition is included
in the Sensors & Systems segment and complements the Company’s existing product offerings. Integration of the
Weston Group and certain required expense reductions in the Sensors & Systems segment resulted in severance
and early retirement expense of approximately $4.5 million in fiscal 2004. The severance and early retirement cov-
ered 55 employees in engineering, production, quality, research and development and administration functions.
The following summarizes the estimated fair market value of the assets acquired and liabilities assumed at the
date of acquisition.
In ThousandsAs of June 11, 2003
Current Assets $ 16,838
Property, plant and equipment 13,020
Intangible assets subject to amortization
Programs (20 year weighted average useful life) 42,677
Patents (15 year weighted average useful life) 2,799
Other (10 year useful life) 1,428
46,904
Trade names (not subject to amortization) 7,191
Goodwill 22,919
Other assets 487
Total assets acquired 107,359
Current liabilities assumed 7,840
Deferred tax liabilities 4,934
Net assets acquired $ 94,585
On January 2, 2003, the Company acquired the net assets of BVR Aero Precision Corporation (BVR), a manu-
facturer of precision gears and electronic data concentrators, for $11.4 million in cash. An additional payment
of $3.8 million is contingent upon achievement of certain sales levels through fiscal 2006, as defined in the Asset
Purchase Agreement. Any additional payment made, when the contingency is resolved, will be accounted for as
additional consideration for the acquired assets. BVR is included in the Sensors & Systems segment and enhances
the Company’s position in aerospace sensors.
The above acquisitions were accounted for under the purchase method of accounting and the results of opera-
tions were included from the effective date of each acquisition.

79 | ESTERLINE 0 5 | Notes
On December 16, 2005, the Company acquired all of the outstanding capital stock of Darchem Holdings Limited
(Darchem), a $70 million (estimated annual sales) manufacturer of thermally engineered components for critical
aerospace applications for U.K. £67.5 million in cash (approximately $120.0 million), subject to adjustment based
on the amount of cash and net working capital of Darchem as of closing, pursuant to the Stock Purchase Agree-
ment. Darchem holds a leading position in its niche market and fits the Company’s engineered-to-order model.
Darchem will be included in the Advanced Materials segment.
The Company financed the Darchem acquisition using cash on hand and approximately $80.0 million provided
through a December 15, 2005 draw on the Company’s $100.0 million credit facility made available through a group
of banks, with Wachovia Bank acting as administrative and collateral agent. The amount drawn is due on February
15, 2006, which date may be extended by the Company, and accrues interest at the rate of 5.19% per annum. If so
extended, the interest rate will be equal to LIBOR plus the margin as set forth under the terms of the credit agree-
ment. The credit facility is secured by substantially all of the Company’s assets. The credit agreement contains
covenants, including but not limited to, restrictions on liens, making certain investments in third parties, capital
expenditures, incurrence of additional indebtedness, repurchase of the Company’s common stock, declaration of
dividends, and certain asset dispositions. In addition, the credit agreement requires that the Company comply with
certain financial covenants, including maximum leverage ratio and a fixed charge coverage ratio.
Divestitures
During the fourth quarter of fiscal 2004, the Company sold a product line in its Sensors & Systems segment and
recorded a gain of $3.4 million. In the second quarter of fiscal 2003, the Company sold a product line in its Sensors &
Systems segment and reported a net loss on sale of $66,000.
Note Fifteen. Business Segment Information
The Company’s businesses are organized and managed in three operating segments: Avionics & Controls, Sen-
sors & Systems and Advanced Materials. Operations within the Avionics & Controls segment focus on technology
interface systems for commercial and military aircraft, and similar devices for land- and sea-based military vehicles,
secure communications systems, specialized medical equipment and other industrial applications. Sensors & Sys-
tems includes operations that produce high-precision temperature and pressure sensors, electrical power switch-
ing, control and data communication devices, motion control components and other related systems principally
for aerospace and defense customers. The Advanced Materials segment focuses on high-performance elastomer
products used in a wide range of commercial aerospace and military applications, and combustible ordnance and
electronic warfare countermeasure devices. Sales in all segments include domestic, international, defense and
commercial customers.
Geographic sales information is based on product origin. The Company evaluates these segments based on
segment profits prior to net interest, other income/expense, corporate expenses and federal/foreign income taxes.

80 | ESTERLINE 0 5 | Notes
Details of the Company’s operations by business segment for the last three fiscal years were as follows:
In Thousands 2005 2004 2003
Sales
Avionics & Controls $ 261,550 $ 209,498 $ 198,249
Sensors & Systems 319,539 180,768 134,228
Advanced Materials 254,314 223,344 216,655
$ 835,403 $ 613,610 $ 549,132
Income From Continuing Operations
Avionics & Controls $ 37,325 $ 32,077 $ 29,507
Sensors & Systems 34,482 7,809 8,293
Advanced Materials 33,992 28,004 28,671
Segment Earnings 105,799 67,890 66,471
Corporate expense (23,513) (17,472) (17,353)
Other income (expense) (514) 509 —
Gain (loss) on sale of product line — 3,434 (66)
Loss on derivative financial instruments — — 2,676
Interest income 4,057 1,964 868
Interest expense (18,159) (17,336) (11,991)
$ 67,670 $ 38,989 $ 40,605
Identifiable Assets
Avionics & Controls $ 245,016 $ 198,142 $ 144,492
Sensors & Systems 398,801 374,123 219,247
Advanced Materials 266,327 267,811 262,001
Other — 2 2
Discontinued operations — — —
Corporate(1) 205,104 95,270 177,085
$ 1,115,248 $ 935,348 $ 802,827
Capital Expenditures
Avionics & Controls $ 3,538 $ 6,483 $ 2,744
Sensors & Systems 11,155 3,335 2,927
Advanced Materials 8,283 11,492 8,857
Other — — —
Discontinued operations 46 326 366
Corporate 754 490 2,236
$ 23,776 $ 22,126 $ 17,130
Depreciation and Amortization
Avionics & Controls $ 6,972 $ 5,525 $ 4,964
Sensors & Systems 14,311 10,337 5,794
Advanced Materials 12,469 12,394 11,982
Other — — —
Discontinued Operations 141 1,452 2,444
Corporate 1,415 1,437 1,031
$ 35,308 $ 31,145 $ 26,215
(1) Primarily cash, prepaid pension expense (see Note 8) and deferred tax assets (see Note 9).
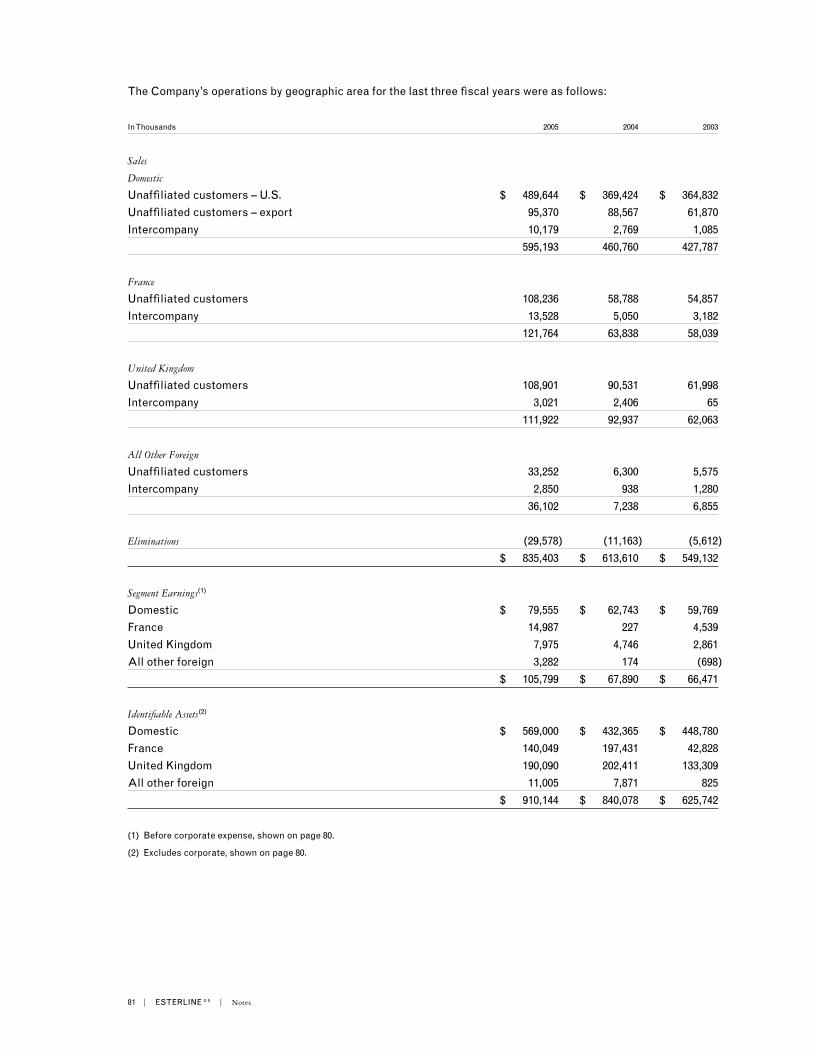
81 | ESTERLINE 0 5 | Notes
The Company’s operations by geographic area for the last three fiscal years were as follows:
In Thousands 2005 2004 2003
Sales
Domestic
Unaffiliated customers – U.S. $ 489,644 $ 369,424 $ 364,832
Unaffiliated customers – export 95,370 88,567 61,870
Intercompany 10,179 2,769 1,085
595,193 460,760 427,787
France
Unaffiliated customers 108,236 58,788 54,857
Intercompany 13,528 5,050 3,182
121,764 63,838 58,039
United Kingdom
Unaffiliated customers 108,901 90,531 61,998
Intercompany 3,021 2,406 65
111,922 92,937 62,063
All Other Foreign
Unaffiliated customers 33,252 6,300 5,575
Intercompany 2,850 938 1,280
36,102 7,238 6,855
Eliminations (29,578) (11,163) (5,612)
$ 835,403 $ 613,610 $ 549,132
Segment Earnings(1)
Domestic $ 79,555 $ 62,743 $ 59,769
France 14,987 227 4,539
United Kingdom 7,975 4,746 2,861
All other foreign 3,282 174 (698)
$ 105,799 $ 67,890 $ 66,471
Identifiable Assets(2)
Domestic $ 569,000 $ 432,365 $ 448,780
France 140,049 197,431 42,828
United Kingdom 190,090 202,411 133,309
All other foreign 11,005 7,871 825
$ 910,144 $ 840,078 $ 625,742
(1) Before corporate expense, shown on page 80.
(2) Excludes corporate, shown on page 80.

82 | ESTERLINE 0 5 | Notes
The Company’s principal foreign operations consist of manufacturing facilities located in France, Germany and
the United Kingdom, and include sales and service operations located in Singapore and China. Sensors & Systems
segment operations are dependent upon foreign sales, which represented $214.4 million, $144.3 million and $117.0
million of Sensors & Systems sales in fiscal 2005, 2004 and 2003, respectively. Intercompany sales are at prices
comparable with sales to unaffiliated customers. U.S. Government sales as a percent of Advanced Materials and
Avionics & Controls sales were 35.4% and 4.0%, respectively, in fiscal 2005 and 12.7% of consolidated sales. In fis-
cal 2004, U.S. Government sales as a percent of Advanced Materials and Avionics & Controls sales were 35.9% and
9.4%, respectively, and 16.6% of consolidated sales.
Product lines contributing sales of 10% or more of total sales in any of the last three fiscal years were as fol-
lows:
2005 2004 2003
Elastomeric products 14% 16% 18%
Sensors 16% 19% 17%
Aerospace switches and indicators 12% 13% 16%
Combustible ordnance components 6% 8% 10%

83 | ESTERLINE 0 5 | Notes
Note Sixteen. Quarterly Financial Data (Unaudited)
The following is a summary of unaudited quarterly financial information:
In Thousands, Except Per Share AmountsFiscal Year 2005 Fourth Third Second First
Net sales $ 224,146 $ 209,873 $ 211,592 $ 189,792Gross margin 69,619 65,693 68,538 58,100
Income from continuing operations (1) 15,366 11,859(2) 13,726 10,083Income from discontinued operations, net of tax 24 3 (562) 7,527Net earnings $ 15,390 $ 11,862(2) $ 13,164 $ 17,610
Earnings per share – basic Continuing operations $ .61 $ .47 $ .55 $ .42 Discontinued operations — — (.03) .31Earnings per share – basic $ .61 $ .47 $ .52 $ .73
Earnings per share – diluted Continuing operations(3) $ .60 $ .46 $ .54 $ .41 Discontinued operations(3) — — (.02) .31Earnings per share – diluted $ .60 $ .46 $ .52 $ .72
Fiscal Year 2004
Net sales $ 190,346 $ 147,424 $ 146,474 $ 129,366Gross margin 61,982 45,862 48,584 38,592
Income from continuing operations(1) 14,381(5) 5,336 9,426 232(4)
Income from discontinued operations, net of tax 8,498 576 960 174Net earnings $ 22,879(5) $ 5,912 $ 10,386 $ 406(4)
Earnings per share – basic Continuing operations $ .67 $ .25 $ .45 $ .01 Discontinued operations(3) .40 .03 .04 .01Earnings per share – basic(3) $ 1.07 $ .28 $ .49 $ .02
Earnings per share – diluted Continuing operations(3) $ .66 $ .25 $ .44 $ .01 Discontinued operations(3) .39 .02 .04 .01Earnings per share – diluted(3) $ 1.05 $ .27 $ .48 $ .02
(1) The effects of stock options expense, net of tax, are included in income from continuing operations and presented below:
Fourth Third Second First
Fiscal Year 2005 $ 881 $ (2,308) $ (941) $ 442 Fiscal Year 2004 $ (237) $ (1,737) $ 474 $ (1,472)
(2) Included a $2.0 million reduction of previously estimated tax liabilities due to the expiration of the statute of limitations and adjustments resulting from a reconciliation of U.S. and non-U.S. tax returns to the provision for income taxes.(3) The sum of the quarterly per share amounts may not equal per share amounts reported for year-to-date periods. This is due to changes in the number of weighted average shares outstanding and the effects of rounding for each period.(4) Included $4.5 million in legal, severance and early retirement expense in the Sensors & Systems segment. Included a $1.9 million reduction of previously estimated tax liabilities associated with the receipt of a NOPA from the Internal Revenue Service.(5) Included a $3.4 million gain on the sale of a product line in the Sensors & Systems segment.
84 | ESTERLINE 0 5 | Notes
Note Seventeen. Guarantors
The following schedules set forth condensed consolidating financial information as required by Rule 3-10 of Secu-
rities and Exchange Commission Regulation S-X for fiscal 2005, 2004 and 2003 for (a) Esterline Technologies Cor-
poration (the Parent); (b) on a combined basis, the subsidiary guarantors (Guarantor Subsidiaries) of the Senior
Subordinated Notes which include Advanced Input Devices, Inc., Amtech Automated Manufacturing Technology,
Inc., Angus Electronics Co., Armtec Countermeasures Co., Armtec Defense Products Co., Auxitrol Co., AVISTA,
Incorporated, BVR Technologies Co., EA Technologies Corporation, Equipment Sales Co., Esterline Technologies
Holdings Limited, H.A. Sales Co., Hauser Inc., Hytek Finishes Co., Janco Corporation, Kirkhill-TA Co., Korry Elec-
tronics Co., Leach Holding Corporation, Leach International Corporation, Leach Technology Group, Inc., Mason
Electric Co., MC Tech Co., Memtron Technologies Co., Norwich Aero Products, Inc., Palomar Products, Inc., Pres-
sure Systems, Inc., Pressure Systems International, Inc., Surftech Finishes Co., UMM Electronics Inc., and (c) on
a combined basis, the subsidiary non-guarantors (Non-Guarantor Subsidiaries), which include Auxitrol S.A., Auxi-
trol Technologies S.A., Esterline Sensors Services Asia PTE Ltd., Esterline Technologies Denmark Aps (Denmark),
Esterline Technologies Ltd. (England), Esterline Technologies Ltd. (Hong Kong), Excellon Europa GmbH, Guizhou
Leach-Tianyi Aviation Electrical Company Ltd. (China), Leach International Asia-Pacific Ltd. (Hong Kong), Leach
International Europe S.A. (France), Leach International Germany GmbH (Germany), Leach International Mexico S.
de R.L. de C.V. (Mexico), Leach International U.K. (England), LRE Medical GmbH (Germany), Muirhead Aerospace
Ltd., Norcroft Dynamics Ltd., Pressure Systems International Ltd., Weston Aero Ltd. (England), and Weston Aero-
space, Ltd. (England). The guarantor subsidiaries are direct and indirect wholly-owned subsidiaries of Esterline
Technologies and have fully and unconditionally, jointly and severally, guaranteed the Senior Subordinated Notes.

85 | ESTERLINE 0 5 | Notes
Condensed Consolidating Balance Sheet as of October 28, 2005
Guarantor Non-Guarantor
In Thousands Parent Subsidiaries Subsidiaries Eliminations Total
Assets
Current AssetsCash and cash equivalents $ 75,364 $ 2,154 $ 40,786 $ — $ 118,304 Cash in escrow 11,918 — — — 11,918Short-term investments 62,656 — — — 62,656Accounts receivable, net 671 96,931 52,149 — 149,751Inventories — 84,351 46,118 — 130,469 Deferred income tax benefits 25,115 102 1,651 — 26,868Prepaid expenses 179 4,481 2,873 — 7,533Other current assets — — — — — Total Current Assets 175,903 188,019 143,577 — 507,499
Property, Plant & Equipment, Net 2,687 95,001 40,526 — 138,214Goodwill — 191,919 69,248 — 261,167Intangibles, Net 107 82,196 83,815 — 166,118Debt Issuance Costs, Net 5,144 — — — 5,144Deferred Income Tax Benefits 11,257 — 2,063 — 13,320Other Assets 2,638 16,266 4,882 — 23,786Amounts Due To (From) Subsidiaries 134,964 64,835 — (199,799) —Investment in Subsidiaries 615,599 129 (128) (615,600) — Total Assets $ 948,299 $ 638,365 $ 343,983 $ (815,399) $ 1,115,248
Liabilities and Shareholders’ Equity
Current LiabilitiesAccounts payable $ 990 $ 19,877 $ 20,586 $ — $ 41,453Accrued liabilities 38,620 53,246 27,249 — 119,115Credit facilities — — 2,031 — 2,031Current maturities of long-term debt 70,000 — 934 — 70,934Federal and foreign income taxes 3,634 76 5,088 — 8,798 Total Current Liabilities 113,244 73,199 55,888 — 242,331
Long-Term Debt, Net 173,988 — 1,694 — 175,682Deferred Income Taxes 30,880 (10) 15,551 — 46,421Other Liabilities 9,323 11,209 6,705 — 27,237Amounts Due To (From) Subsidiaries — — 195,829 (195,829) —Minority Interest — — 2,713 — 2,713Shareholders’ Equity 620,864 553,967 65,603 (619,570) 620,864 Total Liabilities and Shareholders’ Equity $ 948,299 $ 638,365 $ 343,983 $ (815,399) $ 1,115,248

86 | ESTERLINE 0 5 | Notes
Condensed Consolidating Statement of Operations for the fiscal year ended October 28, 2005
Guarantor Non-Guarantor
In Thousands Parent Subsidiaries Subsidiaries Eliminations Total
Net Sales $ — $ 574,864 $ 278,767 $ (18,228) $ 835,403Cost of Sales — 403,823 187,858 (18,228) 573,453 — 171,041 90,909 — 261,950Expenses Selling, general and administrative — 90,892 46,534 — 137,426 Research, development and engineering — 17,399 24,839 — 42,238 Total Expenses — 108,291 71,373 — 179,664Operating Earnings from Continuing Operations — 62,750 19,536 — 82,286
Interest income (15,940) (3,015) (2,679) 17,577 (4,057) Interest expense 18,261 4,642 12,833 (17,577) 18,159 Other expense (income) 50 86 378 — 514Other Expense, Net 2,371 1,713 10,532 — 14,616
Income (Loss) from Continuing Operations Before Taxes (2,371) 61,037 9,004 — 67,670Income Tax Expense (Benefit) (728) 14,409 2,620 — 16,301Income (Loss) From Continuing Operations Before Minority Interest (1,643) 46,628 6,384 — 51,369Minority Interest — — (335) — (335)Income (Loss) From Continuing Operations (1,643) 46,628 6,049 — 51,034
Income From Discontinued Operations, Net of Tax — 6,992 — — 6,992Equity in Net Income of Consolidated Subsidiaries 59,669 — — (59,669) —Net Income (Loss) $ 58,026 $ 53,620 $ 6,049 $ (59,669) $ 58,026
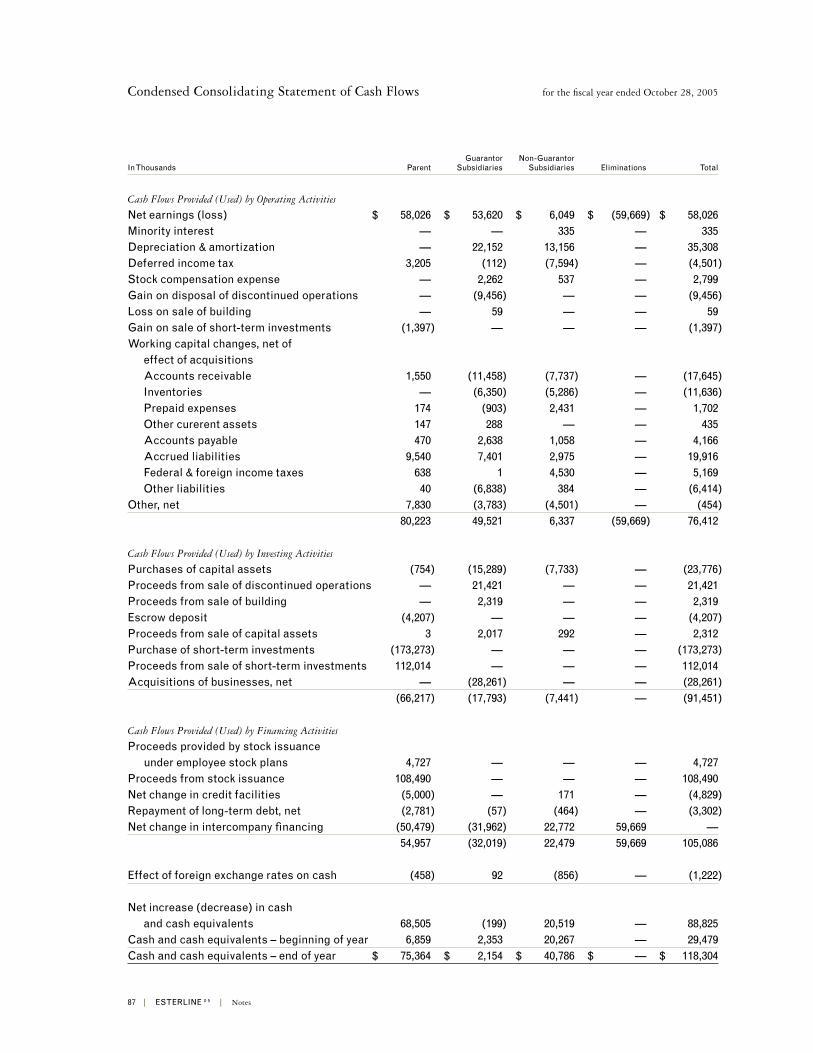
87 | ESTERLINE 0 5 | Notes
Condensed Consolidating Statement of Cash Flows for the fiscal year ended October 28, 2005
Guarantor Non-Guarantor
In Thousands Parent Subsidiaries Subsidiaries Eliminations Total
Cash Flows Provided (Used) by Operating Activities
Net earnings (loss) $ 58,026 $ 53,620 $ 6,049 $ (59,669) $ 58,026Minority interest — — 335 — 335Depreciation & amortization — 22,152 13,156 — 35,308Deferred income tax 3,205 (112) (7,594) — (4,501)Stock compensation expense — 2,262 537 — 2,799Gain on disposal of discontinued operations — (9,456) — — (9,456)Loss on sale of building — 59 — — 59Gain on sale of short-term investments (1,397) — — — (1,397)Working capital changes, net of effect of acquisitions Accounts receivable 1,550 (11,458) (7,737) — (17,645) Inventories — (6,350) (5,286) — (11,636) Prepaid expenses 174 (903) 2,431 — 1,702 Other curerent assets 147 288) — — 435 Accounts payable 470 2,638 1,058 — 4,166 Accrued liabilities 9,540 7,401 2,975 — 19,916 Federal & foreign income taxes 638 1 4,530 — 5,169 Other liabilities 40 (6,838) 384) — (6,414)Other, net 7,830 (3,783) (4,501) — (454) 80,223 49,521 6,337 (59,669) 76,412
Cash Flows Provided (Used) by Investing Activities
Purchases of capital assets (754) (15,289) (7,733) — (23,776)Proceeds from sale of discontinued operations — 21,421 — — 21,421Proceeds from sale of building — 2,319 — — 2,319Escrow deposit (4,207) — — — (4,207)Proceeds from sale of capital assets 3 2,017 292 — 2,312Purchase of short-term investments (173,273) — — — (173,273)Proceeds from sale of short-term investments 112,014 — — — 112,014Acquisitions of businesses, net — (28,261) — — (28,261) (66,217) (17,793) (7,441) — (91,451)
Cash Flows Provided (Used) by Financing Activities
Proceeds provided by stock issuance under employee stock plans 4,727 — — — 4,727Proceeds from stock issuance 108,490 — — — 108,490Net change in credit facilities (5,000) — 171 — (4,829)Repayment of long-term debt, net (2,781) (57) (464) — (3,302)Net change in intercompany financing (50,479) (31,962) 22,772 59,669 — 54,957 (32,019) 22,479 59,669 105,086
Effect of foreign exchange rates on cash (458) 92 (856) — (1,222)
Net increase (decrease) in cash and cash equivalents 68,505 (199) 20,519 — 88,825Cash and cash equivalents – beginning of year 6,859 2,353 20,267 — 29,479Cash and cash equivalents – end of year $ 75,364 $ 2,154 $ 40,786 $ — $ 118,304
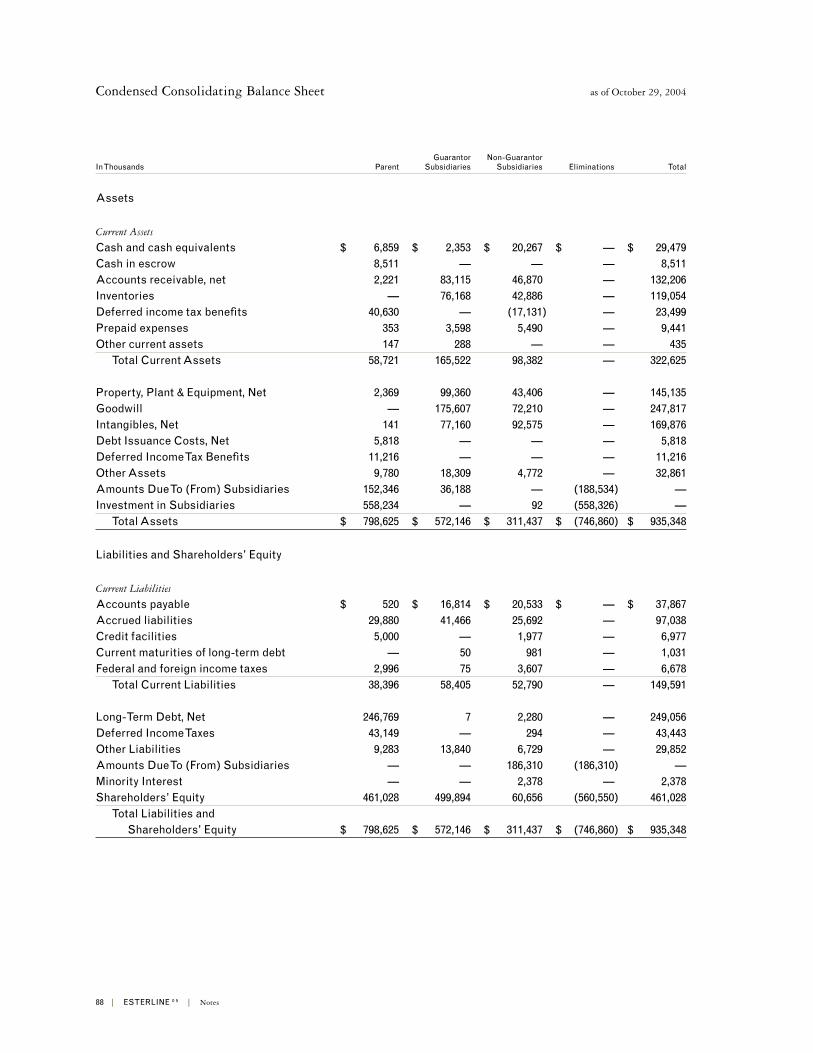
88 | ESTERLINE 0 5 | Notes
Condensed Consolidating Balance Sheet as of October 29, 2004
Guarantor Non-Guarantor
In Thousands Parent Subsidiaries Subsidiaries Eliminations Total
Assets
Current Assets
Cash and cash equivalents $ 6,859 $ 2,353 $ 20,267 $ — $ 29,479Cash in escrow 8,511 — — — 8,511Accounts receivable, net 2,221 83,115 46,870 — 132,206Inventories — 76,168 42,886 — 119,054Deferred income tax benefits 40,630 — (17,131) — 23,499Prepaid expenses 353 3,598 5,490 — 9,441Other current assets 147 288 — — 435 Total Current Assets 58,721 165,522 98,382 — 322,625
Property, Plant & Equipment, Net 2,369 99,360 43,406 — 145,135Goodwill — 175,607 72,210 — 247,817Intangibles, Net 141 77,160 92,575 — 169,876Debt Issuance Costs, Net 5,818 — — — 5,818Deferred Income Tax Benefits 11,216 — — — 11,216Other Assets 9,780 18,309 4,772 — 32,861Amounts Due To (From) Subsidiaries 152,346 36,188 — (188,534) —Investment in Subsidiaries 558,234 — 92 (558,326) — Total Assets $ 798,625 $ 572,146 $ 311,437 $ (746,860) $ 935,348
Liabilities and Shareholders’ Equity
Current Liabilities
Accounts payable $ 520 $ 16,814 $ 20,533 $ — $ 37,867Accrued liabilities 29,880 41,466 25,692 — 97,038Credit facilities 5,000 — 1,977 — 6,977Current maturities of long-term debt — 50 981 — 1,031Federal and foreign income taxes 2,996 75 3,607 — 6,678 Total Current Liabilities 38,396 58,405 52,790 — 149,591
Long-Term Debt, Net 246,769 7 2,280 — 249,056Deferred Income Taxes 43,149 — 294 — 43,443Other Liabilities 9,283 13,840 6,729 — 29,852Amounts Due To (From) Subsidiaries — — 186,310 (186,310) —Minority Interest — — 2,378 — 2,378Shareholders’ Equity 461,028 499,894 60,656 (560,550) 461,028 Total Liabilities and Shareholders’ Equity $ 798,625 $ 572,146 $ 311,437 $ (746,860) $ 935,348

89 | ESTERLINE 0 5 | Notes
Condensed Consolidating Statement of Operations for the fiscal year ended October 29, 2004
Guarantor Non-Guarantor
In Thousands Parent Subsidiaries Subsidiaries Eliminations Total
Net Sales $ — $ 461,067 $ 155,073 $ (2,530) $ 613,610Cost of Sales — 320,285 100,835 (2,530) 418,590 — 140,782 54,238 — 195,020Expenses Selling, general and administrative — 79,038 39,708 — 118,746 Research, development and engineering — 10,275 15,581 — 25,856 Total Expenses — 89,313 55,289 — 144,602Operating Earnings from Continuing Operations — 51,469 (1,051) — 50,418
Gain on sale of business (1,700) — (1,734) — (3,434) Interest income (14,316) (3,017) (828) 16,197 (1,964) Interest expense 17,010 3,272 13,251 (16,197) 17,336 Other expense (income) (520) (239) 250 — (509)Other Expense, Net 474 16 10,939 — 11,429
Income (Loss) from Continuing Operations Before Taxes (474) 51,453 (11,990) — 38,989Income Tax Expense (Benefit) (140) 12,934 (3,202) — 9,592Income (Loss) From Continuing Operations Before Minority Interest (334) 38,519 (8,788) — 29,397Minority Interest — — (22) — (22)Income (Loss) From Continuing Operations (334) 38,519 (8,810) — 29,375
Income From Discontinued Operations, Net of Tax — 10,208 — — 10,208Equity in Net Income of Consolidated Subsidiaries 39,917 — — (39,917) —Net Income (Loss) $ 39,583 $ 48,727 $ (8,810) $ (39,917) $ 39,583

90 | ESTERLINE 0 5 | Notes
Condensed Consolidating Statement of Cash Flows for the fiscal year ended October 29, 2004
Guarantor Non-Guarantor
In Thousands Parent Subsidiaries Subsidiaries Eliminations Total
Cash Flows Provided (Used) by Operating Activities
Net earnings (loss) $ 39,583 $ 48,727 $ (8,810) $ (39,917) $ 39,583Minority interest — — 22 — 22Depreciation & amortization — 22,320 8,825 — 31,145Deferred income tax 3,375 — (111) — 3,264Stock-based compensation — 3,191 1,135 — 4,326Gain on disposal of discontinued operations — (12,521) — — (12,521)Gain on sale of land — (892) — — (892)Gain on sale of product line (1,700) — (1,734) — (3,434)Working capital changes, net of effect of acquisitions Accounts receivable (2,126) (5,513) (1,393) — (9,032) Inventories — (6,897) (2,198) — (9,095) Prepaid expenses (219) 760 (1,200) — (659) Accounts payable 382 (684) 2,902 — 2,600 Accrued liabilities 11,800 (1,444) (116) — 10,240 Federal & foreign income taxes 8,935 (804) 820 — 8,951 Other liabilities 9,283 (923) (4,001) — 4,359Other, net (9,734) 5,668 (1,464) — (5,530) 59,579 50,988 (7,323) (39,917) 63,327
Cash Flows Provided (Used) by Investing Activities
Purchases of capital assets (490) (18,881) (2,755) — (22,126)Proceeds from sale of discontinued operations — 10,000 — — 10,000Proceeds from sale of product line 1,700 — 1,775 — 3,475Proceeds from sale of land — 1,654 — — 1,654Escrow deposit (12,500) — — — (12,500)Proceeds from sale of capital assets 23 1,190 (435) — 778Proceeds from sale of short-term investments 12,797 — — — 12,797Acquisitions of businesses, net — (50,855) (87,956) — (138,811) 1,530 (56,892) (89,371) — (144,733)
Cash Flows Provided (Used0 by Financing Activities
Proceeds provided by stock issuance under employee stock plans 2,807 — — — 2,807Net change in credit facilities 5,000 (180) (698) — 4,122Repayment of long-term debt, net (27,996) (77) (1,356) — (29,429)Debt and other issuance costs (268) — — — (268)Net change in intercompany financing (143,641) 5,573 98,151 39,917 — (164,098) 5,316 96,097 39,917 (22,768)
Effect of foreign exchange rates on cash 14 (89) 2,365 — 2,290
Net increase (decrease) in cash and cash equivalents (102,975) (677) 1,768 — (101,884)Cash and cash equivalents – beginning of year 109,834 3,030 18,499 — 131,363Cash and cash equivalents – end of year $ 6,859 $ 2,353 $ 20,267 $ — $ 29,479

91 | ESTERLINE 0 5 | Notes
Condensed Consolidating Statement of Operations for the fiscal year ended October 31, 2003
Guarantor Non-Guarantor
In Thousands Parent Subsidiaries Subsidiaries Eliminations Total
Net Sales $ — $ 426,051 $ 124,638 $ (1,557) $ 549,132Cost of Sales — 293,913 84,575 (1,557) 376,931 — 132,138 40,063 — 172,201Expenses Selling, general and administrative — 79,460 25,841 — 105,301 Research, development and engineering — 7,564 10,218 — 17,782 Total Expenses — 87,024 36,059 — 123,083Operating Earnings from Continuing Operations — 45,114 4,004 — 49,118
Loss on sale of business — — 66 — 66 Gain on derivative financial instruments (2,676) — — — (2,676) Interest income (5,492) (2,511) (370) 7,505 (868) Interest expense 11,624 2,526 5,346 (7,505) 11,991 Other expense (income) (116) 96 20 — —Other Expense, Net 3,340 111 5,062 — 8,513
Income (Loss) from Continuing Operations Before Taxes (3,340) 45,003 (1,058) — 40,605Income Tax Expense (Benefit) (868) 13,572 (246) — 12,458Income (Loss) From Continuing Operations (2,472) 31,431 (812) — 28,147
Loss From Discontinued Operations, Net of Tax — (5,312) — — (5,312)Equity in Net Income of Consolidated Subsidiaries 25,307 — — (25,307) —Net Income (Loss) $ 22,835 $ 26,119 $ (812) $ (25,307) $ 22,835
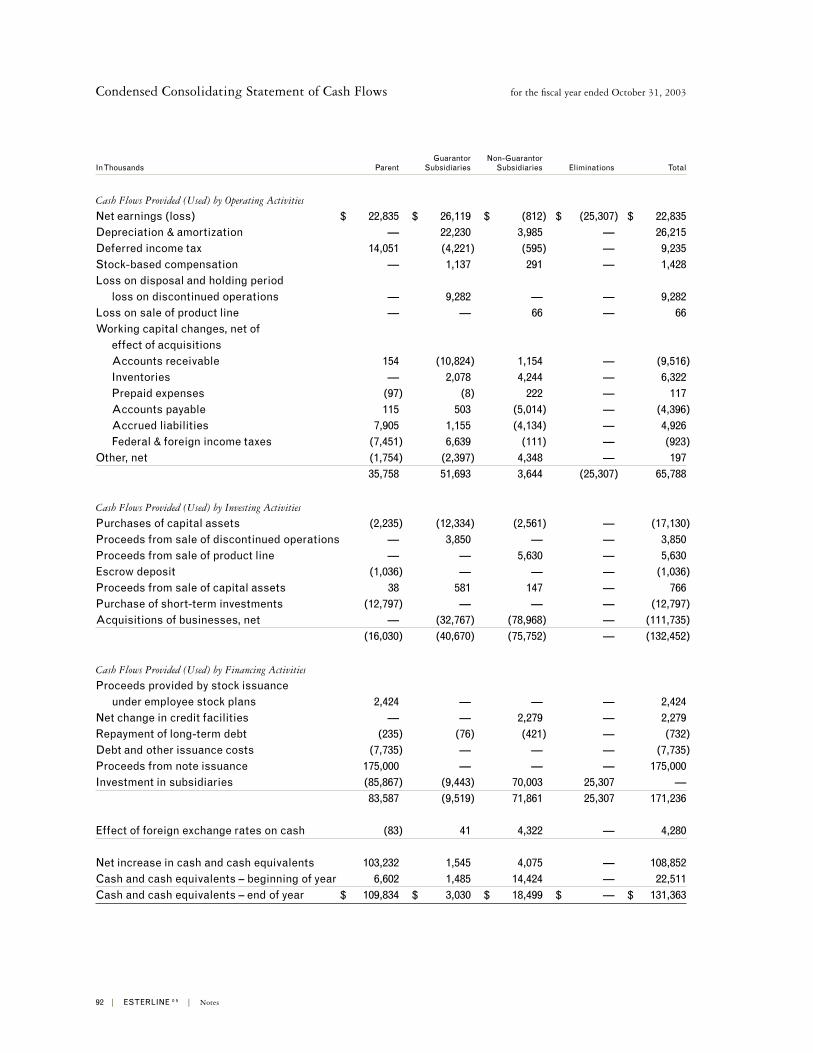
92 | ESTERLINE 0 5 | Notes
Condensed Consolidating Statement of Cash Flows for the fiscal year ended October 31, 2003
Guarantor Non-Guarantor
In Thousands Parent Subsidiaries Subsidiaries Eliminations Total
Cash Flows Provided (Used) by Operating Activities
Net earnings (loss) $ 22,835 $ 26,119 $ (812) $ (25,307) $ 22,835Depreciation & amortization — 22,230 3,985 — 26,215Deferred income tax 14,051 (4,221) (595) — 9,235Stock-based compensation — 1,137 291 — 1,428Loss on disposal and holding period loss on discontinued operations — 9,282 — — 9,282Loss on sale of product line — — 66 — 66Working capital changes, net of effect of acquisitions Accounts receivable 154 (10,824) 1,154 — (9,516) Inventories — 2,078 4,244 — 6,322 Prepaid expenses (97) (8) 222 — 117 Accounts payable 115 503 (5,014) — (4,396) Accrued liabilities 7,905 1,155 (4,134) — 4,926 Federal & foreign income taxes (7,451) 6,639 (111) — (923)Other, net (1,754) (2,397) 4,348 — 197 35,758 51,693 3,644 (25,307) 65,788
Cash Flows Provided (Used) by Investing Activities
Purchases of capital assets (2,235) (12,334) (2,561) — (17,130)Proceeds from sale of discontinued operations — 3,850 — — 3,850Proceeds from sale of product line — — 5,630 — 5,630Escrow deposit (1,036) — — — (1,036)Proceeds from sale of capital assets 38 581 147 — 766Purchase of short-term investments (12,797) — — — (12,797)Acquisitions of businesses, net — (32,767) (78,968) — (111,735) (16,030) (40,670) (75,752) — (132,452)
Cash Flows Provided (Used) by Financing Activities
Proceeds provided by stock issuance under employee stock plans 2,424 — — — 2,424Net change in credit facilities — — 2,279 — 2,279Repayment of long-term debt (235) (76) (421) — (732)Debt and other issuance costs (7,735) — — — (7,735)Proceeds from note issuance 175,000 — — — 175,000Investment in subsidiaries (85,867) (9,443) 70,003 25,307 — 83,587 (9,519) 71,861 25,307 171,236
Effect of foreign exchange rates on cash (83) 41 4,322 — 4,280
Net increase in cash and cash equivalents 103,232 1,545 4,075 — 108,852Cash and cash equivalents – beginning of year 6,602 1,485 14,424 — 22,511Cash and cash equivalents – end of year $ 109,834 $ 3,030 $ 18,499 $ — $ 131,363

93 | ESTERLINE 0 5 |
Our management is responsible for establishing and maintaining adequate internal control over financial reporting
as defined in Rules 13a-15(f) and 15d-15(f) under the Securities Exchange Act of 1934. Our internal control system
over financial reporting is designed by, or under the supervision of, our chief executive officer and chief financial
officer, and is effected by our board of directors, management and other personnel to provide reasonable assurance
regarding the reliability of financial reporting and the preparation of financial statements for external purposes in
accordance with generally accepted accounting principles. Our internal control over financial reporting includes
those policies and procedures that:
(i) pertain to the maintenance of records that, in reasonable detail, accurately and fairly reflect the assets of
the company;
(ii) provide reasonable assurance that transactions are recorded as necessary to permit preparation of finan-
cial statements in accordance with U.S. generally accepted accounting principles and that transactions are
made only in accordance with the authorization of our management and directors; and
(iii) provide reasonable assurance regarding prevention or timely detection of unauthorized transactions that
could have a material effect on the financial statements.
Because of inherent limitations, internal control over financial reporting may not prevent or detect misstate-
ments. Therefore, even those systems determined to be effective can provide only reasonable assurance with re-
spect to financial statement preparation and presentation. Also, projections of any evaluation of effectiveness to
future periods are subject to risk that controls may become inadequate because of changes in condition, or that the
degree of compliance with the policies or procedures may deteriorate.
Our management assessed the effectiveness of Esterline’s internal control over financial reporting as of Oc-
tober 28, 2005. In making this assessment, our management used the criteria set forth by the Committee of Spon-
soring Organizations of the Treadway Commission (COSO) in Internal Control-Integrated Framework. Based on
management’s assessment and those criteria, our management concluded that our internal control over financial
reporting was effective as of October 28, 2005.
Our independent registered public accounting firm, Ernst & Young LLP, has issued an audit report on our assess-
ment and the effectiveness of our internal control over financial reporting. This report appears on page 94.
Robert W. Cremin Robert D. George Gary J. PosnerChairman, President and Chief Executive Officer Vice President, Chief Financial Officer, Corporate Controller
(Principal Executive Officer) Secretary and Treasurer (Principal Accounting Officer)
(Principal Financial Officer)
Management’s Report on Internal Control Over Financial Reporting

The Board of Directors and ShareholdersEsterline Technologies CorporationBellevue, Washington
We have audited management’s assessment, included in the accompanying Management’s Report on Internal Con-
trol over Financial Reporting, that Esterline Technologies Corporation maintained effective internal control over
financial reporting as of October 28, 2005, based on criteria established in Internal Control—Integrated Framework
issued by the Committee of Sponsoring Organizations of the Treadway Commission (the COSO criteria). Esterline
Technologies Corporation’s management is responsible for maintaining effective internal control over financial re-
porting and for its assessment of the effectiveness of internal control over financial reporting. Our responsibility is
to express an opinion on management’s assessment and an opinion on the effectiveness of the company’s internal
control over financial reporting based on our audit.
We conducted our audit in accordance with the standards of the Public Company Accounting Oversight Board
(United States). Those standards require that we plan and perform the audit to obtain reasonable assurance about
whether effective internal control over financial reporting was maintained in all material respects. Our audit includ-
ed obtaining an understanding of internal control over financial reporting, evaluating management’s assessment,
testing and evaluating the design and operating effectiveness of internal control, and performing such other proce-
dures as we considered necessary in the circumstances. We believe that our audit provides a reasonable basis for
our opinion.
A company’s internal control over financial reporting is a process designed to provide reasonable assurance
regarding the reliability of financial reporting and the preparation of financial statements for external purposes in
accordance with generally accepted accounting principles. A company’s internal control over financial reporting
includes those policies and procedures that (1) pertain to the maintenance of records that, in reasonable detail,
accurately and fairly reflect the transactions and dispositions of the assets of the company; (2) provide reasonable
assurance that transactions are recorded as necessary to permit preparation of financial statements in accordance
with generally accepted accounting principles, and that receipts and expenditures of the company are being made
only in accordance with authorizations of management and directors of the company; and (3) provide reasonable
assurance regarding prevention or timely detection of unauthorized acquisition, use, or disposition of the compa-
ny’s assets that could have a material effect on the financial statements.
Because of its inherent limitations, internal control over financial reporting may not prevent or detect misstate-
ments. Also, projections of any evaluation of effectiveness to future periods are subject to the risk that controls
may become inadequate because of changes in conditions, or that the degree of compliance with the policies or
procedures may deteriorate.
In our opinion, management’s assessment that Esterline Technologies Corporation maintained effective inter-
nal control over financial reporting as of October 28, 2005, is fairly stated, in all material respects, based on the
COSO criteria. Also, in our opinion, Esterline Technologies Corporation maintained, in all material respects, ef-
fective internal control over financial reporting as of October 28, 2005, based on the COSO criteria.
We also have audited, in accordance with the standards of the Public Company Accounting Oversight Board
(United States), the consolidated balance sheets of Esterline Technologies Corporation as of October 28, 2005 and
October 29, 2004, and the related consolidated statements of operations, shareholders’ equity and comprehensive
income, and cash flows for each of the three years in the period ended October 28, 2005 of Esterline Technologies
Corporation and our report dated December 30, 2005 expressed an unqualified opinion thereon.
Seattle, Washington
December 30, 2005
94 | ESTERLINE 0 5 |
Report of Independent Registered Public Accounting Firm

The Board of Directors and ShareholdersEsterline Technologies CorporationBellevue, Washington
We have audited the accompanying consolidated balance sheets of Esterline Technologies Corporation as of Oc-
tober 28, 2005 and October 29, 2004, and the related consolidated statements of operations, shareholders’ equity
and comprehensive income, and cash flows for each of the three years in the period ended October 28, 2005. These
financial statements are the responsibility of the Company’s management. Our responsibility is to express an opin-
ion on these financial statements based on our audits.
We conducted our audits in accordance with the standards of the Public Company Accounting Oversight Board
(United States). Those standards require that we plan and perform the audit to obtain reasonable assurance about
whether the financial statements are free of material misstatement. An audit includes examining, on a test basis,
evidence supporting the amounts and disclosures in the financial statements. An audit also includes assessing
the accounting principles used and significant estimates made by management, as well as evaluating the overall
financial statement presentation. We believe that our audits provide a reasonable basis for our opinion.
In our opinion, the financial statements referred to above present fairly, in all material respects, the consoli-
dated financial position of Esterline Technologies Corporation at October 28, 2005 and October 29, 2004, and the
consolidated results of its operations and its cash flows for each of the three years in the period ended October 28,
2005, in conformity with U.S. generally accepted accounting principles.
We also have audited, in accordance with the standards of the Public Company Accounting Oversight Board
(United States), the effectiveness of Esterline Technologies Corporation’s internal control over financial report-
ing as of October 28, 2005, based on criteria established in Internal Control-Integrated Framework issued by the
Committee of Sponsoring Organizations of the Treadway Commission, and our report dated December 30, 2005,
expressed an unqualified opinion thereon.
Seattle, Washington
December 30, 2005
95 | ESTERLINE 0 5 |
Report of Independent Registered Public Accounting Firm

96 | ESTERLINE 0 5 | Directors and Officers
Directors
Robert W. CreminChairman, President
and Chief Executive Officer
Esterline Technologies
Lewis E. BurnsPresident and
Chief Executive Officer (Retired)
Dover Industries, Inc.
Ross J. CentanniChairman, President
and Chief Executive Officer
Gardner Denver, Inc.
John F. ClearmanSpecial Advisor to the Board
(Retired)
Milliman USA
Robert S. ClineChairman and
Chief Executive Officer (Retired)
Airborne Freight Corporation
Anthony P. FranceschiniDirector, President
and Chief Executive Officer
Stantec Inc.
Charles R. LarsonAdmiral
United States Navy (Retired)
Jerry D. LeitmanChairman and
Chief Executive Officer
FuelCell Energy, Inc.
James L. PierceChairman (Retired)
ARINC Incorporated
Officers
Robert W. CreminChairman, President
and Chief Executive Officer
Robert D. GeorgeVice President,
Chief Financial Officer,
Secretary and Treasurer
Marcia J. M. GreenbergVice President
Human Resources
Frank E. HoustonGroup Vice President
Larry A. KringSr. Group Vice President
Stephen R. LarsonVice President
Strategy and Technology
Gary J. PosnerCorporate Controller and
Chief Accounting Officer
Richard J. WoodGroup Vice President

97 | ESTERLINE 0 5 Investor Information
Annual Meeting of ShareholdersThe 2006 annual meeting of shareholders
will be held at the Harbor Club – Bellevue
777 108th Avenue N.E.
Bellevue, WA
on Wednesday, March 1, 2006. The meeting
will start at 10:00 a.m.
10-K reportA copy of Esterline’s annual report on Form
10-K filed with the Securities and Exchange
Commission will be provided without charge
upon written request to the corporate head-
quarters, attention: Director, Corporate Com-
munications or through our website.
Stock Held in Street NameEsterline maintains a direct mailing list to
help ensure that shareholders whose stock
is held in street name (broker or similar ac-
counts) receive information on a timely basis.
If you would like your name added to this list,
please send your request to the corporate
headquarters, attention: Director, Corporate
Communications.
Stock Exchange CertificationsEsterline has filed the CEO and CFO
certifications required by Section 302 of the
Sarbanes-Oxley Act of 2002 as exhibits to its
Annual Report on Form 10-K for the fiscal
year ended October 28, 2005 and has submit-
ted to the NYSE the annual CEO certification
required by Section 303A.12 (a) of the NYSE
listing standards.
Investor Information
Corporate Headquarters500 108th Avenue N.E.
Bellevue, WA 98004
(425) 453-9400
Stock Exchange ListingNew York Stock Exchange
Symbol – ESL
www.esterline.com
Transfer Agent and RegistrarMellon Investor Services
Shareholder Services L.L.C.
www.mellon-investor.com
Shareholder Relations
(800) 522-6645
Outside of the U.S.
(201) 329-8660
TDD Hearing Impaired
(800) 231-5469
TDD Hearing Impaired
Outside of the U.S.
(201) 329-8534
Shareholder Correspondence
P.O. Box 3315
South Hackensack, NJ 07606
Overnight Delivery
85 Challenger Road
Ridgefield Park, NJ 07660

98 | ESTERLINE 0 5 | Worldwide Locations
Worldwide Locations
1 Arkansas East Camden 2 California Brea; Buena Park; Coachella; Rancho
Santa Margarita; Sylmar; Valencia
3 Idaho Coeur d’ Alene
4 Illinois Rockford
5 Massachusetts Taunton
6 Michigan Frankenmuth
7 New York Norwich
8 North Carolina Lillington
9 Virginia Hampton
10 Washington Kent; Seattle
11 Wisconsin Platteville
12 France Bourges; Niort; Sarralbe; Toulouse
13 Germany Munich; Nördlingen
14 United Kingdom Andover; Enfield; Farnborough;
Glouchester; London; Ringwood;
Southall
15 China Beijing; Hong Kong; Shanghai; Zunyi
1 2
3
4
56 7
8 9
11
10
12 13
14
15
United States
European Union
Far East


