Download - DT Report Preperation Using TEMS & MAPINFO

Table of Contents
How to Export & Plot Rx_Level _Sub (Dedicated Mode MS) & Rx_Level_Full (Idle Mode MS)....................3
TEMS PART..........................................................................................................................................3
MAPINFO PART...................................................................................................................................8
How to Export & Plot HANDOVER EVENTS (Handover & Handover Failure).............................................14
TEMS PART........................................................................................................................................14
MAPINFO PART.................................................................................................................................18
How to Export & Plot SQI..........................................................................................................................21
TEMS PART........................................................................................................................................21
MAPINFO PART.................................................................................................................................25
How to Export & Plot RX QUAL..................................................................................................................31
TEMS PART........................................................................................................................................31
MAPINFO PART.................................................................................................................................36

NOTE: On completion of Drive test, these plots to evaluate the Quality/Coverage of BTS site.
MS1: Used in Dedicated mode
MS2: Used in Idle Mode

How to Export & Plot Rx_Level _Sub (Dedicated Mode MS) & Rx_Level_Full (Idle Mode MS)
TEMS PART1. Select the logs which you have recorded during the drive test.
2. Open TEMS. Click on Logfile in Main Menu >Export Logfile>, New window with name as “Export logfile will open”. See Figure1.
Figure 1
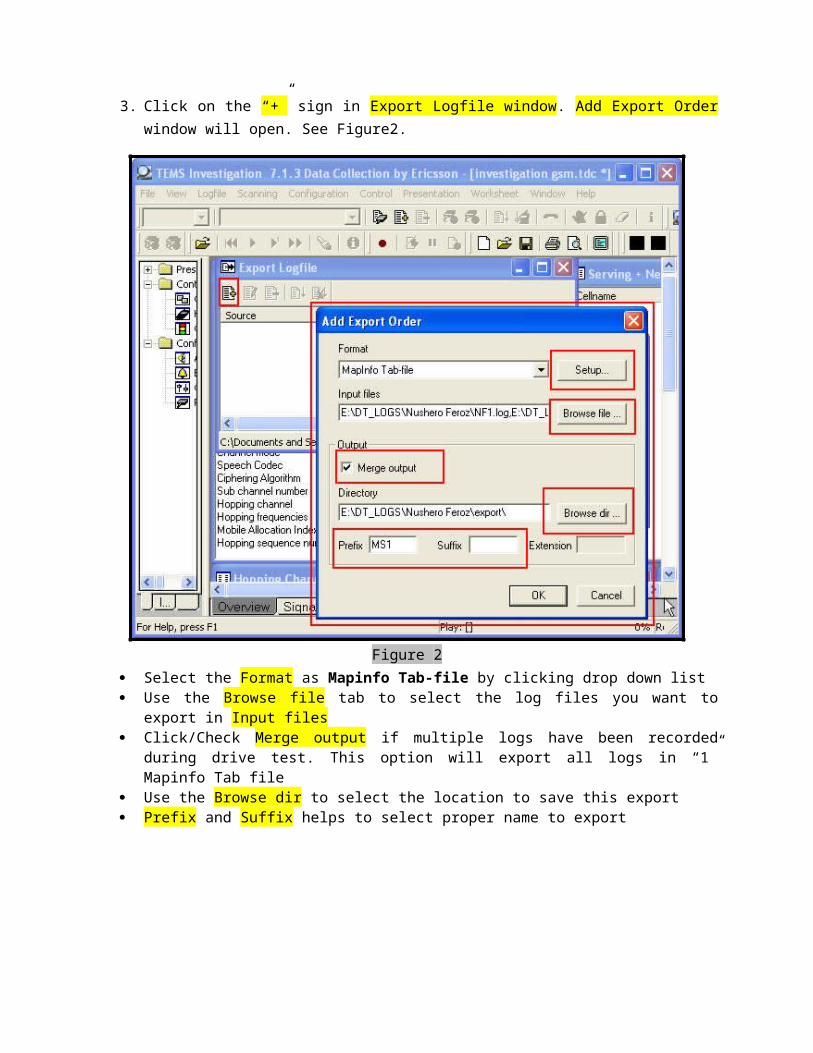
3. Click on the “+” sign in Export Logfile window. Add Export Order window will open. See Figure2.
Figure 2 Select the Format as Mapinfo Tab-file by clicking drop down list Use the Browse file tab to select the log files you want to export in Input files Click/Check Merge output if multiple logs have been recorded during drive test. This
option will export all logs in “1” Mapinfo Tab file Use the Browse dir to select the location to save this export Prefix and Suffix helps to select proper name to export

4. Click on the Setup tab, Mapinfo Tab file Setup window will appear. See Figure3
Figure 31. Select GSM from Available IEs.2. Select RxLev Sub (dBm) and RxLev Full (dBm)3. Respective MS can be selected by using Edit. In above figure,MS2 -RxLev Full (dBm) &
MS1-RxLev Sub (dBm)

4. Options tab is used to events export. Except in events plot always check Export events but do not plot events in MapInfo and click OK. See Figure4
Figure 4
5. Start the conversion. See figure5
Figure 5

6. On successful conversion, Export Result window will appear. Close the window and exit from TEMS. See figure6
Figure 6

MAPINFO PARTOpen Mapinfo & Plot sites (Orientation)
1. Go to Main Menu >File>open>Select the Path where you have export the log files>Open. Exported data will be plotted. See Figure7
Figure 7
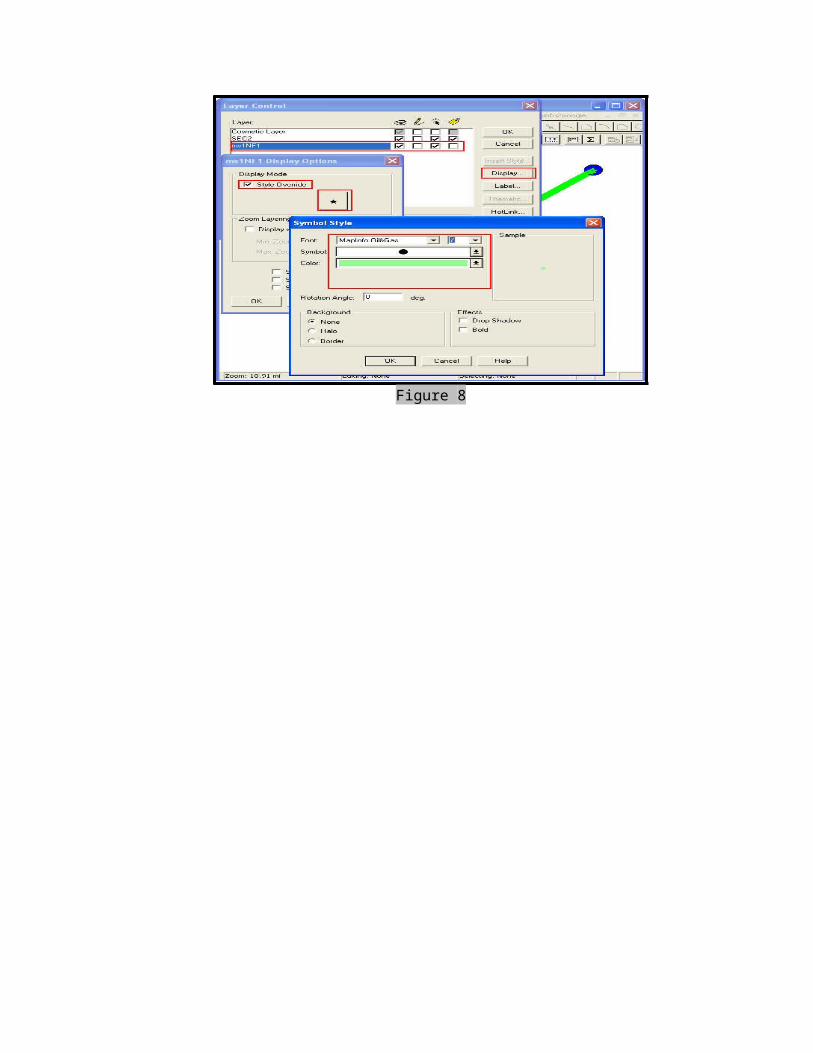
2. Filled circles in Blue color caused due by pauses during the DT. To discardRight click>Select the export layer>Display>Check Style Override>Click Symbol >change Symbol Style. See Figure 8
Figure 8
3. Final output. See Figure9
Figure 9
4. For Rx_level_Full/Sub Create thematic map. Mapinfo Main Menu>Map>Create Thematic Map. See figure 10
Figure 10

5. Select the Option of Ranges>Region Ranges Default>Next
Figure 11
6. Select the exported Table in Table TAB and than pick the filed you want to plot. Here we are plotting Rx_Level_Sub. Don’t forget to check the Option of Ignore Zeros and Blanks while plotting RX.
Figure 12
7. Go to Ranges Tab and select the Method “CUSTOM”. How many ranges you want to define can be select by changing in TAB of # of ranges. Set Round By Tab as None always. Define the ranges in Custom Ranges Tab and press Ok. See Figure 13

Figure 13
8. Select Styles. Uncheck the Replace Layer Style. Click Options Tab and select All Attributes instead of Color. Display symbols can be modified by setting and click Ok. See Figure 14
Figure 14
9. Select the Legend Tab. Give the Title of Legend in Title Tab. Select all ranges and check the Show this Range and Show Record Count. Click OK. See Figure 15

Figure 15

10. Final Output as shown below. Legend can be displayed by check legend TBA in Main Tool Bar. See Figure 16
Figure 16
11. This created thematic Legend can be saved for future to save time. See Figure 17
Figure 17
For Rx Level Full, select Rx_Level _Full Export in Thematic map step Go to Step 6.

How to Export & Plot HANDOVER EVENTS (Handover & Handover Failure)
TEMS PART1. Open TEMS. Click on Logfile in Main Menu >Export Logfile>, New window with name as
“Export logfile will open”. See Figure18.
Figure 18

2. Click on the “+” sign in Export Logfile window. Add Export Order window will open. See Figure19
Figure 19 Select the Format as Mapinfo Tab-file by clicking drop down list Use the Browse file tab to select the log files you want to export in Input files Click/Check Merge output if multiple logs have been recorded during drive test. This
option will export all logs in “1” Mapinfo Tab file Use the Browse dir to select the location to save this export Prefix and Suffix helps to select proper name to export Click on the Setup tab, Mapinfo Tab file Setup window will appear. See Figure20

Figure 203. Click the Options TAB. In Events Select Export events and Plot events in MapInfo with
unique symbol. See Figure 21
Figure 21

4. Events are ready to export. Click the “Start” button in “Export log file” window. Start the conversion. See Figure22
Figure 22
5. On successful conversion, Export Result window will appear. Close the window and exit from TEMS. See Figure23
Figure 23

MAPINFO PART1. Open Exported Events in Mapinfo. Select the Create Thematic Map option by using
MAP TAB in Main Menu. Select the Individual TAB in Thematic Map window. Point IndValue Default will be selected to plot create thematic Map. See figure 24
Figure 242. Pick the field of Events, click next. Don’t forget to check Ignore Zeros and Blanks
Figure 25

3. Click Styles; Select all events except Handover & Hanover Failure . Select Symbol None in Style. It will not appear in the final result.
Figure 264. Select Handover form list> Click Style> Font as Custom Symbol click Add and pick the
Hanover symbol form C:\Program Files\Common Files\MapInfo Shared\MapX Common\Custsymb and add.
Handover 5. Select Handover failure form list> Click Style> Font as Custom Symbol click Add and
pick the Hanover symbol form C:\Program Files\Common Files\MapInfo Shared\MapX Common\Custsymb and add
Handover failure

6. Select the appropriate symbol.
7. Final Output. See Figure 27
Figure 27

How to Export & Plot SQI
TEMS PART1. Open TEMS. Click on Logfile in Main Menu >Export Logfile>, New window with name as
“Export logfile will open”. See Figure28.
Figure 282. Click on the “+” sign in Export Logfile window. Add Export Order window will open. See
Figure29

Figure 29 Select the Format as Mapinfo Tab-file by clicking drop down list Use the Browse file tab to select the log files you want to export in Input files Click/Check Merge output if multiple logs have been recorded during drive test. This
option will export all logs in “1” Mapinfo Tab file Use the Browse dir to select the location to save this export Prefix and Suffix helps to select proper name to export

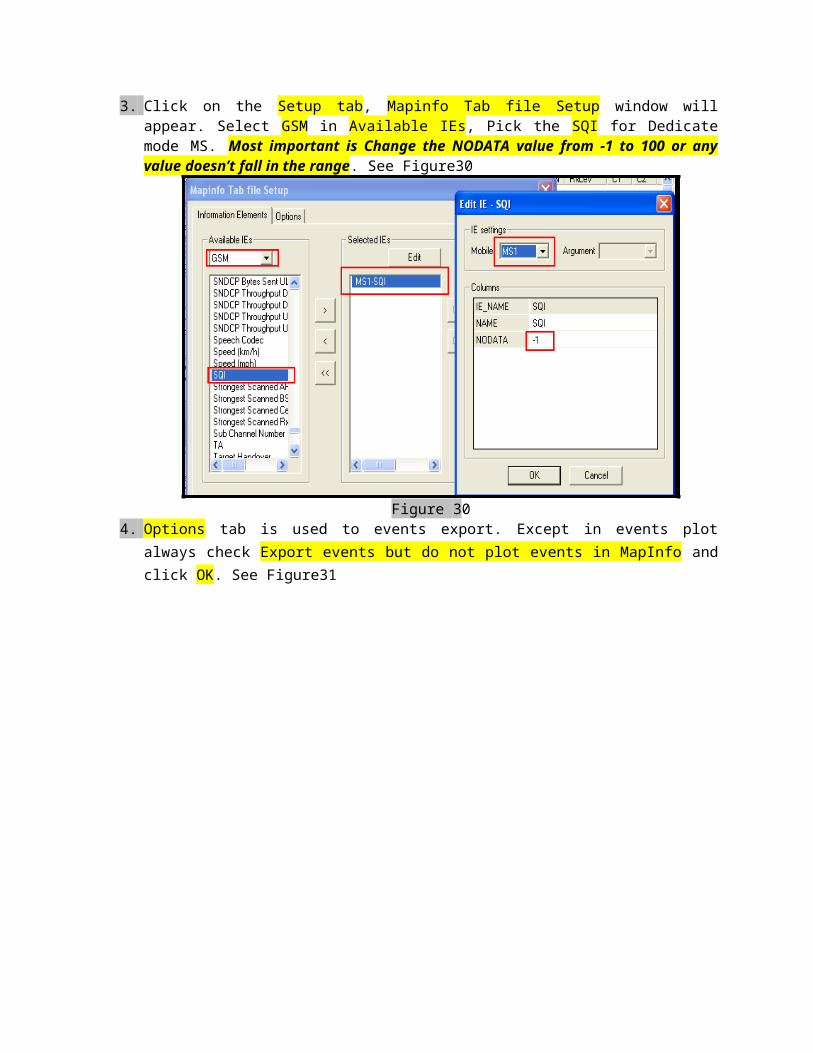
3. Click on the Setup tab, Mapinfo Tab file Setup window will appear. Select GSM in Available IEs, Pick the SQI for Dedicate mode MS. Most important is Change the NODATA value from -1 to 100 or any value doesn’t fall in the range. See Figure30
Figure 304. Options tab is used to events export. Except in events plot always check Export events
but do not plot events in MapInfo and click OK. See Figure31
Figure 31
5. Start the conversion. See figure32
Figure 326. On successful conversion, Export Result window will appear. Close the window and exit
from TEMS. See figure33
Figure 33

MAPINFO PARTOpen Mapinfo & Plot sites (Orientation)
1. Go to Main Menu >File>open>Select the Path where you have export the log files>Open. Exported data will be plotted. See Figure34
Figure 342. Filled circles in Blue color caused due by pauses during the DT. To discard
Right click>Select the export layer>Display>Check Style Override>Click Symbol >change Symbol Style. See Figure35
Figure 35

3. Final output. See Figure36
Figure 36
4. For Rx_level_Full/Sub Create thematic map. Mapinfo Main Menu>Map>Create Thematic Map. See figure37
Figure 37
5. Select the Option of Ranges>Region Ranges Default>Next see figure38

Figure 38
6. Select the exported Table in Table TAB and than pick the filed you want to plot. Here we are plotting SQI. Don’t check the Option of Ignore Zeros and Blanks while plotting SQI.
See figure39
Figure 39
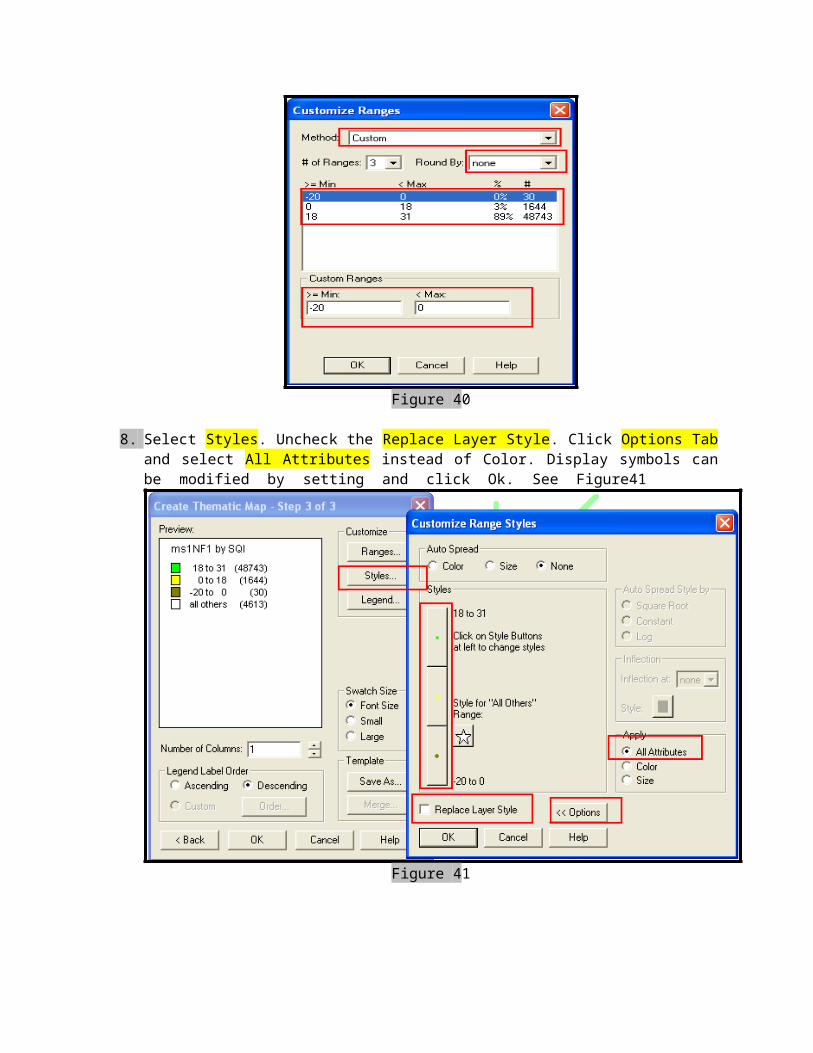
7. Go to Ranges Tab and select the Method “CUSTOM”. How many ranges you want to define can be select by changing in TAB of # of ranges. Set Round By Tab as None always. Define the ranges in Custom Ranges Tab and press Ok. See Figure40

Figure 40
8. Select Styles. Uncheck the Replace Layer Style. Click Options Tab and select All Attributes instead of Color. Display symbols can be modified by setting and click Ok. See Figure41
Figure 41
7. Select the Legend Tab. Give the Title of Legend in Title Tab. Select all ranges and check the Show this Range and Show Record Count. Click OK. See Figure42

Figure 42
8. Final Output as shown below. Legend can be displayed by check legend TAB in Main Tool Bar. See Figure43
Figure 43

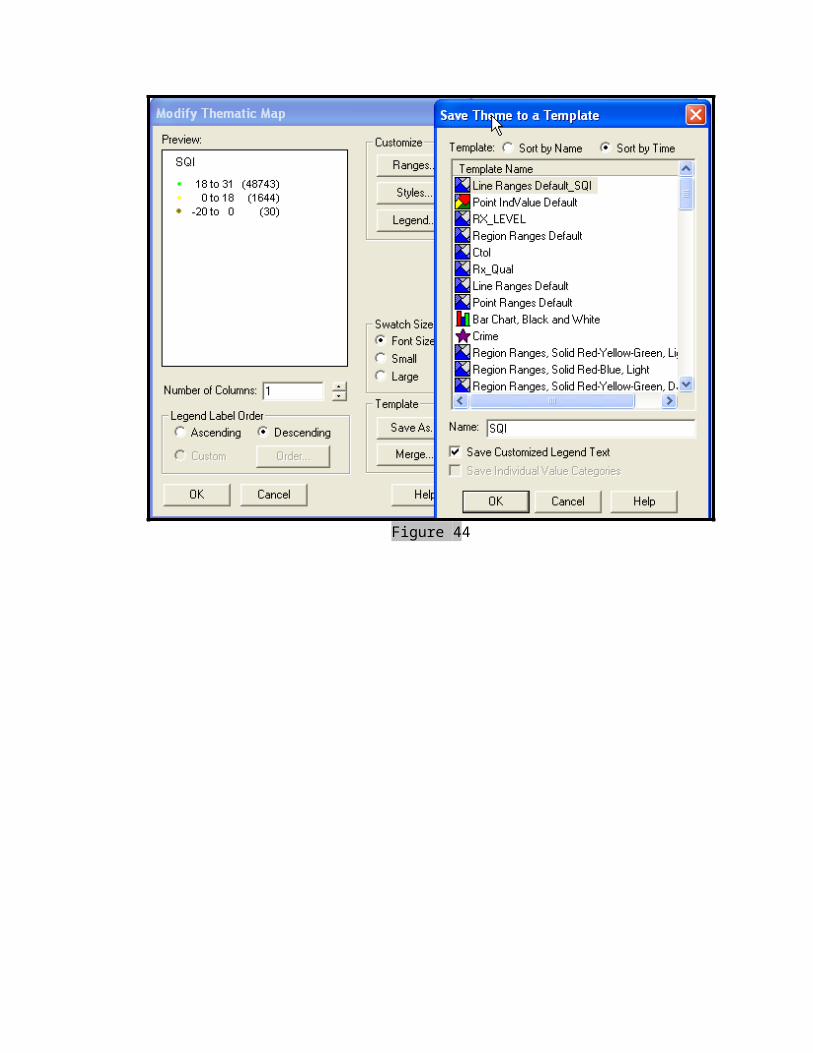
9. This created thematic Legend can be saved for future to save time. See Figure 44
Figure 44
How to Export & Plot RX QUAL
TEMS PARTOn completion of Drive test, generate these plots to evaluate the coverage of BTS site.
Generally MS1: Used in Dedicated mode, MS2: Used in Idle Mode
7. Select the logs which you have recorded during the drive test.
8. Open TEMS. Click on Logfile in Main Menu >Export Logfile>, New window with name as “Export logfile will open”. See Figure45.
Figure 45

9. Click on the “+” sign in Export Logfile window. Add Export Order window will open. See Figure46.
Figure 46 Select the Format as Mapinfo Tab-file by clicking drop down list Use the Browse file tab to select the log files you want to export in Input files Click/Check Merge output if multiple logs have been recorded during drive test. This
option will export all logs in “1” Mapinfo Tab file Use the Browse dir to select the location to save this export Prefix and Suffix helps to select proper name to export

10. Click on the Setup tab, Mapinfo Tab file Setup window will appear. See Figure47
Figure 478. Select GSM from Available IEs.9. Select Rx_Qual10. MS1 will be selected by using Edit. In above figure, MS1 –Rx_Qual Sub is selected.
11. Options tab is used to events export. Except in events plot always check Export events but do not plot events in MapInfo and click OK. See Figure48
Figure 48
12. Start the conversion. See figure49
Figure 49

13. On successful conversion, Export Result window will appear. Close the window and exit from TEMS. See figure50
Figure 50

MAPINFO PARTOpen Mapinfo & Plot sites (Orientation)
1. Go to Main Menu >File>open>Select the Path where you have export the log files>Open. Exported data will be plotted. See Figure51
Figure 51
2. Filled circles in Blue color caused due by pauses during the DT. To discardRight click>Select the export layer>Display>Check Style Override>Click Symbol >change Symbol Style. See Figure 52
Figure 52

3. Final output. See Figure53
Figure 53
4. For Rx_level_Full/Sub Create thematic map. Mapinfo Main Menu>Map>Create Thematic Map. See figure54
Figure 545. Select the Option of Ranges>Region Ranges Default>Next. See figure55

Figure 556. Select the exported Table in Table TAB and than pick the filed you want to plot. Here we
are plotting SQI. Don’t check the Option of Ignore Zeros and Blanks while plotting SQI. See Figure 56
Figure 569. Go to Ranges Tab and select the Method “CUSTOM”. How many ranges you want to
define can be select by changing in TAB of # of ranges. Set Round by Tab as None always. Define the ranges in Custom Ranges Tab and press Ok. See Figure 57

Figure 577. Select Styles. Uncheck the Replace Layer Style. Click Options Tab and select All
Attributes instead of Color. Display symbols can be modified by setting and click Ok. See Figure58
Figure 58
10. Select the Legend Tab. Give the Title of Legend in Title Tab. Select all ranges and check the Show this Range and Show Record Count. Click OK. See Figure59

Figure 5911. Final Output as shown below. Legend can be displayed by check legend TAB in Main
Tool Bar. See Figure60
Figure 60
12. This created thematic Legend can be saved for future to save time. See Figure 61

Figure 61


