
Dynamic Downscaling to Study Climate Change Impacts on Water
Resources in India
IIT Delhi
IIT Madras
Anna University, Chennai
Banaras Hindu University, Banaras
Progress Review Meeting of projects under NWM Monday, 25th February 2019
RPD-2

Partners• IIT Delhi:
– Krishna AchutaRao, Centre for Atmospheric Sciences
– Dilip Ganguly, Centre for Atmospheric Sciences
• IIT Madras:
– Chakravarthy Balaji, Department of Mechanical Engineering
– Balaji Narasimhan, Department of Civil Engineering
– Sachin S. Gunthe , Department of Civil Engineering
• Anna University:
– K. Palanivelu, Director, Centre for Climate Change and Adaptation Research
• BHU Varanasi:
– Rajesh Kumar Mall, DST Mahamana Centre of Excellence for Climate Change Research, Banaras Hindu University

Objectives
1. To produce the downscaled climate data (at ~50km) under future scenarios to carry out river basin impact studies.
2. To build capacity within the country to carry out dynamical downscaling.
3. To train manpower to be able to perform dynamical downscaling as well as in utilization of downscaled output.

Downscaling Models Chosen
• Global Climate Model at High Resolution
– CAM5 (Community Atmospheric Model Version 5” from National Center for Atmospheric Research) IITD
• Nested Regional Climate Models:
– WRF (“Weather Research & Forecast” Model from National Center for Atmospheric Research) IITM
– PRECIS (“Providing REgional Climates for Impacts Studies” from UK Met Office Hadley Centre) Anna U
– RegCM4.6 (“Regional Climate Model Version 4” from ICTP, Trieste) BHU
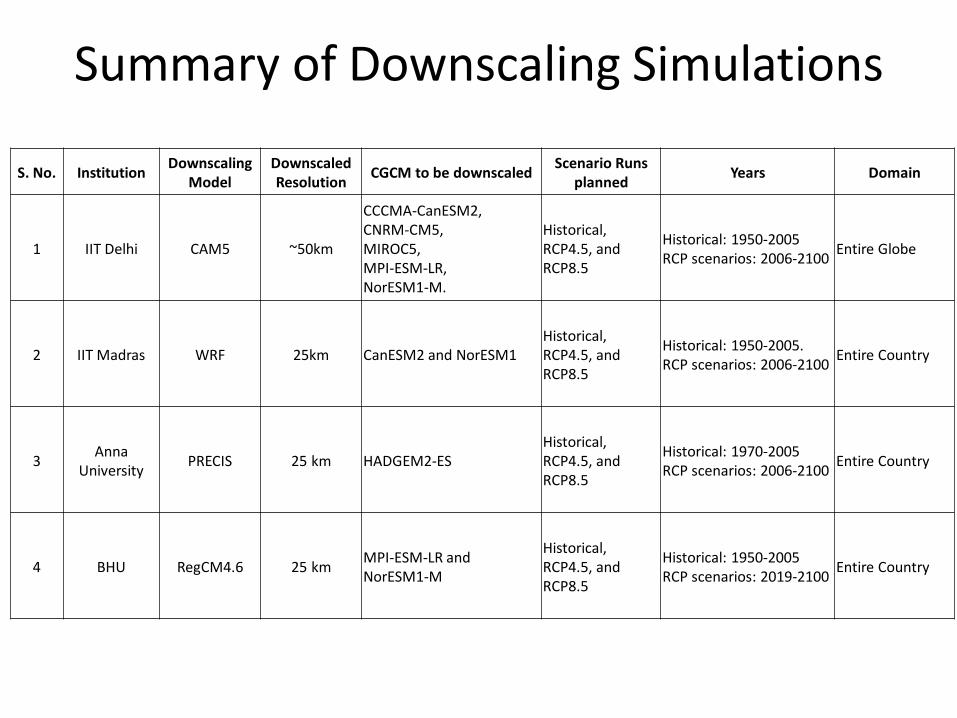
Summary of Downscaling Simulations
S. No. InstitutionDownscaling
ModelDownscaled Resolution
CGCM to be downscaledScenario Runs
plannedYears Domain
1 IIT Delhi CAM5 ~50km
CCCMA-CanESM2, CNRM-CM5, MIROC5, MPI-ESM-LR,NorESM1-M.
Historical, RCP4.5, and RCP8.5
Historical: 1950-2005RCP scenarios: 2006-2100
Entire Globe
2 IIT Madras WRF 25km CanESM2 and NorESM1 Historical, RCP4.5, and RCP8.5
Historical: 1950-2005. RCP scenarios: 2006-2100
Entire Country
3Anna
UniversityPRECIS 25 km HADGEM2-ES
Historical, RCP4.5, and RCP8.5
Historical: 1970-2005RCP scenarios: 2006-2100
Entire Country
4 BHU RegCM4.6 25 kmMPI-ESM-LR and NorESM1-M
Historical, RCP4.5, and RCP8.5
Historical: 1950-2005RCP scenarios: 2019-2100
Entire Country

Deliverables
• Variables (Minimum list):– Daily Rainfall
– Daily Max and Min Temperatures
– Daily RH
– Daily Solar Radiation
– Daily Wind Speed
• Data Format– netCDF format (On model grid)
– Example scripts to extract as text inputs needed for hydrologic modelling.

IIT Delhi

The Community Atmosphere Model Version 5 (CAM5)
•~3 mb model top pressure•Choice of 0.5o, 1o, 2o horizontal resolution •Choice of 30 or 60 vertical layers•30-minute time step•Finite volume (Fv) dynamical core•Community Land Model (CLM4.5)•UW moist turbulence
•UW shallow convection•UW macrophysics•Zhang-McFarlane deep convection•Morrison-Gettelman 2-moment stratiformmicrophysics•RRTMG radiation scheme•Choice of 3-mode Modal Aerosol Model (MAM3), 7-mode (MAM-7)

Progress
• Five GCMs to be chosen fromCCCMA-CanESM2, CNRM-CM5, MIROC5, MPI-ESM-LR, NorESM1-M.
• Computing time allocation for Rs. 25 Lakhs on IITD Supercomputer PADUM
• Storage server finalized and purchase process to be completed in a week or so.
• Two research scholars currently working on this project
• Historical simulations being carried out.
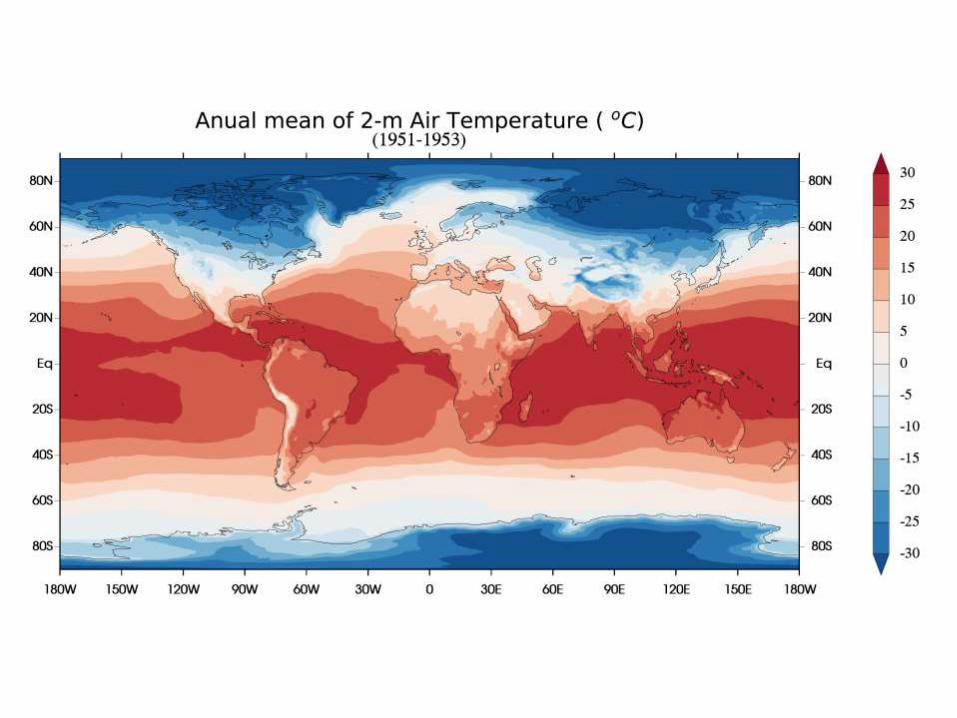

Surface Air Temperature (mean) °C
Rainfall mm/day

IIT Madras

RCMWRF model has been chosen by the IIT Madras group to carry out the dynamical downscaling of the two GCMs (CanESM2 and NorESM1).
The first time-slice is chosen to be a recent period with sufficient observations (1950-2005). The two GCMs selected are used for estimating the future change in the climate(2006-2100) under RCP 4.5 and 8.5 scenarios.
A horizontal resolution of 25km (inner domain) has been chosen so as to capture the local sub-grid scale features and dynamics and for assessment of impact of climate change on the water resources of Indian river basins.
BIAS ADJUSTMENTDownscaled Daily rainfall and temperature data would be assessed for bias. Any bias would be adjusted based on the widely accepted Quantile-Quantile mapping technique
Methodology

Fig1: Map showing the domains used in WRF

Resources
• Access to the VIRGO super cluster of IIT Madras
• Access to the IITM Pune super cluster is being explored
• Orders have been placed for two servers each with 28 cores, 128 GB RAM, and Intel Xeon Gold 2.2GHz processer and 6TB storage
• Two Research Scholars have started working on this project

Downscaling using WRF
• Model physics options are being checked for robustness with downscaling reanalysis data with WRF– ERA-Interim
– NCEP
– MERRA
– JRA-55
• Comparing the downscaled reanalysis with the IMD gridded data
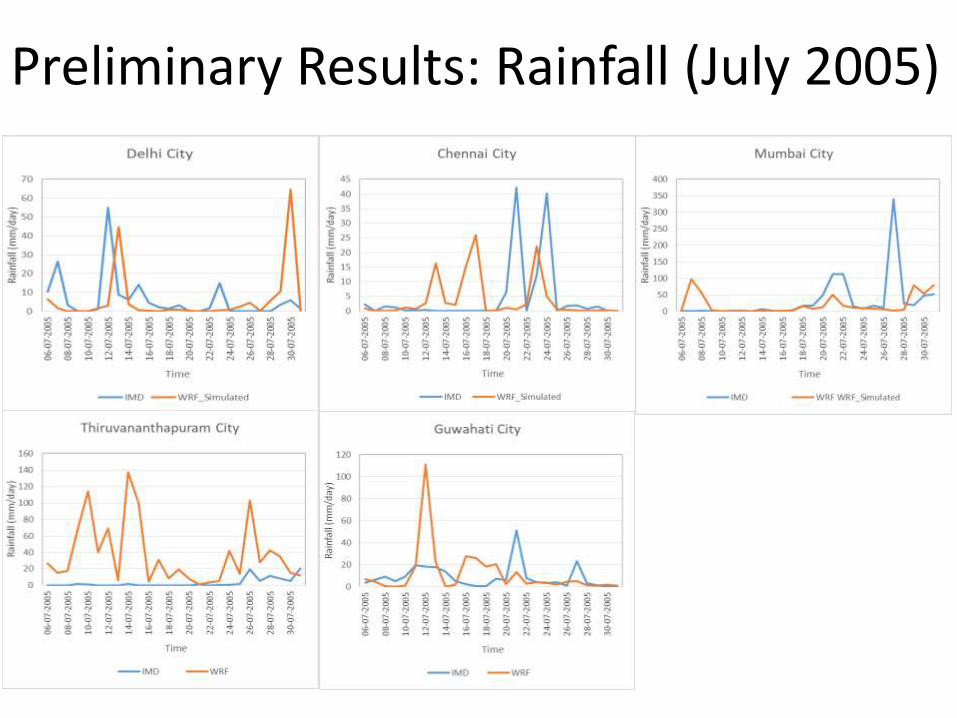
Preliminary Results: Rainfall (July 2005)

Preliminary Results: Temperature (July 2005)
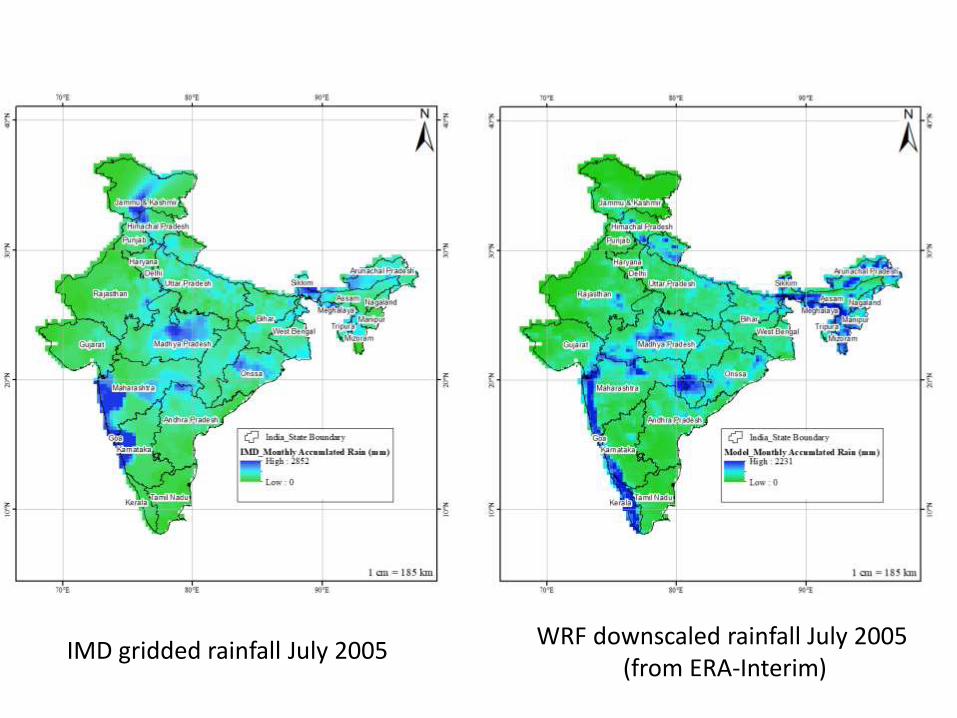
IMD gridded rainfall July 2005WRF downscaled rainfall July 2005
(from ERA-Interim)

• Conducted preliminary study on the performance of CMIP5 GCMs in simulatingIndian summer monsoon.
• CanESM2 and NorESM1 GCMs were selected to provide initial and boundaryconditions to the Weather Research and Forecasting (WRF) model.
• These GCMs were selected for downscaling to complement the data from CORDEXSouth-Asia as well as their performance in simulating the Indian Summer Monsoon(Anand et al., 2018; Sengupta and Rajeevan 2013)
• The historical run is with the above GCMs forcing for the period 1950-2005.
• The two future scenarios will be from:• RCP 4.5 from 2006-2100• RCP 8.5 from 2006-2100
• The model validation will be performed by comparing the WRF simulatedvariables with possible networks of meteorological weather stations such asgridded weather data such as IMD 0.5º × 0.5 º rainfall data and APHRODITE 0.25 º× 0.25 º rainfall data
Progress

Anna University

PRECIS-Providing Regional Climate For Impact Studies
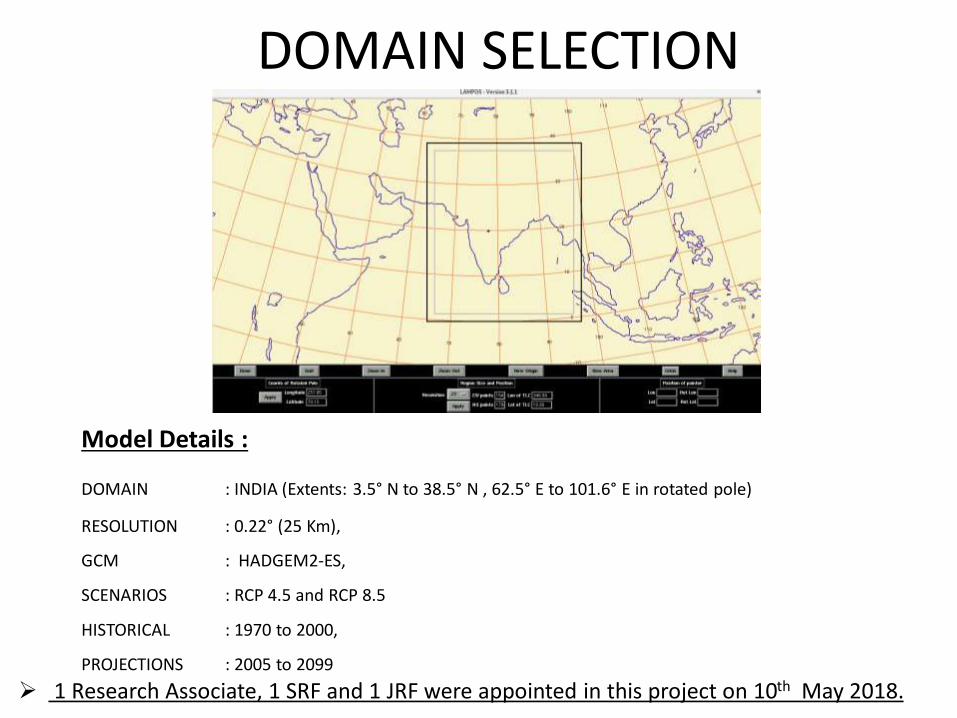
Model Details :
DOMAIN : INDIA (Extents: 3.5° N to 38.5° N , 62.5° E to 101.6° E in rotated pole)
RESOLUTION : 0.22° (25 Km),
GCM : HADGEM2-ES,
SCENARIOS : RCP 4.5 and RCP 8.5
HISTORICAL : 1970 to 2000,
PROJECTIONS : 2005 to 2099
DOMAIN SELECTION
1 Research Associate, 1 SRF and 1 JRF were appointed in this project on 10th May 2018.
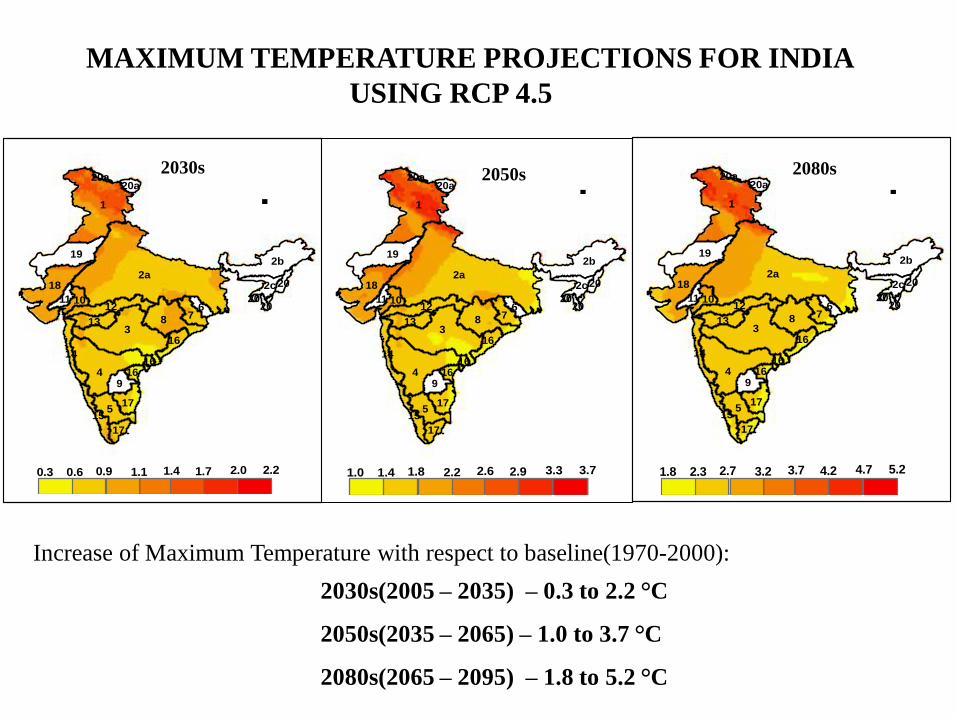
MAXIMUM TEMPERATURE PROJECTIONS FOR INDIA
USING RCP 4.5
2a
1
3
4
8
18
2b
5
19
7
9
17
12
13
6
14
15
2c
16
10
17
11
16
20
20a
20
16
20a
20
.
2.22.01.71.41.10.90.3 0.6
2a
1
3
4
8
18
2b
5
19
7
9
17
12
13
6
14
15
2c
16
10
17
11
16
20
20a
20
16
20a
20
.
3.73.32.92.62.21.81.0 1.4
2a
1
3
4
8
18
2b
5
19
7
9
17
12
13
6
14
15
2c
16
10
17
11
16
20
20a
20
16
20a
20
.
5.24.74.23.73.22.71.8 2.3
2030s 2050s 2080s
Increase of Maximum Temperature with respect to baseline(1970-2000):
2030s(2005 – 2035) – 0.3 to 2.2 °C
2050s(2035 – 2065) – 1.0 to 3.7 °C
2080s(2065 – 2095) – 1.8 to 5.2 °C
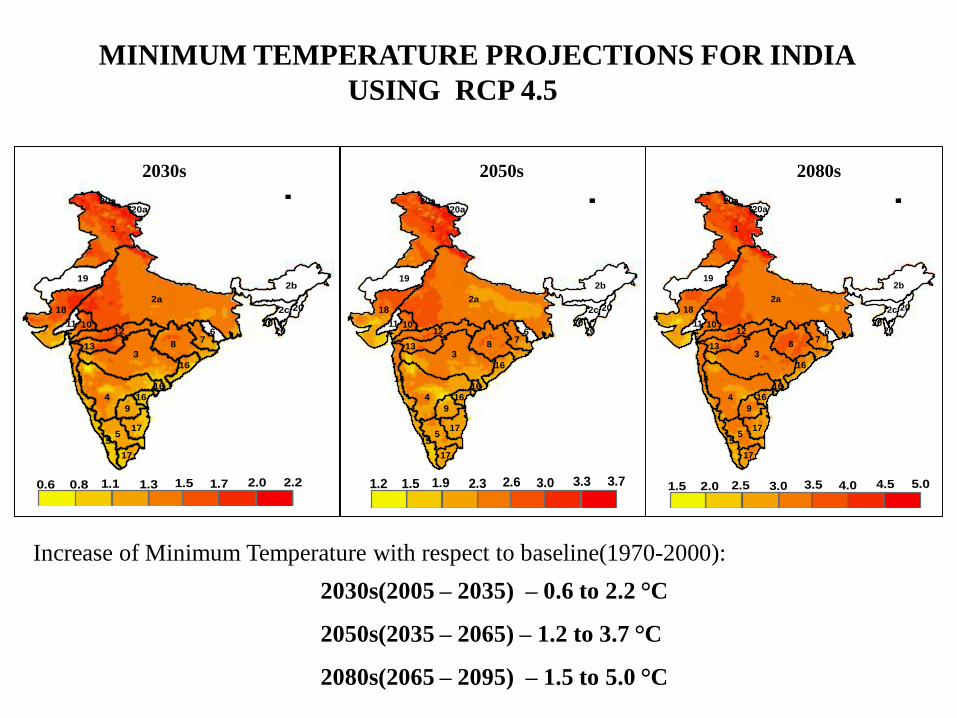
MINIMUM TEMPERATURE PROJECTIONS FOR INDIA
USING RCP 4.5
2a
1
3
4
8
18
2b
5
19
7
9
13
17
12 6
14
15
2c
16
10
17
11
16
20
20a
20
16
20a
20
2.22.01.71.51.31.10.6 0.8
.
2a
1
3
4
8
18
2b
5
19
7
9
13
17
12 6
14
15
2c
16
10
17
11
16
20
20a
20
16
20a
20
.
3.73.33.02.62.31.91.2 1.5
2a
1
3
4
8
18
2b
5
19
7
9
13
17
12 6
14
15
2c
16
10
17
11
16
20
20a
20
16
20a
20
.
5.04.54.03.53.02.51.5 2.0
Increase of Minimum Temperature with respect to baseline(1970-2000):
2030s(2005 – 2035) – 0.6 to 2.2 °C
2050s(2035 – 2065) – 1.2 to 3.7 °C
2080s(2065 – 2095) – 1.5 to 5.0 °C
2030s 2050s 2080s

ANNUAL RAINFALL PROJECTIONS FOR INDIA
USING RCP 4.5
2a
1
3
4
8
18
2b
5
19
7
9
13
17
2c
16
10
17
12 6
14
15
11
16
20
20a
20
16
20a
20
.
2a
1
3
4
8
18
2b
5
19
7
9
13
17
2c
16
10
17
12 6
14
15
11
16
20
20a
20
16
20a
20
.
2a
1
3
4
8
18
2b
5
19
7
9
13
17
2c
16
10
17
12 6
14
15
11
16
20
20a
20
16
20a
20
.2030s 2050s 2080s
1000 1500 2000 25000 500 3000 <

BHU
DST Mahamana Centre of Excellence for Climate Change Research
Banaras Hindu University
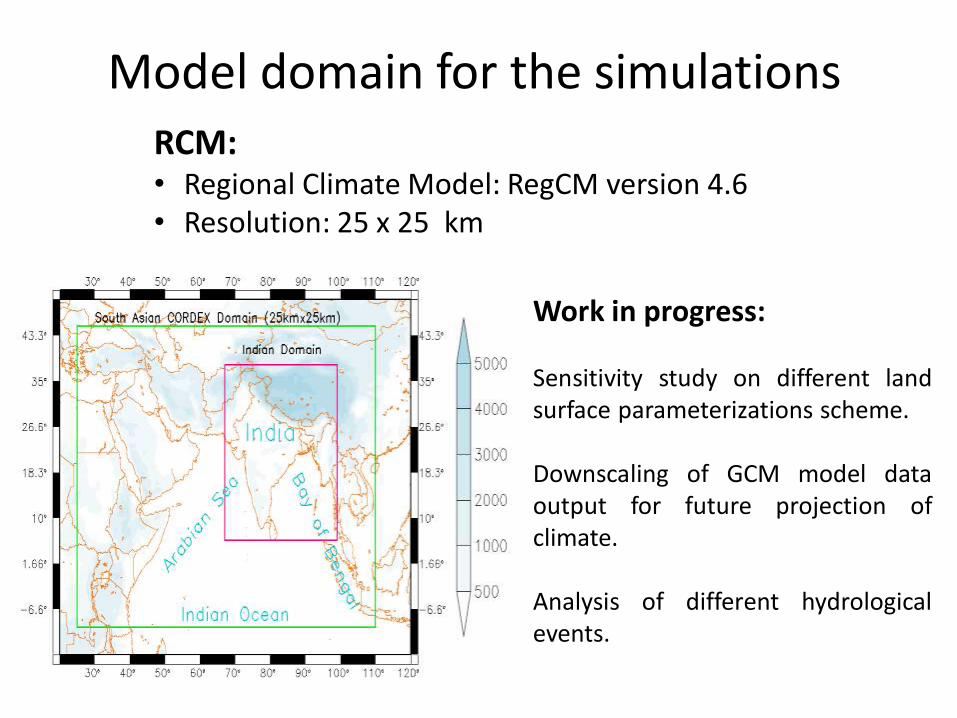
Model domain for the simulations
Work in progress:
Sensitivity study on different landsurface parameterizations scheme.
Downscaling of GCM model dataoutput for future projection ofclimate.
Analysis of different hydrologicalevents.
RCM:• Regional Climate Model: RegCM version 4.6 • Resolution: 25 x 25 km
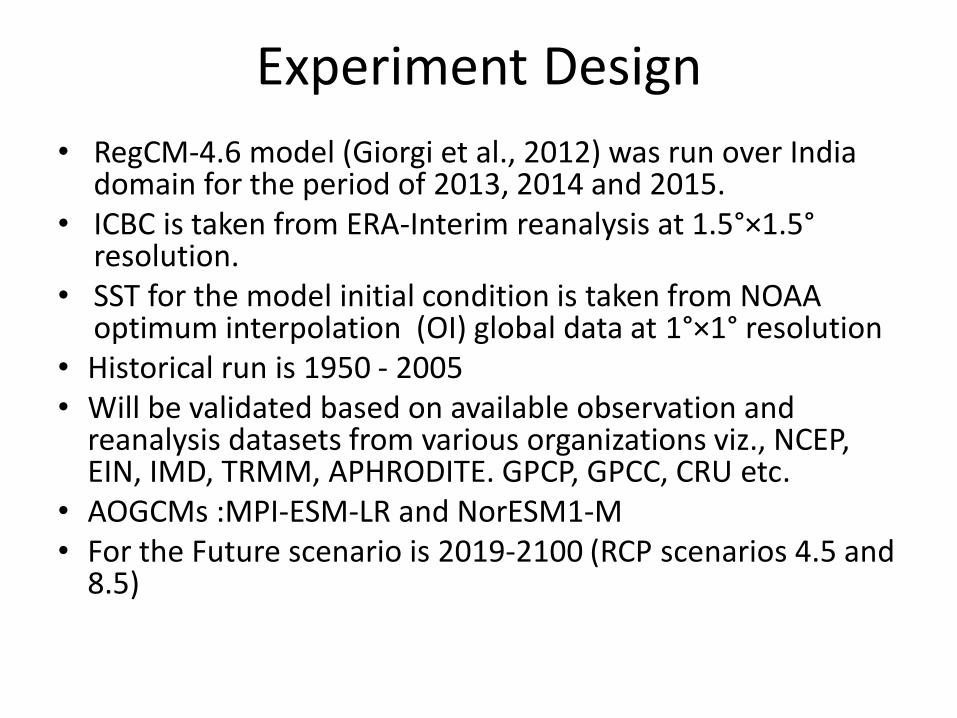
Experiment Design
• RegCM-4.6 model (Giorgi et al., 2012) was run over India domain for the period of 2013, 2014 and 2015.
• ICBC is taken from ERA-Interim reanalysis at 1.5°×1.5°resolution.
• SST for the model initial condition is taken from NOAA optimum interpolation (OI) global data at 1°×1° resolution
• Historical run is 1950 - 2005 • Will be validated based on available observation and
reanalysis datasets from various organizations viz., NCEP, EIN, IMD, TRMM, APHRODITE. GPCP, GPCC, CRU etc.
• AOGCMs :MPI-ESM-LR and NorESM1-M • For the Future scenario is 2019-2100 (RCP scenarios 4.5 and
8.5)
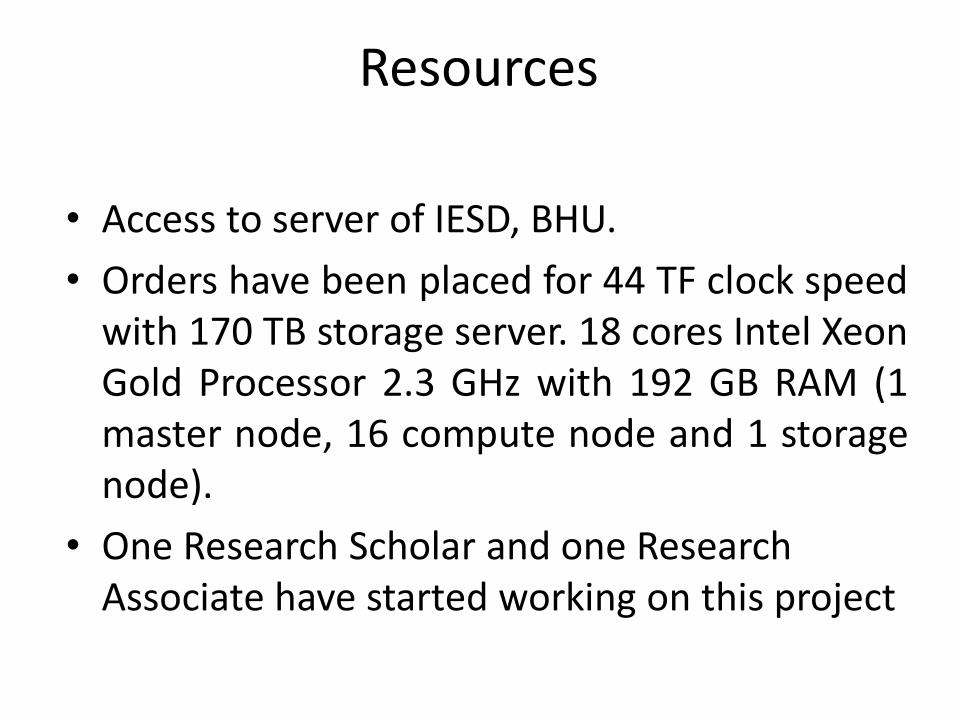
Resources
• Access to server of IESD, BHU.
• Orders have been placed for 44 TF clock speedwith 170 TB storage server. 18 cores Intel XeonGold Processor 2.3 GHz with 192 GB RAM (1master node, 16 compute node and 1 storagenode).
• One Research Scholar and one Research Associate have started working on this project

Preliminary results of Sensitivity studyFlood Events
Drought Events
Sensitivity analysis showing the composite monsoon rainfall pattern over Indian subcontinent during flood and drought events simulated by different cumulus
parameterized schemes of RegCM4 (1981-2012).
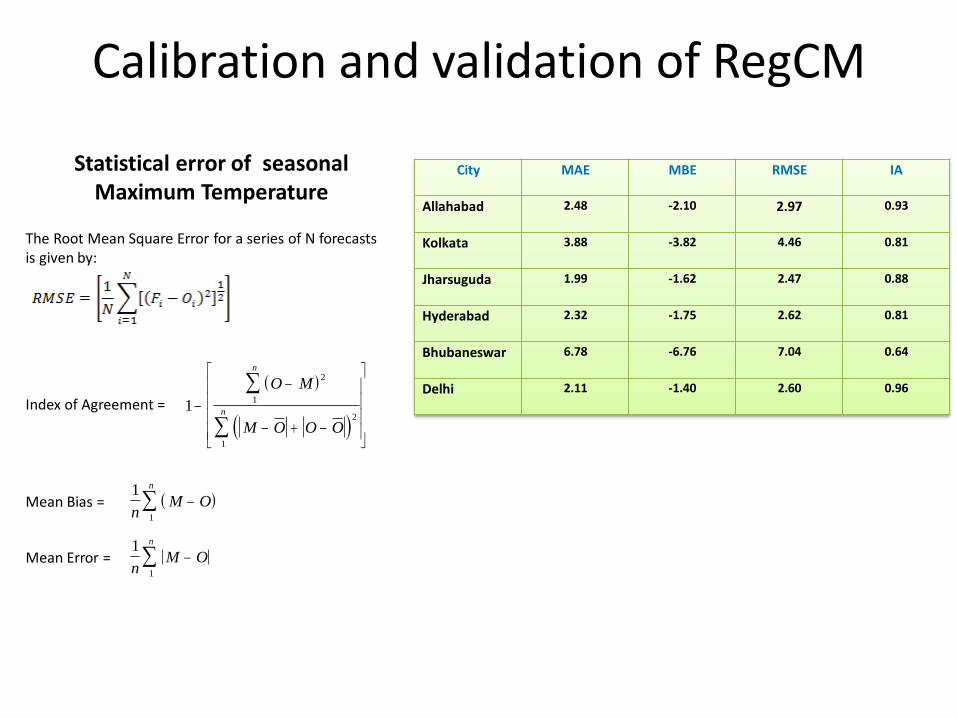
Calibration and validation of RegCM
City MAE MBE RMSE IA
Allahabad 2.48 -2.10 2.97 0.93
Kolkata 3.88 -3.82 4.46 0.81
Jharsuguda 1.99 -1.62 2.47 0.88
Hyderabad 2.32 -1.75 2.62 0.81
Bhubaneswar 6.78 -6.76 7.04 0.64
Delhi 2.11 -1.40 2.60 0.96
Statistical error of seasonal Maximum Temperature
The Root Mean Square Error for a series of N forecasts is given by:
Index of Agreement =
1
2
1
2
1
O M
M O O O
n
n
1
1nM O
n
1
1nM O
n
Mean Bias =
Mean Error =

Thanks


