
3Early Warning Indicators Study Of Bank Runs In Indonesia : Markov-switching Approach
EARLY WARNING INDICATORS STUDY OF BANK RUNSIN INDONESIA : MARKOV-SWITCHING APPROACH
Iskandar Simorangkir 1
A run on a particular bank can lead to a banking crisis if it spreads to other banks (contagious effect). In
the case of Indonesia, bank runs have also reoccurred time and again. In 1992, bank runs affected several
national banks, subsequently precipitating the liquidation of one bank. Then in 1997/1998, bank runs
developed into the worst banking crisis ever witnessed in the banking history of Indonesia. Considering
the extent of losses attributable to bank runs and the banking crisis, extensive studies on the early warning
indicators of bank runs are urgently required to prevent future bank runs and banking crises. This paper
aims to comprehensively analyse the early warning indicators of bank runs for all banks in Indonesia, both
during the sample period of 1990-2005 as well as during the banking crisis in 1997-1998. The study of
early warning indicators of bank runs uses the Markov-Switching model. To calculate the transition
probability from a tranquil state to a state of bank run uses the Markov-Switching process through an
auto-regressive approach. The change in deposits held at each bank is used as a variable of bank runs.
The results of Markov-Switching (MS) show that the MS model is robust as an early warning indicator of
bank runs. This is reflected by testing, which was performed on the actual incident of 102 banks, showing
that the MS model only produced false signals an estimated 0.69% - 2.08% of the time.
1 Director / Head of Economic Research Group Bank Indonesia. The authors would like to thank the participants of the InternationalConference on Economic Modelling-Ecomod 2012, Seville, Spain, held July 4 to 6, 2012. Also thank you to Professor RustamDidong, Dr. Muliaman D. Hadad and Dr. Sugiharso Safuan for their valuable comments. The views of this paper represent thepersonal opinions of the author and do not reflect the opinions of BI.
Abstract
Keywords: Bank Runs, Early Warning Indicators, Markov-Switching
JEL Classification: C22, G21JEL Classification: C22, G21JEL Classification: C22, G21JEL Classification: C22, G21JEL Classification: C22, G21

4 Bulletin of Monetary Economics and Banking, July 2012
I. INTRODUCTION
Bank runs occur because of vulnerability to the withdrawal of bank customers. The vulnerability
is related to the business activities of banks that transforms short-term liabilities, such as demand
deposits, savings deposits and assets into the longer-term liabilities, such as credit. Under theseconditions, banks are faced with the problem of maturity missmatch which makes it vulnerable
to a massive with drawal of funds (bank runs) by customers due to limited liquid assets owned
by customers. The withdrawal of massive public deposits is mainly due to the decline of publicconfidence in the banks. Decline in confidence in the bank point to internal factors, such as the
decline in bank performance, as well as other external factors, such as the deterioration of the
economy resulting in acontagion effect.
Empirical evidence suggests that the impact of bank runs can negatively affect the country»seconomy especially if widespread resulting in a banking crisis. A banking crisis stemming from
bank runs leads to a disconnection of intermediation financing and brings a business to a
standstill. Cessation of funding sources can result in business activity or production halted andeventually lead to contraction or slowdown and rising unemployment. From the fiscal side, a
banking crisis will lead to higher cost recovery for bank restructuring. All these recovery costs
will ultimately be borne by the tax payer or the public.
The experience of the 1997/1998 Asian crisis showed that the banking crisis was one of
the main factors that resulted in the severe economic contraction in Asian countries. The
Indonesian economy was an economy that contracted the most high, reaching -13.1% in1998. Meanwhile, economic growth in Thailand, Malaysia, South Korea and the Philippines in
the same year contracted by 10.5%, 7.4%, 6.9% and 0.6%, respectively. Also, the cost of
restructuring from the banking crisis reached 45% of gross domestic product for Indonesia,15% to 12% for Korea and Malaysia (Lindgren et. All. 1999).
Given the incidence of bank runs can be repeated and harm the economy, its impact will
require in-depth study on the development of models of early indicators to prevent bank runs.In general, research on early warning indicators (EWI) uses two main models, namely the signal
extraction model and econometrics model.
The signal extraction model uses a non-parametric approach by observing the behavior
of particular variables before and after crisis. The model is widely used and is used as a referencestudy by Kaminsky (1998, 1999) as an early warning indicator of exchange rate and banking
crises, and Kaminsky, Lizondo and Reinhart (1998) as an EWS for exchange rate crisis. Other
models used to detect banking crisis are Econometric models, one of which is the logit model.Demirgüc-Kunt and Detragiache (1998) used a logit model to detect the onset of a banking
crisis. In this approach, the possibility of a crisis is assumed to be a function of the explanatoryvariable vector, where the dependent variable is 0 if no crisis and 1 if a crisis occurs.
Research on early warning indicators (EWI) were conducted by several authors. The research
of Agung et al. (2003) and Dewati et al. (2004) discussed the early warning indicators of

5Early Warning Indicators Study Of Bank Runs In Indonesia : Markov-switching Approach
exchange rate crisis and the financial crisis in Indonesia using the signal extraction model. This
approach has several problems, namely the value relating to the delimitation of the crisis(threshold) and duration of the crisis that was done arbitrarily. Bank Indonesia (2003a, 2003b
and 2003c) research studies of EWI in the stability of the financial system used discriminant
analysis and logistic regression, but did not do research on bank runs. Bank Indonesia (2004a)examined the bankruptcy prediction model of commercial banks in Indonesia by using factor
analysis and logistic regression, whereas EWIbank runswere not discussed.
With this background, this study will try to develop early warning indicators to detect thepossibility of bank runs using the markov-switching model. The second part of this paper discusses
the theoretical foundation and some empirical results of previous studies. The third section
describes the overview of the performance of national banks during the crisis and empiricalmodels used. Empirical results of the study will be presented in the fourth section, while the
final section provides conclusions and suggestions to prevent bank runs.
II. THEORY
2.1. Bank Runs and Early Warning Indicators
Early warning indicators for individual banks were built with earlier empirical studies conductedin the mid-1970s. Research by Gonzalez-Hermosillo (1999) concluded that the collapse of a
bank would be due to liquidity, market and credit risk. These three factors can certainly influence
the characteristics of individual banks and macroeconomic conditions. To capture the impact ofdifferent effects Gonzalez-Hermosillo (1999) estimated a regression model using several indicators
of banking (as a proxy of market risk, credit risk, liquidity risk and moral hazard factor) together
with regional and macroeconomic variables. The study explicitly investigated how the fall of anindividual bank may be affected by the vulnerability of the financial sector as a whole (e.g., by
considering contagion). Specifically, the study put the total ratio of credit to output as a measure
of vulnerability of the banking sector in the regression.
In line with the research conducted by the U.S. Federal Deposit Insurance Corporation(FDIC) in the system indicators, Gonzalez-Hermosillo (1999) distinguished vulnerability indicators
derived from the risk factors that lead to bank collapse. In general, an increase in non-performingloans and falling capital ratio (CAR) were signals before the banks crashed. But few think that
these indicators were the main causes of the crisis in estimating the fall of banks. Some of the
main points of the research allude to the higher property loans and interbank placementsas thegreater the likelihood for the failure of a bank. Conversely the higher the acceptance of credit
and the greater the share of securities that can be traded, the smaller the risk of a bank collapse.
Meanwhile, the contagion factor influenced bank collapse in some cases, and the effect wasvery small.

6 Bulletin of Monetary Economics and Banking, July 2012
Meanwhile, Davis and Karim (2007) stated that in a study of early warning indicators
(EWI) a right approach needed, among others, by using logit and signal extraction. Differentmethods used to produce performance indicatorspredicted crisis differently.The logit method is
considered more feasible for use on a global early warning system (EWS), while the signal
extraction is more appropriate for country-specific EWS. Along with the development andliberalization of the financial sector2, the use of EWS for crisis prevention is needed.
Demirguc-Kunt and Detragiache (1999) conducted a study to predict the probability of a
banking crisis that was intended as a tool to monitor the vulnerability of the banking sector.Their research used multivariate logit with panel data, using variables that reflect macroeconomic
and financial sector. Variables that reflect macroeconomic conditions include: GDP growth,
changes in the terms of trade, exchange rate depreciation, inflation and the budget surplus /GDP. Meanwhile, the variables that reflect the characteristics of the financial sector, namely:
M2 / reserves and bank credit growth rate with a lag of two periods. In addition they used GDP
per capita as a proxy for the structural characteristics of the economy. The study results showedthat a low GDP growth, high real interest rates, high inflation, and strong credit growth in the
past as well as the magnitude of the ratio of M2 to reserves together have led to more banking
crisis. Meanwhile, the variable exchange rate depreciation, terms of trade, and the budgetsurplus to GDP did not seem to be significant.
The use of probit or logit regression, and approach as an indicator of early warning
signals has some disadvantages. First, the determination of the date of commencement of thecrisis is anarbitrary determination which tends to be late (Von Hagen and Ho, 2003). Secondly,
the early indicators of banking using the ratio deviation (noise) as a signal which was a minimum
and has limitations. These limitations led to the delineation of the banking crisis index value(threshold) conducted arbitrarily. Some researchers defined different thresholds without providing
a strong argument, as Eichengreen, Rose and Wyplosz (1996) who defined a crisis threshold of
1.5 standard deviations from the mean, while Kaminsky and Reinhart (1999) defined a crisisthreshold for 3 standard deviations above average (mean). In addition, the threshold of the
crisis also greatly depends on the amount of sampling that was taken. The addition of data or
an extended period of time can change the crisis limit. The third weakness is the crisis indextransformation into binary numbers may result in the loss of relevant information.
In line with weaknesses using the probit / logit approach and the arbitrary use of the
boundary (threshold) crisis, there is growing use of the Markov-Switching models in studying
the exchange rate crisis and the banking crisis. The use of this model is not only limited to beused to identify periods of crisis but also to estimate when the banking crisis could happen. The
use of Markov-Switching in analyzing or detecting the occurrence of banking crises has several
2 Liberalization of the financial sector according to Karim and Davis (2007) is the freedom given to a financial institution from marketmechanisms to remove barriers from the Government.

7Early Warning Indicators Study Of Bank Runs In Indonesia : Markov-switching Approach
advantages. First, the crisis index limit value (threshold) is an endogenous variable or in other
words the crisis period and the duration of the crisis is part of the estimated results. In thisapproach, the economy is assumed to be in a tranquil state or state crisis. Thus, the second
state is not observed directly, and both are latent variables. However, both these state indicators
can be observed directly by looking at their behavior in the economy. Both states are different,with the crisis state having higher fluctuating values than the tranquil state (normal time). The
transfer of values from one state to another state depends on transition probability. In accordance
with the characteristics of Markov, the value of which will come in a state will depend on thecurrent state. Thus, this model allows for the possibility of a state in crisis that can remain in a
state of crisis.
The second advantage of the Markov switching model allows the use of a continuousdependent variable.The use of third-party funds or change the index to avoid the loss of
information when data is transformed in the form of dummy variable. The third advantage of
this model is its use to capture dynamic information of the crisis. Thus, this model can interpretthe trend duration of the crisis period and the transition probabilities. The fourth advantage is
the model can be used for non-linear behavior.
The use of Markov-Switching to detect exchange crisis and a banking crisis in recent
years has increasingly developed because of the growing occurrence of flaws in the signalapproach, i.e. the determination of the arbitrary threshold of crisis. Abiad (2003) using a Markov-
Switching approach examined early warning systems for possible exchange rate crisis in Asia.Based on these studies it was found that this model works well in detecting the exchange rate
crisis in Asia. The model was able to detect two-thirds of the crisis period in the sample and
resulted in fewer the false signals compared to the signal approach model. Research by Alvarez-Plata and Schrooten (2003) and Ho (2004) also produced good results (robust) using the model
in detecting the exchange rate crisis in Argentina and Asia, respectively.
Meanwhile, the use of Markov-Switching models applied to banking crisis using aggregate
data was done by Ho (2004). The results showed that the model can detect a banking crisis inAsia. For Research in Indonesia, Agung et. al. (2003) developed an Early Detection System for
predicting the exchange rate crisis and the banking crisis, by modifying the signal extraction
model of Kaminsky, Lizondo, and Reinhart (1999). Modifications include trying to capture theabnormal behavior of the indicators used, not individually, but by using aggregate index. This is
done since before the crisis indicators usually will move in the same direction. The variables
used are: macroeconomic indicators (real appreciation of the domestic currency, foreign exchangeM2/reserves) to predict the exchange rate crisis, and micro indicators of aggregate banking
(net interest margin) to predict the banking crisis. The results showed that the signals generated
from an early detection system showed relatively satisfactory results, i.e. the probability ofaccuracy of 67% and 90%, respectively.

8 Bulletin of Monetary Economics and Banking, July 2012
2.2. Development of the Banking Crisis
At first the crisis that hit the Indonesian economy since 1997 is mainly triggered by the exchange
rate. Pressure depreciation of the rupiah which is mainly derived from the contagion factor
from Thailand Baht exchange rate crisis in July 1997. Effect of contagion is not only Indonesiabut also struck quickly spread to other Asian countries, including the Philippines, Malaysia and
South Korea. In order to prevent the national economy from deeper crisis as a result of the
pressure of depreciation and capital outflow, the Government issued a package of economicpolicy in September 1997. Furthermore, the program expanded to stabilization and economic
reform program supported by the IMF, World Bank and ADB formally in November 1997. As a
manifestation of the implementation of the reform program in the financial sector in order tonourish the banking system, then on 1 November 1997 by 16 private banks were closed.
Closure of 16 banks led to bank runs on banks by the public perception quite unhealthy.
Bank closure policy is supposed to nourish national banks the opposite result in massive
withdrawals in banks and not the government. Massive withdrawal of funds is due the collapseof public confidence in the banking system due to the closure of the bank. The more widespread
bank runs are also due to the weak financial performance of the bank, such as an increase in
bad loans and declining rentability of the bank, due to business management that is not fullyfollow the healthy nature of corporate governance (Warjiyo, 2001 and Bank Indonesia, 19982).
In addition, the rapid depreciation of the rupiah resulted in ballooning bank debt denominatedin dollars. This condition is further aggravated the absence of the guarantee program. In the
midst of yet the presence and absence of a guarantee program information about the condition
of banks (asymmetric information), bank customers, particularly customers» private bank,withdraw the funds on a large scale and are expected to shift to healthier banks and into safer
assets (currency).
One month since the closure of 16 banks mentioned above (December 1997), the number
of third-party funds contained in the national private commercial banks (BUSN) decreased byRp 22.9 trillion (11.94%). Generally begin withdrawing funds from bank closures and the
withdrawal of the highest peak in December 1997 and January 1998. The recall was dropped
since the government guarantee (blanket guarantee) in January 1998. However, in the event ofsocial unrest in May 1998, the number of banks that experienced bank runs increased again.
Based on data from monthly reports (LBU) bank submitted to Bank Indonesia, massive
withdrawals (bank runs) more common in non-foreign BUSN3, frozen bank activities4 and frozenbank operations5. Peak mass recall on Non forex BUSN in December 1997, January 1998 and
May 1998. As an illustration, in December 1997, from 45 Non forex BUSN, 25 banks decreased
3 Annual Report of Bank Indonesia in 1997/1998.4 Non forex BUSN is not allowed to conduct foreign exchange transaction in their business activities.5 Frozen Bank operations (BBKU) is a bank whose business activities are suspended or are not allowed to conduct business activities
temporarily or period of time.
9Early Warning Indicators Study Of Bank Runs In Indonesia : Markov-switching Approach
third party funds up to 10%, 17 banks funding decreased by 20%, 13 banks has decreased by
40 funds, 11 funds a bank has decreased by 60%, and 6 banks of funds decreased to 80% ofthe total funds in the previous month.
As in non forex BUSN, bank runs occurred in banks with frozen business activities (BBKU)
and banks with frozen bank operations (BBO). Biggest withdrawal occurred in November 1997until January 1998, and March through May 1998. For example, in November 1998, from 40
BBKU banks decreased by 26 third-party funds up to 10% of the total deposits in the previous
month, 14 banks of funds decreased by 20% compared to the previous month»s total funding,and the two banks has decreased funding to 40% compared to the previous month. Bank runs
in BBO is also not much different from BBKU. In January 1998, out of 10 BBO, 6 banks of third-
party funds decreased to 20% and 4 banks decreased by 40%.
In the period November 1997 to January 1998, seven state banks no deposits decreasedby 10%. On the contrary, third-party funds to the government banks have increased by 9.6%
in November 1997. Withdrawal of funds from foreign banks is also not much different from
the government bank. In November 1997, only one bank that declined a third party fund.Meanwhile, in December 1997 to January 1998 there were no third-party withdrawals of less
than 10%. Even otherwise showed an increase of 6.8% in November 1997.
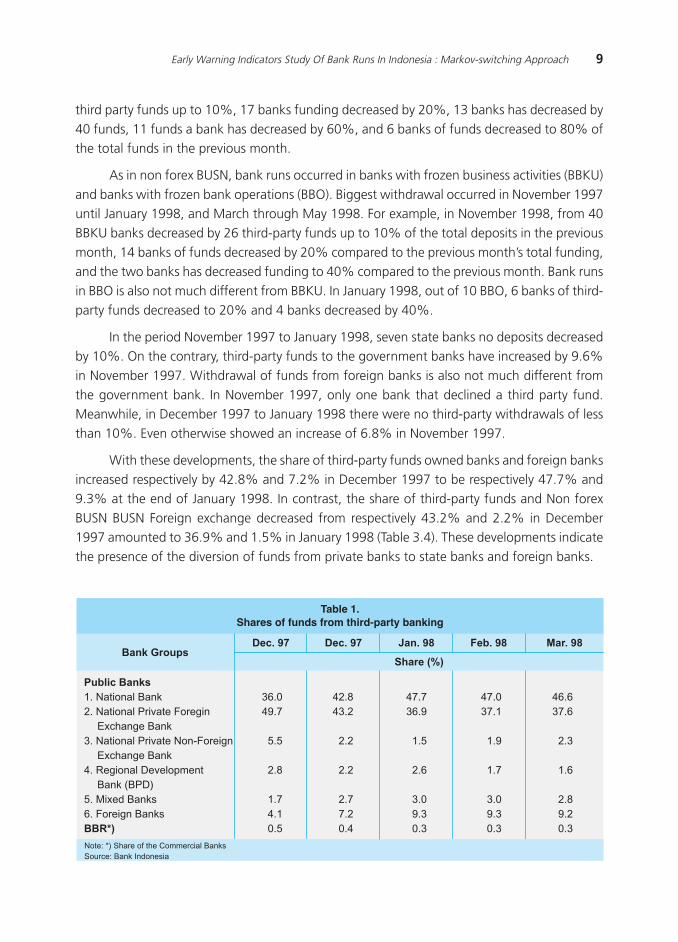
With these developments, the share of third-party funds owned banks and foreign banksincreased respectively by 42.8% and 7.2% in December 1997 to be respectively 47.7% and
9.3% at the end of January 1998. In contrast, the share of third-party funds and Non forex
BUSN BUSN Foreign exchange decreased from respectively 43.2% and 2.2% in December1997 amounted to 36.9% and 1.5% in January 1998 (Table 3.4). These developments indicate
the presence of the diversion of funds from private banks to state banks and foreign banks.
Table 1.Shares of funds from third-party banking
Bank GroupsShare (%)
Dec. 97 Dec. 97 Jan. 98 Feb. 98
Public Banks
1. National Bank
2. National Private Foregin
Exchange Bank
3. National Private Non-Foreign
Exchange Bank
4. Regional Development
Bank (BPD)
5. Mixed Banks
6. Foreign Banks
BBR*)
36.0
49.7
5.5
2.8
1.7
4.1
0.5
Note: *) Share of the Commercial Banks
Source: Bank Indonesia
Mar. 98
42.8
43.2
2.2
2.2
2.7
7.2
0.4
47.7
36.9
1.5
2.6
3.0
9.3
0.3
47.0
37.1
1.9
1.7
3.0
9.3
0.3
46.6
37.6
2.3
1.6
2.8
9.2
0.3

10 Bulletin of Monetary Economics and Banking, July 2012
In addition to third-party transfer of funds to banks categorized as healthy (flight to
quality), there is also a transfer of funds to the currency (currency), as reflected in the increaseof currency in January 1998 of 31.8% (U.S. $ 9.045 trillion) compared to the month before.
The increase was outside the normal pattern of demand for currency, which is based on data
two years prior to the crisis, the average currency growth of 9.5% in just a idea.
The banking crisis further exacerbated by the depreciation of the rupiah is very large. In
January 1997, the rupiah against the U.S. dollar (U.S.) in the position of Rp 2396. The positionof the exchange rate continues to decline. In July 1997 the exchange rate was recorded in the
position of Rp 2599 per U.S. dollar, and in December 1997 to Rp 4650 per U.S. dollar. In 1998
the position of the exchange rate has decreased dramatically, reaching the position of Rp 10,525per U.S. dollar in May 1998 and continued to weaken to a peak in June 1998 in the position of
Rp 14,900 per U.S. dollar. From the position of the rupiah strengthened to begin in December
1998 in the position of Rp 8025 per U.S. dollar.
Withdrawal of bank funds on a large scale by the customer and the depreciation of the
rupiah exchange rate put pressure on bank balance (balance sheet). These conditions resulted
in the overall performance of the national banking system worsened. Banking performancedegradation occurs in all aspects of bank finance, which includes the capital, asset quality,
profitability, and liquidity. Performance capitalization (CAR) declined sharply since the crisis, as
reflected in the drop all the bank»s CAR of 9.19% at the end of December 1997 amounted to-15.68% at the end of December 1998. Similarly, the performance of asset quality (KAP),
which is measured from the ratio of earning assets classified as non-current assets by total
earning assets, increased from 4.80% at the end of 1997 amounted to 42.39% at the end of1998, before decreased to 12.74% at the end of 1999 as a result of the transfer of troubled
bank loans to IBRA.
Figure 1.Development of Currency and Exchange Rate
1 6 100
2000
4000
6000
8000
10000
12000
14000
16000
19961997 1998 1999 2000 2001 2002 2003 2004 2005 2006 2007 2008
-20.00
0.00
20.00
40.00
60.00
80.00
100.00Uang kartal di masyarakat
Nilai Tukar
Source : Adapted from Bank Indonesia
2 7 2 7 2 7 2 7 2 7 2 7 2 7 2 7 2 7 2 7 2 6 9

11Early Warning Indicators Study Of Bank Runs In Indonesia : Markov-switching Approach
In line with the worsening of KAP, the performance of profitability, as measured by the
ratio of income to average assets (ROA), decreased from 1.37% in 1997 to -18.76% in 1998and -6.14% in 1999 . Losses experienced by almost all the banks due to the high cost of funds
incurred bank, with one-month deposit rate reached 70% in September 1998. While on the
other side of KAP increased and decreased the number of loans in line with the economiccontraction (13.1% in 1998) and increased business risk due to social instability, political, and
security. In line with the decline in credit, the loan to deposit ratio (LDR) of the banks also fell
sharply by 86.42% at the end of 1997 amounted to 72.37% at the end of 1998 and onlyamounted to 26.16% at end of 1999.
III. METHODOLOGY
Markov Switching Models in this paper uses a latent variable that follows the first derivative of
the two-state markov pathways, ie st =1 is a crisis stateand st = 0is a state of calm (tranquilstate). Although in this model st not observed directly, the behavior of the dependent variable(yt) is free of st and denoted as follows:
(1)
Dependent variable (yt) is used as an early warning indicator of bank runs is the percentage
change in third-party bank funds from 1990-2005. Thus the model of Markov-Switching (MS)
uses only univariate models. We choose the percentage change in bank third-party funds,
since bank runs by definition is a massive withdrawal of funds to third parties. The signal of apersistence decrease of third-party funds, it is known the occurrence of bank runs on a bank.
In MS the model, the average value (mean) and variance of ytcan be changed according
to the regime. The density of the conditional st can be formulated as follows:
Latent variable for regime switching, st, is obtained from the transition matrix probability Pt as
the following :
(2)for st = 0,1
.
-2

12 Bulletin of Monetary Economics and Banking, July 2012
where ppppptij is the possibility of displacement of stateiin period t-1 to state in period tand F is the
normal cumulative distribution function cdf component of the vector kx1and xt-1, the early
warning indicator that can affect the probability of transition (transition probabilities).
To run this model requires the initial value, i.e. p11 = Pr(s=1) which isan unconditional
probability to the result in state 1 for period 1. The treatment of these values depends on
whether or not xt is stationary. If x
t is stationary then the long-term probability p11 is s
1=1
and is
a function of (β0, β
1) In the meantime, if x
t is not stationary then p
11 is an additional parameter
that must be estimated. In practice, if time series data are long enough, the likelihood function
will not be affected whether performed by calculating the functions of (β0, β
1) separately or by
setting its value - it still does not make a difference.
Estimation procedure is used to maximize the likelihood function. The likelihood function
is calculated using iterations as shown by Hamilton (1990). By using the information availableup to periodt, we can form Pr(s
t = j l Ω
t ;Θ), the conditional probability (filtered) from observationi
which comes from the regime j, where j=1,2,ºN. N the state, which in this study used N=2.
Further more, the conditional probabilities are collected in a vector (Nx1) ξtlt.
Predictions can also be done through a conditional probability (forecast) regimej for periodt+1 with information until the period t, which can be denoted Pr(s
t+1 = j l Ω
t ;Θ), for j=1,2,ºN.
Estimation of probabilities is collected in a vector (Nx1) ξt+1lt. Lastly,
tη denoted as a vector (Nx1)
with components that have as many as j is a conditional density function of equation (2).Probability has been filtered and calculated for each period t by iteration of the following
equations:
(3)
Period t
State 0 State 1
Peri
od t-
1
State 0
State 1
(4)
(5)
13Early Warning Indicators Study Of Bank Runs In Indonesia : Markov-switching Approach
where PPPPPt is the matrix size NxN of the transition probabilities of the period t-1 until period t as
expressed in the equation (4) ando is the notation multiplication of each element. Equation (5)calculated by Pr(st = j l Wt ;Q) is the joint distribution ratio f (yt , st = j l Wt ;Q) for the marginal
distribution f (yt = j l Wt ;Q). Marginal distribution is obtained by summing the joint distribution
of the two states. Equation (5) suggests that the best estimate available for the time of thecurrent state position, we simply multiply the transformation matrix P of the transition
probabilities to obtain estimates of the probability of each state in the next period.
IV. RESULTS AND ANALYSIS
As outlined in the section 4, to calculate the probability of transition from quiet state (tranquil)to states of bank runs the Markov-Switching model (MS) is used with auto regressive approach,using the estimation process of equation (6) to equation (41). A variable was used to estimate
the percentage change in third party funds individual banks (y). To ensure the data is stationary,
smoothing of the data will be done by the Kalman filter method. Testing the validity of the MSmodels as an early indicator of bank runs were performed on each individual bank types by
comparing the actual occurrence of bank runs.
a. National Bank (NB)
Signal the occurrence of bank runs on the model of Markov-Switching (MS) seen from thevalues of the transition probabilities of a quiet state (no bank runs) to a state where bank runsoccur. A probability value greater than 0.5 means the possibility of a bank run is greater than
50% and a value of 1 means the possibility of bank runs to reach 100%. Conversely, if thevalue is 0, then the possibility of bank runs 0%. MS model results to the government banks
showed very infrequent signals found in bank bank runs (Table 2). Reflecting the value of the
transition probabilities from a quiet state to a bank run state occurs in almost every month justby 0. Of the 147 months observed at each individual bank there were only 16 months for the
incidence of bank runs as indicated by BP1, BP2 for 7 months, 5 months to BP3, BP4 and 4
months to 5 months to BP5, with a probability value in the range 0.7 to 1. However, the bankrun signals were not persistent (continuous), as reflected in the declining value of the transition
probability occurrence of bank runs ranging 0.7 to 1 then to 0 in the following months.
Meanwhile, in the banking crisis period 1997-1998, the model MS did not find a signal
for bank runs for government banks as reflected in the value of the transition probabilities froma quiet state to a bank run state at 0 for the period. In test results on real events particularly in
the period 1997-1998, the models of MS was accurate for detecting bank runs. From the
observation period (January 1988-March 2000) of the five state-owned banks, only 6 months(0.82%) gives a wrong signal for bank runs (type 2 error)6.

14 Bulletin of Monetary Economics and Banking, July 2012
b. Private Banks - Foreign Exchange (PBFX)
Based on the analysis of 26 private banks, foreign exchange (PBFX) using a model of MSsuggested that bank runs were visible signals at seven banks (Table 3). This was reflected in the
value of the transition probabilities from quiet state to bank run state on each of the banks in
the range of 0.8 to 1 and the figure is likely persistent in a few months. Based on the study of
6 Frozen Bank operations (BBO) is a bank temporarily suspended its operations. Signal size is correct for banks experiencing bank runsand banks facing liquidity problems due to the withdrawal of clients. Value of 0.82% of the total signal obtained one month dividedby the total in 5 bank, which is 6 divided by 735.
Table 2.Markov-Switching Results
No Bank Months of Bank Runs Signals
1 NB1
2 NB2
3 NB3
4 NB4
5 NB5
Apr, May, Aug & Nov-88, Jan, Apr, Jul, Aug & Oct-89, Jan, Apr, Jul & Aug-90,
Feb & Mar-91, Sept-94
Apr & Dec-91, Oct Nov 92, Dec-99, Jan & Feb-00
Mar & Apr-91, Oct, Nov & Dec-99
Mar, Apr & Dec-91, Sept-94
Aug-89, Mar, Apr, May & Jul-90
Table 3.Markov-Switching Results for Private Bank Foreign Exchange
No Bank Months of Bank Runs
1 PBFX5
2 PBFX10
3 PBFX19
4 PBFX22
5 PBFX23
6 PBFX24
7 PBFX26
Aug-90, Sep-91, Aug, Sep & Dec97, Jan, Feb & Mar-98, Aug & Dec-00,
Nov & Dec-00, Jan, May, Jul & Aug-02, Aug-03, Sep-04
Aug-90, Jun, Jul, Nov & Dec-92, Jan-93, Oct & Nop-97, Jan, Feb & Mar-98,
Feb, Sep, Oct, Nov & Dec-99, Feb, Mar, Apr, May, Jun & Jul-00, Jan, Aug,
Sep & Oct-01, Aug-02, Aug-03
Dec-88, Oct-89, Jan, Feb & Sep-90, Nov & Dec-97, Jan, Mar Apr, Jun, Jul &
Aug-88, Mar, Apr Jun, Jul & Aug-99, Apr & May-00, Jul & Oct-02, Jan, Apr,
Jun & Aug-03, Dec-04, Jan & Nov-05
Oct-95, Aug & Sep-98, Mar, Jun & Jul-99, Sep & Nov-02, Feb, Mar, Aug, Oct
& Nov-03, Jan, Apr, May, Nov & Dec-04
Dec-97, Jan, May, Jun, Jul, Sep & Nov-98, Jan, Feb, Mar, Apr, Jul, Aug, Oct &
Dec-99, Jan, Feb, Mar & Apr-00, Nov & Dec-02,May & Aug-03, Nov-05
Feb, Apr, Jun, Aug & Oct-91, Sep & Dec-92, Mar-93, Feb, Mar, Apr, Jun, Jul
& Aug-98, Jul-00, Aug & Sep-02, Jan-Oct & Nov-05
Sep-88, Oct & Nov-92, Jan, Apr & Jun93, Jul-96, Jun & Jul-98, Mar, Jul &
Aug-99, Jan, Jul, Aug, Oct, Nov & Dec-03, Feb-05
15Early Warning Indicators Study Of Bank Runs In Indonesia : Markov-switching Approach
actual events especially during the banking crisis of 1997-1998, the seven banks suffered bank
runs. In the period before and after 1997-1998, the seven banks also often showed signs ofbank runs with the transition probability value for bank runs in the range of 0.7 to 1.
Meanwhile, the MS also showed that there were 12 banks that never showed signs of
bank runs, as reflected in the value of the transition probability of 0. PBFX signaled a bank runonly a few times, but the signal was not persistent for a few months. From a total of 216
months (January 1988 - December 2005) and 26 banks, found only 57 months of total (1.01%)
gave a wrong signal.
c. Private Banks- Non-Foreign Exchange (PBNFX)
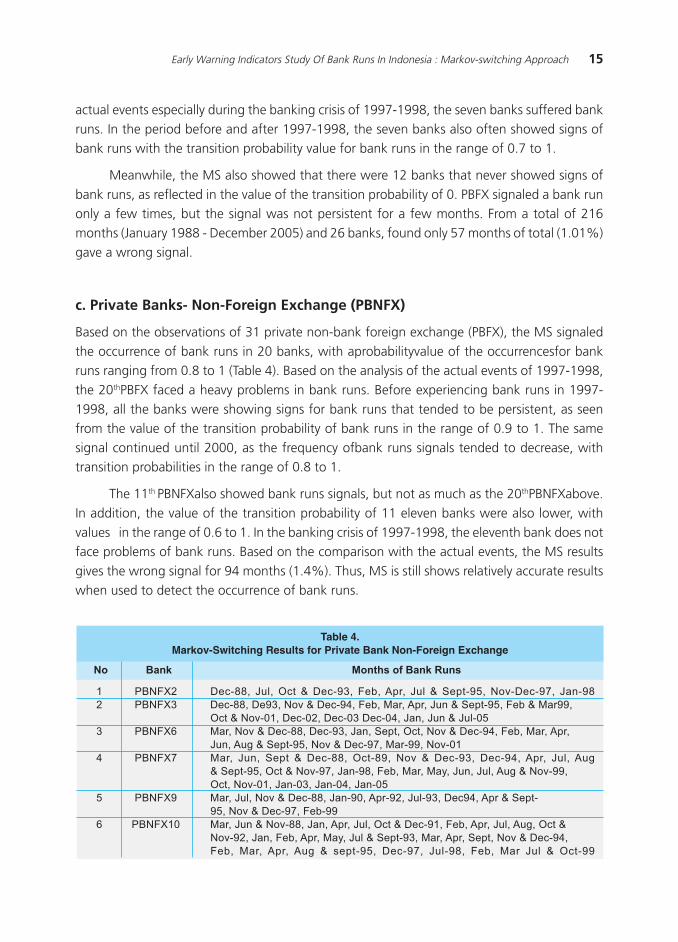
Based on the observations of 31 private non-bank foreign exchange (PBFX), the MS signaled
the occurrence of bank runs in 20 banks, with aprobabilityvalue of the occurrencesfor bankruns ranging from 0.8 to 1 (Table 4). Based on the analysis of the actual events of 1997-1998,
the 20thPBFX faced a heavy problems in bank runs. Before experiencing bank runs in 1997-
1998, all the banks were showing signs for bank runs that tended to be persistent, as seenfrom the value of the transition probability of bank runs in the range of 0.9 to 1. The same
signal continued until 2000, as the frequency ofbank runs signals tended to decrease, withtransition probabilities in the range of 0.8 to 1.
The 11th PBNFXalso showed bank runs signals, but not as much as the 20thPBNFXabove.
In addition, the value of the transition probability of 11 eleven banks were also lower, with
values in the range of 0.6 to 1. In the banking crisis of 1997-1998, the eleventh bank does notface problems of bank runs. Based on the comparison with the actual events, the MS results
gives the wrong signal for 94 months (1.4%). Thus, MS is still shows relatively accurate results
when used to detect the occurrence of bank runs.
Table 4.Markov-Switching Results for Private Bank Non-Foreign Exchange
No Bank Months of Bank Runs
1 PBNFX2 Dec-88, Jul, Oct & Dec-93, Feb, Apr, Jul & Sept-95, Nov-Dec-97, Jan-98
2 PBNFX3 Dec-88, De93, Nov & Dec-94, Feb, Mar, Apr, Jun & Sept-95, Feb & Mar99,
Oct & Nov-01, Dec-02, Dec-03 Dec-04, Jan, Jun & Jul-05
3 PBNFX6 Mar, Nov & Dec-88, Dec-93, Jan, Sept, Oct, Nov & Dec-94, Feb, Mar, Apr,
Jun, Aug & Sept-95, Nov & Dec-97, Mar-99, Nov-01
4 PBNFX7 Mar, Jun, Sept & Dec-88, Oct-89, Nov & Dec-93, Dec-94, Apr, Jul, Aug
& Sept-95, Oct & Nov-97, Jan-98, Feb, Mar, May, Jun, Jul, Aug & Nov-99,
Oct, Nov-01, Jan-03, Jan-04, Jan-05
5 PBNFX9 Mar, Jul, Nov & Dec-88, Jan-90, Apr-92, Jul-93, Dec94, Apr & Sept-
95, Nov & Dec-97, Feb-99
6 PBNFX10 Mar, Jun & Nov-88, Jan, Apr, Jul, Oct & Dec-91, Feb, Apr, Jul, Aug, Oct &
Nov-92, Jan, Feb, Apr, May, Jul & Sept-93, Mar, Apr, Sept, Nov & Dec-94,
Feb, Mar, Apr, Aug & sept-95, Dec-97, Jul-98, Feb, Mar Jul & Oct-99

16 Bulletin of Monetary Economics and Banking, July 2012
d. Foreign Banks (FB)
Markov-Switching(MS) results showed that there were 4 of 6 foreign banks observed frequentlyshowing signs of bank runs with a transition probability value from quiet state to bank runs
state in the range of 0.6 to 1 (Table 5). In the period of the banking crisis in 1997/1998, the MS
model showed the four banks experiencing bank runs. Meanwhile, two other banks nevergave signals for bank runs, which was reflected by the transition probability values for bank
runs at 0. Actual events showed that the two banks were never subjected to bank runs.
No Bank Months of Bank Runs
7 PBNFX11 Aug, Sept & Oct-88, Jan, Aug & nov-91, Apr, May, Jun, Jul, Aug, Sept & Dec-
92, Feb, Apr, May, Jul, Nov & Dec-93, May, Jul, Sept, Oct & Dec-94, Feb,
Apr, Jun & Sept-95, Feb, Apr, May Jun, Jul, Nov & Dec-96, Jul, Sept & Nov-
97, May, Jun, Aug, Sep, Oct & Dec-99, Jun-00
8 PBNFX14 Dec-91, Dec-93, Feb, Apr, Nov & Dec-94, Mar, Apr, Jul & Sept-95, Jan,
Aug, Sept, Nov & Dec-97, Apr, May, Jul Oct-98, Mar, Apr & May-99
9 PBNFX16 May & Jul-88, Jul, Nov & Dec-93, Jul, Sept & Oct-97, Dec-98, Jan, Mar,
Apr & May-99
10 PBNFX17 May-88, Nov-92, Feb, Jul, Sept & Dec-93, Mar, Apr, Jun & Dec94, Feb,
Mar, Apr, Jun & Sept-95, Aug, Sept & Oct-97, May, Aug, Sept, Oct & Dec-
98, Jan, Apr, May, Aug & Oct-99, Jan, Feb, Mar, May-00
11 PBNFX18 Jun, Jul, Oct & Nov-88, Jan-92, Jun, Jul, Sept, Nov & Dec-93, Nov & Dec-94,
Mar, Apr & Sept-95, Jan, Mar, Jun, Aug, Oct & Nov-98, Jan, Feb & Mar-99
12 PBNFX19 May, Jul, Sept & Nop-88, Jan, Apr & May-92, Jan, Feb, Jul, Sep, Oct & Dec-
93, Jan, Feb, Mar, Apr, Jul, Aug, Sept & Dec-94, Feb, Jun, Jul & Sept-95, Mar,
Apr, Jul, Sept Nov-96, Jan, Feb, Apr, Jul, Aug, Sept, Oct & Nov-97, Mar, Apr,
Jun, Sept, Oct & Nov-98, Jan, Apr Sept & Oct-99, Feb & Jul-00
13 PBNFX20 Jul & Aug-88, Jan, Apr, Jul & Aug92, Feb, Apr, Jul, Aug & Dec-93, Mar, Apr,
May, Jul, Sept & Dec-94, Mar, Apr & Sept-95, Mar & Nop-96, Jan, May, Jun,
Jul & Oct97, Jan, Jun, Jul, Aug, Sept, Oct & Nov-98, Jan, Feb, Mar, Jul, Sept
& Oct-99
14 PBNFX21 Mar, May, Jul, Oct & Nov-88, Oct-92, Mar & Dec-93, Nov & Dec94, Apr, Jul &
Sept-95, Dec-97, Jan-98, Feb-99, Jul-00
15 PBNFX22 Mar & Jul-88, Jan, Jul, Sept & Dec-93, Mar, May, Jul, Aug & Dec-94, Mar, Apr,
Jun, Jul, Aug, Sept, Nov & Dec-95, Mar, May, Jun, Jul, Oct & Dec-96, May, Oct
& Nov-97, Mar, May, Aug, Nov & Dec-98, Jan, Mar, May, Jun, Jul, Sept & Dec99,
Jan, Feb & Mar-00
16 PBNFX25 Mar, May & Jun-88, Oct & Dec-93, Oct & Dec-94, Jan, Apr, Jul & Sept-95, Oct
& Nov-97, Jan, May, Jul, Aug, Sep, Oct & Dec-98, Apr & Jul99
17 PBNFX26 Sep & Nop88, Jan, Jul & Dec-93, Mar, Aug, Oct & Dec-94, Jan, Apr, Sept &
Dec-95, Mar-96, Feb, Oct & Nov-97, Jan, May, Jun & Aug-98, Jan, Mar, Jul
& Dec-99, Feb, Mar, May & Jun-00
18 PBNFX27 Jul & Sept-98, Jan & Jul-93, Apr & Dec-94, Apr, Sept & Nov-95, Jan, Feb, Apr,
May, Jun, Jul, Sept, Oct, Nov & Dec-96, Sept & Dec-97, Jan, May, Jul, Sept &
Dec-98, Feb, Mar, Apr, May, Aug, Nov & Dec99, Jul-00
19 PBNFX29: May, Jun, Jul & Nov-88, Mar, Jun, Aug, Nov & Dec-94, Feb, Apr, Jul, Aug &
Sept-95, Aug, Sept, Oct & Nov-97, Apr, May, Aug, Sept Nov-98, Feb, Mar,
May, Jun, Jul, Sept & Oct-99, Mar-00
20 PBNFX31: Apr, Jul & Dec-94, Mar, Apr, Sept, Nov & Dec-95, Jan, Apr, May, Aug, Oct &
Nov-96, Feb, Apr, Aug, Nov & Dec-97, Jun, Aug, Oct Dec-98, Jan, Apr, May &
Aug-99, Feb, Mar & Jun-00

17Early Warning Indicators Study Of Bank Runs In Indonesia : Markov-switching Approach
On a whole, for the period January 1988 to December 2005, the observed data for the
MS gave an incorrect signal totaling 27 months or 2.08% of the total of 6 banks over 216months observed. Thus, the signal from the MS model in foreign banks is sufficiently accurate
to monitor the possibility of a bank run on one bank.
Table 5.Markov-Switching Results for Foreign Banks
No Bank Months of Bank Runs
Jan, Apr, May, Sept & Dec-90, Jan, Feb, Mar, Jun & Jul-91, Jul & Sept-97,Jun,
Jul, Aug & Sept-98, Jan, Aug, Sept & Oct-02, Jan, Feb & May 03, Jan, Mar, Apr,
Aug & Nop-04, Feb, Jun, Jul & Aug-05
Feb, May, Sep, Oct & Nop-89, Jan, Mar, Apr, Jun, Jul, Aug & Oct-90, Jan, Apr,
Aug, Sept & Nop-93, Jan, Apr, Aug, Sept & Nop-93, Feb, Mar, Apr, Jul, Oct & Dec-
95, Jan Feb, Mar, Apr & Aug 96, Jan, Mar, Apr, Jun, Jul, Aug & Oct-97, Feb, Jul,
Aug, Sept & Nop-98, Feb, May, Jun & Aug-00, Jan, Feb, Mar, Jun, Jul, Aug, Oct &
Dec-01, Jan, Feb, Mar, Apr, Jul, Aug, Oct-02, Apr, May & Jul-03, Jan, Feb, Mar,
Apr, Jun, Sep & Oct-04, Jan, Feb, Mar, Apr & Aug-05
Apr, Jul & Dec-93, Feb, Mar, May, Jun, Sept, Oct & Nov-94, Jan, Mar, Apr, Apr,
Jul, Aug & Oct-95, Feb, Mar, May, Jun & Aug-96, Feb, Aug, Sept, Oct-97, Apr,
Jun, Jul, Aug, Sept, Oct & Dec-98, Jun-99, Feb-02, Jul, Sept & Oct-04, Jan, Jun
& Jul-05
Jun, Aug, Oct & Dec-89, Jan, Apr, May, Jun & Aug-90, May, Aug, Oct & Dec-93,
Feb & Mar-94, Jul, Oct & Dec-95, Feb & Mar-96, Jun & Oct-97, Apr, Jun, Jul &
Aug-98, May, Jun & Aug-05
FB1
FB2
FB3
FB4
1
2
3
4
e. Mixed Banks (MB)
MS results of the observed signalsfor a mix of nine banks (MB) indicated the occurrence of
banking crisis bank runs in the period 1997-1998, with a transition probability value of 1,
which means 100% like lihood of bank runs. These results are consistent with the actual events,where the 9 banks suffered the occurrence of bank runs. Meanwhile, judging from the frequent
occurrence of bank run signals, there were 4 banks that were experiencing bank runs (Table 6)
with a probability occurrence value of ranging from 0.7 to 1.
The comparison of results that actually produced the wrong signal was as much as 18
months or 0.93% of the total banks and months observed. MS results from the mix of banks
also indicated that the model is accurate enough to use MS as an early warning indicator forthe occurrence of bank runs on each individual bank.

18 Bulletin of Monetary Economics and Banking, July 2012
f. Banks with Frozen Business Activity (BFBA)
Of eight frozen bank business models analyzed with MS, only two did not show signs ofbanking crisis bank runs in the period 1997-1998, while five other banks showed signs bank
runs (Table 7), with transition probabilities values for bank runs occurring in the range of 0.9 to
1. Bank run signals often occured in BFBA 2 and 3, with the transition probabilities value for thebank run in the range of 0.9 to 1. This condition is consistent with the actual events in which
bank runs occurred in the period.
Table 6.Markov-Switching Results for Mixed Banks
No Bank Months of Bank Runs
Apr, Aug, Oct, Nov & Dec-90, Feb, Mar, Apr, May, Aug, Sept & Nov-91, Jan, Mar,
Jul, Aug & Oct-92, Jan, Feb, May, Jul, Aug & Oct-93, Jan, Mar, Apr, Jun, Jul, Aug
& Oct-94, Jan, Feb, Mar-95, Sep, Oct, Nov & Dec-96, Feb, Mar, Apr, May, Aug &
Nov-97, Feb, Mar, Apr, Jul, Oct, Nov & Dec-98, Jan, Feb, Apr, May & Aug99,
Sept-04, Jan, Feb, May-05
May, Aug & Nop90, Mar, Apr, May, Jul & Oct-91, Jan, Apr, May, Jun, Jul & Aug-
04, Aug, Sept & Nov-97, Feb, Apr, Jun, Jul & Sept-98
Dec-89, Jan, Apr, May, Jul, Aug, Oct, Nov Dec-90, Jan, Apr, May, Jun, Nov & Dec-
91, Jan, Apr, Jun, Aug & Oct-92, Jan, Apr, May, Jun, Jul, Oct & Dec-93, Mar,
Apr, Jul, Aug, Oct, Nov & Dec-94, Feb, Mar, Apr, Jun, Jul, Sept, Oct & Dec-95, Jan,
Mar, Apr, jul, Aug & Dec-96, Feb, Jul, Sept & Oct97, Jan, Mar, Apr, May, Jul, Sept,
Oct, Nov & Dec-97, Feb, Mar, Apr, Jun, Jul & Dec-99, Feb, Mar, Jun, Jul, Aug &Dec-00, Jan-01
Jul & Oct-90, Jan, Apr, May, Jun, Aug & Nov-91, Jan, Sept & Oct-92, Jan, Feb,
Mar, Apr, May, Jun, Jul, Aug, Sept & Oct-93, Mar, Apr & May-94, Apr, Jun, Aug,
Oct, Nov & Dec-95, Jan, Mar, May, Jun, Sept, Oct & Nov-96, Jan, Mar, May, Jun,
Sep, Oct & Nov-97, Apr, Jun, Jul, Oct & Nov-98,Mar, Jun, Aug-99, Mar, May, Jul
& Aug-03, Jan, Mar, Apr & Dec-04, Apr, Jun & Jul-05
MB2
MB5
MB6
MB7
1
2
3
4
Table 7.Markov-Switching Results for Banks with Frozen Business Activity
No Bank Months of Bank Runs
1 BFBA1 Aug -89
2 BFBA2 Aug & Oct-89, Jan, Jul, Aug & Nop-90, Jan, Feb, Apr, Jul, Aug & Oct-91,
Dec-92, Jan, Jul & Aug-93, Jan-94, Oct, Nov & Dec-98
3 BFBA3 Mar & Nop-88, Jul & Aug-90, Jul, Aug & Dec-91, Oct, Nov & Dec-92, Nov 98
4 BFBA4 Nov-88, Jul & Aug-90, Nov & Dec-92, Dec-93, Dec-98
5 BFBA5 Aug-89, Sep-92, Dec-93, Sep & Oct-94, Feb, Apr & Jun-96
6 BFBA6 Oct, Nov & Dec-88, Jan & Oct-89, Dec-98
7 BFBA7 Mar, May, Jun, Aug, Sep, Oct, Nov & Dec-98
8 BFBA8 Apr, May, Sep, Oct, Nov & Dec-98

19Early Warning Indicators Study Of Bank Runs In Indonesia : Markov-switching Approach
Comparison of actual events based on the full sample, showed there were 12 months or
0.69% incidence of total observations with the wrong signal for the bank run scene. The errorsignal occured in four banks. By looking at the small difference in the error between the actual
results with the incidence of MS, the MS model can be used as an indicator to detect bank runs
in troubled banks and individual indicator for the supervision of other banks.
g. Bankswith Frozen Operations (BFO)
MS results revealed that of the seven banks withfrozen operations (BFO), six banks showed astrong signal for the occurrence of banking crisis bank runs in the period 1997-1998, as reflected
in the transition probability value of 1 for bank runs. The 6th BBO also often signaled bank runs
before the crisis (Table 8). One other bank (BFO6) had only signaled the occurrence of bankruns in 1993.
Test results on real events indicate that the MS is able to explain the phenomenon of
bank runs on the frozen banks operating in Indonesia for the period 1997-1998. From the
overall observation results, only 19 wrong signals occurred or 1.26% of the total observations.
Table 8.Markov-Switching Results for Banks with Frozen
No Bank Months of Bank Runs
Aug, Oct & Nop-88, Jul & Aug-89, Dec-97, Jan, Apr, May & Jun-98
Aug & Nop-89, Feb-93, Nov & Dec97, Jan, Feb, Mar, Apr, May & Jun-98
Aug & Nov-88, Aug & Dec-89, May & Aug 90, Sep, Oct & Dec-97
Aug-90, Jan, Feb & Apr-91, Jun-92, Dec-94, Dec-97, Jan-98
Dec-92, Aug, Sep, Oct & Dec-97, Feb, Mar & Jun-92, Aug, Sep, Oct & Dec-97, Jan-98
Feb, Mar & Jun-93
Apr, Sept, Oct & Nov-92, Jan, Apr, Oct & Nov-93, Jan, Feb, May, Aug & Nov-94,
Feb, Sep & Dec-95, Feb-96, Jan, Apr, Aug Sept, Oct & Dec-97, Jan-98
BFO1
BFO2
BFO3
BFO4
BFO5
BFO6
BFO7
1
2
3
4
5
6
7
V. CONCLUSON
M arkov-Switching model results (MS) showed that MS models produce results that are robust
as early warning indicators of bank runs. Reflecting the results of tests on real events in 102banks that showed the MS only gives a wrong signal in the range of 0.69% to 2.08%.
The results of early indicators for bank runs with MS models indicate that banks are
experiencing bank runs or banks are in troublewhen the MS produces a persistent signal forbank runs. Monthly scenarios can be developed to derive a daily model to detect the possibility
of bank runs. In connection with this, it is suggested that the MS model be used to detect bank

20 Bulletin of Monetary Economics and Banking, July 2012
runs onindividual bank supervision cycles based onrisk-based supervision in Indonesia. Research
on early warning systems using the MS in the supervision cycle is parallel to the assessment ofthe risk profile of each individual bank, so the information on the early warning system can be
optimized together with other risk assessment of banks in preventing bank runs or other problems
that can harm the survival of a bank.

21Early Warning Indicators Study Of Bank Runs In Indonesia : Markov-switching Approach
Bank Indonesia, 1997 - 2007, Bank Indonesia Annual Report.
______, 2008, ≈Indonesian Financial System: 10 years after crisis.∆ DPNP Bank Indonesia working
paper.Beck, Thorsten; Demirguc-Kunt, Asli dan Levine, Ross. ≈Bank Concentration and Crises.∆ NBER
Working Paper Series, WP No. 9921, Agustus 2003.
Bryant, John. ≈Bank Collapse and Depression∆ Journal of Money, Credit and Banking, Vol. 13,No. 4 (Nov., 1981), pp. 454-464.
Calomiris, Charles W. ≈Bank Failures in Theory and History: The Great Depression and Other
«Contagious» Events.∆ NBER Working Paper Series, No. WP 13597, November 2007.Caprio, Gerrar, James A. Hanson dan Robert E. Litan. Financial Crises: Lessons from the Past,
Preparation for the Future. Brookings Institution Press, Washington, D.C. 2005.
Catalan, Mario. ≈Endogenous Bank Runs.∆ UCLA, Oktober 2000.Demirguc-Kunt, Asli dan Detragiache, Enrica, 1999, ≈Monitoring Banking Sector Fragility: A
Multivariate Logit Approach.∆ IMF Working Paper, No. WP/99/147, Oktober.
______, 2005, ≈Cross-Country Empirical Studies of Systemic Bank Distress: A Survey.∆ Maret.Diamond, Douglas W. ≈Debt Maturity Structure and Liquidity Risk.∆ The Quaterly Journal of
Economics, August 1991, 106(3), pp. 709-737.
______, dan Philip H. Dybvig, ≈Bank Runs, Deposit Insurance, and Liquidity.∆ Journal of PoliticalEconomy, June 1983, 91(3), pp. 401-419.
______, dan Raghuram G Rajan. ≈Liquidity Shortages and Banking Crises.∆ NBER Working
Paper Series, WP No. 10071, Oktober 2003.Eichengreen, Barry dan Arteta C., 2000, ≈Banking Crises in Emerging Markets: Presumptions
and Evidence∆. Centre for International Development and Economics Research Working
Paper, C00-115, August.Freixas, Xavier dan Jean-Charles Rochet. ≈Microeconomics of Banking∆. The MIT Press, 2002.
Freixas, Xavier, Bruno M. Parigi, dan Jean-Charles Rochet. ≈Systemic Risk, Interbank Relations,
and Liquidity Provision by the Central Bank∆ Journal of Money, Credit and Banking, Vol. 32,No. 3, Part 2: What Should Central Banks Do? (Aug., 2000), pp. 611-638.
Frydl, Edward J. ≈The Length and Cost of Banking Crises.∆ IMF Working Paper, No. WP/99/30,
March 1999.Garcia-Herrero, Alicia. ≈Banking Crises in Latin America in the 1990s: Lessons from Argentina,
Paraguay, and Venezuela.∆ IMF Working Paper, No. WP/97/140, October 1997.
Ghysels, Eric, Robert E. McCulloch, and Ruey S. Tsay, ≈Bayesian Inference for Periodic Regime-Switching Models∆, Journal of Applied Econometrics, Vol. 13, No. 2 (Mar. √ Apr., 1998),
129-143.
REFERENCES

22 Bulletin of Monetary Economics and Banking, July 2012
Goldstein, Morris, dan Philip Turner.
≈Banking Crises in Emerging Economies: Origins and Policy Options∆ Bank for InternationalSettlements Economic Papers, No. 46 √ October 1996
Goldstein, Morris, Graciela L. Kaminsky, and Carmen M. Reinhart. Assessing Financial Vulnerability
: An Early Warning System for Emerging Markets. Institute for International Economics,Washington, DC. June 2000.
Gonzalez-Hermosillo, Brenda, 1999, ≈Determinants of Ex-Ante Banking System Distress: A
Macro-Micro Empirical Exploration of Some Recent Episodes.∆ IMF Working Paper, No. WP/99/33, March.
Gorton, G. ≈Banking Panics and Business Cycles∆, Oxford Economic Papers, 40, pp. 751-781,
1988.Hamilton, James D. ≈A New Approach to the Economic Analysis of Nonstationary Time Series
and the Business Cycle∆. Econometrica, Vol. 57, No. 2 (Mar., 1989), 357-384.
______, 1990, ≈Analysis of Time Series Subject to Changes in Regime∆. Journal of Econometrics45 , hal 39-70.
______. Time Series Analysis. Princeton University Press, Princeton, New Jersey, 1994.
______. dan R. Susmel. ≈Autoregressive Conditional Heteroscedasticity and Changes inRegime,∆Journal of Econometrics (64), 1994, pp.307-333.
Hanson, James A. ≈Postcrisis Challenges and Risks in East Asia and Latin America: Where TheyGo from Here?∆, dalam Financial Crises: Lessons form the Past, Preparation for the Future,
editors Gerrard Caprio, James A. Hanson, dan Robert E. Litan, 2005.
Hardy, Daniel C. And Ceyla Pazarba_ilu. ≈Leading Indicators of Banking Crises: Was AsiaDifferent?∆. IMF Working Paper, WP/98/91, 1998.
______. ≈Determinants and Leading Indicators of Banking Crises: Further Evidence.∆ IMF Staff
Papers, Vol. 46, 3 (September/Desember 1999), pp. 247-258.Ho, Thomas dan Saunders, Anthony. ≈A Catastrophe Model of Bank Failure.∆ The Journal of
Finance, Vol. 35, Issue 5 (Desember 1980), pp. 1189-1207.
Hoelscher, David S. And Marc Quintyn. ≈Managing Systemic Banking Crises∆, IMF OccasionalPaper No. 224, International Monetary Fund, Washington DC, 2003.
Honohan, Patrick. ≈Banking System Failures in Developing and Transition Countries: Diagnosis
and Prediction∆. BIS Working Papers, No. 39.______, dan Luc Laeven. Sistemic Financial Crises: Containment and Resolution. Cambridge
University Press, 2005.
Kaminsky, Graciela L.,1999, ≈Currency and Banking Crises: The Early Warnings of Distress.∆IMF Working Paper, No. WP/99/178, Desember.
______, and Carmen M. Reinhart, 1998, ≈Financial Crises in Asia and Latin America: Then and
Now∆ The American Economic Review, Vol. 88, No. 2, Papers and Proceedings of the Hundredand Tenth Annual Meeting of the American Economic Association (May), pp. 444-448.

23Early Warning Indicators Study Of Bank Runs In Indonesia : Markov-switching Approach
______, dan Reinhart, Carmen M., 1999, ≈The Twin Crises: The Causes of Banking and Balance-
Of-Payments Problems.∆ The American Economic Review, Vol. 89, No. 3 (Juni), pp. 473 √500.
Kaufman, George G., 1988, ≈Bank Runs: Causes, Benefits and Costs.∆ Cato Journal 2, no. 3
(Winter): 559-88.Kindleberger, C. P. Manias,1978, Panics and Crashes. Basic Books, New York.
Krolzig, Hans-Martin. Markov-Switching Vector Autoregressions: Modelling, Statistical Inference,
and Application to Business Cycle Analysis. Springer, 1997.Latter, Tony. ≈The Causes and Management of Banking Crises.∆ Handbooks in Central Banking,
No. 12, Bank of England, July 1997.
Lindgren, Carl-Johan, Garcia, Gillian, Garcia dan Saal, Matthew, 1996, I.∆Bank Soundness andMacroeconomic Policy.∆ IMF.
Meyer, Paul A. dan Pifer, Howard W. ≈Prediction of Bank Failures.∆ The Journal of Finance, Vol.
25, 4 (September 1970), hal. 853-868.Minsky, Hyman.
≈A Theory of System Fragility∆, dalam Edward Altman dan Arnold Sametz (ed.), Financial Crises:
Institutions and Markets in a Fragile Financial Environment, New York: Wiley-Interscience,1977.
Mishkin, Frederic S. ≈Understanding Financial Crises: A Developing Country Perspective.∆ NBERWorking Paper Series, No. WP 5600, Mei 1996.
______. The Economics of Money, Banking, and Financial Markets. Sixth Edition, 2001, Addison-
Wesley.Montes-Negret, Fernando dan Muller, Thomas. ≈Banking System Crises and Recovery in the
Transition Economies of Europe and Central Asia: An Overview.∆ in Caprio, Gerard; Hanson,
James A.; dan Litan, Robert A. Financial Crises: Lessons from the Past, Preparation for theFuture, 2005.
Nagayasu, Jun. ≈Currency Crisis and Contagion: Evidence from Exchange Rates and Sectoral
Stock Indices of the Philippines and Thailand∆ IMF Working Paper, WP/00/39.Norden, Simon Van, ≈Regime Switching as a Test for Exchange Rate Bubbles∆, Journal of Applied
Econometrics, Vol. 11, No. 3 (May √ Jun., 1996), 219-251.
Pangestu, Mari dan Habir, Manggi.≈The Boom, Bust, and Restructuring of Indonesian Banks.∆ IMF Working Paper, No. WP/02/66,
April 2002.
Peck, James, and Karl Shell.≈Bank Portfolio Restrictions and Equilibrium Bank Runs∆ Journal of Economic Literature, July
29,1999.
______. ≈Equilibrium Bank Runs∆ Journal of Political Economy, 2003, vol. 111, No. 1. TheUniversity of Chicago.

24 Bulletin of Monetary Economics and Banking, July 2012
Rigobon, Roberto. ≈On the Measurement of the International Propagation of Shocks: is the
Transmission Stable?∆ Journal of International Economics. 1 October 2002. Elsevier B.V.Summers, Lawrence H. ≈International Financial Crises: Causes, Prevention, and Cures∆ The
American Economic Review, Vol. 90, No.2, Papers and Proceedings of the One Hundred
Twelfth Annual Meeting of the American Economic Association (May, 2000), pp. 1-16.Sundararajan, V. And Tomas J.T. Balino (Edited). Banking Crises: Cases and Issues. International
Monetary Fund, 1998.
Warjiyo, Perry, 2001, ≈Bank Failure Management: The Case of Indonesia∆ APEC Policy Dialogueon Bank Failure Management Paper, Mexico, June 7-8.

25Early Warning Indicators Study Of Bank Runs In Indonesia : Markov-switching Approach
APPENDIX 1
This attachment describes the process of howthe estimated transition probabilities value
are used as early warning indicators (EWI) of bank runs in this paper. In principle, the model
estimates Markov-Switching (MS) using autoregressive models developed by Hamilton (1990).MS model estimation process is described as follows. As mentioned before the variable is used
as an early warning indicator is the monthly percentage change in third-party funds (yt). It is
assumed yt follows the autoreggresive model (3)7 with parameters that change from a quiet
state dengan (nobank runs) to a state of bank runs. For example, the auto reggresive model is
(6)
(7)
With.
This equation can be written in the form
(8)
where the parameters used in this equation are
(9)
The log likelihood function from the above equation is
(10)
(11)
7 Untuk mengetahui optimal lag dari autoregressive akan digunakan nilai AIC dan SBC.
The distribution function for this equation can be written as
26 Bulletin of Monetary Economics and Banking, July 2012
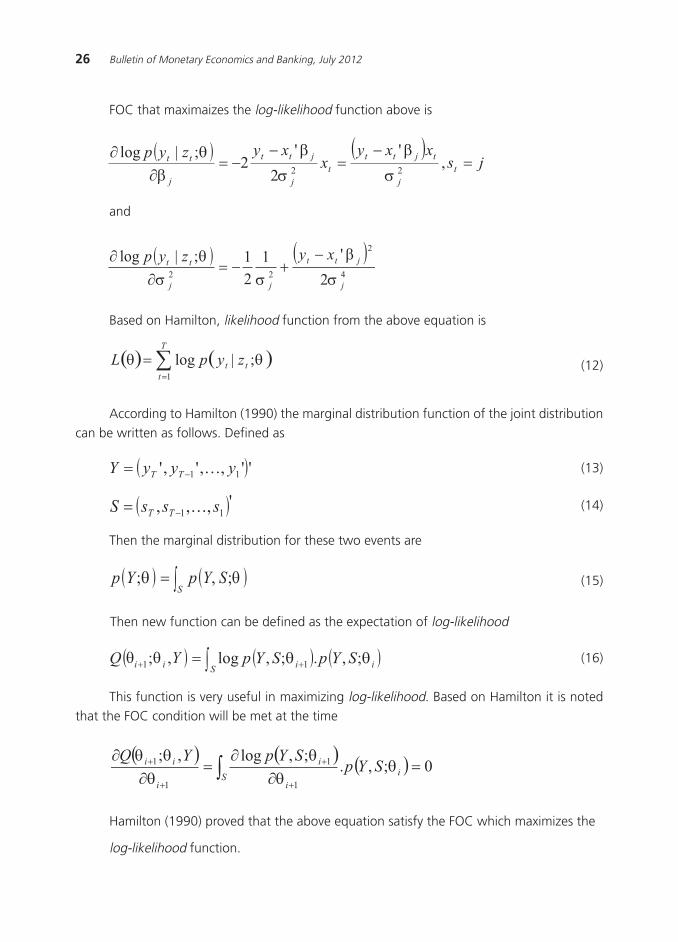
Based on Hamilton, likelihood function from the above equation is
FOC that maximaizes the log-likelihood function above is
and
(12)
According to Hamilton (1990) the marginal distribution function of the joint distribution
can be written as follows. Defined as
(13)
(14)
Then the marginal distribution for these two events are
(15)
Then new function can be defined as the expectation of log-likelihood
(16)
This function is very useful in maximizing log-likelihood. Based on Hamilton it is notedthat the FOC condition will be met at the time
Hamilton (1990) proved that the above equation satisfy the FOC which maximizes the
log-likelihood function.

27Early Warning Indicators Study Of Bank Runs In Indonesia : Markov-switching Approach
Thelog-likelihood function is maximized by defining the Lagrange function as follows
(17)
With this function will be obtained
(18)1.
(19)
This equation can be solved by
(20)
With
(21)
(22)
Multiplied by the divisor 0 then
2.

28 Bulletin of Monetary Economics and Banking, July 2012
If the equation is solved then we will get
3.
(23)
(24)
If the equation is solved, it will get
(25)
If simplified, the following is obtained
(26)
The sum for j = 1,2, ..., k, is then obtainedto get
(27)
Because. So its estimator can be written
According to Hamilton (1990) it can be proved that the following transition probabilitiessatisfy FOC. Then the transition probabilities can be shown by the following equation

29Early Warning Indicators Study Of Bank Runs In Indonesia : Markov-switching Approach
From Hamilton (1990) an algorithm is then used to estimate the parameters of the arbitraryinitial value.
(28)
(29)
(30)
(31)
(32)
(33)
(34)
taken from the previous value as the initial value ρso = p(so/yo). This value
is taken as the initial value of any parameter estimation.
For the case of a two-state markov change regime as used in this paper, the value of
the transition probability is calculated as follows.

30 Bulletin of Monetary Economics and Banking, July 2012
(35)
(36)
(37)
(38)
(39)
(40)
(41)

31Early Warning Indicators Study Of Bank Runs In Indonesia : Markov-switching Approach
Where is obtained from the transition matrix while from theequation of conditional distribution. The initial value used is . The same way can
also be used to for estimating the magnitude p22. The initial values used to estimate the magnitude
of the parameters are.

32 Bulletin of Monetary Economics and Banking, July 2012
APPENDIX 2Changes in Fund and Bank to Bank Run Ergodic Probability State
1. State Bank (BP)
Waktu (Bulan)Plot Ergodic Probability ke state-2
Plot Data Dana Pihak Ketiga
Gro
wth
Dan
a P
ihak
Ket
iga
Pro
bab
ility
Waktu (Bulan)
Waktu (Bulan)Plot Ergodic Probability ke state-2
Plot Data Dana Pihak Ketiga
Gro
wth
Dan
a P
ihak
Ket
iga
Pro
bab
ility
Waktu (Bulan)
Waktu (Bulan)Plot Ergodic Probability ke state-2
Plot Data Dana Pihak Ketiga
Gro
wth
Dan
a P
ihak
Ket
iga
Pro
bab
ility
Waktu (Bulan)
Waktu (Bulan)Plot Ergodic Probability ke state-2
Plot Data Dana Pihak Ketiga
Gro
wth
Dan
a P
ihak
Ket
iga
Pro
bab
ility
Waktu (Bulan)
Waktu (Bulan)Plot Ergodic Probability ke state-2
Plot Data Dana Pihak Ketiga
Gro
wth
Dan
a P
ihak
Ket
iga
Pro
bab
ility
Waktu (Bulan)

33Early Warning Indicators Study Of Bank Runs In Indonesia : Markov-switching Approach
2. Private Forex Bank (BSD)
Waktu (Bulan)Plot Ergodic Probability ke state-2
Plot Data Dana Pihak Ketiga
Gro
wth
Dan
a P
ihak
Ket
iga
Pro
bab
ility
Waktu (Bulan)
Waktu (Bulan)Plot Ergodic Probability ke state-2
Plot Data Dana Pihak Ketiga
Gro
wth
Dan
a P
ihak
Ket
iga
Pro
bab
ility
Waktu (Bulan)
Waktu (Bulan)Plot Ergodic Probability ke state-2
Plot Data Dana Pihak Ketiga
Gro
wth
Dan
a P
ihak
Ket
iga
Pro
bab
ility
Waktu (Bulan)
Waktu (Bulan)Plot Ergodic Probability ke state-2
Plot Data Dana Pihak Ketiga
Gro
wth
Dan
a P
ihak
Ket
iga
Pro
bab
ility
Waktu (Bulan)
Waktu (Bulan)Plot Ergodic Probability ke state-2
Plot Data Dana Pihak Ketiga
Gro
wth
Dan
a P
ihak
Ket
iga
Pro
bab
ility
Waktu (Bulan)
Waktu (Bulan)Plot Ergodic Probability ke state-2
Plot Data Dana Pihak Ketiga
Gro
wth
Dan
a P
ihak
Ket
iga
Pro
bab
ility
Waktu (Bulan)

34 Bulletin of Monetary Economics and Banking, July 2012
Waktu (Bulan)Plot Ergodic Probability ke state-2
Plot Data Dana Pihak Ketiga
Gro
wth
Dan
a P
ihak
Ket
iga
Pro
bab
ility
Waktu (Bulan)
Waktu (Bulan)Plot Ergodic Probability ke state-2
Plot Data Dana Pihak Ketiga
Gro
wth
Dan
a P
ihak
Ket
iga
Pro
bab
ility
Waktu (Bulan)
3. Pivate Non-Forex Bank (BSND)
Waktu (Bulan)Plot Ergodic Probability ke state-2
Plot Data Dana Pihak Ketiga
Gro
wth
Dan
a P
ihak
Ket
iga
Pro
bab
ility
Waktu (Bulan)
Waktu (Bulan)Plot Ergodic Probability ke state-2
Plot Data Dana Pihak Ketiga
Gro
wth
Dan
a P
ihak
Ket
iga
Pro
bab
ility
Waktu (Bulan)
Waktu (Bulan)Plot Ergodic Probability ke state-2
Plot Data Dana Pihak Ketiga
Gro
wth
Dan
a P
ihak
Ket
iga
Pro
bab
ility
Waktu (Bulan)
Waktu (Bulan)Plot Ergodic Probability ke state-2
Plot Data Dana Pihak Ketiga
Gro
wth
Dan
a P
ihak
Ket
iga
Pro
bab
ility
Waktu (Bulan)
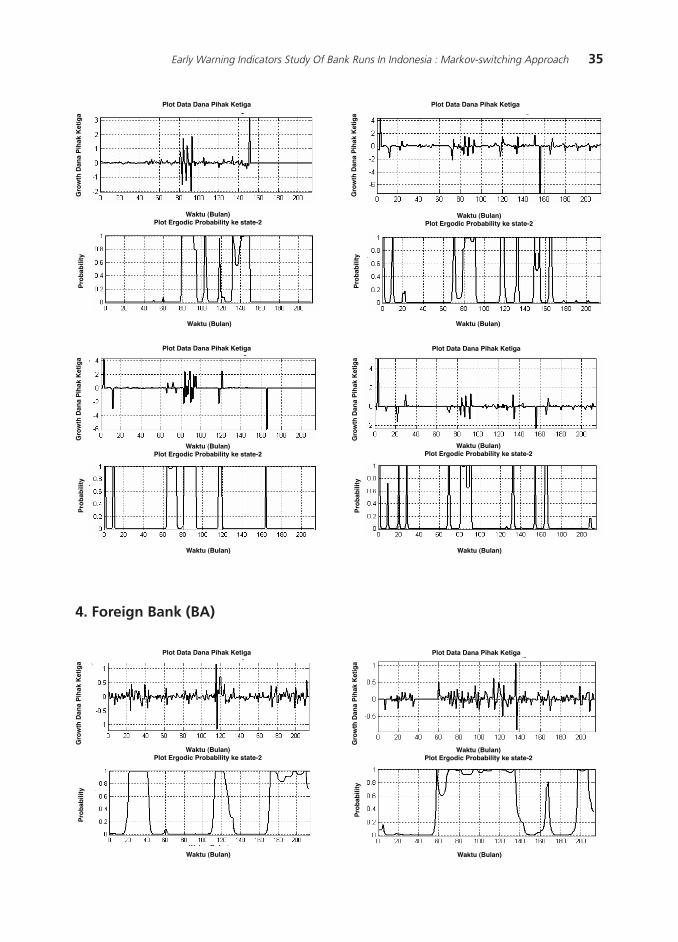
35Early Warning Indicators Study Of Bank Runs In Indonesia : Markov-switching Approach
Waktu (Bulan)Plot Ergodic Probability ke state-2
Plot Data Dana Pihak Ketiga
Gro
wth
Dan
a P
ihak
Ket
iga
Pro
bab
ility
Waktu (Bulan)
Waktu (Bulan)Plot Ergodic Probability ke state-2
Plot Data Dana Pihak Ketiga
Gro
wth
Dan
a P
ihak
Ket
iga
Pro
bab
ility
Waktu (Bulan)
Waktu (Bulan)Plot Ergodic Probability ke state-2
Plot Data Dana Pihak Ketiga
Gro
wth
Dan
a P
ihak
Ket
iga
Pro
bab
ility
Waktu (Bulan)
Waktu (Bulan)Plot Ergodic Probability ke state-2
Plot Data Dana Pihak KetigaG
row
th D
ana
Pih
ak K
etig
aP
rob
abili
ty
Waktu (Bulan)
4. Foreign Bank (BA)
Waktu (Bulan)Plot Ergodic Probability ke state-2
Plot Data Dana Pihak Ketiga
Gro
wth
Dan
a P
ihak
Ket
iga
Pro
bab
ility
Waktu (Bulan)
Waktu (Bulan)Plot Ergodic Probability ke state-2
Plot Data Dana Pihak Ketiga
Gro
wth
Dan
a P
ihak
Ket
iga
Pro
bab
ility
Waktu (Bulan)

36 Bulletin of Monetary Economics and Banking, July 2012
Waktu (Bulan)Plot Ergodic Probability ke state-2
Plot Data Dana Pihak Ketiga
Gro
wth
Dan
a P
ihak
Ket
iga
Pro
bab
ility
Waktu (Bulan)
Waktu (Bulan)Plot Ergodic Probability ke state-2
Plot Data Dana Pihak Ketiga
Gro
wth
Dan
a P
ihak
Ket
iga
Pro
bab
ility
Waktu (Bulan)
Waktu (Bulan)Plot Ergodic Probability ke state-2
Plot Data Dana Pihak Ketiga
Gro
wth
Dan
a P
ihak
Ket
iga
Pro
bab
ility
Waktu (Bulan)
Waktu (Bulan)Plot Ergodic Probability ke state-2
Plot Data Dana Pihak Ketiga G
row
th D
ana
Pih
ak K
etig
aP
rob
abili
ty
Waktu (Bulan)
5. Bank Campuran (BC)
Waktu (Bulan)Plot Ergodic Probability ke state-2
Plot Data Dana Pihak Ketiga
Gro
wth
Dan
a P
ihak
Ket
iga
Pro
bab
ility
Waktu (Bulan)
Waktu (Bulan)Plot Ergodic Probability ke state-2
Plot Data Dana Pihak Ketiga
Gro
wth
Dan
a P
ihak
Ket
iga
Pro
bab
ility
Waktu (Bulan)
5. Mix Bank (BC)

37Early Warning Indicators Study Of Bank Runs In Indonesia : Markov-switching Approach
Waktu (Bulan)Plot Ergodic Probability ke state-2
Plot Data Dana Pihak Ketiga
Gro
wth
Dan
a P
ihak
Ket
iga
Pro
bab
ility
Waktu (Bulan)
Waktu (Bulan)Plot Ergodic Probability ke state-2
Plot Data Dana Pihak Ketiga
Gro
wth
Dan
a P
ihak
Ket
iga
Pro
bab
ility
Waktu (Bulan)
Waktu (Bulan)Plot Ergodic Probability ke state-2
Plot Data Dana Pihak Ketiga
Gro
wth
Dan
a P
ihak
Ket
iga
Pro
bab
ility
Waktu (Bulan)
Waktu (Bulan)Plot Ergodic Probability ke state-2
Plot Data Dana Pihak KetigaG
row
th D
ana
Pih
ak K
etig
aP
rob
abili
ty
Waktu (Bulan)
Waktu (Bulan)Plot Ergodic Probability ke state-2
Plot Data Dana Pihak Ketiga
Gro
wth
Dan
a P
ihak
Ket
iga
Pro
bab
ility
Waktu (Bulan)
Waktu (Bulan)Plot Ergodic Probability ke state-2
Plot Data Dana Pihak Ketiga
Gro
wth
Dan
a P
ihak
Ket
iga
Pro
bab
ility
Waktu (Bulan)

38 Bulletin of Monetary Economics and Banking, July 2012
6. Bank with Frozen Business Activity (BBKU)
Waktu (Bulan)Plot Ergodic Probability ke state-2
Plot Data Dana Pihak Ketiga
Gro
wth
Dan
a P
ihak
Ket
iga
Pro
bab
ility
Waktu (Bulan)
Waktu (Bulan)Plot Ergodic Probability ke state-2
Plot Data Dana Pihak Ketiga
Gro
wth
Dan
a P
ihak
Ket
iga
Pro
bab
ility
Waktu (Bulan)
Waktu (Bulan)Plot Ergodic Probability ke state-2
Plot Data Dana Pihak Ketiga
Gro
wth
Dan
a P
ihak
Ket
iga
Pro
bab
ility
Waktu (Bulan)
Waktu (Bulan)Plot Ergodic Probability ke state-2
Plot Data Dana Pihak Ketiga
Gro
wth
Dan
a P
ihak
Ket
iga
Pro
bab
ility
Waktu (Bulan)
Waktu (Bulan)Plot Ergodic Probability ke state-2
Plot Data Dana Pihak Ketiga
Gro
wth
Dan
a P
ihak
Ket
iga
Pro
bab
ility
Waktu (Bulan)
Waktu (Bulan)Plot Ergodic Probability ke state-2
Plot Data Dana Pihak Ketiga
Gro
wth
Dan
a P
ihak
Ket
iga
Pro
bab
ility
Waktu (Bulan)

39Early Warning Indicators Study Of Bank Runs In Indonesia : Markov-switching Approach
7. Bank with Frozen Operation (BBO)
Waktu (Bulan)Plot Ergodic Probability ke state-2
Plot Data Dana Pihak Ketiga
Gro
wth
Dan
a P
ihak
Ket
iga
Pro
bab
ility
Waktu (Bulan)
Waktu (Bulan)Plot Ergodic Probability ke state-2
Plot Data Dana Pihak Ketiga
Gro
wth
Dan
a P
ihak
Ket
iga
Pro
bab
ility
Waktu (Bulan)
Waktu (Bulan)Plot Ergodic Probability ke state-2
Plot Data Dana Pihak Ketiga
Gro
wth
Dan
a P
ihak
Ket
iga
Pro
bab
ility
Waktu (Bulan)
Waktu (Bulan)Plot Ergodic Probability ke state-2
Plot Data Dana Pihak Ketiga
Gro
wth
Dan
a P
ihak
Ket
iga
Pro
bab
ility
Waktu (Bulan)
Waktu (Bulan)Plot Ergodic Probability ke state-2
Plot Data Dana Pihak Ketiga
Gro
wth
Dan
a P
ihak
Ket
iga
Pro
bab
ility
Waktu (Bulan)
Waktu (Bulan)Plot Ergodic Probability ke state-2
Plot Data Dana Pihak Ketiga
Gro
wth
Dan
a P
ihak
Ket
iga
Pro
bab
ility
Waktu (Bulan)

40 Bulletin of Monetary Economics and Banking, July 2012
This page is intentionally left blank


