
€¥
$£
€
¥
$
£
INTERNATIONAL CONSTRUCTION COSTS: A CHANGE OF PACE
EC HARRIS RESEARCH 2013 | INTERNATIONAL CONSTRUCTION COST REPORT

3
1. Summary
Hong Kong has emerged as the most expensive construction location, when compared by prices in Euros, experiencing double digit inflation as costs in Europe’s traditional high cost markets of Switzerland and Denmark have stabilised during 2012. Australia and Japan have both slipped down the rankings relative to the UK, mainly due to currency devaluations that have taken place during the year. Building costs have fallen slightly in the UK over the past 12 months, but the UK has maintained its position in the rankings as a result of a combination of a weak pound and some inflation in European markets. Eastern Europe has seen some big price corrections during 2012/13, which has seen countries like Croatia, Bosnia Herzegovina and Bulgaria tumble down the rankings.
The cheapest locations to build remain India, Indonesia and Vietnam, where construction costs are 30 to 40% of levels seen in the UK.
Outside of selected markets in Asia including Hong Kong and Indonesia where inflation is a significant issue, global construction markets are relatively subdued, with few markets where prices are rising in excess of 5%. Currency movements have been a factor in some price movements over the past year. Relative to Sterling, the Yen and Australian Dollar have lost in excess of 15%, whilst the Euro
and Swiss Franc have strengthened by around 5%.
Top 10
1. Hong Kong
2. Switzerland
3. Denmark
4. Sweden
5. Macau
6. Australia
7. Japan
8. France
9. Singapore
10. Belgium
Ranking based on comparison of average costs of 21 building types relative to the UK.
2
EC HARRIS RESEARCH 2013 | INTERNATIONAL CONSTRUCTION COST REPORT
China, Japan and Australia are the big movers in EC Harris’s annual survey of global construction costs produced in conjunction with Langdon and Seah. Simon Rawlinson and Magda Skalska-Burgess analyse the trends.
Introduction
2013 is seeing another change in the evolution of the World Economy. The balance of economic activity may still be shifting towards emerging markets, but China and the other BRIC economies have clearly lost momentum in the past 12 months. More encouragingly, developed economies that were badly affected by the 2008 crash, including the United States, GCC and parts of Europe appear to have started their long and slow recovery. A slowdown in the growth rate of China, India and other previously dynamic emerging economies could have significant implications for wider global markets, whilst recovery in the US, Japan and Europe, dependent on high levels of stimulus, is far from assured. Despite these contradictory signs, in the medium term, construction is still expected to show substantial growth in most markets, creating continuing challenges around resource allocation and certainty of outcome.
According to the recent report, Global Construction 2025, sponsored by ARCADIS, the volume of construction output will grow by 70% in real terms to US$15 trillion by 2025. Most of the growth will take place in emerging markets, whose global share will increase from 52% in 2012 to 63% in 2025. The relative slowdown in China and India will not stop them driving much of construction growth to 2025, but will provide an opportunity for other Asian Tigers - particularly Indonesia, Vietnam and the Philippines which currently represent a $350 billion construction market. Only the Western European market is forecast to shrink when compared to its pre-recession peak reached in 2007.
The creation of Built Asset Wealth is a vital aspect of the development of a nation’s economic capacity and capability and construction has a key role in delivering these assetsto the public and private sectors. Our recent publication of the EC Harris Global Built Asset Wealth Index shows that despite very high rates of growth in construction activity in emerging markets, the shortfall in built assets per capita is such that levels of demand will continue to remain high whilst key elements of productive infrastructure including industry, transport and utilities infrastructure and housing are created. The availability of the resources and finance to create these assets and their relative construction cost will be an important determinant in these country’s pathways to development.
In our ninth annual ‘International Construction Costs’ report we set out to compare construction costs across the key global markets and to identify key changes over the year. For the first time we are able to benefit from the unrivalled regional insight and expertise of our colleagues Langdon and Seah in Asia. In compiling this report, we have been interested in whether inflation in the most active markets will have changed cost rankings, if there are any signs of cost escalation in recovering markets and whether some of the big fluctuations that have taken place in currency markets have had an impact on markets such as Japan and Australia.
In this report, we provide an overview of how construction costs vary across the globe today and offer analysis as to why prices in particular markets have changed over the past 12 months. In our commentary we also focus on where growth is likely to come from in a range of key markets in Europe, Asia, the Middle East and Americas, and identify potential areas of resource constraint.
Simon RawlinsonEC Harris
1. Hong Kong
2. Switzerland 3. Denmark
Currency trends
Currencies have seen some fairly substantial fluctuations during 2012/13, notably the fall of the Yen against world currencies as a result of Abenomics, and the weakening of the Australian Dollar - linked in part to diminishing prospects for the minerals sector. Probably the most significant movement over the year has been the 5% appreciation of the Chinese Yuan. Not only will this make Chinese imported materials more expensive, but has also contributed to China moving to nearly half way up the global cost league. Other notable movements against Sterling include the strengthening of European currencies including the Euro, Swiss Franc, Swedish Crown and Polish Zloty against Sterling - reflecting the positive response of currency markets to actions by the ECB during 2012.
-10.0% -5.0% 0.0% 5.0% 10.0% 15.0% 20.0% 25.0%
US Dollar
Turkish Lira
Swiss Franc
Swedish Krona
Singapore Dollar
Saudi Riyal
Polish Zloty
Malaysian Ringgit
Japanese Yen
Indian Rupee
Hong Kong Dollar
Euro
Chinese Yuan
Australian Dollar
Cha
nge
in c
urre
ncy
(%
) A
ugus
t 20
12 t
o A
ugus
t 20
13
% change relative to Sterling
Changes in currency value relative to Sterling (2012 to 2013)
Source: Bank of England
5
2. Global trends in commodities and currencies
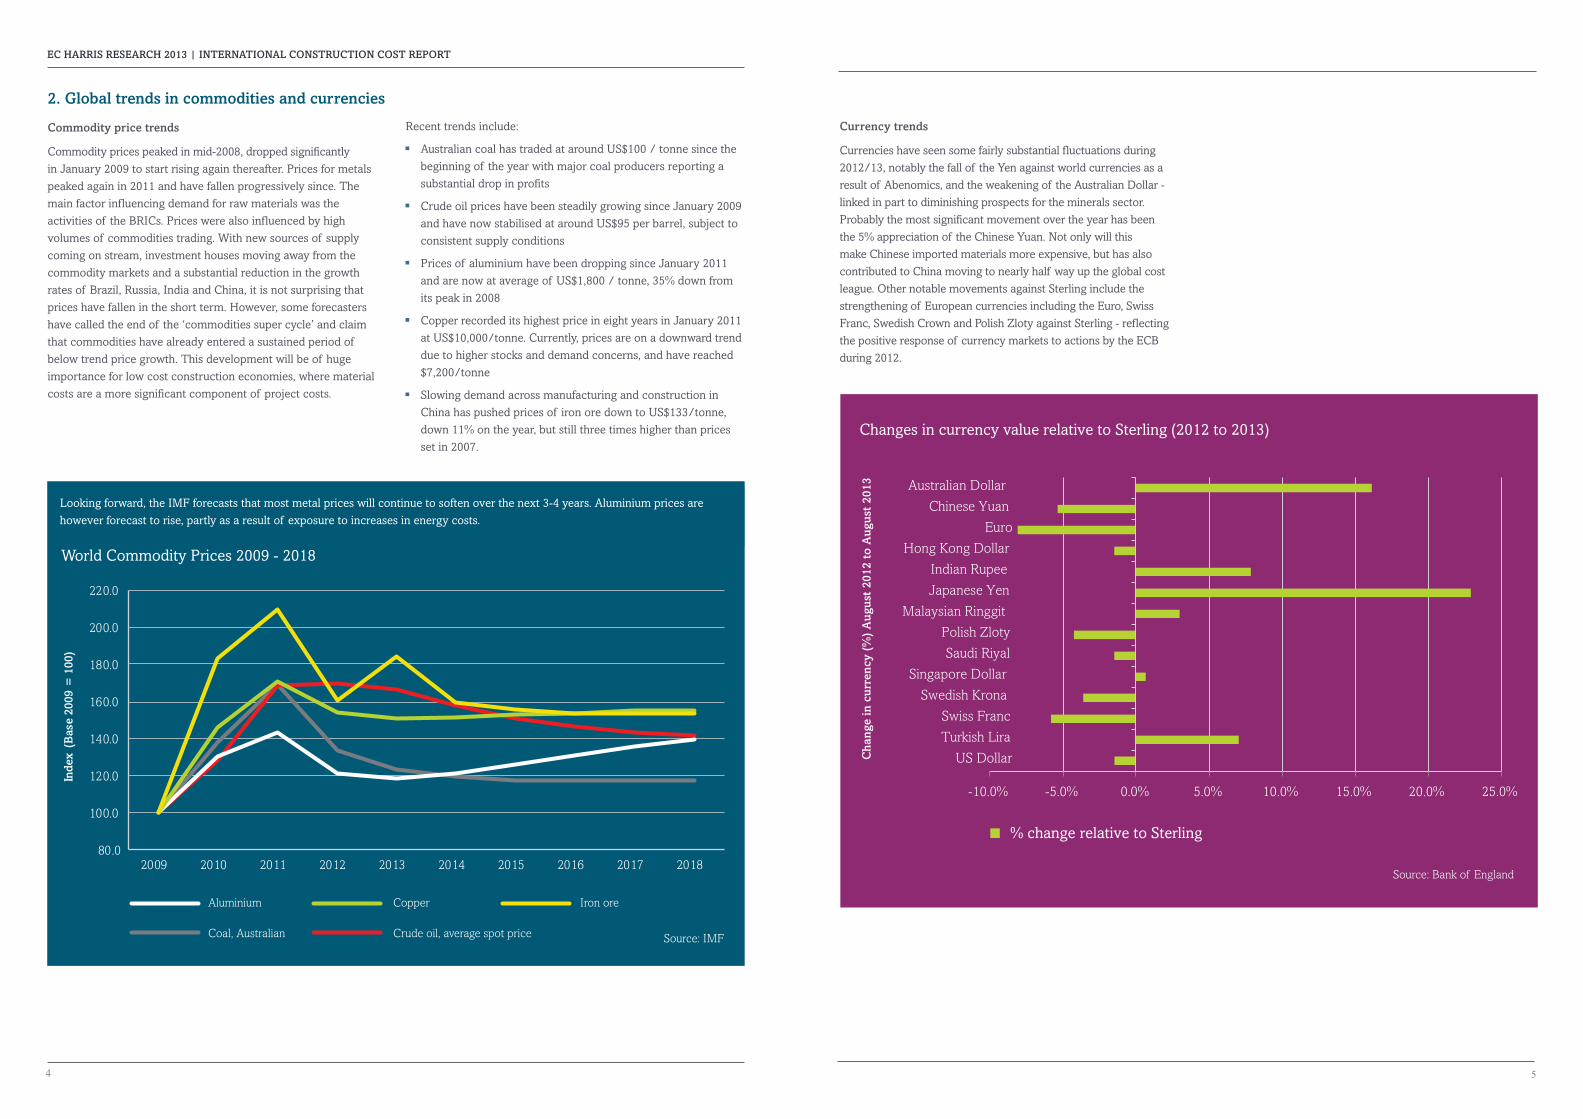
Commodity price trends
Commodity prices peaked in mid-2008, dropped significantlyin January 2009 to start rising again thereafter. Prices for metals peaked again in 2011 and have fallen progressively since. The main factor influencing demand for raw materials was the activities of the BRICs. Prices were also influenced by high volumes of commodities trading. With new sources of supply coming on stream, investment houses moving away from the commodity markets and a substantial reduction in the growth rates of Brazil, Russia, India and China, it is not surprising that prices have fallen in the short term. However, some forecasters have called the end of the ‘commodities super cycle’ and claim that commodities have already entered a sustained period of below trend price growth. This development will be of huge importance for low cost construction economies, where material costs are a more significant component of project costs.
80.0
100.0
120.0
140.0
160.0
180.0
200.0
220.0
2009 2010 2011 2012 2013 2014 2015 2016 2017 2018
Inde
x (B
ase
2009
= 1
00)
World Commodity Prices 2009 - 2018
Source: IMFCoal, Australian Crude oil, average spot price
Aluminium Copper Iron ore
Recent trends include:
■ Australian coal has traded at around US$100 / tonne since the beginning of the year with major coal producers reporting a substantial drop in profits
■ Crude oil prices have been steadily growing since January 2009 and have now stabilised at around US$95 per barrel, subject to consistent supply conditions
■ Prices of aluminium have been dropping since January 2011 and are now at average of US$1,800 / tonne, 35% down from its peak in 2008
■ Copper recorded its highest price in eight years in January 2011 at US$10,000/tonne. Currently, prices are on a downward trend due to higher stocks and demand concerns, and have reached $7,200/tonne
■ Slowing demand across manufacturing and construction in China has pushed prices of iron ore down to US$133/tonne, down 11% on the year, but still three times higher than prices set in 2007.
Looking forward, the IMF forecasts that most metal prices will continue to soften over the next 3-4 years. Aluminium prices are however forecast to rise, partly as a result of exposure to increases in energy costs.
EC HARRIS RESEARCH 2013 | INTERNATIONAL CONSTRUCTION COST REPORT
4
7
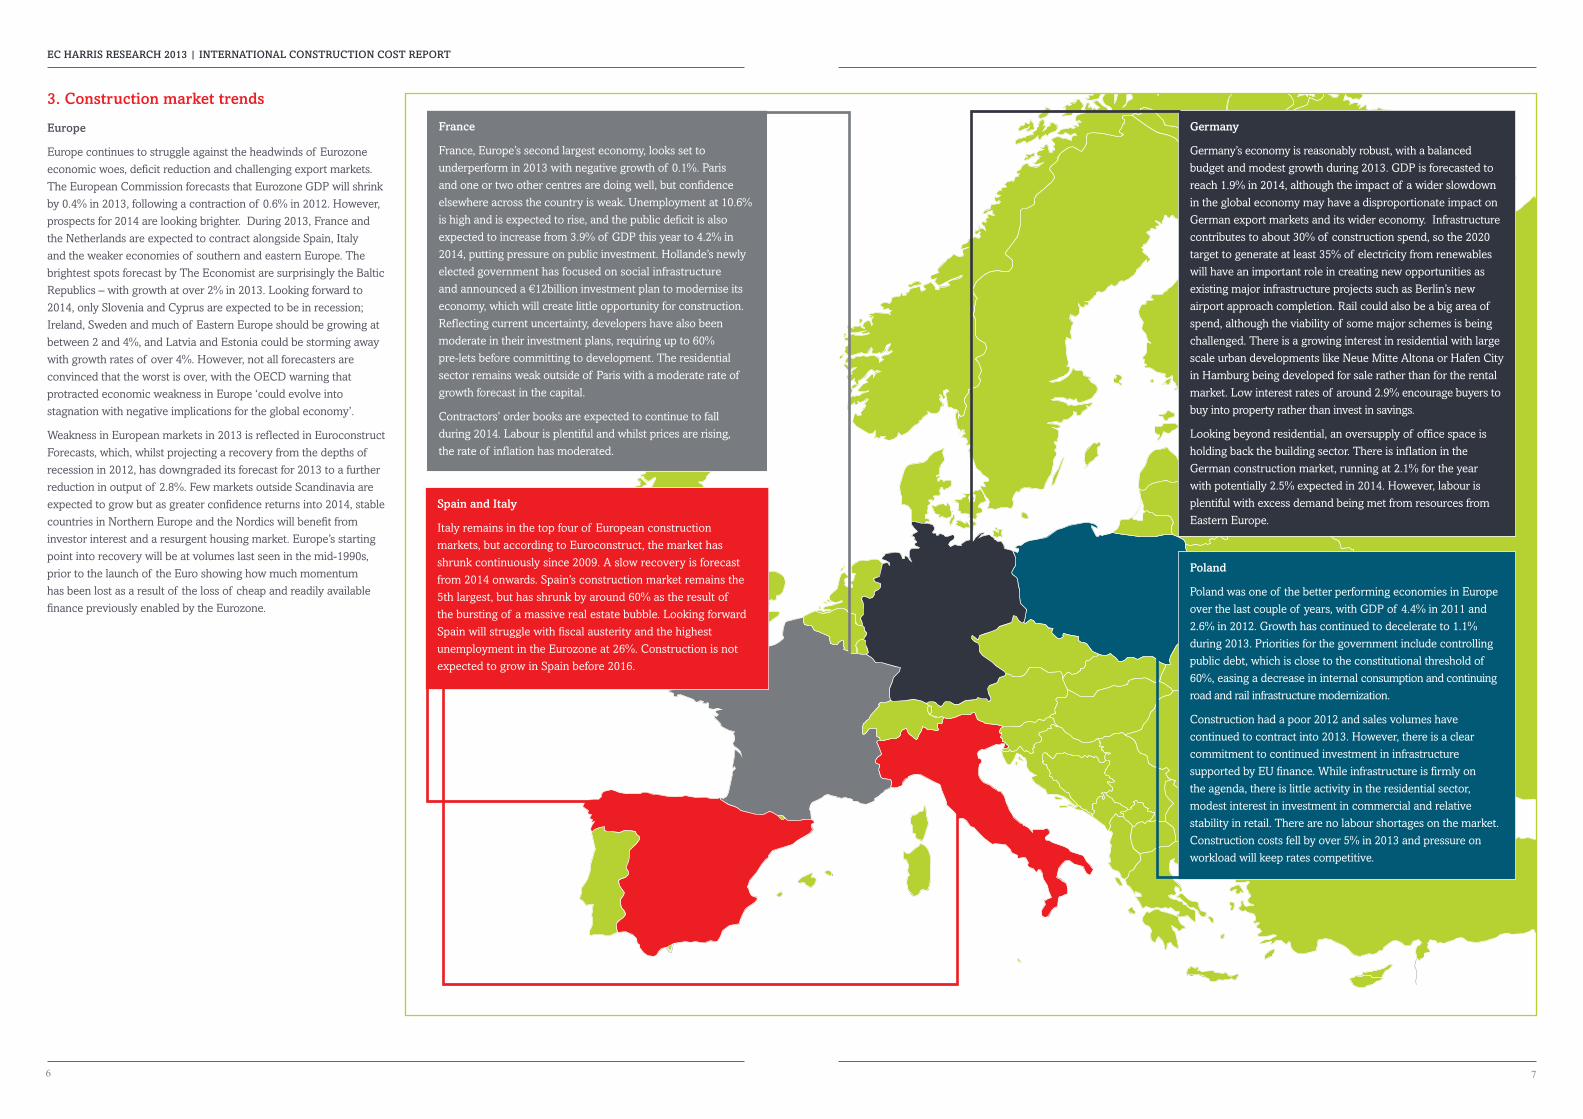
Germany
Germany’s economy is reasonably robust, with a balanced budget and modest growth during 2013. GDP is forecasted to reach 1.9% in 2014, although the impact of a wider slowdown in the global economy may have a disproportionate impact on German export markets and its wider economy. Infrastructure contributes to about 30% of construction spend, so the 2020 target to generate at least 35% of electricity from renewables will have an important role in creating new opportunities as existing major infrastructure projects such as Berlin’s new airport approach completion. Rail could also be a big area of spend, although the viability of some major schemes is being challenged. There is a growing interest in residential with large scale urban developments like Neue Mitte Altona or Hafen City in Hamburg being developed for sale rather than for the rental market. Low interest rates of around 2.9% encourage buyers to buy into property rather than invest in savings.
Looking beyond residential, an oversupply of office space is holding back the building sector. There is inflation in the German construction market, running at 2.1% for the year with potentially 2.5% expected in 2014. However, labour isplentiful with excess demand being met from resources from Eastern Europe.
Poland
Poland was one of the better performing economies in Europe over the last couple of years, with GDP of 4.4% in 2011 and 2.6% in 2012. Growth has continued to decelerate to 1.1% during 2013. Priorities for the government include controlling public debt, which is close to the constitutional threshold of 60%, easing a decrease in internal consumption and continuing road and rail infrastructure modernization.
Construction had a poor 2012 and sales volumes have continued to contract into 2013. However, there is a clear commitment to continued investment in infrastructure supported by EU finance. While infrastructure is firmly on the agenda, there is little activity in the residential sector, modest interest in investment in commercial and relative stability in retail. There are no labour shortages on the market. Construction costs fell by over 5% in 2013 and pressure on workload will keep rates competitive.
3. Construction market trends
Europe
Europe continues to struggle against the headwinds of Eurozone economic woes, deficit reduction and challenging export markets. The European Commission forecasts that Eurozone GDP will shrink by 0.4% in 2013, following a contraction of 0.6% in 2012. However, prospects for 2014 are looking brighter. During 2013, France and the Netherlands are expected to contract alongside Spain, Italy and the weaker economies of southern and eastern Europe. The brightest spots forecast by The Economist are surprisingly the Baltic Republics – with growth at over 2% in 2013. Looking forward to 2014, only Slovenia and Cyprus are expected to be in recession; Ireland, Sweden and much of Eastern Europe should be growing at between 2 and 4%, and Latvia and Estonia could be storming away with growth rates of over 4%. However, not all forecasters are convinced that the worst is over, with the OECD warning that protracted economic weakness in Europe ‘could evolve into stagnation with negative implications for the global economy’.
Weakness in European markets in 2013 is reflected in Euroconstruct Forecasts, which, whilst projecting a recovery from the depths of recession in 2012, has downgraded its forecast for 2013 to a further reduction in output of 2.8%. Few markets outside Scandinavia are expected to grow but as greater confidence returns into 2014, stable countries in Northern Europe and the Nordics will benefit from investor interest and a resurgent housing market. Europe’s starting point into recovery will be at volumes last seen in the mid-1990s, prior to the launch of the Euro showing how much momentum has been lost as a result of the loss of cheap and readily available finance previously enabled by the Eurozone.
6
EC HARRIS RESEARCH 2013 | INTERNATIONAL CONSTRUCTION COST REPORT
France
France, Europe’s second largest economy, looks set to underperform in 2013 with negative growth of 0.1%. Paris and one or two other centres are doing well, but confidence elsewhere across the country is weak. Unemployment at 10.6% is high and is expected to rise, and the public deficit is also expected to increase from 3.9% of GDP this year to 4.2% in 2014, putting pressure on public investment. Hollande’s newly elected government has focused on social infrastructure and announced a €12billion investment plan to modernise its economy, which will create little opportunity for construction.Reflecting current uncertainty, developers have also been moderate in their investment plans, requiring up to 60% pre-lets before committing to development. The residential sector remains weak outside of Paris with a moderate rate of growth forecast in the capital.
Contractors’ order books are expected to continue to fall during 2014. Labour is plentiful and whilst prices are rising, the rate of inflation has moderated.
Spain and Italy
Italy remains in the top four of European construction markets, but according to Euroconstruct, the market has shrunk continuously since 2009. A slow recovery is forecast from 2014 onwards. Spain’s construction market remains the 5th largest, but has shrunk by around 60% as the result of the bursting of a massive real estate bubble. Looking forward Spain will struggle with fiscal austerity and the highest unemployment in the Eurozone at 26%. Construction is not expected to grow in Spain before 2016.

United States
The US construction market surprised on the upside in 2012. According to data from the US Census Bureau, spending on construction increased by 8% year on year in 2012, rebounding from a 5% contraction in 2011. Activityhas continued to increase in 2013, and employment in June 2013 was up by nearly 200,000 on the year - the highest level since summer 2009. In some markets such as the metropolitan New York area, activity levels are now higher than they were in 2008; others still need to catch up. The resurgent housing market is the main driver of the recovery. House builder sentiment has been on an upward trend since Spring 2012, and starts increased by 24% in 2012. The rate of increase has slowed in 2013, but remains
on a positive upward trend.
Other markets that have been strong include industrials, benefitting from investment driven by low energy costs and the energy sector itself, focused not only on exploration and production, but also the adaptation to distribution networks needed to move oil and gas from new production centres. There are signs of a cautious recovery in the commercial sector in some markets, but with plenty of surplus space still to be absorbed, there is little potential upside.
Aspects of the construction market that have weakened
and threaten a sustained recovery include the burgeoning renewables industry - hit by changes to subsidies and low energy costs, and public sector spending on infrastructure. The automatic sequester which came into effect in March 2013 implies investment cuts of 5%, which for the Federal Department of Transport, meant a $1.9 billion overall budget cut. Looking forward, there is potential for greater investment from the PPP sector, particularly on roads, and repair and protection work in the aftermath of Super Storm Sandy that will involve significant investment of up to $100 billion. Although the construction industry looks quite strong in 2013, recovery is relatively weak by US standards, is dependent on massive levels of Quantitive Easing (QE) and a sustained recovery in the global economy. As a result the industry is not yet out of the woods. There is some input inflation in the system - about 2.5% compared to a CPI of 1.5%. However, with excess capacity, there is little sign of bid inflation in the current market.
9
Americas
Construction prospects in the Americas illustrate many of the global trends which will affect construction markets over the next few years. On the one hand, recovery in the US Housing Market promises to provide an engine for growth into the medium term, whilst public spending cuts introduced following the resolution of the ‘fiscal cliff ’ in the US and widening budget deficits in Brazil will affect levels of investment in transport and social infrastructure. The continuation of the shale gas and unconventional oil boom in the US and Canada - which drives infrastructure and production spend, contrasts with a slowdown in investment in mining and minerals, which so far has affected countries outside of Brazil including Argentina and Guyana.
Canada
Canada has had one of the strongest construction markets in the Americas, and is forecast to grow by 4% year on year over the next three years. Construction activity is underpinned by substantial demand from the energy, rail and power sectors. In the commercial sector, industrial investment related to the resource segment is expected to drive growth. Public investment in social infrastructure is also being sustained, focused on health, education and government buildings. One aspect of the Canadian market that is expected to slow is the stellar housing market - where prices have risen continuously since 2000. Prices are on average 17% higher in real terms now than in 2009, and the Government has put in place measures to constrainlending. However, even with these measures, growth is expected to stay close to 4% in 2013 and 2014.
Brazil
Brazil is forecast to be the BRIC economy with the lowest rate of growth in 2013 - at 2%. Construction prices peaked in 2011 after years on inflation of around 8% per annum, sending construction markets into a steep decline. Weak growth, high inflation, high interest rates and weak consumer demand present barriers to growth, so the main opportunities are likely to be seen in infrastructure, particularly transport, and social infrastructure focused mainly on affordable housing. With the World Cup and Presidential elections scheduled for 2014, there is a strong prospect of a short term hike in activity.
Looking forward, much of the planned investment in transport infrastructure will depend on PPP. A number of airports have already been privatised, triggering investment programmes, and there are plans for a US$ 235 billion roads concession programme. Other sources of funding include the state-owned development bank, and public-sector pension funds which have committed to investing US$15 billion in social infrastructure.
Inflation has been a real problem for construction, driven by wage hikes, high payroll costs and prohibitive energy costs. With measures being taken centrally to address some of these issues the cost environment in Brazil is expected to become more benign.
8

11
Hong Kong
Hong Kong recovered quickly from the 2008 downturn and construction markets have remained buoyant - delivering a combination of infrastructure and new commercial and residential space in previously industrial areas. The economy continues to be bolstered by high levels of tourism and consumer spend from the Chinese mainland, and has even benefitted from QE, which has resulted in lower interest rates, with private house prices doubling since QE programmes started in 2008. Construction output grew by 15% in real terms in 2012, triggering inflation at between 7 to 9%. Measures have been put into place to cool the prime housing market, mainly by restricting overseas investment and by constraining lending. However, with significant infrastructure investment in rail, metro, aviationand ports, a large affordable housing programme and a buoyant commercial sector, continued real term growth at around 6% per annum is anticipated. With regards to resources, materials are plentiful, but Hong Kong has an ageing construction workforce with 65% of workers aged over 40. The industry is undertaking urgent steps to increase training and recruitment.
Singapore
Singapore had a very bright 2011 but growth in construction activity fell in 2012 by over 10%, partly as a result of reduced levels of public investment and also as a result of a slowdown in demand from the manufacturing sector. Looking at activity in 2013, there has been a strong rebound in affordable housing and in public sector civil engineering. Singapore also has a very dynamic private sector residential sector, and repeated steps have been taken to cool the market. This appears to be having an effect in 2013.
In the medium term, continuing expansion of the population and investment in additional infrastructure is expected to sustain steady growth. Prices did not increase in 2012 after years of significant inflation. Market conditions are expected to be reasonably benign, although rapid growth in Malaysia could trigger competition for resources in the region.
Asia
China is by far the World’s largest construction market and as a result any slowdown in the rate of investment will be felt widely. Hong Kong and Singapore, the region’s major international hubs have relatively mature construction markets that in the medium term are expected to grow at a slower rate than the rest of the region. By contrast, members of the ‘next 11’ including Malaysia, Indonesia and the Philippines have very ambitious investment for economic diversification and social infrastructure programmes and are likely to see significant growth in construction over the next few years.
10
EC HARRIS RESEARCH 2013 | INTERNATIONAL CONSTRUCTION COST REPORT
China
China is at the heart of the deceleration of emerging market economies. Real GDP growth for 2013 is now targeted to be 7.5%, which is marginally the lowest rate of growth seen since 1990. Gross fixed investment accounts for 46% of Chinese GDP, so a slowdown in GDP growth will have an impact on construction. However, such is the level of catch up demand for transport, energy and social infrastructure and housing, that sustained growth in construction at somewhere between 7 to 9% is highly likely. China’s current 5 year plan, which aims to rebalance the economy away from investment, requires vast development in rail, roads, aviation and other infrastructure sectors. On this basis, China is likely to remain the dominant global construction market.
Against this background of relentless growth, there are new trends in the market. Additional constraints on the availability of funding, and more cautious developers will see less of the ‘build and they will come’ approach to development which has left many apartments vacant. Developers will also increasingly focus on the more affordable end of the private residential sector. With a move away from residential, there has been greater investment in the commercial sector, particularly offices and retail. Developers tend to do well in Tier 1 cities, but there are greater risks of oversupply in the second tier, with office vacancy rates of over 30% being reported. Shopping centre space will have doubled in many cities by 2015, so there is a risk of oversupply there too.
Accordingly, infrastructure and affordable housing will probably be the most active markets going forward, with further growth potentially be driven by PPP and foreign investment as China opens up to a wider source of funding. Prices have fallen by around 1% in the past year, reflecting the impact of the slowdown in the breakneck pace of growth seen up to 2012. There is plenty of excess capacity in materials but some concern around the labour supply. Wages have been rising rapidly over the past few years at rates as high as 25%. However due to increases in productivity and pressure on bids, these costs have not been passed through to clients.

13
United Arab Emirates
The UAE has been under a cloud since the crash in 2008, but with GDP growth of over 4% recorded in 2012, the corner may have been turned. A broad range of indicators including house prices, aviation volumes and hotel occupancy all point to accelerating growth. However, given the legacy of oversupply and failed investment prior to 2008, it is early days for a construction recoveryin the UAE. Highlights in the current market include major transport infrastructure schemes including the Abu Dhabi light rail and the recommencement of a number of stalled residential schemes. An emerging trend is investment in affordable sectors of residential, hotels and community malls, carefully targeted at sub-markets where growth is coming from. A further sign of growing confidence is the commencement of work on some of the major cultural projects that were cancelled in 2008 – including the Louvre in Abu Dhabi and the emergence of new mega schemes, including a bid for World Expo in 2020 and the Mohammed Bin Rashid City scheme, with a first phase of 1 million m² due to be complete by 2020.
The UAE is a big construction market with access to diverse resources and a large expatriate labour force. However, if the UAE does stage a recovery, it will be completing with both Saudi Arabia and Qatar for resources. Wage rates are increasing at around 4% per annum, and materials should be plentiful until at least the end of 2014.
Gulf and Middle East
Amidst a general shift to spending on social infrastructure in the wake of the Arab Spring, there are increasing signs of a more general recovery of construction markets in the GCC region. Preparations for the FIFA World Cup 2022™ in Qatar are the most obvious manifestation of accelerated growth, but there are positive
signs emerging from the UAE - a much larger construction market.
12
Saudi Arabia
Saudi Arabia is currently in the midst of the delivery of large social infrastructure and economic diversification programmes, including the construction of six new economiccities. Investment in housing and social infrastructure including education and health is a high priority due to the youthful demographic of the country and the prospect of continuing rapid population growth. 1.65 million homes are needed by 2015 alone - of which half a million will be publically funded. Transport is also a major investment focus due to the size of the country and distances between major cities. Over 3,000km of rail is currently under construction.
From a resource perspective, Saudi Arabia suffers from highlevels of unemployment, so labour shouldn’t be a problem. However measures to reduce the use of expatriate labour may create constraints in the short term as local labour sources are more widely used. So far around 180,000 expatriates have left as a result of the Nitaqat system. Overall materials capacity is good as a result of investment in local industry. However, distribution is patchy, which can affect some projects. Inflation has typically run at 5% pa for the past 4-5 years.
Qatar
Qatar was unaffected by the 2008 global financial crisis with GDP rising rapidly as a result of increased LNG out-put. Qatar’s construction market is relatively small and historically has been associated with a steady rate of development. All of this is about to change with a set of major programmes linked to the 2030 National Plan and the FIFA World Cup 2022™. This investment programme includes major elements of social infrastructure,transport and energy infrastructure to support population growth and economic diversification as well as preparing for major global events. Beyond government driven projects, progress is relatively slow, with developers preferring to hold back from development in commercial schemes until the infrastructure is in place. There is also some oversupply in commercial space.
Qatar’s resource challenge is related to the speed of proposed development. There is plenty of capacity in local supply chains as these have already been put in place in anticipation of a fast start to programme delivery. By contrast, there are potential constraints in the availability of construction professionals and some imported materials - mainly due to transport infrastructure. Currently prices are stable, but have the potential to ramp up quickly if procurement is not accelerated and additional capacity built over the next two years.
EC HARRIS RESEARCH 2013 | INTERNATIONAL CONSTRUCTION COST REPORTEC HARRIS RESEARCH 2013 | INTERNATIONAL CONSTRUCTION COST REPORT

15
Cost Comparison (UK = 100 at July 2013). The figures indicated are an average of the cost construction range for each country -
< 50
51 - 60
47. India
46. Indonesia
45. Vietnam
43. Malaysia
40. Tunisia
38. Romania
37. Philippines
30. China
29. Spain
31. Poland
27. Brunei
26. Turkey
25. Greece
24. Ukraine
22. South Korea
21. Saudi Arabia
20. UAE
19. Latvia
18. Netherlands
17. USA
16. Italy
15. Qatar
14. UK
13. Germany
12. New Zealand
11. Austria
10. Belgium
9. Singapore
8. France
7. Japan
6. Australia
5. Macau
4. Sweden
3. Denmark
2. Switzerland
1. Hong Kong 142
132
120
112
112
103
107
91
101
87
87
90
83
82
78
77
168
177
179
150
145
143
137
138
120
130
128
121
124
118
120
121
120
76
69
63
52
57
57
58
50
57
72
52
77
102
95
98
101
92
81
75
71
28. Ghana 52 73
46
72
50
50
40
39
39
35
32
29
70
53
58
55
39. Thailand 43 52
49
44. Morocco 36 51
41
42. Bulgaria
41. Bosnia/Herzegov 37
35
55
54
36. Macedonia
35. Portugal
34. Czech Republic
33. Serbia
32. Croatia 46
43
45
44
43
67
65
62
63
60
43
34
82
23. Slovenia 58 81
100
100
14
International Cost Comparison
61 - 80
81 - 100
101 - 120
121>
Methodology
The indicative figures above have been calculated from a survey of construction costs in 47 different countries, which was conducted across EC Harris and Langdon Seah offices worldwide.
Data was collected in cost per m² format for a wide spectrum of building types covering industrial, offices, retail, residential hotels, etc.
All buildings are deemed to be ‘international’, and constructed to Western European specification standards, but there will always be differences in specification for the same building constructed in different countries.
Procurement and contractual arrangements can also have a substantial effect on costs. Site labour costs remains one of the key drivers, while the sourcing of materials, including the use of imported mechanical and electrical engineering plant, can have a profound effect on prices. The full EC Harris publication gives cost per m² figures for 21 different building types, across all sectors.
EC HARRIS RESEARCH 2013 | INTERNATIONAL CONSTRUCTION COST REPORT
-8.0%
-6.0%
-4.0%
-2.0%
0.0%
2.0%
4.0%
6.0%
8.0%
Source: IMF
UKAus
tria
Belgiun
India
Bulgar
iaCro
atia
Czech
Rep
ublic
Denm
ark
Fran
ceGer
man
yGre
ece
China
Italy
Sout
h Afri
ca
Hong K
ong
Neth
erlan
dsPo
land
Portu
gal
Mor
occo
Russia
Qatar
Saud
i Ara
bia
UAE
Spain
Swed
enSw
itzer
land
Turk
ey
Algeria
2013
2014
Indo
nesia
Japa
nM
alays
iaSin
gapo
reAus
tralia
Canad
a
Brasil
USA
GDP Growth Forecasts 2013 - 2014 (Real % pa)
Source: EC Harris and Langdon & Seah

For more information, please contact:
Simon Rawlinson Head of Strategic Research and Insight
t +44 (0)20 7812 2319 e [email protected]
Magda Skalska-Burgess Market Intelligence Analyst
t +44 (0)20 7812 2782 e [email protected]
Tim Robinson Head of Cost and Commercial Management, Asia
t +852 2263 7470 e [email protected]
Mathew Riley Head of Cost and Commercial, UK
t +44 (0)20 7812 2296 e [email protected]
Nick Smith Head of Cost and Commercial, Middle East
t +971 4499 0206 e [email protected]
ECHARRIS.COM/RESEARCHECHARRIS.COM/BLOGS
Follow us@ECHARRISLLP
Join usECHARRIS 8633E
CEC HARRIS RESEARCH 2013 | INTERNATIONAL CONSTRUCTION COST REPORT


