
AN ECONOMIC ANALYSIS OF FACTORS AFFECTING SUCCESSOF KANSAS GRAIN COOPERATIVES, 1963-61
by
RICHARD LEE EPARD
B. S., Kansas State University, 1962
A MASTER'S THESIS
submitted in partial fulfillment of the
requirements for the degree
MASTER OF SCIENCE
Department of Economics
KANSAS STATE UNIVERSITYManhattan, Kansas
1965
Approved by:
Major Professor
LP7,mTV1 90S
£(j$c>7
poocmn<^\
TABLE OF CONTENTS
Page
LIST OF FIGURES , vi
INTRODUCTION 1
, . . . . h
OBJECTIVES OF STUDY , , . . . . 5
REVIEW OF LITERATURE 5
MODEL ,9
The Economic FrameworkAccounting DataDepartmentationUse of Ratios
DATA 16
FINANCIAL STATEMENT ANALYSIS .... 20
Balance SheetTotal AssetsLiabilities and Member Equity-
OperationsGross Operating IncomeGross Margins on SalesOther Operating Income
Operating ExpensesNet Operating SavingsTotal Net Savings
Distribution of Net SavingsSummary
ANALYSIS BY PROFIT LEVEL AND SIZE GROUP .... U2
Ratio AnalysisLiquidity RatiosSolvency RatiosOperating RatiosProfitability Ratios
Ratio Analysis by Profit LevelsSummary
ii

TABLE OF CONTENTS (continued)
Page
EXTENT AND TYPE OF DEPARTMENTATION $1
SUMMARY AND CONCLUSIONS 61*
ACKNOWLEDGMENTS 68
LITERATURE CITED 69
APPENDIX 72
iii
LIST OF TABLES
Table Paee
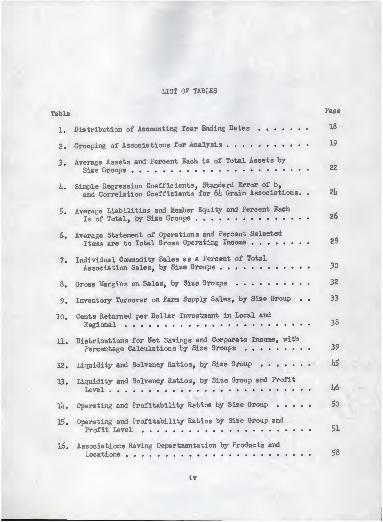
1. Distribution of Accounting Year Ending Dates 18
2. Grouping of Associations for Analysis 1?
3. Average Assets and Percent Each is of Total Assets by
Size Groups
h. Simple Regression Coefficients, Standard Error of b,
and Correlation Coefficients for 6U Grain Associations. . 2U
5« Average Liabilities and Member Equity and Percent Each
Is of Total, by Size Groups
6. Average Statement of Operations and Percent Selected
Items are to Total Gross Operating Income 28
7. Individual Commodity Sales as a Percent of Total
Association Sales, by Size Groups 30
8. Gross Margins on Sales, by Size Groups 32
9. Inventory Turnover on Farm Supply Sales, by Size Group . . 33
10. Cents Returned per Dollar Investment in Local and
Regional 38
11. Distributions for Net Savings and Corporate Income, with
Percentage Calculations by Size Groups 39
12. Liquidity and Solvency Ratios, by Size Group U5
13. Liquidity and Solvency Ratios, by Size Group and Profit
Level ^
LU. Operating and Profitability Ratios by Size Group 50
15. Operating and Profitability Ratios by Size Group and
Profit Level ?1
16. Associations Having Departmentation by Products and
Locations 58
iv

LIST OF TABLES (continued)
Table Paee
17. Associations with One or More Departments and Percent
Major Product is of Department Sales 60
18. Averages for Selected Ratios for Departments Classified
by Products °1
19. Composition of Assets by Profit Level and Size Croups as
Percent of Total 73
20. Composition of Liabilities and Member Equity by Profit
Level and Size Groups, as Percent of Total lh
21. Statement of Operations with Percent Selected Items are
to Gross Operating Income 75
22. Statement of Operating Expenses with Percent Selected
Items are to Total Operating Expense 76
23. Gross Margins of Major Marketing Commodities by Profit
Levels and Size Groups 76
2lu Gross Margins and Inventory Turnover of Major Farm
Supply Items by Profit Level and Size Groups 77

LIST OF FIGURES
Figure Page
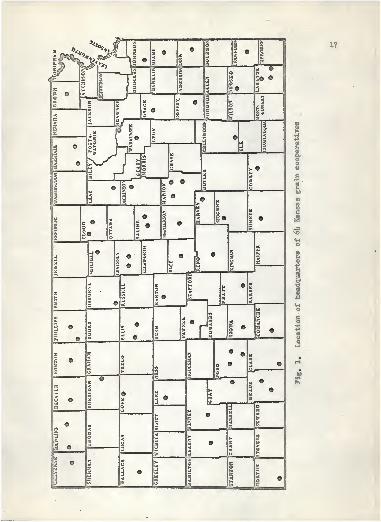
1. Location of Headquarters of 6I4 Kansas Grain Cooperatives . . 17
vi

INTRODUCTION
A business exists because it fulfills a necessaiy or desired need.
Marketing and farm supply farmer cooperatives, as a response to a need,
were created and have expanded over the years until they now play an
important role in the agriculture sector of the economy. Cooperatives
are a direct result of the efforts of the American farmers who have
joined together to obtain better bargaining positions than would be
possible as individuals.
Kansas farmer cooperatives, like other businesses, must change with
changing times if they are to accomplish their intended goals. Since
their inception and especially during the last two decades, farmer co-
operatives have faced ever changing conditions, and the demands placed
on them have also changed. During this period increased emphasis has
been placed on services and products offered patrons and, furthermore,
changes have occurred in the institutional framework within which co-
operatives operate. Cooperatives have found that in order to survive
they must adjust to these changing times.
In the years following World War II, improved technology and changed
farming methods enabled the American farmer to greatly expand production.
Farmers increased purchases of inputs such as feeds, fertilizers, or gas
and oil for farm equipment. Farmer cooperatives, in addition to market-
ing farm products, became major suppliers of farm supplies.
1
2
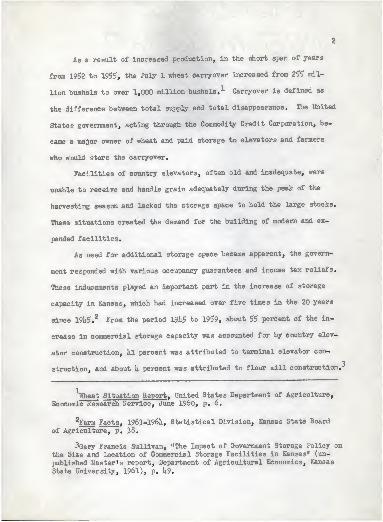
As a result of increased production, in the short span of years
from 1952 to 19$5, the July 1 wheat carryover increased from 23>!? mil-
lion bushels to over 1,000 million bushels. 1 Carryover is defined as
the difference between total supply and total disappearance. The United
States government, acting through the Commodity Credit Corporation, be-
came a major owner of wheat and paid storage to elevators and farmers
who would store the carryover.
Facilities of country elevators, often old and inadequate, were
unable to receive and handle grain adequately during the peak of the
harvesting season and lacked the storage space to hold the large stocks.
These situations created the demand for the building of modern and ex-
panded facilities.
As need for additional storage space became apparent, the govern-
ment responded with various occupancy guarantees and income tax reliefs.
These inducements played an important part in the increase of storage
capacity in Kansas, which had increased over five times in the 20 years
since 19h5.2 From the period 19h5 to 1959, about 55 percent of the in-
crease in commercial storage capacity was accounted for by country elev-
ator construction, Ul percent was attributed to terminal elevator con-
3struction, and about h percent was attributed to flour mill construction.-'
"
Wheat Situation Report , United States Department of Agriculture,
Economic Research Service, June i960, p. 6.
2Farm Facts , 1963-1961*, Statistical Division, Kansas State Board
of Agriculture, p. 38.
3Gary Francis Sullivan, "The Impact of Government Storage Jrolicy on
the Size and Location of Commercial Storage Facilities in Kansas" (un-
published Master's report, Department of Agricultural Economics, Kansas
State University, 1961), p. k9.

3
Much of the impetus in local storage construction was probably due to the
government's policy of storing grain close to the source of production.
As a result storage of wheat became a very profitable source of income
for grain cooperatives. Manuel in a study of Kansas cooperatives found
that storage and handling income had increased from 20,9 percent of gross
operating income in 1950 to 62. It percent of gross operating income in I960.
During the 196o's production controls have been more effective. Im-
ports have decreased, and exports have increased; hence, in I96I4, the
July 1 carryover dropped below 1,000 million bushels for the first time
in six years. ^ C.C.C. grain stored in approved Kansas commercial storage
facilities has decreased from 67 percent of capacity on March 31, 1962
to 36 percent of capacity on December 31, 1961n^
Government policy has changed and it would seem to indicate that
commercial storage as a major source of income for Kansas grain associ-
ations is about to be eliminated or at least reduced in importance. It
seems unlike]y that the C.C.C. will again be such a large owner of wheat.
Farmer cooperatives operate in a somewhat different environment
than do private retail firms. The cooperative is considered by the
member patron as an extension of his farming enterprise. Thus the
operations of tht cooperative may be affected by member loyalty and
"•Milton L. Manuel, A Decade of Farmer Cooperatives in Kansas ,
Kansas State Agricultural Experiment Station, Bulletin U5o"7 December1962, p. 16.
Wheat Situation Report , op . cit., February 1965, p. 2.
•^Letter from Mr. Carl M. Heaton, Acting Director, AgriculturalStabilization and Conservation Service, United States Department ofAgriculture, Kansas City, Missouri, April lU, 1965.
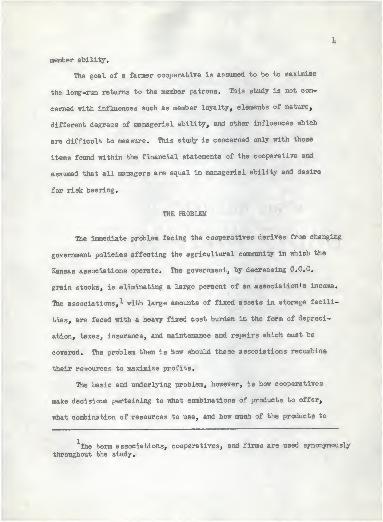
member ability.
The goal of a farmer cooperative is assumed to be to maximize
the long-run returns to the member patrons. This study is not con-
cerned with influences such as member loyalty, elements of nature,
different degrees of managerial ability, and other influences which
are difficult to measure. This study is concerned only with those
items found within the financial statements of the cooperative and
assumed that all managers are equal in managerial ability and desire
for risk bearing.
THE FROBLBII
The immediate problem facing the cooperatives derives from changing
government policies affecting the agricultural community in which the
Kansas associations operate. The government, by decreasing C.C.C.
grain stocks, is eliminating a large percent of an association's income.
The associations,^- with large amounts of fixed assets in storage facili-
ties, are faced with a heavy fixed cost burden in the form of depreci-
ation, taxes, insurance, and maintenance and repairs which must be
covered. The problem then is how should these associations recombine
their resources to maximize profits.
The basic and underlying problem, however, is how cooperatives
make decisions pertaining to what combinations of products to offer,
what combination of resources to use, and how much of the products to
The term associations, cooperatives, and firms are used synonymously
throughout the study.
$
offer. When storage needs were of maximum concern, the government
eliminated much risk entailed in building new facilities. Associations
found that with large income from storage they could obtain a satisfactory-
profit and often seemed unconcerned in finding a more efficient combina-
tion of resources.
Associations now, more than ever, need to know how much a particular
product contributes to the success of the total business operations.
OBJECTIVES OF STUDY
The general objective of the study is to determine the financial
success of the Kansas grain cooperatives for 1963-6lu
More specifically, the objectives are (1) to determine the suc-
cess of associations in 1963-61*, (2) to determine the adequacy of the
accounting system as an aid to management decision making, (3) to deter-
mine certain selected efficiency and percentage ratios and to compare
the ratios between associations of different sizes and different profit
levels, and (Ii) to determine the extent departmentation is being used.
This study is confined to an analysis of 6I4 associations whose
financial positions were considered to be representative of Kansas grain
cooperatives.
REVIEW OF LITERATURE
One of the purposes of the study is to determine the adequacy of
the accounting systems used.
6
Phillips1 stated that an effective accounting system is an essential
tool to management in country elevators and retail farm supply businesses.
Proper accounting records provide management with a measure of the business
efficiency for the different phases of the total operation as well as for
the business as a whole. They make it possible to evaluate performance
for each of these operations, and indicate areas in which changes are
needed in order to improve performance. For maximum benefit of an ac-
counting system, records should not be kept for the firm as a whole.
Records need to be kept for each major product and function in the busi-
ness. In this respect, Phillips states the accounting used in many
country elevator and retail farm supply businesses is woefully lacking.
Baumel2 in a study of management productivity states that managers
use a variety of managerial methods and techniques to approximate econ-
omic efficiency. Some managers make random decisions in some areas of
management. Inputs may be added with no consideration of other alter-
natives. Products and services may be added simply because a customer
asks for them. Outputs may be retained because the business has always
provided them. He states the complexity of modern management problems
precludes the exclusive use of hunches and snap judgments for successful
management.
and Retail _
Company, 1957) P
ichard Phillips, Managing for Greater Returns in Country Elevator
il Farm Supply Businesses,"TDes lioines, Iowa: Garner Publishing
1957Tp. 125.
2Clarence P. Baumel, "Productivity of Management in Local Cooperative
Elevators" (unpublished Ph. D. dissertation, Iowa State University, 1961).

7
Streeter found that constant or increasing returns to scale exis-
ted for Kansas elevators. He further stated that there were definite
limitations as to the extent grain storage and grain merchandising could
be expanded because the quantity of grain available depends on current
surplus, production, and trade area.
In another study of Kansas elevators, Kelley, McCoy, Tucker, and
Altau2 found that the sidelines function indicated increasing returns to
scale. Their conclusion was that an expansion in sidelines would be
profitable, and should be recommended. An expansion in sidelines would
enable the firms (l) to use their facilities and labor more efficiently
throughout the year, (2) to increase their business volume, and (3) to
diversify and stabilize the business.
Another problem is to determine appropriate and meanginful measures
of success. Sharp and Baumel^ said there are several measures of profit-
ability for a firm. Among these are (1) net profit per dollar sales, (2)
rate of return on owner investment, (3) net income expressed in dollars.
In their study they used net profit per dollar sales. They concluded that
net profit per dollar sales as a goal of a firm tends to violate the prin-
ciples of economics and made the following recommendations:
wiarles Streeter, "Resource Productivity and Returns to Scale in
Kansas Cooperative Elevators in 1955" (unpublished Master's thesis,
Department of Agricultural Economics, Kansas State University, 1959).
Paul L. Kelley, et al. Resource Returns and Productivity Coef-
ficients in Central and Western Kansas Country Elevators of Modern Con-
struction , Kansas Agricultural Experiment Station, Technical Bulletin
88, March 1957, P. 25.
3«John W. Sharp and Philip C. Baumel, A Financial Analysis of Ohio
Elevator Operations , Ohio Agricultural Experiment Station, ResearchBulletin 813, June 1953, p. 23.

8
1) That country elevators should not use net profit per dollar
sales as a measure of success.
2) That analysis be directed toward using other dependent varia-
bles, such as rate of return on owner's investment and net profit ex-
pressed in dollars as a measure of successful elevator operations.
3) That further study include measuring the interrelationships
between factors included in this study.
It) That elevator operators adopt a standardized accounting pro-
cedure.
Taylor1 used an effectiveness index made up of two ratios to measure
profitability or success. These were (1) percent operating savings is
of sales, and (2) percent operating savings is of member equity. He
further stated that using either of these two ratios alone would not
have altered the general conclusions of the study.
Whitehair^ in a study of Indiana cooperatives used, as a measure
of a firm's success, the percentage return on investment for the firm in
"its own right." This ratio was calculated by using only income from
local operations as a percent of the investment in the local (total
assets minus investment in other cooperatives).
Byron Eugene Taylor, "Analysis of Economic Factors Affecting
Success of Operations of Selected Midwestern Petroleum Cooperatives"
(unpublished Master's thesis, Department of Agricultural Economics,
Kansas State University, 1958).
Norman V. Whitehair, "Measuring Financial Performance of Co-
operative Grain and Supply Firms in Indiana" (unpublished Ph. D. dis-
sertation, Purdue University, l°61i).
MODEL
Efficiency is the relationship between an output and a related
input. Maximum efficiency is denoted when minimum resources are used
to obtain a given product, or a maximum product is obtained from a
given quantity of resources. Economic efficiency is indicated when re-
sources are used in a manner to maximize a particular objective or end
quantity which is relevant to the economic unit being considered. The
sufficient conditions for economic efficiency can be determined only
when prices of inputs and outputs are known.
Firm inefficiency always results in additional costs. These
added costs are reflected in the prices farmers have to pay for sup-
plies and services and in the prices farmers receive for their products.
Ultimately, society also feels some of the effects of this inefficiency,
since it has to pay higher prices for the farm products purchased. In-
efficiency places an additional burden on society in the form of slower
economic growth since, under inefficient conditions, agricultural indus-
tries use extra inputs which could be used more productively in other
industries.
The Economic Framework
Economic theory provides a framework for determining the most
profitable combination of resources to handle and products and services
to be provided by a grain association. Phillips* lists three decisions
\ichard Phillips, 0£. cit., pp. 22-31.
10
every firm has to make in order to obtain maximum economic efficiency.
1) The firm must decide the best combination of goods and services
to provide. The business will have the most profitable balance of all
products and services when it has a volume of each one which makes this
ratio of marginal return divided by the marginal cost of each product
and service equal to the same ratio for all other products and services
in the business.
2) The selection of the lowest possible cost combinations of
inputs to produce these goods and services. The business will have the
lowest cost balance of all inputs used when it uses the quantity of each
one which makes the ratio of the marginal value productivity divided by
the marginal expenditure for each input equal to their ratio for all
other inputs used in the business.
3
)
The selection of the most profitable level of production and
size of business. The most profitable volume of output will be provided
when the ratio of the marginal return to the combined marginal expendi-
ture is exactly equal to the marginal rate of transformation between
inputs and the output.
The economic framework presented for determining the optimum
organization of the business is designated as the theory of the firm.
It has received much attention by economists and is a well-developed
body of theory. However, it does have some shortcomings. For instance,
it assumes perfect knowledge, does not consider time, and assumes profit
maximization. These, however, are essentially simplifying assumptions
made to aid in an analysis.
11
In the real world there is neither perfect knowledge nor instan-
taneous production] hence, the elements of risk and uncertainty appear.
Heady1 states that without the combination of time, change, and the
inability of perfect prediction, there would be no need for management,
or perhaps more accurately, the need for management would arise only as
the firm was initially established.
Management includes decision making on information that is known
with certainty as well as information which is based on uncertainty.
The manager of a business enterprise is often considered as performing
the functions of (1) planning, (2) organizing, (3) directing, (h) co-
ordinating, and (5) controlling in such a way as to provide for effective
results. Management needs to know and use proper tools and techniques
for maintaining an efficient operation.
Accounting Data
Effective management of a cooperative requires information that
can be provided only by an adequate accounting system. An accurate and
well-kept accounting system will not guarantee ^ood management, but with-
out it management is more likely to be ineffective and inefficient. Co-
operatives with only one bookkeeper will not be able to afford an elaborate
accounting system, but it is possible to keep records which will supply
very valuable information for the manager.
Earl 0. Heady, Economics of Agricultural Production and Resource
Use (New York: Prentice-Hall, Inc., 1952), p. 1*66.

12
It has been said that accounting data provides some, but never
enough, information about the marginal costs which economists are seek-
ing. Powelson^ lists two reasons why this situation exists: 1) Marginal
cost applies to an additional increment in production, whereas accounting
records show only the cost of production that took place. 2) A businessman
uses marginal costs to help him determine what his output will be in the
future. Thus, he compares future marginal cost with future marginal
revenue to the extent that he can estimate them. His accounting records
show only costs that have existed in the past, and these will not neces-
sarily continue unchanged in the future.
Finney and Miller^ state that accounting records do not show the
value of a product or an item in the balance sheet at their realizable
market value. Only a few assets such as cash are stated at actual
realizable value. Inventories are not valued at actual or even esti-
mated realizable values, even when the lower of cost or market valuation
rule is applied.
Fixed assets are usually carried on the books in accordance with
generally accepted accounting principles or conventions which are not
concerned with currently realizable values.
Even though an accounting system records events as they happened
in the past, the past is never quite divorced from the future and many
clues can be obtained as to marginal cost. If good accounting records
John P. Powelson, Economic Accounting—A Textbook in AccountingPrinciples for Students of Economics and the Liberal Arts
-[McGraw-Hill
Book Company, Inc., 195577 P. 195.
'H. A. Finney and Herbert E. Miller, Principles of Accounting , Inter-
mediate 5th ed. ; (Englewood Cliffs, New Jersey: Prentice-Hall, Inc., 1959),
p. Ii7.

13
are maintained for different volumes of output that have been obtained
in the past, a manager will be better able to predict future costs,
volumes, prices, margins, and thus profitability.
An effective accounting system can provide information as to the
profitability of various phases of the business operation. A good ac-
counting system will tell which of the operations or departments is the
most efficient, and can give an indication as to why some departments
are less efficient. This information indicates to the manager what could
be done to improve performance. Breaking down major activities of the
business into departments or functions is essential to effective manage-
ment. Without knowledge of the income and expenses of the various acti-
vities of a multi-product firm such as cooperatives, how can an intel-
ligent decision be made concerning an activity?
Departmentation
Departmentation is the process of grouping various activities into
separate units. Theo Haimarur- states that a department is a distinct
area of activities over which a manager has been given authority and
for which he has accepted responsibility.
Various methods of departmentation are used. Three of the most
common are the following:
1) Departmentation by functions—Basic functions of a business
are (a) producing products or services, (b) selling products or services,
and (c) financing the business. Thus, departmentation according to
Theo Haimann, Professional Management , St. Louis University,
1962, p. 156.

Hi
production, sales and finance ig often found. The main disadvantage of
this type of departmentation is that it makes effective control difficult,
and it is next to impossible to determine the cost and profit of any one
product or service.
2) Departmentation by product—Each product or group of closely
related products is made a relatively separate unit within the overall
framework of the business. This type of departmentation has the distinct
advantage of making it possible to determine if a product is profitable,
and is the type of departmentation which best provides the information
desired by economists in their economic models for determining maximum
profits of the firm.
3) Departmentation by location—Because of different locations of
operations, a business may develop this type of departmentation. Many
associations in the study have location accounting. This situation has
developed primarily because of mergers with the branches continuing to
keep records in much the same way as they did prior to merger. This
method has the advantage of being the easiest one for record keeping,
but has the disadvantage of not making it possible to determine profit-
ability of an individual product or service.
Of the three types of departmentation presented, the one which can
provide the manager with the most valuable information is departmentation
by product. Accounting records should be kept showing revenue, physical
volumes, and costs of each major product or service offered by the associ-
ation.

1*
Accounting information is of little benefit to managers if state-
ments of departmental operations are prepared on only an annual basis.
Statements should be made monthly if a manager is to dervie maximum
benefit from accounting records.
Use of Ratios
Ratio analysis is a technique which can be used by managers in
planning the future operations and analyzing past performances. Such
ratios can be easily obtained from the financial statements of the
firm and compared with past operations, between departments, and with
published standards.
The ratios which can be obtained from the financial statements
are of two general types:
1) Efficiency ratios (input-output ratios). The greater the
value of the ratio, the higher the efficiency. This ratio is computed
or determined by dividing an output by a related input.
2) Percentage ratios show the percent one number is of another.
Ratios may be computed from the income statement, the balance shpet, or
by comparing a figure in the income statement with one in the balance
sheet. Although ratios deal with averages and as such will not give the
maximum profits, they still will provide management with a measure of the
level of profits which have been achieved by the firm and give an indi-
cation of the weak points which need changing in the planning for the
future.
16
The value of the business ratios lies in enabling management to
see each item in relation to the whole. Ratios should be computed and
their meaning interpreted in the light of other ratios. One ratio by-
itself has little meaning and should not be considered individually in
an attempt to determine the condition of a business.
Ratios are no better than the information they are taken from, so
if management is to make full use of and obtain the full benefit from
ratio analysis, the firm must possess complete and accurate accounting
records for all major departments. Then ratios for one department can
be compared with those of other departments. Ratios for the same depart-
ment can be compared from one month to the next. Also, ratios for the
firm can be compared with published standards that might be available.
The preceding discussion indicates that complete and accurate ac-
counting data and ratio analysis are valuable tools available to manage-
ment in performing the functions of planning and controlling.
DATA
Firms used in this study are Kansas grain associations which car-
ried on operations during 1963. All associations used in the study were
audited by one of two auditing firms. Year-end audits were obtained for
6I4 associations, and information extracted from their financial statements
was summarized. The approximate location of these associations is shown
in Fig. 1.
Random sampling was used to select the associations from a total
population of 232 associations. A 25 percent random sample was drawn
using a table of random numbers. In addition, five of the largest grain

18
associations in the state were included. Including them was deemed
desirable because they represent a large volume of sales in the state.
Thus, although the general conditions found existing in the financial
statements may be representative of Kansas grain cooperatives, this
sample of 6h cannot be used in a predictive capacity for estimating
total cooperative sales in the state.
The data do not refer to one 12-month period, but to a combination
of 12-month periods ending any time from January 1, l°6u to November 30,
l°61j. (See Table 1. ) However, this variation is not felt to detract
seriously from the reliability of the data as used in this analysis.
TABLE 1—Distribution of accounting year ending dates
Number of : Number of
Ending date firms • Ending date firms
January 1 19 July 31 1
February 28 7 August 31 5
March 31 9 September 30 2
April 30 6 October 31 6
May 31 7 November 30 2
Grain associations, besides marketing grain, also sell a variety
of farm supplies, such as petroleum products, feed, and fertilizer.
A large percent of their income typically is derived from services such
as storage, grinding, etc. Income from such services is not included in
the sales figure. As a result, sales volume is a somewhat inadequate
measure of the relative size of a grain association. The figure used
for determining the relative size of operations was gross operating in-
come. It was considered the best measure available because it includes
19
not only income from sales, but also income from storage, handling,
and other services. No other indicator available would include these,
and therefore, would not accurately reflect the total income earning
capacity of the firm. Gross operating income is not an ideal measure,
since some differences in margins on sales do exist, thus sales may
vary and gross operating income will be the same.
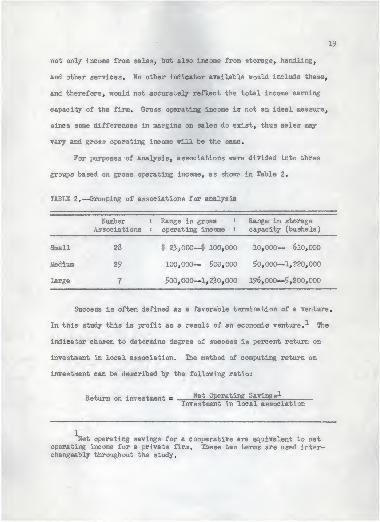
For purposes of analysis, associations were divided into three
groups based on gross operating income, as shown in Table 2.
TABLE 2.—Grouping of associations for analysis
Number : Range in grossAssociations : operating income
Range in storage
capacity (bushels)
Small 28
Medium 29
Large 7
| 23,000—4"< 100,000 10,000— 610,000
100,000— $00,000 50,000—1,220,000
$00,000—1,230,000 196,000—5,200,000
Success is often defined as a favorable termination of a venture,
In this study this is profit as a result of an economic venture.-'- The
indicator chosen to determine degree of success is percent return on
investment in local association. The method of computing return on
investment can be described by the following ratio:
Return on investment Net Operating Savings^-
Investment in local association
Net operating savings for a cooperative are equivalent to netoperating income for a private firm. These two terms are used inter-changeably throughout the study.

20
The numerator is gross operating income minus total operating ex-
penses, and the denominator is total assets minus investment in other
cooperatives. Return on investment was used because it permits meaning-
ful comparisons between businesses with different capital structures.
This ratio gives an indication of economic productivity of capital and
thus measures earning power of a cooperative in "its own right."
This indicator was computed for each association in the study and
then used to further separate the three size groups into low and high
profit categories. The three size groups were divided as follows:
Small-lb low profit and lh high profit, medium-15 low profit and lli high
profit, and large-lj low profit and 3 high profit.
FINANCIAL STATEMENT ANALYSIS
The term "financial statements" generally refers to two basic
statements which are prepared for a business at the end of a specified
period of time. These are the balance sheet and the statement of oper-
ations .
Balance Sheet
The balance sheet is a systematic exhibit of the kind and stated
value of an association's assets at the end of an accounting period.
It consists of assets, liabilities, and the member equity of an associ-
ation. A balance sheet is a statement of the financial position at a
given point in time and gives an idea of how the firm has financed its
assets.

21
Only balance sheet items considered most important were tabulated
in an effort to keep the material in a manageable form in this study,
and to obtain consistency of accounts between associations.
Total Assets
Assets include the value of items either owned by or owed to the
firm. Assets are commonly divided into current assets, fixed assets,
and other assets.
Current assets include cash, accounts and notes receivable, inven-
tories, and marketable securities. These are items which in the normal
business operations can reasonably be expected to be sold or consumed
during a given year.
Fixed assets are items owned by the association (land, buildings,
and equipment) which are not readily convertible into cash during normal
business operations. They are considered fairly permanent items, useable
for several years, with a yearly depreciation charge being deducted from
their value (except for land, which is not subject to depreciation).
Other assets include investments in securities of another company.
In the case of cooperatives, other assets are composed essentially of
investments in regional cooperatives.
The average grain association had total assets valued at $886,279
(Table 3). Slightly more than one-half (52.1 percent) of the total assets
were fixed assets, less than one-third (30.9 percent) were current assets,
and 16.8 percent were invested in other cooperatives.
Associations included represented a broad spectrum of the grain
cooperative industry in Kansas. The large group had assets averaging

22
•pc©E0)Oh
CM CO co«
ao XA,
on | vO fAl On• * *l •
- ^o o vOm H i H
vO OO
xa_=tIs- CM
CO_3 CM• • •
O <H CMXA XA
ooH
CO
if
IOuttO
CO
N•HCD
K>
PCOCO
CO
a
$o-p
O
OCO
CO
PcCO
E&
CO
CO
pCOCO
CO
cfl
COMsCO
1fA
a
a CO
HOQ
pc1IE
Ph
T3a-
n
l
cc
p
r-l
Oa
pcIo?H
CO
u
HOo
(0o(hCO
00
u
Ho
nOCM
•»
cofA
MD
oo
o
oXA
XA
-3
oH
•»
fA
3
nO
o
XA
o
MD HCM HH OS
la r-
vO
XA
_3
o
XACM
vO
COXA
XA
O
PiooONCM
On
On
XA HH nO0\ r>-
nOco
CM
On
CM
ON
H (Ar-l COO -3
On -3 On CO•* •» •» •»
H O -3 On50 H 3H O
HXA
ONl•
J
fAl
o
fAfA
(A
C- fA r-t
OO t— HH -3 fA
ON
-3
NO f-CM• • •
H XAOfA H
COoc1
c—
CM
Oncm
On•O«A
Is- Ol
o oCM
CO CM
NO OF"1
On
XAH
OH HfAXA COmD fA On» «i •»
r-r-T CO
a fAH
ooOoXA.3Ng^ On
r-o«< •» •<
r>- CM CMoo NO vO
r- MD XA fA CM9
r— CN NO CO r-lc— On fA XA _=r H ON H H Ono fA fA o CM o HnQ CO I
s- oo•> a •» •> « * * m «\ •» »o 0\ CM fA ON -=f CnH o COXA
-a- -=r vO CO fA t—-a
XA MO i-lCM H MD CM
-3nO• •
nO -3C— CM
-3 QXA OH O
•> •>
ONXAnO HNO CM
_=TMD• •
CM CMC— CM
XA_=TIs- CM
HI XA-3O fA fA
•« m •H f- coNO -3 ONO c—«
r-t p-T|
co r>-|* •
H OXA
CO XA
ON O
_3XA CN0OO ON O CMHnO j-xa
•> «\ •» mt>- C- ON HHno -qCM H
XA^J H OlH HXA
C- fACM fACO XA
«\ «CM COXA-3
XA
CMXA
-3 On fAXA CM coi-l On o
•K *l iJXA oXA MD_=r -3
fA
OXA
fAOn•O
XA
CMXA
ONOfA
M0-3
fACOXA
fAr—CM«
fA
o•ooH
CM
oOCO
ooo
-3CMooofA
ooH
Ont-CM*
00
CO
00CO<t!
1-5
oE-t

23
over $3.27 million, roughly h times as large as the medium group and 11
times larger than the small group.
Composition of items making up total assets varied only slightly
between size groups. The most significant difference was that medium
and large firms had considerably less of their assets invested in other
cooperatives.
Grain associations had large investments in fixed assets such as
storage and grain handling facilities. Since the amount of grain handled
and stored would depend on how much storage space was available, net
operating savings should be highly related to amount of investment in
plant facilities. Simple linear regressions were computed in an effort
to determine how much variation of income between different associations
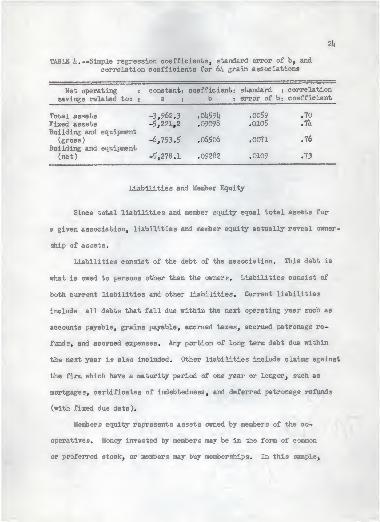
could be explained by investment in such assets. Table h indicates
results of regression equations relating net operating savings to total
assets, fixed assets, building and equipment (gross), and building and
equipment (net).
All coefficients were found to be statistically significant
at the 5 percent level. It may be inferred that building and equip-
ment (gross) is the most Important variable of the four independent
variables. It had a correlation coefficient of .76, indicating that it
explains more variation in operating savings among associations than any
other variable in Table h. This equation would indicate that for every
$1.00 increase in building and equipment (gross) net operating savings
would increase 6.5 cents.
2fc
TABLE h.—Simple regression coefficients, standard error of b, and
correlation coefficients for 6JU grain associations
Net operating :
savings related to: :
constant:a :
coefficient:b •
standard :
error of b«
correlationcoefficient
Total assetsFixed assetsBuilding and equipment
(gross)Building and equipment
(net)
-3,962.3-5,221,2
-6,753.5
-5,278.1
.Ol459ll
.09098
.065o6
.09282
.0059
.0105
.0071
.0109
.70
,1k
.76
.73
Liabilities and Member Equity
Since total liabilities and member equity equal total assets for
« given association, liabilities and member equity actually reveal owner-
ship of assets.
Liabilities consist of the debt of the association. This debt is
what is owed to persons other than the owners. Liabilities consist of
both current liabilities and other liabilities. Current liabilities
include all debts that fall due within the next operating year such as
accounts payable, grains payable, accrued taxes, accrued patronage re-
funds, and accrued expenses. Any portion of long term debt due within
the next year is also included. Other liabilities include claims against
the firm which have a maturity period of one year or longer, such as
mortgages, certificates of indebtedness, and deferred patronage refunds
(with fixed due date).
Members equity represents assets owned by members of the co-
operatives. Money invested by members may be in the form of common
or preferred stock, or members may buy memberships. In this sample,

25
thirty-seven associations were financed primarily by common and preferred
stock, eight had both stock and membership financing and 9 were financed
mainly by memberships. Deferred patronage refunds (no fixed due date)
are cooperative savings which have been allocated but no date set for
distribution to members. Surplus and reserves represent the difference
between total savings to date and total patronage refunds plus dividends
to date.
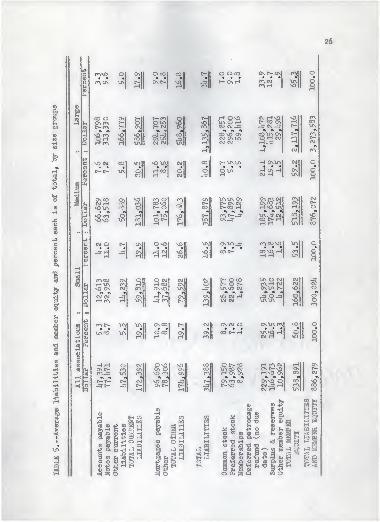
Members on the average owned 60.8 percent of the total assets of
their association, (Table 5). Debt to creditors was evenly divided be-
tween current (19.5 percent) and long term liabilities, (19.7 percent).
Deferred patronage refunds made up the largest single source of funds
for financing operations, since they financed over one-fourth of all
assets. Surplus and reserves made up next most important source of
operating funds and amounted to 16.5 percent of all assets.
Members of small associations owned slightly over one-half (53.5
percent) of the assets of their associations; whereas, members of the
medium and large associations owned 59.2 and 65.3 percent respectively
of their total assets. As a result the small and medium size associations
had to incur more long term debt (26.6 and 20.2 percent respectively)
versus only 16.3 percent for the large associations. The percent of
current liabilities did not vary with size. However, small associations
had more long term debt (26.6 percent of total liabilities and members
equity) compared with only 20.2 percent for medium, and 16.8 percent for
large associations.
26
CO
§•
ouM0!
N•H(0
J?
£0
-PO•P
uCO0)
•pc
aCO
•H
J*
1
1CO
CO
05H•P
OCO
o
CO
E0}
1UN
Pg0)
0)
1<
u
o
pcc
E
•H
1
H
1
O
Pc
O
M
po3
gc•H•P
.3
8iC3
4
PC.
o
a
s-J
O
fOvQ• •
co CN
CO OC\roC-co
-i •>
o3H en
MD CM
ON COCM HvOXA
• •»
vO rovDvO
CM O• •
-3H
cocoH1AvO CN» •»
CM CMH ro
roc—
1ACO
cnc—CO-3
-3P-
ia
co
1A
ia|
1A
Oenin•
r-_3
CNl Oco cofl•
1• • •
1
c—
1
cn r*- o\|H| Hfl
MO
oCM
CN
On
CMCNro
CM
vO 1AI CMl
H COlH -
OvO
33MD
•c\CM
CN o O CMro H —
! 30CM CO CNMD* « «\ •.
3 CN H r—\A _3ro
to CNCO r-• • • •
CN O CO CNH H H
OvQCN OvO r^
•» •
vO COCN C—
i&CD03
+3 (J)
.9 £=3 O
coM
O M
£3oH
-3mil
o\ C— r— ro o K.r— O OlA * MDc— CN O- CM CO• « •» « « •>-
* _3-_3 co i.r\
3 CNTA -3 •*s\A CM CM XA HH
CO
o-3I
os MD ro O ro CN00 o £o —
|
C—00 o CO co
•» * « « « «
H H\A •-0 (<•
u> co O r- r— 1AH H H ih
CMO-3•
CN
NCN
o oco• • •
C— CNH
H OMD\A O HCO CM -3
•> •» •»
CO MD CNCM CN1ACM CM
C— XA\A
ow
XAXA CNr- CN CMc—co HCAC>-_3cn^j
CNU\_3• • •
CO c—
r-ocor- o t~-XAvO CM
•» •> «vO CM HCM CM
CN CM O• • •
co c— H
Of-COXACO CMH CN CN
•* ^ •*
CN COCOr— so
CNC—• •
rr\ CMCO H
CM H\0r-co CN_3 CM-3N «\ •>
com cnO iH CMiH_3
•>
H CN1AI* * *lH CNH
CM H
ON col• •l
ta|-o!
H
«CM
CM•
ON\A
CNCO CMCNCO H co
CNHMD1A r-l
•»•»•« «\r\-3 CM COco r— H HH H 1A
CO COM3• • •
oo vO Hr-l H
\A
CO\A
1A O CM CM -3CO H CM CM CMCN1A t^- MD o» » « •< fl
-3 0_3 O oXAtA ^°, oH ro
CN1ACO• • •
•>A kO HCM H
H CO CMcn r-voH\0 CN« •» «
CNMD OCM-3 HCM H
CO•
OMD
CNco«
ooCO1A
OoH
coCO1A
ror—CM
CO
o3
CMr-O«
vOc-co
ccH
oQc
CNr-CM•
vOCOCO

27
Fully one-third of the large grain associations 1 assets were
financed by deferred patronage refunds j an amount twice as much as that
of the small group.
Operations
Operations for the associations are summarized in the statement of
operations (Table 6). This table lists sources of income, describes the
nature of expenses, and shows amount of savings or of loss incurred by a
firm during the year's operations.
Items included in the statement of operations can be classified
into three sections: (1) the gross operating income section—which
shows gross margins from sales (sales-cost of goods sold) plus storage,
handling, services and other operating income; (2) the net operating
savings section—which shows operating expenses in running the business
that are deducted from gross operating income in order to obtain operating
savings or loss for the period; (3) total net savings section—in which
patronage refunds from regionals and other nonoperating income are added
to operating savings.
An average association had almost $1.5 million of sales during the
1963 operations. Sales for a single association ranged from $300 thousand
to almost $12 million. Twelve associations had under &500 thousand sales,
twenty had sales from $500 thousand to $1 million, twenty-two had sales
from $1 million to &2 million, and ten had sales of over $2 million.
Grain marketing sales made up 60.I percent of the average association's
sales. Wheat, reported separately by 56 firms made up 39.0 percent of total

28
I P•H G
0>no no c H t- o
• •«••• \0^rlrr,HvO W4WO m CO• ••••»••••( ••fAJN W-3CVHrr\rlH 1 ON
ON• I
Io oo xano t— cm o On O
03 CD-^T CA O CO r-l C*- CM
P<0 U
AEID a 33 C\J 1AXA CM f— H Hc-^f Hc\ir-rr\rr\cojjo^lH LA « COXA OnQ, Jh cAXAnO CVIt^H
_^cr> r-l H OnOCOCOIAJrr\H N-CnI OnIAC'-CMUN. O CO_3 CAO 3 OnXA CONO-=rON_3C^O_CjrHNOCMONCM ON P- c\i
— oo* ^ •* * *x * * • •^•\«S*%^i\«V«%«S«\ «k« * * * * *
82 r-l xr\ en r-l r-l iH ON CAnO oxr\ f-co-^tn O co o oo cmiaso r— NO XA OnCO O cs-3- f— CO 0\AWfO n mrl H rr> O rl OJ H NO O nO nO CAOU
3 O CM CACA CO cr> r-l -o H H CA•• - ca cm
H P3 c f-XA CM OnO O C^OOnO nO OnIAnOnO -1 CM_^RO_^ICO CM
CD • ••••• • ••••••••••••]• •O O 0O H O0O r-l O 0O_^ CM H\A_3 HrriHH OOnOICM t-P k -a_=r o Ho §
CO Hp
ij
C- CM o_3- r— ca_=jco OOCOOOXAnOCnIHCMOC— CMP- 3D O XA O XA^ SH HXA ON CM XA ON ONXA lACMfAoO OnnOnOnO-^O OnQ-=T CA CM _=fr-l r-
3 ^rvO ON NO OnXA o CM ONONrAr^OCOCMfACM_3 OnIAIA X> -^r O-nO r-* * «\ »\ •* •* »\ »\ ********** ** « * * *
r-l C\J t— r—xn cm no canOH co co H O OO On XA CN. CM ON f^ r>- CM CM r-l f*Nt~ HCM i-4
o XA OO _3-a O c— co t>- CA tA r~
p Q o-xa CM H•H •* ••
1 Pr-l in H O ca O rlOrlO\ONHHHO\OncoUj nOP CD • ••••• • ••••••••••••I* •
§t) l^rl\AO\H O fA\AfAr-l0OlAHfAr-IH OH XA|r-l CO?H wnn O -3 H |OnH © r-lH 2hA
P CM1A On _3 XA XA 1A CO NQ_=rO_CJCOrH CMCM OnCAnO HnOOONCAr-lNOr-IHr-IOOlAONCO
CMtt
OnO CMG 09 k O On on ca t~- o r-co ON XACO CACD ^ CA CA CAnO CO NO CO CA ONCONCMfACOr—ONP-NOfAO-lA ON (A -=T On ooU * * * * «\ * * ****** * * * * * *E0)
i-t
Oca ca -=r On hxa cm
r-t r-l CM NONOtAr-lr-tlAON r-l CACM LA
XA a HCnI
ft
„a 3 H
§ (0 pG g xa o r- r- h c iANO_=roxAco_=r_=rcM cm <ano coir- CA
CO O • •••»• • ••••••••••»•(• •Go P o
uOwf-r^MCH -=3 »A O ON^rCMCMIAfAHfAr-lr-l OOnOICM
CA r-l bo H•H co HP •H(3 ofcID to vO ca H NO O C— UN On ONlACO OlACOrHHCA CAXA-^r^J
l£CA CACO 8(X CO u r- H nO XA O ca O 'UN. catano o onco ONcoc^-ciONr-o XA o_crO CO 3 r-l ON NrlHjnN C>-r>-r-l CM1ACA0O W J-3\An\0 LA C- XACA nO
•\ * ****** ********** ** * * * * *<H H H cAnO CM On OnO -3 CM (A On lA -^T r-l ON CM t^ CM CM iH _3
CO r-H CM H LA NO CM H OO H o oo c 5 CM CO CO iH H r- CA _CJ CO
Pg
< » co try CM HCD CO
s CD o
ico HID CO C.H CO 8 CO i COp
iCO
CO 1 60 5cp co c oCO -H r-l M
CO +5
M CO §« Ct' CO O CO* ^. i2 -^ s ° aC C HtH OX) O CD O.H CO it
2•H> CO -H
O
to
E
CD
03 HCD COH CO
•rt l( C fjp
^85 |COCO
G°•rlp
•rt +3
| 2>1 S £ § $-8 1
c -h s a, a. wco o ptDcorsp-xJ m
O Pt0«CDW3PCCD O,h noH 1
i
• ^g: 5p a co m
•H d CD CD O CDP W bO O Kg ^ JO •--; ^ CO c
CO G CO 0] <ri tH .r! eiJDCO t-3Sj cOChCDOPPCD CD <C!rtWtjTlttOCiTlO-PTJHtthH!ID3igil)LiO)HrlCl CflCDOH K; CO &,+i ft> -H Vi co-o bD £l fn
CO CD cfl Cbo G onO P to
CD
CD CO O G EH
M & G -rl
O ixD (HO
1^ cra to
^ f-i t> CD CO <p
U U O U ,£3 O pJO CO P CD P U S^
cp ra G cd G ©TJ-ptMrl a cdp-«EHHcJHQ<!DOft<cqi-10 PCD
$h CD CD
p ^ x:CO PEh
: * a lit a ic o 3 k a X, o
29
sales and accounted for nearly two-thirds of total marketing sale. Grain
sorghum reported by 26 firms was next in importance and accounted for 7.7
percent to total sales. Thirty-five associations reported a general item
"grains," which accounted for 7.5 percent of total sales. Together, these
three items accounted for over half of total sales. Comparisons between
the different sized groups may be noted in Table 7. Marketing sales
were more important for small groups (71.9 percent of sales) versus 56.9
and 58.0 percent of total sales for medium and large groups respectively.
Wheat was relatively more important in larger groups and for all groups
was by far the largest single item sold.
All but one association reported farm supply sales. Feed, reported
by 33 firms was the most important single supply item and accounted for
6.1 percent of supply sales. Fertilizer sales, reported by Ul firms,
and gasoline, reported by 36 firms, were next in importance. These three
items accounted for about ItO percent of farm supply sales. Over one-half
of farm supply sales were in general classification groups having little
identification. Forty-four associations had "miscellaneous petroleum
and auto supplies" classified under one heading, 55 had "general mer-
chandise," 28 reported "miscellaneous production supplies," and 5 reported
"other building materials." Grain commodities generally were much better
identified than farm supply items. For example, four associations re-
ported feed and seed together, eight reported feed and merchandise to-
gether, and three reported feed, seed, fertilizer, and merchandise to-
gether.

30
TABLE 7.—Individual commodity sales «as a percenl . of total association
sales, by size groups
•i
:
. associ-:A11 : :
• ations :associ- :•
Item : reporting : ations : Small : Medium : Large
Grains 35 7.5 8.0 8.8 5.7
Wheat 56 39.0 36.5 39.1 1*0.2
Financed contract wheat 7 1.9 9.0 0.6 —Corn 26 1.6 3.9 1.7 0.1*
Grain sorghum 22 7.7 6.0 5.1i 10.9
Barley 19 0.2 0.3 0.3 0.2
Rye 7 0.1 0.1 0.1 a
Soybeans 19 1.8 7.8 0.7 0.3
Alfalfa seed 3 0.1 a 0.1 0.1
Oats 15 0.2 0.3 0.1 0.2
TOTAL MARKETING SALES S 6o.i 71.9 55^9 2Sisc. petroleum andauto supplies 1* 5.0 1.2 b.9 6.9
Gasoline 36 5.2 U.2 6.1 ii.7
Tractor fuel (diesel) h a a 0.1 a
L. P. gas 30 1.6 0.5 2.2 l.li
Kerosene - fuel oil 6 0.2 a 0.2 0.2
Lubricating oil LU 0.2 0.2 0.1 0.3
Grease 12 a a a 0.1
Tires and tubes 10 0.6 a O.it 1.0
Feed 33 6.1 k.6 11.7 0.8
Seeds 16 0.3 O.li O.h 0.1
Fertilizer hi ii.7 6.U lul li.5
Hardware U 0.2 — O.li 0.1Paint 3 a a a —Other building materials 5 0.6 0.3 1.0 0.3
Misc. production supplies 28 6.7 3.U ii.6 10.li
General merchandise 55 7.6 6.9 5.1 10.3
Coal 3 a a — 0.1Machinery and implements 1 0.2 — 0.5 —Appliances 2 0.3 — a 0.7Produce 3 a — a ~Grocerie s 3 O.li — 1.0 —Fruits and vegetables 1 a a — —Other a a a 0.1
TOTAL FARM SUPPLY SALES 2 39.9 JO 1)3.1 .
TOTAL ASSOCIATION SALES 6h 100.0 100.0 100.0 100.0
Less than .05 percent of total sales.

31
Gross Operating Income
Gross operating income is obtained from two major sources (l)
gross margins from sales and (2) other operating income such as storage
and handling and services provided patrons.
Gross Margins on Sales
Gross margins received for all commodities sold are shown in Table 8.
Gross marketing margins as a percentage of commodity selling price were
1.9 percent for wheat, 2.9 percent for financed contract wheat, lul percent
for grain sorghums and 3.8 percent for corn. Gross margins on farm supply-
items averaged 9.8 percent for feed, 10.0 percent for fertilizer, lil.O
percent for L.P. gas (propane) and 16.6 percent on gasoline. Large
associations generally had smaller marketing margins and larger farm
supply margins. Overall gross margins were higher for large associ-
ations, primarily because a larger percent of their sales were farm
supply items. Some items, such as groceries and appliances, were not
strictly farm supply items. They were included since they were related
and were handled by a few of the associations.
Gross margins and inventory turnovers computed are averages for
the respective size groups. These margins and inventory turnovers will
vary for different associations within the groups.
Annual inventory turnovers were calculated by dividing cost of
sales by average of beginning and ending inventories. (See Table 9.)
Marketing inventory turnovers were not considered very reliable.
Associations with similar actual turnovers could appear to have quite

32
TABLE 8.—Gross margins on sales, by size groups
• All . . .
Item . associations .•
Small jMedium .
•Large
Grains 3.5 inO 2.8 il.2
Wheat 1.9 2.7 1.8 1.7
Financed contract wheat 2.9 2.8 3.6 ~Corn 3.8 lut 3.U l.h
Grain sorghum (milo) It.l 5.6 lull 3.5
Barley 5.6 6.7 5.14 5.0
Rye 7.3 9.7 6.6 6.9
SoybeansAlfalfa seed
2.8
(10.0)a
2.7U4.9
2.6
9.5
3.9(35.1)
a
Oats 7.1* 9.8 10.0 1.3
TOTAL MARKETING 25 3.2 2.3 2.3
Misc. petroleum andauto supplies 19.3 21.5 20.b 18.3
Gasoline 16.6 13.2 17.3 17.1
Tractor fuel (diesel) 25.2 28.6 21.0 28.3
L. P. gas la.o 1.3.8 1j2.9 37.1*
Kerosene-fuel oil n.k 17.6 19.
U
23.U
Lubricating oil 26.7 22.9 26.9 27.9
Grease 27.5 19.3 3lw7 27.1
Tires and tubes 21.5 10.8 20.6 22.9
Feed 9.8 9.3 9.7 12.3
Seeds 11.2 9.7 8.7 20.7
Fertilizer 10.0 7.0 9.2 12.8
Hardware 23.14 — 25.9 15.1
Paint 22.7 22.1 29.3 —Other building materials 21.6 23.5 19.9 2h.6
Miscellaneous production
supplies 12.6 10.5 7.8 15.2
General merchandise lh.O 11.0 13.8 15.1
Coal 12.2 15.6 — 11.3
Machinery and implements 3.3 — 3.3 —Appliances 28.1 — 15.1 28.U
Produce 2.0 9.1 25.5 —
»
Groceries 13.3 — 13.3 —Fruits and vegetables I4.8 I1.8 — —Other 32.8 — 37.3 32.8
TOTAL FARM SUPPLIES 52 11.3 uno" 17.0
TOTAL SALES 7.6 5.5 7.6 8.5
Parentheses indicate a loss on sales.
33
TABLE 9.—Inventory turnover on farm supply 'sales, by size group
1 All 1 : ;
Item • associations : Small : Medium : Large
Misc. petroleum and
auto supplies 5.6 k.$ 1*.8 6.U
Gasoline 26.6 31.9 23.3 30.0
Tractor fuel (diesel) 15.0 9.0 12.0 a
L. F. gas 27.5 39.8 25.5 29.3
Kerosene-fuel oil 19.3 3.1* 20.3 27.2
Lubricating oil 1.9 1.6 1.9 1.9
Grease 1.9 2.6 2.1 1.7
Tires and tubes 1.8 lul 1.8 1.7
Feed 9.8 12.5 9.6 8.1
Seeds 3.5 13.C 6.7 114.7
Fertilizer 5.9 6.8 7.2 lu6
Hardware 1.7 — 1.5 2.7
Paint 0.9 1.0 0.3 —Other building materials 1.8 1.0 1.8 2.0
Miscellaneous productionsupplies l.h 5.U 14.9 11.0
General merchandise k.k 3.1 3.0 6.9Coal 3.2 12.6 — 7.6
Machinery and implements 2.9 — 2.9 ~Appliances 1.8 — 2.9 1.8
Produce U8.7 38.9 57.3 —Groceries 12. h — 12.k —Fruits and vegetables 9.1 9.1 — «—
Other 2.0 _ 1.9 2.0
TOTAL 22 23 22 6.8
No beginning or ending inventory.
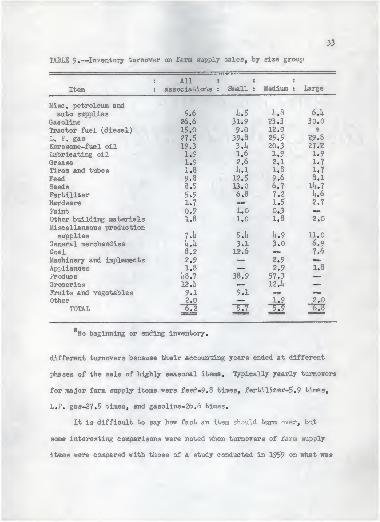
different turnovers because Ibheir accounting years ended at different
phases of the sale of highly seasonal items. Typically yearly turnovers
for major farm supply items were feed-9.8 times, fertilizer-5.S> times,
L.P. gas-27.5 times, and gasoline-26.6 times .
It is difficult to say how fart an item sh turn >ver, but
some interesting comparisons were noted when turnover s of farm supply
items were compared with those of a study conducted in 1959 on what was

3h
considered "above average" farm supply cooperatives. For example, total
farm supply inventory turnover in 1959 averaged 10.8 times per year, or
almost twice as Tap! as the farm supply inventory turnover computed in
this study.
In 1959 selected supply items such as feed had an average turn-
over of 17.7 times per year, compared with 9.8 times per year in 1963.
Fertilizer turnover in 1959 averaged 30.lt times per year as compared
with 5.9 times per year in 1963.
These 1959 averages of farm supply inventory turnovers would seem
to indicate that handling and merchandising of inventories have become
a major problem for grain cooperatives. There are costs which are directly
related to size of inventory. These costs include interest, insurance,
taxes, shrinkage, theft, and obsolescence. According to several authori-
ties, these costs may easily amount to 10 percent of the average inven-
tories on hand each year.
2
A linear multiple regression analysis was made to determine effects
of gross margins and inventory turnover on net operating savings. The
equation computed is the following:
X-, - -2,923.572 + 22.7U5X2 + .329Xo
(3.67) (.037T
T. R. Eichers, Inventory Management , by Selected Retail FarmSupply Co-ops , Area U, Kansas, Nebraska, Missouri, Iowa, and Illinois,United States Department of Agriculture, Farmer Cooperative Service,General Report 66, 1959.
pT. R. Eichers, loc . cit.
3$
In the equation X^ operating income (dollars), X2 inventory turnover
(in tenths of one turnover), and X3 * gross margin (dollars). R » .7h7.
Standard errors of the regression coefficients are shown in parentheses.
Both coefficients were found to be statistically significant at the 5 per-
cent level.
This analysis indicates that on the average net operating savings
changed $22.7l4 for every .1 change in inventory turnover and 32.9 cents
for every $1.00 change in gross margins. Thus, it is shown that both
inventory turnover and gross margins had an important effect on success
of the cooperative.
Other Operating Income
Almost half of gross operating income came from grain storage and
handling, services, and other operating income. Storage and handling
income accounted for nearly 80 percent of other operating income and
37.7 percent of gross operating income. Service income (grinding,
mixing, drying, and other services) was next in importance and amounted
to 7.7 percent of gross operating income. Storage and handling were
important sources of income for most of the grain associations in the
study. Over three-fourths of the associations obtained over 25 percent
of their gross operating income from storage and handling.
A simple linear regression analysis was made to determine the effect
of storage and handling income on net operating savings. The equation
computed was the following!
X, - 4t,006.7ii + .3'1U3X21(.Oft)

36
X-, « net operating savings (dollars), and I2 storage and handling in-
come (dollars), r =» .77. The coefficient was found to be significant
at the 5 percent level and has a standard error of .05U. This equation
indicates that on the average net operating savings changed 51.1* cents
for each $1.00 change in storage and handling income.
Operating Expenses
Total operating expenses averaged 3">175,5o6 for associations in
the study or approximately 32,7 percent of gross operating income. (See
Table 6.) The largest single expense item was for salaries and wages.
It required an expenditure of 39.5 cents per $1.00 gross operating in-
come. Depreciation, interest, and taxes were next in importance re-
quiring an expenditure of 13.3 cents, 5.5 cents, and lj.6 cents respec-
tively per one dollar gross operating income.
On the average, 91, li cents of expenses were required to get one
dollar gross operating income in the small associations contrasted with
82.8 cents in the medium and 79.9 cents in the large associations. There
is a difference of 11.5 cents in expenses per one dollar gross operating
income. Although the large group paid slightly more than average for
labor, it is observed that other major expense items decreased as a
percent of gross operating income when compared with the percent these
expense items were of gross operating income for small and medium groups.
Thus it appears that large firms do enjoy some economies because of their
larger operations. Large firms have extensive retirement and health benefit
programs which most of the smaller associations do not have. For purposes
37
of this study, expenses for these programs were included as part of
total employee labor costs and are probably a primary reason large
associations had higher labor expenses.
Net Operating Savings
In a previous section, success was measured by return on investment
in local associations. This indicates profitability of the local associ-
ation in "its own right."
The average grain association returned 5 cents for every dollar
invested locally. When separated into size groups, it is evident there
vras a noticeable difference in return on investment. Table 10 indicates
that the small group returned only 2.3 cents, medium —U.8 cents, and
large-6.1 cents for every dollar invested locally. Even though total
investment affects net operating savings large variations between
associations in each size group existed. Standard deviations on return
on investment for associations in each size group were computed and indi-
cate that small firms, in addition to having lower returns, also have
the largest variations in income. Medium and large associations, in ad-
dition to having higher returns, have less variation between firms in
the group. The standard deviations are shown in parentheses. Although
level of returns was related to investment, such variables as control
of expenses, margins, inventories and amount of other operating income
also had a great effect on success.

38
TABLE 10.—Cents returned per dollar investment in local and regional
Allassociations
grain
:' Small l
: grain :
Medium :
grain •
Largegrain
Net operating savingsInvestment in Local 5.0
Patronage refunds from RegionalInvestment in Regional 28.!?
2.3
(6.1)
tk.9
ii.8
a.2)
28.1
6.1
tt.o)
30.5
Total Net Savings
Total net savings included income earned from operations as well
as non-operating income. As was indicated local associations generally
have a fairly large investment in regional cooperatives. The regional
cooperatives returned 28.5 cents for every dollar invested in the regional
by the local cooperative. Thus, the regional cooperative investment re-
turned almost 6 times the return per dollar invested in local operations.
The large associations generally had a higher return on investment in
regionals.
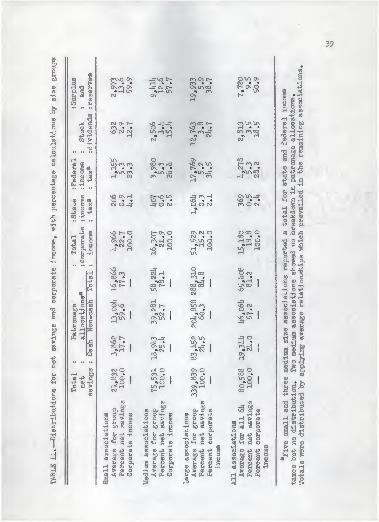
Distribution of Net Savings
The distribution of net savings is shown in Table 11. Patronage
allocations to members accounted for an average of 81 cents per dollar
of total net saving. Of this amount, 2h cents was in actual cash payment
and 57 cents was retained in the association as deferred patronage refunds,
which will be paid out at a later date.
39
ft1o
•n
I to © cn,no On 3^ r% onc~- OUN ONGO
3 > t«- • « r»A • • CM • • •H© H TJ Jh 0\ ra On JW>- OWACO t— On O PI ft g © •»H1A •» r^\ •» 1A © CO
•H u 3 ©3 ©CO s-<
CM On On C^-CO H SS8Jfr
GO©•H -H »
to P cfl
© -d H eg
Go
.* Co ©
WO\C- S^ r^co C—nO • •
rNir\u\ cfl O &pu o G
•rl O x! MO CM CM tAmiA C~- rr\_3 oo r^co © H -H-p P -H iH » H « CM •» H OH C3 CO > CM CM CM © Cfl -rl
•H H ch eg
3
iX) © sAMU)
G co UH US O On CO co Go ta © \£\f^\rn CO CN-3 nO CM \A t-~m CM O ©
.£ ° 2cos© G -P
On • • r*- • • CM • • © u si• «»1A f\ •ar\-3 •»1A_3- *UNCO •P +5 -PbO r-l CM f"\ CM t— 0^ -3 CM CO 3
3i
H P ft G&h -H 00 tH
G
EI nQ On H >-nQ1^ jnH OnU\_3- R° « ©.
© g cfl
P O «to o 3
O • • NO • •O O CMnO • • ^ CH
cm o_m JON nON H o cfl
-p G -p H co >a >•
.c•p
CO -H p jw ©O cfl t.p © &.
b3 ^> A
CD-p 0) nO C- O E— On O On CM O O co O
I H CO S \0 • • O • • CM • • CO • • OI
CO U O On CM O cn, H O 1A1A Q H CO O T) OtI-P O O »CM O •>CM O »H O
woo
sp ft c _3 H NO H
P"
1
r-t H UN HO O o CO
•H O Ml ^ ftCD O iH
no r*N,
_3 O co•P H OJ H H CO O CM CO CO
CO CO co • CM • , 0^ . -=* ? . to cU -P
NO f- 1
•»COCO c- 1 oo co 1
»H 1
\ACO 1
G © Oo O O C «H
tEh H UN CO NO •HOP
« CM p -h cq3 +» Ho
o G J=! _3 H CO J- •rl CO ©CO o CO OnQ co r— incN, £°i O -H Ch
*o tiO-H CO ° • . CM • , CO • 5 oc
G CO ¥»ON 1
CN.1A 1
%CMOnUN 1
•O 1^NO 1
»r- j
NO UN 1
CO O CD
a CO CO bOO O G r-l c\ ^^j 3 © 3
CO u o o CM 3 MM -P iH 53 © ©c CO r-l N S >
iP-. CO CJ C— fA_3 CM1A -3 O •H 3 3
X! NO • , -3 . 1A • -^ * . © -H
ito
CO
co r-J OnUN 1
»CM 1 •»CM 1
CA-3 1
-> 1 slffo H CO 0^ On
-a o ^f
S tH ft
-p
a
r-l CO H
(0 CM O H O ON O CO Ob H bp
3 -P GO • .
try> * . f\ • CO • 3o CO O 1
*o 1
in o»o 1
co O 1
•»o«H •P ID-H © • f>»O G > H H U\ H On H C H HS^CO E-l CO OJ C- fr\ co
0) r^ •P -H T3o -P ©•H CO CO XI 3 P-P3
8 IN I
w a g (X G° ©-3 bpnO G ©
G ,Q 3.O G Zt -rt V B 3 «rl P •H -P U -H•H O o > B G O > co <-l > co H -P £s
U O %, CO O•rt W) O
•H U CO O O U co )h CO H CO tnG CO CO O
H © -PP P bfl © © H ho n o 3 -H ©to -P G co G +> a. O iX B TJ -H•H CO U -P -H •H U .p -r-1 CO U P fn •H h -P U © -OQ •H O © O O «B •H O © O +> O CD O OI
O «H G © o c*-i G ©o oCO © +» -P I
CO 'H G O © G ©O -P CO P •H © > U
• CO CO +3 CO CO CD -P CO O © -P +» 3 •H -p mi-H © B G b cfl t£ G ft K W> G G O O be G G O fc 3 &H cfl cfl CO O C3 © O CO CO © © O CO CO © © o « X>hoa. E U o ft
3 © s-i ^hppC
© © U U -Hco «-i p O GCO © fi U -H
to
3 H © £ U W HrH > © O •rl > © O tUO > © © > © © © 3
H CO «3j Oi O •a •«< ol, o h «< a, ex, H < a. a« XPCO ] J 3 3 O
•P E-»

Uo
Total corporate income is total net savings after patronage al-
locations have been made. Cooperatives paid on the average 2.1* cents
state tax and 28.2 cents federal taxes per one dollar corporate income.
Dividends paid on stock accounted for an average of 18.5 cents per dol-
lar corporate income. Slightly over one-half (50.9 percent) was retained
in the association as surplus and reserves.
The tiro larger groups distributed a larger amount of total net
savings to their members than did the small associations. The larger
group also returned a higher percentage of the patronage allocation in
actual cash than did small associations.
Summary
In summary the average grain association in the study had assets
valued at $836 thousand. Slightly over half of total assets were fixed
assets, indicating a large investment in fixed plant and facilities.
The most prominent difference in asset composition by size group was
that medium and large associations proportionally had smaller invest-
ments in regional cooperatives.
Manbers owned on the average 60.8 percent of the assets of their
association. Members of large associations owned on the average 65.3
percent of their assets compared with 53.5 percent for small associations
and 59.2 percent for medium associations.
About 60 percent of the $1.5 million sales were grain marketing
sales. Because of low grain margins (2.5 percent of sales), marketing
sales only constituted 10,5 percent of gross operating income. The
Ill
remaining portion of gross operating income consisted primarily of income
from farm supply sales (1*2 percent), storage and handling income (37.7
percent), and service income (7.7 percent).
The amount of grain available for storage has decreased markedly
in the last few years. This fact is reflected in the reduction in rela-
tive importance of storage income since i960. Storage income in i960
made up on the average 62.1* percent of gross operating income, compared
with only 37.7 percent for associations included in this study. A sim-
ple linear regression equation indicated that net operating savings
changed 5l cents for every one dollar change in storage income. Thus,
reductions in amount of storage would appear to have a large effect
on the amount of an association's net operating savings.
Large associations appeared to have some economies as a result
of their larger operations. Large associations required fewer expense
per one dollar gross operating income than did small associations.
Percentage return on investment was computed for each size group. These
averages indicated that the larger associations had higher returns on
investment than smaller associations. Standard deviations computed on
percentage returns on investment for each size group indicated that small
firms, in addition to having lower returns, also had the largest variations
in income. Large firms, in addition to having higher returns, had less
variation between firms in the group. Thus, although the level of return
was related to investment, other variables also had large effects on amount
of savings.

U2
A comparison of farm supply inventory turnovers with those of a
study conducted in 1959 on selected "above average" farm supply co-
operatives indicated that inventory control had become a major problem
for cooperatives. Farm supply inventories turned over almost twice as
fast in the 1959 study as was found to be the case in 1963. A multiple
regression equation indicated that net operating savings changed $22.7b
for every .1 change in inventory turnover per year and 32.9 cents for
every one dollar change in gross margin. large associations on the average
were able to maintain a faster farm supply inventory turnover and higher
gross margins than the small and medium associations did.
ANALYSIS BY PROFIT LEVEL AND SIZE GROUP
When operations were compared among profit levels of the three
size groups several differences in composition of income were noted.
One of the differences was the relative importance of storage and handling
income among profit levels. Storage and handling, as a source of income,
seemed most important to the success of small and medium-size associations
so they will be compared first.
Both small and medium-low profit groups had smaller grain sales and
larger farm supply sales as a percent of total sales than did high profit
firms. (See Appendix Table 21.) Medium-low profit firms even averaged
more gross operating income than did the medium-high profit firms (1.6
million versus $1.1 million). Income from grain storage and handling was
almost twice as important for high profit firms (Ww5 percent for small
and 50.8 percent for medium) as it was for low profit firms (2l*.0 percent
for small and 29.0 percent for medium).

U3
Large associations appeared to be quite different. Large-high
profit firms received less than one-third of their gross operating income
from storage and handling as compared with large-low profit associations
which received ho percent from storage and handling. Large-high profit
firms were well diversified with aljnost one half (U6.3 percent) of sales
coming from farm supply items, compared with 37.8 percent for large-low
profit firms.
The balance sheet, statement of operations, expenses, gross margins
and inventory turnovers for selected items, are illustrated in Appendix
Tables 19-2U.
Ratio Analysis
A more meaningful interpretation of a firm's financial statements
can be obtained when key items in the statements are expressed in re-
lation to other items. There is not just one single ratio which manage-
ment can compute to explain a firm's position. Several ratios, each show-
ing certain relationships hetween selected key items should be computed
and compared in light of each other. A ratio can indicate the position
the firm is in and is indicative of certain weak points, but ultimately
it is up to management to interpret a ratio correctly and to start cor-
rective action.
Ratios which were computed and compared are commonly classified as
(1) liquidity ratios; (2) solvency ratios* (3) operating ratios; and
(U) profitability ratios.

I*
Liquidity Ratios
Liquidity ratios are measures to determine ability of a firm to
meet its current obligations. One of the most common ratios used is the
current ratio, computed by dividing current assets by current liabilities,
A ratio of 2:1 ia often considered a minimum acceptable standard. The
average for all associations used in this study was 1.59:1, somewhat less
than the standard. Small-size firms had current ratios averaging 1.1*3:1,
medium-size firms 1.53.1, and large-size firms 1.72:1. (See Table 12.)
With the exception of the medium-size firms the high profit firms had
better current ratios than the low profit firms had. (See Table 13.)
The only firms which met the standard were large-high profit associations
which averaged 2.27:1. Only one-fourth of the firms in the sample had
current ratios of 2:1 or better.
The acid test ratio is computed by dividing liquid assets (current
assets minus inventories) by total liabilities. Only quick current assets
are included, since inventories are less liquid and may require some time
to be converted into cash. A commonly accepted standard is 1:1. Only
eleven associations met this standard, and the average was .52:1. Small
firms with ratios averaging .55:1 were in a better position than large
associations with ratios of .I48JI. Except for the medium-size firms
the high profit firms were in better positions. Those ratios indicate a
possibility that the associations have either unusually large accounts
receivable, are holding excessive inventories, or have large current
liabilities.

h5
TABLE 12.—Liquidity and solvency ratios, by size group
Average ail :• •
associations : Small : Medium : Large
Liquidity RatiosCurrent ratio 1.59 lM 1.53 1.72
Ac id-test ratio .52 .55 .51 .U8
Supply accounts receivable/current assets {%) 18.0 20.6 20.6 lb.
2
Accounts receivable (%)
0-30 days U7.6 31.6 38.7 66.U
31-90 days 20.7 25.h 2li.O 13.6
Over 90 days 31.7 38.5 37.3 20.0
Inventory/net working capital
(times) 1.13 1.6U 1.52 1.29
Supply inventory turnover
(times) 6.2 5.7 5.9 6.8
Solvency RatiosMember equity/total assets {%) 60.8 53.5 59.2 65.3
Fixed assets/member equity {%) .85 .ft .89 .80
Accounts receivable divided by current assets will give an indi-
cation whether accounts receivable are excessive. A generally accepted
standard is that receivables should not exceed iiO percent of current
assets. Associations in the study averaged 18 percent of their current
assets in accounts receivable. High profit firms had on the average
four to six percent less of their current assets in accounts receivable
than did low profit firms for all three size groups.
Amount of accounts receivable outstanding does not tell the whole
story. To determine if accounts are collectable, their age must be con-
sidered. For example, accounts under 30 days are fairly liquid assets,
while older accounts may be more doubtful. Only 20 percent of the large
association's accounts receivable were over 90 days old. Small firms had
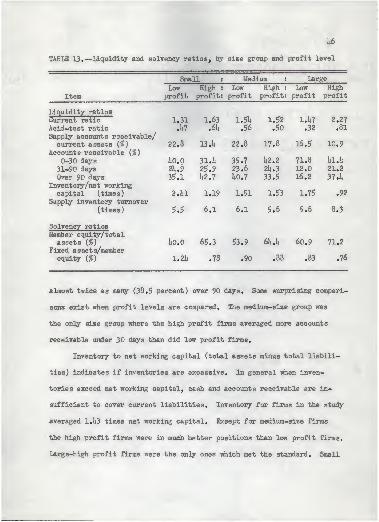
TABLE 13.—Liquidity and solvency ratios, by size group and profit level
Small : Med:ium : Large
Low High : Low High : Low High
Item profit profit
:
profit profit: profit profit
Liquidity ratiosCurrent ratio 1.31 1.63 1.51* 1.52 1.1*7 2.27
Acid-test ratio .£? .61* .56 .5o .32 .81
Supply accounts receivable/current assets (%) 22.8 13 .1* 22.8 17.8 16.5 10.9
Accounts receivable (%)
0-30 days 1*0.0 31.1* 35.7 1*2.2 71.8 1*1.1*
31-90 days 2i*.9 25.9 23.6 2lu3 12.0 21.2
Over 90 days 35.1 1*2.7 1*0.7 33.5 16.2 37.1*
Inventory/net workingcapital (times) 2.1a 1.19 1.51 1.53 1.75 .92
Supply inventory turnover(times) 5.5 6.1 6.1 5.6 5.6 8.3
Solvency ratiosMember equity/totalassets {%) 1*0.0 65.3 53.9 6I4.U 60.9 71.2
Fixed assets/memberequity (%) 1.21* .78 .90 .88 .83 .76
almost twice as many (38.5 percent) over 90 days. Some surprising compari-
sons exist when profit levels are compared. The medium-size group was
the only size group where the high profit firms averaged more accounts
receivable under 30 days than did low profit firms.
Inventory to net working capital (total assets minus total liabili-
ties) indicates if inventories are excessive. In general when inven-
tories exceed net working capital, cash and accounts receivable are in-
sufficient to cover current liabilities. Inventory for firms in the study
averaged 1.1*3 times net working capital. Except for medium-size firms
the high profit firms were in much better positions than low profit firms.
Large-high profit firms were the only ones which met the standard. Small
ii7
firms were in poorer positions averaging 1.61 times net working capital
versus 1.29 times net working capital for large firms. In addition to
having large inventories, small and medium-low profit firms also had
much more of their inventories in the form of farm supply items than did
other profit levels. This situation may be noted in Appendix Table 19.
Inventory turnover is computed by dividing cost of goods sold by
the average inventory. This ratio helps determine the probable length
of time required to convert inventories into cash or receivables. A
low ratio may indicate overinvestment in inventory, slow moving items,
or poor merchandising ability of management. The average farm supply
inventories turned over only 6.2 times per year. Large associations had
faster farm supply inventory turnover, but variation between profit levels
was not consistent.
Solvency Ratios
The most commonly used measure of long term solvency is probably
the relation member equity to total assets. This represents percent of
total assets owned by members. In general, the lower the ratio of member
equity to total assets, the greater is the risk in the association's
methods of financing. A commonly accepted standard for this ratio is
67 percent. The associations averaged 60.8 percent, somewhat below the
minimum. One-third of the associations met this standard. Member equity
ranged from IjO.O percent of total assets in small-low profit firms to
71.2 percent in large high profit firms. This ratio improved as size
increased and was better for high profit firms in each size group.

U8
The ratio fixed assets to member equity measures the owned capacity-
supporting a firm's equipment and facilities. Too large an investment in
fixed assets means there is less internal capital available to finance
current operations. Fixed expenses increase with overinvestment and the
breakeven volume of sales increases. An indicated satisfactory maximum
is that no more than .65 to .75 of member equity should be tied up in
fixed assets. Smaller percentages are more favorable. Firms averaged
.76:1, and ranged from 1.2ii:l in the small-low profit group to .76:1 in
large-high profit firms. Grain associations had very high investments
in storage facilities which may explain in part why they failed to meet
this standard. A ratio of more than 1 to 1 would indicate that a firm
was borrowing money to finance daily operations. These two solvency
ratios readily indicate why low profit firms are poorer credit risks
than high profit firms.
Operating Ratios
Operating ratios measure how efficient the firm's resources are
being utilized. Gross operating income to building and equipment indi-
cates how efficiently fixed assets are being used. Normally sales is
used instead of gross operating income to indicate how many times assets
turn over during the year. However, since sales was not considered an
accurate measure of volume in grain cooperatives, gross operating inc
was used. This ratio was intended to produce a comparable measure. A
high ratio indicates more efficient use of assets. Surprisingly the
large-high profit group was the only high profit group having a higher
ome

k9
ratio than low profit groups. Storage and handling income per $1.00
building and equipment was considerably higher for small and medium-high
profit firms. Large-high profit firms were the only firms showing smaller
storage income per fl.00 investment in buildings and equipment. (See
Tables lh and 1$.)
Efficiency can also be measured by determining amount of input
required to produce a given output. In this case a small ratio would
indicate higher efficiency. Total expenses to get $1.00 gross operating
income averaged 82.7 cents. Expenses per $1.00 gross operating income
ranged from 107.8 cents for small-low profit firms to 70.3 cents for
large-high profit firms. High profit firms consistently were more ef-
ficient in producing $1.00 gross operating income. Expenses per $1.00
gross operating income also decreased as the size of a firm increased,
indicating large firms did have some economies due to their larger oper-
ation.
Salary and wages per $1.00 gross operating income ranged from a
high of 53 .U cents in the small-low profit firms to 31.U cents in medium-
high profit firms.
Profitability Ratios
Gross margins (sales minus cost of goods sold) divided by sales
gives the amount of gross margins realized per dollar of sales. This
margin, together with income from services must be sufficient to cover
all operating expenses with something left over if an association is to
realize any savings from operations. If storage income continues to

50
<Dtou
a,
gubfi
CD
N•HCO
C43
o•HP«
3•H
o
c=•H•P
2a
I
H
o
toH C.-I O« >H
-PCD to
bO-Hto oJ-. oCD to
>
^J H t^- On vO o c*nu\ H• • • • • • • • •
o CO OS CA os C— CM 00 SOUN H c— CS. H
US OSJ- OS• • •
CM OUN
LA
oo
H
oo
SO
H co• •
O CM
• •
CO rHOS
CS.
co
vO rr\\C OO CA _^u\_3* • • • • • •
^ wt~ -3 OS cmco^
cs, cm u\ cs. u\ 00 en so
en-3
H r^vlA CM UN 9
Os
vO
c— r- us CMUWO O -=r CN H O• • • • • • • • • • •
OS CM Os in cm r— us Os CM OS USCO fs tH i-l
»j 1 3 >*.^
c3 a. >»
Jh CO 43•H U h O UTj CO COf-I -H P CO,
CO CD CO -P iHCD J3 CD '-v CD 3> S H'te?. CO a1
•H no tO «H O3 H > 5 CD ft) w CO CD
S tfi to
me/b/bui /ele
.) tingross
^.*-»^^ CO\ \ CD >iCO CO S f-J CD—%$.*«. bp
•rlW. t\ C O CDO bp m 3 to bfl*-^ c *-* cp h\
C >A -H **. -rj\ CD CO
CO tHC CO 03 fc>
•H C C to
{, -^ > .H -P S•H CO C3 "^^"^v
CO r-i CO if) CO CO
CO C bp tp•H^-'rH^-'p-l to OiCD p bO«H -rl CO
COOH
X) T3 -P O bjbp-P C -P C G fflqCcocScoto^•H CD X <D XI O CO
1U bO bO
(i fc MP fa •H H -H tO > >PS S sxOT)^ p CO P »—
-
P P &4 CO (0
CO C CO CD » COM U -H S -rj C >»bD COwe ^ a 3 u-p\a. o* ct -h n eOCDCDCDCDoCDCDS
•H CO CO CO toH O CO CO u r-t tcHi, a
3•H L cd as
So u u a.bO bO O O
CD (D O P -pXI
•H
a >» a m ©P u c cp bo tx « co -HtO'OtO'rtCOB.C^O0lCfHC»HffltDt0HO to O ffl O Q.H -rJ
i^CHH •H CDH 3 -H X! H HO
Q.TtcOcOG.cflO'cOPtfl.TJa, tO P -p -HP CD-P O-P-P
5 fc -P -P X ton co w co 4 p u pCO O Eh E-t
O O OO

51
CO
>
P•H<*HO
•s
a.
I
bo
(D
N•H03
jfr
09
O•HP2
>•HrH•H
8-p•H<HOEa,
"8
nj
£P•H•PCOECO
f
CO
H
CM CN,. •
On O $ tt
0\^t CM
C\ On
f"\
V)
cn. p— co...-=t cm r-H H
CN•
-3
-a.
COH10.0 89.2
1A•
CM
_^ r^co...eg H r—
o M3•
vOvO CM. . •HCO^
CM•
cn.
CO.
CM
1AvO. •
rH HH P-
-3
HOso in...vO CM P-
CM
co
CJ•
3. . .
p— H p—H rH
o•
CO
On•
r-H
o. p-. .
eo_^ON
.CO H P-...C-\ CM p~H
•
0\
vO CO p-» . .
OIA OrH
On•
o-a
CM.
coH
O o. .
os r-p-
•tn^JCO... O
•
NO
OO
OH
CM On CM...CM OnIAH
OO
CM-3
CN, ON CO. .
NO P- cnTA
co o m o... •
H r^\vO CMP*1
°?
% • •
c« "2 »| -p 3
CJ*
5c«
ffiP
S re tl CO -p•H
V U o u CO re CD 4J -H73 o q o> CO Xi (D CO 3rH•H
•HT3
-p So,CO -ho 1 1
H W 5"re to coto co3 pH B •H 1
4 •H3
CO bO »H iT co-^ "V.>A'~v ^-^ CO > ^ 2 Z u
CO S rH 0)
j < B'StI O\ • -P uw *«.%«<. S)
ibD O qj XlCOPSo 6£ bC 3 CO 153
•H\ CJ WrH CO ft <D
a CO tH •H ^H P! O CO
1•HC
•iriHo•H-P
C 11 CO >•h c c abO-rH -rH CO
>rew
> tH p §C3 N.Nre to co to
C bO boCO Tl O-P O M
>5
tt W) M
-P •H: 1
c c «re <d w *X! O 00
re fn t. beS re re cT-~<
e 3 -h w.
bCiH c qC P -H -Hh re > >1 +3 ^ Ofl^ P CO P • P s-' +3 Vi re re
re a> co to
ti ftA CO * TJ -P T3 . rt C^. •H to co co re re
fj c B C C >» bO «^ rH O a, c I, H U r~t
rCD (0 co re P^v •H tt O O CD c re 0) O-P-Pft t: F^ •H CO to © Xl Mil ti ft O
&3rH
ft CO CO—
'
o ft 0> Ci m o o o I re bfl bo o o u q c4*S3 fl
bOiH(8 3
ac re m .h ore a. c u o
P•rl HCHH
ft-H re rea, re p -p
(H COH XI rH HMa
mo
O1 rio 9
h re <d re cO O fLrH ^1p >? reCO WW
<4H
OCH 5.5 co -p re reP OPP
9 5 PCO £ 3 fc o o
CO C5 E-» Eho o o o
E-t EH 6-1

52
decrease, margins on sales will become increasingly important in cover-
ing expenses. Although competition affects the level of gross margin,
an association may be able to set within reasonable limits what the
margin will be. An association can either take a large margin and refund
the difference later or operate on a low margin and give the patron the
benefit of his day-to-day transactions. Margins varied with the type
of commodity being handled. In the study gross margins on grain were
considerably lower than farm supply margins (2.5 percent against 15.2
percent). Some of the reasons are that farm supply margins must be suf-
ficiently high to cover extra services such as delivery, credit exten-
sion, etc., demanded by patrons. Gross margins for major products by
profit levels are presented in Appendix Tables 23 and 21*.
Gross margins on sales averaged 15.2 percent for farm supplies,
2.5 percent for grain, and 7.6 percent for total sales. Larger firms
maintained smaller margins on grain and higher margins on farm supply
sales. Gross margins as a percent of sales was higher in the larger
size groups. High profit associations maintained higher margins on
grain, but only medium-high profit associations had higher margins on
farm supply sales. The large-size group was the only group showing
higher percent total margins for high profit firms. High margins,
coupled with faster turnovers were certainly one of the explanations why
the large-nigh profit firms were more successful.
Net operating savings were considered as a percentage of investment
in local, member equity in local, and total sales plus other operating
income. These are efficiency ratios relating net operating savings to
53
resources used, to member investment in local, and to volume of business.
The average association had a 5 percent return on investment, Q .li
percent return on member equity in local, and saved 2.3 percent of every
one dollar of sales plus service income. Since the associations were
separated according to return on investment the high profit firms, as
would be expected, had higher ratios.
Ratio Analysis by Profit Levels
The ratio analysis indicates that high profit firms maintained
current ratios of 1.52-2.27:1, and acid test ratios of .5o-8l|l. Low
profit firms had current ratios of 1.31-1.51:1, and acid test ratios
of .32-. 56:1.
These differences were not tested statistically to determine if
they were significantly different. However, visual inspection indicates
that there were differences between profit levels.
High profit associations had higher liquidity ratios indicating
they were in a better position to meet short terra commitments, and take
advantage of purchase discounts than were low profit associations. Even
though high profit firms were in better liquidity positions, many high
profit firms did not meet the accepted standard of 2:1. When the acid
test ratio was computed, neither of the two profit levels met the ac-
cepted standard of ltl, although the high profit firms were in a better
position. This ratio indicates that both profit levels had insufficient
quick current assets available to meet current liabilities.

5U
Accounts receivable as a percent of total assets indicated that high
profit firms had less of their current assets in accounts receivable. High
profit firms also had less of their net working capital tied up in inven-
tories and generally had higher inventory turnovers. Excessive inventories
are expensive to maintain, and the possibilities of theft, damage or
obsolence exists. Excessive inventories seemed to be a general problem
of most of the associations in the study.
Variations in liquidity between profit levels can be compared by
these significant ratios!
Low profit High profit
Current ratio 1.31- U$ktl 1.52- 2.27:1
Acid test ratio .32- .56:1 .50- .31:1
Accounts receivable/current assets 16.5 -22.8 10.9 -17.8
Inventory/net working capital 1.5l- 2.iil:l .92- 1.53:1
Supply inventory turnover 5.5-6.1 5.6-3.3
Ratio analysis also indicated that there was a large difference
between funds from creditors and equity for the profit levels. High
profit associations relied less on short and long term debt and more on
member equity as a source of funds than did low profit firms. High profit
firms also maintained less member equity as fixed assets and therefore
had a greater percent of their equity in a more flexible form. Both
these ratios show why low profit firms are poorer credit risks. Solvency
ratios computed are the following:
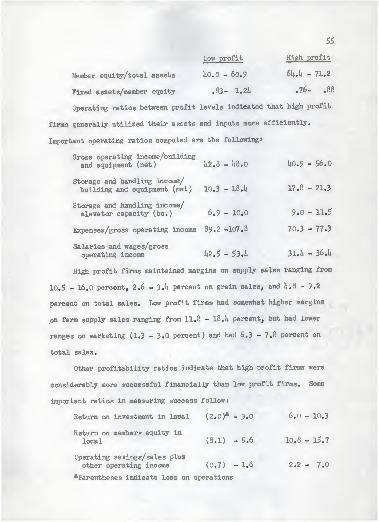
55
Low profit High profit
Member equity/total assets liO.O - 60.9 61*. 1* - 71.2
Fixed assets/member equity .83- 1.2l* .76- ,88
Operating ratios between profit levels indicated that high profit
firms generally utilized their assets and inputs more efficiently.
Important operating ratios computed are the following t
Gross operating income/buildingand equipment (net) 1*2.8 - 1*8.0 1*0.9 - 56.0
Storage and handling income/
building and equipment (net) 10.3 - 18.1* 17.8 - 21.3
Storage and handling income/elevator capacity (bu.) 6.9 - 10.0 9.0 - 11.5
Expenses/gross operating income 89.2 -107.8 70.3 - 77.3
Salaries and wages/grossoperating income 1*2.5 - 53.1* 31.1* - 36.1*
High profit firms maintained margins on supply sales ranging from
10.5 - 16.0 percent, 2.6 - 3.1* percent on grain sales, and 1*.8 - 9.2
percent on total sales. Low profit firms had somewhat higher margins
on farm supply sales ranging from 11.8 - 18.1* percent, but had lower
ranges on marketing (1.3 - 3.0 percent) and had 6.3 - 7.8 percent on
total sales.
Other profitability ratios indicate that high profit firms were
considerably more successful financially than low profit firms. Some
important ratios in measuring success follow:
Return on investment in local (2.0)a -3.0 6.0- 10.3
Return on members equity in
local (8.1) - 5.6 10.8 - 15.7
Operating savings/sales plus
other operating income (0.7) - 1.6 2.2 - 7.0
aParentheses indicate loss on operations

Summary
In summary differences were found in composition of income among
low and high profit groups. The large amount of storage and handling
income contributed to the success of small and medium-high profit
associations. Large associations appeared more diversified. Income
from farm supply sales was relatively more important for Large-high
profit associations than for large-low profit associations.
Ratio analysis indicated that most of the associations had fairly
poor liquidity ratios. The large-high profit associations were the only
ones which met the generally accepted current ratio standard of 2:1. Acid
test ratios computed for the different size and profit level groups also
were lower than the generally accepted standard of 1:1.
Ratio analysis indicated that most associations had excessive
inventories even when divided into profit levels. Inventory turnover
was slow and sheared little consistent variation among profit levels.
Gross margins on inventories also showed little consistency among profit
levels. Consistency was noted when changes in farm supply turnover rates
were compared with changes in percentage gross margins among profit levels.
In every case the profit level with the lowest gross margins had the fastest
farm supply inventory turnover.
High profit associations were in a better long-run financial position.
They had from 6k to 71 percent of their total assets financed by member
equity. Member equity in low profit firms ranged from liO to 6l percent
of total assets. Most of the associations had less than the desired
amount of member equity for the amount of fixed assets, although high
57
profit associations were in a better position than were low profit
associations in this respect.
The ratio gross operating income to building and equipment indicated
how efficiently the fixed assets were being utilized. Surprisingly, the
large-high profit associations were the only high profit associations
which made more efficient use of fixed assets than did low profit associ-
ations. One explanation might be that storage, which was more important
in small and medium-high profit associations, required less expense per
dollar gross income. Thus, although small and medium-high profit associ-
ations made less efficient use of facilities, expenses per one dollar
gross income were sufficiently low to allow more net operating savings.
Expenses per one dollar gross operating income were considerably
lower for high profit associations. Expenses per one dollar gross
operating income for high profit associations ranged from 70.3 to 77.3
cents compared with 89.2 to 107.8 cents for low profit associations.
High profit firms paid 31. h - 36. It cents for labor per one dollar gross
operating income compared with k2,5 to 53. h cents per one dollar gross
operating income for low profit associations.
EXTENT AND TYPE OF DEPARTMENTATION
Even when associations separate their major revenue items satis-
factorily, expenses must be matched with that revenue to get an accurate
idea of the contribution a major product or service makes to the associ-
ation. Take, for example, an association having three departments: grain,
fertilizer, and petroleum products. The economic contribution of each of

58
the three departments can't be determined unless expenses are maintained
separately for each. Also, separate expense classifications are needed
if efficiency of inputs used in each department is to be evaluated.
In the study, kl associations had headquarters operations only.
Of these, only 6 had departmentation by product. (See Table 16.) The
other 36 maintained revenue and expenses only for the firm as a whole.
TABLE 16.--Associations having departmentation by products and locations
«* Number of different product
Number of associations •* expense classifications
Headquarters operations only 352
2
11
HI
lb
2
3
i7
Headquarters operations and-ib
one or more branches 62
1
1
3
5a
2*
20
lu
2
3
h56
7
£by location only
a0ne association in this group had both product and location
departmentation.
One expense classification for the firm.
59
Twenty-three associations had branch operations, six of which main-
tained expenses only for the association as a whole. Fourteen associ-
ations with branch operations had separate expenses for two or more products.
Three associations had expenses by location only (for each branch)
and three associations maintained as many as seven different product ex-
pense classifications. Associations with several branches ideally should
have product departmentation for each product. However, only two associ-
ations with branch operations had product departmentation for each branch.
Table 17 shows percent of total departmental sales coming from the
major product in that department. In seven departments the major product
accounted for less than 50 percent of total departmental sales. It is
questionable whether these should have been classified as product depart-
ments. Included in this category were two elevator departments, two feed
and merchandise departments, two petroleum, and one hardware department.
A reasonable minimum is that no less than one-half of sales should
come from one or more closely related products. To approach true product
departmentation sales of similar products should exceed 90 percent of a
department's sales. Only $8 departments derived over 90 percent of their
sales from a major product.
Sixteen associations reported an elevator department and four
reported a grain department. A primary difference was that, in addition
to grain sales, the elevator departments handled other merchandise while
the grain departments handled only grain. The petroleum department con-
sisted of departments called petroleum (7 associations), oil (1 associ-
ation) and service station (6 associations). A difference was that service

60
TABLE 17.—Associations with one or more departments and percent major
product is of department sales
• Number of :• •
• :
Department : associations! Under S0%: 50-90*: Over 90$: Total
(number of departments)
Elevator 16 2 15 10 27
Grain h 5 5
Petroleum Ux 2 15 8 25
Bulk petroleum 5 7 7
Propane 5 l 6 7
Feed and seed 2 2 2
Feed and merchandise 3 2 2 UFeed mill 3 3 3
Fertilizer 2 2 2
Lumber yard 3 3 3
Hardware 3 1 2 3
Hardware and lumber 1 1 1
Hardware and oil 1 1 1
Appliances 1 1 1
Grocery h h k
Produce 1 1 1
General merchandise 2 2 2
Transport trucks U -» - k u
Administration 8 - - m 8
Non-patronage 2 - OT» *• 2
Soybean plant 1 " " ** 1
stations obtained only 25 to 75 percent of sales from petroleum products
and the petroleum and oil departments obtained 75 to 100 percent of their
sales from petroleum products. Although feed was a major supply item,
none of the associations had feed departments. Feed was listed together
with seeds twice and merchandise three times. In two of these departments,
feed made up 70 and Li6 percent of sales, and in the other fertilizer made
up 68 percent of sales.
Sales, gross operating income, and expenses were tabulated by depart-
ments in an effort to determine the contribution departments were making.

61
These were the only measures available since assets by department were
not available (Table 18)
TABLE 18.—Averages for selected ratios for departments cilassified
by products
: Expenses per: $1.00 gross Expenses i Savings
Department : operating: income
per $1.00: sales
per $1.00salesKind Number
(cents)
Elevator 25 79.9 a a
Grain h 82.1 a a
Petroleum 25 89.U 19.5 1.8
Bulk petroleum 7 80.1 18.5 li.l
Propane 7 62.U 20.6 9.6
Feed and seed 2 96.9 uu.u 1.1
Feed and merchandise h 107.5 13.8 (0.5)
Feed mill 3 81.7 13.7 3.2
Fertilizer 2 110.1 20.9 (2.0)
Lumber yard 3 73.9 16.9 6.0
Hardware 3 111.2 22.7 (2.3)
Hardware and lumber 1 89.7 22.5 2.6
Hardware and oil 1 113.5 22.3 (2.7)
Appliances 1 78.7 28.1 7.6
Grocery b 133.7 19.3 U.5)Produce 1 89.0 8.6 1.1
Transport trucks^ h ~ 78.0 22.0
Soybean plant 1 97.U 8.5 0.2
General merchandise 2 83.h 13.2 2.9
aElevator and grain department have large income from storage so
sales is not an adequate measure of output.
Computed on the basis of trucking receipts.
Expenses per $1.00 gro ss operating income ranged from a low of
62.h cents for propane to a high of 133.7 cents for the grocery depart-
ment. All grocery departments, fertilizer departments and hardware de-
partments had operating losses.

62
Based upon savings per dollar of sales, propane departments were
most efficient of all departments as they saved 9.6 cents out of each
$1.00 of propane sold. The appliance department was able to save 7.6
cents of every dollar sales, and lumber yards saved 6.0 cents of dollar
sales. The transport truck departments were able to save 22 cents out
of each dollar trucking revenue.
Although these data suggest that some departments were more efficient
than others, care should be exercised in generalizing these results. In
many cases there were only one or two observations for each type depart-
ment. In these instances, it would be difficult to say that these results
were characteristic of all departments of that type. Also, no knowledge
was available on how expenses were allocated to each department or on the
method of inventory valuation being used by each firm.
Even though a department may be losing money on operations, its ef-
fect on the performance of the whole firm must be considered. It may be
that this product is attracting customers, who may purchase other products
at the same time. In this case a department may contribute to overall
business success even though the department is operating at a loss. The
important thing is to know that it's losing money. Once a trouble spot
is located, efforts can be made to find a remedy. It may be that with a
more efficient use of inputs the department can begin making a positive
economic contribution to the business. Without product departmentation
this trouble spot probably would have gone unnoticed.
In determining what products should be classified as separate
departments as an aid to management, a reasonable guide is that each

63
department or function essentially different should be accounted for
separately. Products which have similar gross margin, similar labor
requirements and similar consumer demand should be grouped together.
The division must result in a good deal more uniformity in the receipts
and expenses within departments than between them.
Departmental accounts should be planned so they provide maximum
benefit to management, but are not unnecessarily burdensome to the book-
keeper who maintains the records. Attempting to break down the business
into too many departments will create difficulties in keeping expenses
common to one department. At the same time, to group together essentially
different products will eliminate important information.
A possible dividing line for determining whether an activity should
be separated has been set at approximately 10 percent of overall operations.
In using this guide, any activity which accounts for more than 10 percent
of total income should be separated. If it accounts for less than 10 per-
cent of overall income, it should be combined with another similar product.
In a cooperative handling products such as grains, lumber, petroleum,
and feed, management should group each one separately. In these cases,
there are substantial differences from one department to another. Many
facilities will be different. Employees probably would be working pri-
marily in one department, and customer demands for the output of each
department would be different. Under these conditions, departmentation
would be feasible from an accounting standpoint and useful from a
Robert L. Dickens, C.P.A. Management Accounting for Frozen Food,
Locker , and Related Plants . United States Department of Agriculture,
Farmer Cooperative Service, Agriculture Handbook 220, October l?6l, p. 25.
6U
management standpoint.
Some expenses, such as manager salary and general office expenses,
are common to the business as a whole and not related to a specific de-
partment. Such expenses may best be charged to an overhead department
and then allocated to each department by some reasonable basis whenever
financial statements are prepared.
Departmentation as suggested will be both feasible and provide
management with valuable information on business operations.
SUMMARY AND CONCLUSIONS
The objectives of the study were (1) to determine the success of
the Kansas grain associations in 1963-6I4, (2) to determine certain
selected efficiency and percentage ratios and to compare the ratios
between associations of different sizes and different profit levels,
(3) to determine the extent departmentation is being used, and (U) to
determine the adequacy of the accounting system as an aid to management
decision making.
The associations were divided into three size groups based on
amount of gross operating income. Then each size group was summarized
by means of averages. Large associations appeared to have some economies
as a result of their larger operations. They averaged fewer expenses
per dollar gross operating income and had higher returns on investment
than did medium or small size associations. Standard deviations computed
on percentage returns on investment for each size group indicated that
smaller groups had larger variations among associations within the group
than did either of the two larger groups.
65
Ratio analysis serves management as an aid in interpreting financial
data. However, it must be remembered that no one ratio constitutes a
final index of strengths or weaknesses of an individual firm. Ratios
are averages, and are indicative of a firm's present position. As such
they indicate "what is" and not optimum conditions of "what ought to be."
Ratios developed in this study were average figures for associations with-
in each individual size and profit level group. As such they should be
useful to individual cooperatives in Kansas. By calculating these ratios
an individual cooperative can assess its operations and see how it stands
in relation to other cooperatives of similar size and nature. Ratios of
high profit associations could be considered as indicative of above average
operations. Firms striving to be successful should compare ratios for
their firms with ratios for the high profit levels. If a particular
ratio appears out of line, the cause of its deviation should be determined
and corrective action taken.
Ratio analysis indicated that many of the associations had less
than desirable liquidity ratios. High profit associations had current
ratios ranging from 1.52 - 2.27:1, and acid test ratios of .50 - .81:1.
Low profit firms were in a less desirable position as they had current
ratios ranging from 1.31 - 1.5U:1, and acid test ratios of .32 - .56:1.
A comparison of farm supply inventory turnovers with those of a
study conducted in 1959 on selected "above average" farm supply cooperatives
indicated that inventory merchandising had become a major problem for many
of the cooperatives in this study. Farm supply items turned over nearly
twice as fast in 1959 as similar items did in this study. Many associations

66
in this study had excessive inventories. Low profit associations had
inventories ranging from 1.51 - 2.hi times net working capital. High
profit associations were in a somewhat better position with inventories
ranging from .92 - 1.53 times net working capital. Farm supply inventory
turnovers were slow for all profit levels with no consistent pattern dis-
played among profit levels. However larger associations had somewhat
faster turnovers.
Ratio analysis also indicated that there was an important difference
among profit levels as to amount of funds supplied by member equity. High
profit associations had member equity ratios ranging from 6b to 71 percent
of total assets compared with bo to 6l percent of total assets for low
profit associations. Both profit levels had large amounts of fixed
assets, but high profit firms had better ratios of fixed assets to mem-
ber equity because they had better member equity ratios.
The ratio of gross operating income to building and equipment indi-
cates how efficiently these fixed assets are being used. Large-high profit
atsociations were the most efficient and were the only high profit group
which was more efficient than low profit associations. One reason small
and medium-high profit associations were not more efficient may be because
storage was relatively more important for them and required less expenses
per dollar gross operating income. Thus, although small and medium-high
profit associations made less efficient use of their facilities, expenses
per dollar gross operating income were sufficiently lower which allowed
more net operating savings.
67
The types of departmentation used by associations in the study
were either product or location. In some cases it via s questionable
which type of departmentation was being used. For example, in seven
departments the major product accounted for less than 50 percent of
total departmental sales. Only six of the forty-one associations with
"headquarters operations only" maintained product departmentation. Of
the twenty-three associations with branch operations six had only one
expense classification. Seventeen with branch operations did have more
than one expense classification. Of these seventeen, three maintained
expenses only by location. Fourteen associations with branch operations
had two or more different product expense classifications. However,
only two of these had product departmentation for each branch.
Thus, information available in the annual audits, indicated that
most of the associations in the study did not maintain accounting de-
tails which would enable a manager to determine a major product's con-
tribution to the business.
68
ACKNOWLEDGMENTS
The author wishes to express his sincere appreciation to his
major professor, Dr. 15ilton L. Manuel, for the guidance, understanding
and encouragement given in the preparation of this thesis.
The suggestions of other graduate students and faculty members
of the Department of Economics, Kansas State University, were also
deeply appreciated.

LITERATURE CITED
70
LITERATURE CITED
Books
Haimann, Theo. Processional Management . St. Louis University, 1962.
Heady, Earl 0. Economics of Agricultural Production and Resource Use .
New York: Prentice-Hall, Inc., 1952.
Finney, H. A., and Herbert E. Miller. Principles of Accounting , Inter-
mediate . 5th ed. Englewood Cliffs, New Jersey: Prentice-Hall,
Inc., 1959.
Phillips, Richard. Managing for Greater Returns in Country Elevator and
Retail Farm Supply Businesses . Des woines, Iowa: Garner Publishing
Company, 1959.
Powelson, John F. Economic Accounting - A Textbook in Accounting Prin-
ciples for Students of Economics and the Liberal Arts . McGraw-
Hill Book Company, Inc., 1955.
Bulletins
Dickens, Robert L. C.P.A. Management Accounting for Frozen Food , Locker
and Related Plants . United States Department of Agriculture,
Farmer Cooperative Service, Agriculture Handbook 220, October, 1961.
Eichers, T. R. Inventory Management by_ Selected Retail Farm Supply
Co-ops, Area k, Kansas, Nebraska, Missouri, Iowa, and Illinois.
United States Department of Agriculture, Farmer Cooperative
Service, General Report 66, October, 1959.
Kelley, Paul L., John H. McCoy, Henry Tucker, and Virve T. Altau.
Resource Returns and Productivity Coefficients in Central and
Western Kansas Country Elevators of Modern Construction . Kansas
Agricultural Experiment Station Technical Bulletin 88, March, 1957.
Manuel, Milton L. A Decade of Farmer Cooperatives in Kansas . Kansas
State Agricultural Experiment Station BulletirT^O, December, 1962.
Sharp, John W., and Phillip C. Baurael. A Financial Analysis of Ohio
Elevator Operations . Ohio Agricultural Experiment Station Re-
search Bulletin 813, June, 1958.
71
Unpublished Material
Baumel, Clarence P. "Productivity of Management in Local Cooperative
Elevators." Unpublished Ph.D. dissertation, Iowa State Uni-
versity, 1961.
Streeter, Charles. "Resource Productivity and Returns to Scale in
Kansas Cooperative Elevators in 1955." Unpublished Master's
thesis, Kansas State University, 1959.
Sullivan, Gary Francis. "The Impact of Government Storage Policy on
the Size and Location of Commercial Storage Facilities in Kansas."
Unpublished Master's report, Kansas State University, 196l.
Taylor, Bryon Eugene. "Analysis of Economic Factors Affecting Success
of Operations of Selected Midwestern Petroleum Cooperatives."
Unpublished Master's thesis, Kansas State University, 1958.
Whitehair, Norman V. "Measuring Financial Performance of Cooperative
Grain and Supply Firms in Indiana." Unpublished Ph.D. dissertation,
Purdue University, I96I1.
Miscellaneous
Farm Facts , I963-6U. Statistical Division, Kansas State Board of
Agriculture, I96I1.
Wheat Situation Report . United States Department of Agriculture,
Economic Research Service, June, i960 and February, 1965.
Letter from Mr. Carl M. Heaton, Acting Director, Kansas City Agriculture
Stabilizing and Conservation Service, United States Department of
Agriculture. Kansas City, Missouri, April II4, 1965.

APPENDIX

73
-PJCVIrf W C\pO OJO <no\_3'coicM| CN.
M «H • • • • • • • • . . . . . • •
•rl O t— <AnO On rA Ox lAOkq O C-CM Hb§
COCM r-r H 00 cm in [la! NO
CMm
rA••:. »H
3O
3 -P•H CO CM CM vO ON r—
1
1 -3 cmKOI
Oxaiacm r- O43 & <+H • • • • • • • • • • • • • • • •
32 HlA ONOOnO H c--o C— CM CM On H 8 c^«H rA 1 H H
1 C^CM-3 HA r—O a H CM
43 *AS3 *• •* •• ,,'»-
1(1)
•p WO\rlW OLJ 1 OnHIOI 1 f-M3 r-CLAkO O CAA fcO^H • ••••• * *l * • • • •] • • •
•H O ^ _3_^vo Go.jjr— \a 0K0I CMvO MO OKO O MO10 X u 43 CM 1 h |h| CO CM1A \U\ O _=f(0 Oh c
IH co
03 1 E3 •rt a>
] +3M a •H cm <ano r-to I tAfAfcOl 1 OIAIAONL3I
1 ° O
11• ••••!• • *l • • * • -^1 * • •
t u\coc-rl caIla iaoKa O CM t- Obo O <=ei H |(A 1 H |h| 1 r-tM_=r £51 2•H a, H On05 «H
H J5 -H 00 00 oi^rli
-^ -3/ 1A1A O CM CM| O H0)
•S"B• ••••!• • • • • • » • • •
> "LTWAVO vO —=r|r~- H O H \A-Cf r-i O '-4 O CMX U |oj
IICM "J C- CM TA la! O CM
H H a rt (A
+> H•H cfl
00
<0
E 143
(4
a •H CM O t— CO CMlON I ON ION t— c^-^rco CM O On H£ CH • • • • •] • * 1 * • • • • • • • O
>> Is -3 r—-3 cm cmIo ONO On co O 00 O On O C~- T)j? h |ca H H |H NO CM_3 j- O f-
a H CM 'yto --.-
p0)
/"—
*
03
in CO -dto 03 ^ ccB O P c0
<H CO a.U CO 1
03
2O 6-1
? CO•v-x x_-* +3 OH CO CO J3
a CO O H « ^ s 03 43CO O W 03
•H co «aj
U $ ffi © CO « O+3 CO 43 S C E3 CO H 43•H H 0) Eh CO <! a. a. <»! EH H(0 J3 (0 (0 ID 2 .C ra i4 'rt -ri CiJ J
O
=H« 01 O K1S> r\ iH CO : ^^g a* cd a* 6=j e3 5*4 U U all CD^H «,
ft<j P
flj O O 43 t>
]11
p 43 P c33 c c Co
•H 4» O ^s-s te§hlOhhl 43 0) 1-5 «J &. ctf i-q Eh H
• > > fc <<CO & Eh
05 <! O£?Os «0 C C 3 Eh &PT3 60 Eh
H C pi-t >H 43 tH -H O O S -rl O tt!
3 c k kx: -h co a)
43 E-« •rl 03 t4 Eh u to
g(0 J4CO
TJ 03 -aH (DHfl•rj 1-5 ^H C apo 03 aj .C .C > 43
* O U P -PO <«! O O O c 2M O=f 3 CO
m cq J a

7U
•PA -rl OODH H o\co|r-|
1°° On O ^} no -3- On|cj !
fA
•rT o• • • • • #
l • • • • • . . . , •li\ rl\0 9 «A HjlAl CO r-On Ocq OlH 8H
co
= £ih|h|
1 CM -3 H |r>- nOCM
» •>
(0 © CA
g^.'-V
o 5 43M •H OjH LA co coko H cncomD cojOOn
1 O NO£ «H • • • • • •] • • • • • • • • • • •
1 5 cm \a-=j- H cvj _3ir— On MD "LA O CO OO rH O O 0-•-3 *h H CM H |r—
t
f\ H CM •O O c—•rl S. H CMn
•• •• ••CA0t
H •px; >h U\ CM_3|H fA cm [IA MD -^JMD CM ON O fAUJ O fA
|«H • • •! • • • • • • • • • • •] • • •
> •H O -ifvo r-po c— P- IA Hf-O ON-3 i-HLzI O NO© X u H H H *\ H H CM KO O SH & H fA
P•rl §«H •rlOU 3 -pft
__, M •rl t— fA CM CM ON O ON H O CA t— -S; ONMD r.\ O OH £ •H • • • • • • • • • • • . . • * • •
!>» C8 Q O O co_=* fA CM CM NO O <A O CM 1A t-i fA O coX> -P 3 (4 H CM H H CM —^J rH CM H IA q O
O a H OnW•* •• ••
oa4
<D -P •px! yn H HvO X) cm r— ON C~- 1A H O On f- H IcA H
^ © bfl*H • • • • • • • • • • • • • •[ • • •
Q) o •rl O \a r-^a <Q On CO C— -=f ON ON O CO "LA cmIia CMX> ^ X u rH H fA H cm k) CM
d
mem
as
pe a H fA-
a(0
u(0
I-p•rl HlA ON-A •UN. O LAI C H O- On C--1A H 3 O ON 5
© ; -. tM • • • • • • •j
• • • * • • • • • •I O O cA\A-d|rA On 0- © c CO\A O C~-nO H O c— XI•H P-3 fc rH |<M rH H rA NO H -c O t—•P Q. H CM <H-rl OH•H m43 CO TJ
45 COc
H ElM HM ©3
«H CO hP En
1 B5
o CO H•H m 3 a x:
•p-p 3 M CO «H M <2
o •rl H CQ w 0) S•rl
•P •rla 1 S9 ue
3
p
I X> E-<
-SS3
1 a © > -P
CO =J 3J^ s3 ^-n 10 o< gO O fl) (D (D "jO t. -P U W
J«j +3 -P CO )L, 3
asO H Pa M rH Qf H O
1
jfjx> H
1 °I i •0
« 0) -P p a as u T3CO XI CO
a, to v. hH J to n a "a Ti a)a, a cx^P T3 .H Q) 3 6 <w © X! XI 3 © 6h
Ch co © t3 © B O
_, s rH• 1 „ t*> b ?5
Q) Eha 4 B r-< 8o I M3Bp 3, O Eh in a O /CM -p (50 O O "OM C H CO E-< Eh C h c, L, Eh EH
9 P CO U &0 U O © 0) (U O rH Ih rHODD -p Q) a 'h a it c Q( a)
PQ -P £OOP<! s
(h x: | © 1| <h—- U A •P
11 b © -POSSQ eft O OEh

7*
§
•H
I•rlP2CD
&
CO
oubO
o•P
eC3
CO
eCDp•rl
T3©POCDHCD
CO
pc(DOUCDa
•rl
»CO
Co•rlPsCD
ao
••p
ICD
IP«P1
CVJ
9
3
t4
•p
•H OK rl
•p
CsCh•rl OK U
&
4*•Hua
£
•p
&Ctr,•H Ow u
a.
a.
aCD
-P
o\j^ r>- cm co c—
o
H r~ o\H-^IA H\0 CVI O
*n -3
mCACM rlOvCOcOO• •• • • • « .
TA o ON Of—CMOO-=f-3 -=J lf\ o
0\lA_a 0Dt>-H\OO• •• • . • • .
cocvjH OvflHcoo<n-=r xr\ \a o
1
EIa
CO H On\AU\
CACNHOOCM 40
CMCOO lf\ CVJ ,v\ o Or-ococm cvj^J
-3vO H CM O3 1A o
CN, On CM O .A iA OO OCO C\ CM
CM r-i C\
CA
o
CM
ONco
M3
r-i
vO H t>- OIA'3 mo l^-
-3-On
en
c—
CO
C-oH
fA
\A
COCM
co
If
tCOco
O fe
-p
2CDa.opCD
2
o c-
»
vO C—
OSCM
co
oH
• • •CO p- OCM H
o a• •
o oCM
O\0O• •
CM HCM
CA CN• •
vO HCM
CO
MD
vO-3
en
1ACM
-3
oCM
8pCD
c
CO
-PoEn
-d-iA
vD 00
• •On r—O HP--3-.
O t>-
co r-
mo• •
-^ CACArA1A r-f
CM CM• •
CM CAIA HCA CM
coCD
CO
>uco
oa
CO
CDH
%Sg
S 6jo 5
CM
IQ co _g- On-3 CM vO 1A
CACO On•> •»
CA CMw
vO O OO H C— -3CM en CM C*- -3
On t— C—«% «%
CM H4©
VAOCM
CM
oCM

76
TABLE 22.--Statement of operating expenses with percent selected items
are to total operating expense
Small Medium Large
T32 High : Low High : uO-V High
profit profit : profit profit: profit profit
(percent)
Salaries and wages 1*9.6 Uh.li 1*8.1 1*3.9 1*7.7 51.8
Taxes k.6 6.1* 5.1 6.7 5.^ 5.2
Insurance 1.8 3.2 3.0 3.3 2.1* 2.8
Repairs 1.8 2.5 2.2 1.8 3.9 2.6
Interest 10.9 7.6 7.3 6.8 6.8 3.0
Depreciation 15.0 19.9 15.1* 20.0 16.3 15.1*
Utilities 3.3 3.1* 1*.2 k.h l*.l lul*
Office supplies 1.2 1.3 1.3 1.1* 2.0 0.?
Plant supplies 0.8 l.ii 1.5 1.3 1.5 1.0
Other 11.0 9.9 11.9 10.1* 9.8 12.9
Total 100.0 100.0 100.0 100.0 100.0 100.0
Dollar valuea
Total expense $62.0 $51.9 S196.3 iOl*7.1 lttfc.5 67l*.7
aRounded off to thousands of dollars
TABLE 23.—Gross marginsj of major marketing commodities by profitlevels and size groups
Item: Small Medium : Large
: Low High :7 High ; uo r High
Gross iiargins
Grains 1*.8 3.8 2.1* 3.7 13.8 l*.o
Wheat 2.8 2.7 1.6 2.0 0.3 3.1Financed contract wheat 3.8 2.3 3.6 — _..
Corn 2.5 5.7 h.S 2.7 1*.2 6.6Oats 13.1 5.3 10.7 9.1 l*.l 13.6Grain sorghum 5.2 S.9 1*.0 1*.7 3.2 5.9Barley- 3.2 13.0 1*.3 37.0 3.7 12.9Rye — 9.7 6.6 — 7.2 6.5Soybeans 1.3 U.5 2.2 2.8 3.9 —
Total 3.0 3.1 2.1 2.6 1.3 3.1*
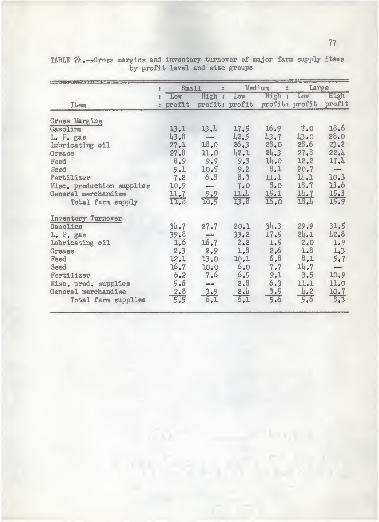
77
TABLE 2l*.—Gross margins and inventory turnover of major farm supply items
by profit level and size groups
: Small : Medium : Large
: Low High : TSm High : Cm High
Item : profit profit: profit profit: profit profit
Gross IJargins
Gasoline 13.1 13. U 17.5 16.9 7.0 18.6
L. P. gas 1*3.8 — 1*2.5 1*3.7 1*3.0 28.0
Lubricating oil 27.1 18.0 26.3 28.0 28.6 23.2
Grease 27.8 11.0 1*2.1 21* .3 27,8 22.1*
Feed 8.9 9.9 9.3 li*.0 12.2 17.1*
Seed 9.1 10.5 9.2 8.1 20.7 ~Fertilizer 7.2 6.8 8.3 11.1 lii.l 10.3Misc. production supplies 10.9 — 7.0 8.0 18.7 13.6General merchandise 11.7 9.9 ll.l* 15.1 H*.
7
15.3
Total farm supply- 11.8 103 13.8 i5To lB\H 15.9
Inventory TurnoverGasoline 31*.
7
27.7 20.1 31*.
3
29.9 31.5L. P. gas 39.8 ~ 33.2 17.5 21*. 1 1*2.8
Lubricating oil 1.6 16.7 2.2 1.5 2.0 1.9Grease 2.3 2.9 1.8 2.6 1.8 1.3
Feed 12.1 13.0 10.1 6.8 8.1 5.7Seed 16.7 10.0 6.0 7.7 11*. 7 —Fertilizer 6.2 7.6 6.5 9.1 3.5 10.9
Misc. prod, supplies 5.6 — 2.8 6.3 ll.l 11.0General merchandise 2.8 3.9 2.1* 3.5 1*.2 10.7
Total farm supplies 13 "O ~6TT n 5.6 "O
AN ECONOMIC ANALYSIS OF FACTORS AFFECTING SUCCESSOF KANSAS GRAIN COOPERATIVES, l?63-6li
by
RICHARD LEE EPARD
B. S., Kansas State University, 1962
AN ABSTRACT OF A MASTER'S THESIS
submitted in partial fulfillment of the
requirements for the degree
MASTER OF SCIENCE
Department of Economics
KANSAS STATE UNIVERSITYManhattan, Kansas
1965

Farmer grain cooperatives have expanded over the years until they
now play an important role in the agriculture sector of the economy.
In addition to marketing armers' produce, grain cooperatives typically
handle large quantities of farm supplies such as feed, fertilizer, and
petroleum products.
In the post World War II years, adoption of improved farming prac-
tices enabled the American farmer to expand production. As a result grain
production increased more than consumption and storage of grain became a
profitable source of income for many Kansas cooperatives. Since about
i960 grain carryover has been reduced and storage as a source of income
has declined.
Associations now, more than ever, need to know how much a particular
product contributes to the success of the total business operation. Ade-
quate accounting records are mandatory if this type information is to be
available.
Objectives of the study were (1) to determine the success of grain
associations in 1Q63-6U, (2) to determine certain selected efficiency
and percentage ratios and compare these ratios between associations of
different sizes and profit levels, (3) to determine the extent depart-
mentation is being used, and (h ) to determine the adequacy of the account-
ing system as an aid to management decision making.
The 6U associations used in the study were a 25 percent random
sample of the population plus the five largest associations operating
in Kansas during 1963-6)4. Associations were divided into three size
groups on the basis of gross operating income and averages computed
for each group.

2
Financial statements were presented for the three size groups and
for the average for all 6tt associations. Differences in financial state-
ment composition between the three size groups were discussed. Success
was measured by percentage net operating savings was to investment in
local which measured the earning power of a local cooperative in "its
own right." It appeared that large associations did enjoy some economies
from their larger operations. They avera ed fewer expenses per one dol-
lar gross operating income and had higher returns on investment than
did either the small or medium size associations. Small associations,
on the average, returned only 2.3 percent on investment, as compared to
li.6 percent for medium, and 6.1 percent for large associations. Small
associations not only had lower returns, but had larger variations in
income among associations than did medium and large associations.
A more meaningful interpretation of a firm's financial statements
is possible by ratio analysis. For this part of the study, the three
size groups were further separated into low and high profit associations
and selected ratios were compared. Ratio analysis indicated that many
associations had less than desirable liquidity ratios. High profit
associations had current ratios ranging from 1.52 - 2.27:1 and acid test
ratios ranging from .50 - 81:1. Low profit associations were in a less
desirable position, with current ratios ranging from 1.31 - 1.5^:1 and
acid test ratios of .32 - .56:1.
The analysis also indicated that excessive farm supply inventories
and slow turnovers were a major problem area for most associations in
the study. This situation was especially evident in smaller associations
and low profit associations.

3
High profit associations had more member equity financing. In
high profit associations it ranged from 61i to 71 percent of total assets
compared with ljO to 6l percent of total assets for low profit associations.
In multi-product firms such as grain cooperatives major products
and services should be separated into departments to determine their
contribution to the business. Information available in the annual audit
indicated that many associations did not maintain accounting details
which would enable a manager to determine a major product's contribution.


