
EXTENSION CENTER FOR COMMUNITY VITALITY
Economic Impact of Projects Leveraged by the Minnesota Historic Rehabilitation Tax Credit in Fiscal Year 2015
AN ECONOMIC IMPACT ANALYSIS PROGRAM REPORT Authored by Brigid Tuck and Gabriel Appiah, with contribution from Denis Gardner
IN PARTNERSHIP WITH: MINNESOTA HISTORICAL SOCIETY PHOTO OF ELY STATE THEATER BY TANNER OTT, COURTESY OF MINNESOTA HISTORICAL SOCIETY


ECONOMIC IMPACT OF HISTORIC REHABILITATION TAX CREDIT IN FISCAL YEAR 2015 i
Report Reviewers: William Lazarus, Professor, Department of Applied Economics, University of Minnesota Elizabeth Templin, Extension Educator, Center for Community Vitality Partner: Minnesota Historical Society Acknowledgements: We would like to thank Denis Gardner for his assistance in writing the history of the case studies.
Economic Impact of Projects Leveraged by the Minnesota Historic Rehabilitation Tax Credit in Fiscal Year 2015 AN ECONOMIC IMPACT ANALYSIS PROGRAM REPORT May 2016 Brigid Tuck, Senior Economic Impact Analyst, Center for Community Vitality Gabriel Appiah, Community Economics Intern, Center for Community Vitality Contribution from Denis Gardner, National Register Historian, Minnesota Historical Society Editor: Elyse Paxton, Senior Editor, Center for Community Vitality
© 2016 Regents of the University of Minnesota. All rights reserved. University of Minnesota Extension is an equal opportunity educator and employer. In accordance with the Americans with Disabilities Act, this material is available in alternative formats upon request. Direct requests to 612-625-8233.

ECONOMIC IMPACT OF HISTORIC REHABILITATION TAX CREDIT IN FISCAL YEAR 2015 ii
Table of Contents 1. EXECUTIVE SUMMARY 1 2. INTRODUCTION 2 3. ECONOMIC IMPACT FISCAL YEAR 2015 2 Direct Effects Fiscal Year 2015 2 Indirect and Induced Effects 4 Total Impact Fiscal Year 2015 4 Top Industries Impacted 5 Economic Impact Fiscal Year 2015 in Context of Minnesota’s Economy 7 4. CASE STUDIES OF COMPLETED PROJECTS 8 O’Donnell Shoe Factory 9 Young Women’s Christian Association of Duluth (YWCA) 11 Parlin and Orendorff Plow Company Warehouse 13 5. SUMMARY OF PAST RESEARCH 15 Total Impacts: Fiscal Years 2011 to 2015 15 Total Impacts: Fiscal Year 2011 15 Total Impacts: Fiscal Year 2012 16 Total Impacts: Fiscal Year 2013 16 Total Impacts: Fiscal Year 2014 17 6. A NOTE ON THE ANALYSIS 18 7. APPENDIX 1: METHODOLOGY 19

ECONOMIC IMPACT OF HISTORIC REHABILITATION TAX CREDIT IN FISCAL YEAR 2015 1
EXECUTIVE SUMMARY: ECONOMIC IMPACT OF PROJECTS LEVERAGED BY THE MINNESOTA HISTORIC REHABILITATION TAX CREDIT IN FISCAL YEAR 2015
The Minnesota Historic Rehabilitation Tax Credit, authorized in 2010, is designed to stimulate job
growth, increase the tax base, and revitalize communities by preserving historic structures. Properties
meeting state and federal eligibility requirements are eligible for the credit or a grant in lieu of the
credit. Five years after the credit was initiated, more than 80 properties have received initial approval.
This analysis focuses on the economic contribution of the credit in FY 2015 and showcases three
completed projects.
Direct Impact: The direct effect of the tax credit is the value of construction-related expenses
incurred by project developers. In FY 2015, 23 projects received initial approval for the tax credit.
In total, the projects will cost an estimated $244.0 million dollars (excluding acquisition costs) to
complete. An estimated 1,447 construction-related workers will perform the work. They will receive
an estimated $88.3 million in wages, salaries, and benefits.
Indirect and Induced Impacts: In addition to direct construction-related expenditures, the tax credit
will create economic activity in the industries that supply the project developers and their
employees. These are indirect and induced effects calculated by the input-output model, IMPLAN.
Economic Impact: The total economic impact of projects leveraged by the FY 2015 Minnesota
Historic Rehabilitation Tax Credit is an estimated $449.4 million. This includes $157.8 million in
labor income. Projects spurred by the credit support 2,607 full-time equivalent (FTE) jobs. Total
economic impact includes direct, indirect, and induced impacts.
Tax Credit: Provided the FY 2015 projects are completed and meet the requirements of the
program, an estimated $38.5 million will be awarded by the Minnesota Historic Rehabilitation Tax
Credit. For every state dollar of tax credit or grant allowed in FY 2015, $11.67 in economic activity
will be generated in Minnesota.
Benefiting Industries: Minnesota’s construction industry benefits most from projects spurred by the
tax credit. Other construction-related industries also benefit, including the wholesale trade industry,
the housing market, and the architectural and engineering industry. Wages earned by construction
workers create additional economic activity in the housing and health care industries.
Impacts in Previous Years: During the five years of the Minnesota Historic Rehabilitation Tax Credit,
the credit has generated an estimated $1.8 billion in output in the state’s economy and supported
an estimated 11,527 FTE jobs and $614.5 million in labor income. For every state dollar of tax credit
or grant allowed in the past five years, $9.00 in economic activity was generated.
Completed Projects: The O’Donnell Shoe Factory in St. Paul, the Young Woman’s Christian
Association building in Duluth, and the Parlin and Orendorff Plow Company building in
Minneapolis’ warehouse district are three examples of projects that showcase the success of the
program. Together, rehabilitation of the three buildings generated $80.6 million of economic
activity with $7.5 million of tax credits. Combined the three projects raised property values by
$19.9 million for a total increase of more than 500 percent.

ECONOMIC IMPACT OF HISTORIC REHABILITATION TAX CREDIT IN FISCAL YEAR 2015 2
INTRODUCTION
In 2010, the Minnesota State Legislature enacted the Minnesota Historic Rehabilitation Tax Credit.
The credit is based on federal legislation created via the National Historic Preservation Act of 1966,
which is intended to promote private investment in historic properties. The goal is to stimulate job
growth, increase the tax base, and revitalize communities.
Five years into the credit initiative, there is opportunity to reflect on the contribution of the credit to
the state’s economy. Since the Minnesota Historic Rehabilitation Tax Credit became law, more than
80 properties received initial approval for the tax credit. Several of those projects are complete.
The Minnesota Historic Preservation Office and the Minnesota Department of Revenue administer
the tax credit in Minnesota. The credit law allows for either a state income tax credit or a grant in
lieu of the credit. A state income tax credit of up to 20 percent of qualifying expenses is available if
a property meets eligibility requirements. Alternatively, a grant in lieu of a credit (equal to 90
percent of allowable credit) is available to property owners. Properties must be eligible for the
federal credit in order to qualify for the state credit.
Two items are considered when determining eligibility for the Minnesota Historic Rehabilitation Tax
Credit. First, the property must be a certified historic structure; that is, a building listed on the
National Register of Historic Places or certified as contributing to a registered historic district.
Second, the building must be rehabilitated for an income producing use and the project must meet a
substantial rehabilitation test. As a condition of receiving the credit, all work on the property must
meet the U.S. Secretary of Interior’s Standards for Rehabilitation, and the completed work must be
approved by the U.S. National Park Service.
Upon request by the Minnesota Historical Society, University of Minnesota Extension has been
analyzing the credit’s economic impact annually. The following report is organized into three
sections. The first section examines the economic impact of the historic tax credit in the most recent
fiscal year (FY 2015). The second section contains case studies that examine actual projects
completed with historic tax credit funding. The third section summarizes the economic contribution
of the tax credit during the past five years.
ECONOMIC IMPACT IN FISCAL YEAR 2015
Economic impact studies have their own specific methods and language. The term “total economic
impact” is used throughout this report and includes direct, indirect, and induced effects. Direct
effects are created by an industry or economic activity. In this analysis, the direct effect of the
historic tax credit is the value of construction activity spurred by the credit. Beyond direct effects,
indirect and induced effects are the impacts on businesses and enterprises created as a result of the
direct effect. The indirect and induced effects in this analysis were estimated using the input-output
model IMPLAN. IMPLAN is a specialized type of economic model used in economic impact studies.
Direct Effects in Fiscal Year 2015
The direct effect of the historic tax credit program is the value of the construction activity spurred
by the credit. Twenty-three rehabilitation projects received National Park Service Part II approval
between July 1, 2014 and June 30, 2015. Under Part II, projects receive initial approval and begin
making construction expenditures. Final approval, as well as the tax credit, is only awarded when all
work is completed and approved by the National Park Service (a process known as Part III
certification).
ECONOMIC IMPACT OF HISTORIC REHABILITATION TAX CREDIT IN FISCAL YEAR 2015 3
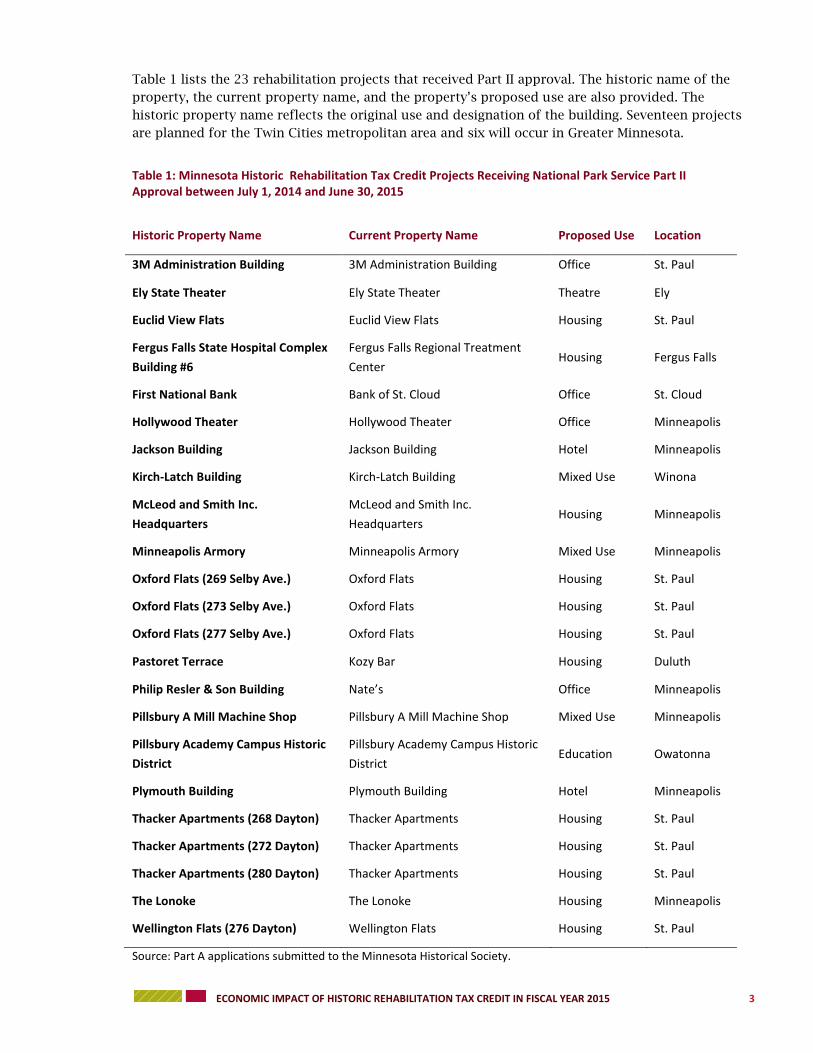
Table 1 lists the 23 rehabilitation projects that received Part II approval. The historic name of the
property, the current property name, and the property’s proposed use are also provided. The
historic property name reflects the original use and designation of the building. Seventeen projects
are planned for the Twin Cities metropolitan area and six will occur in Greater Minnesota.
Table 1: Minnesota Historic Rehabilitation Tax Credit Projects Receiving National Park Service Part II Approval between July 1, 2014 and June 30, 2015
Historic Property Name Current Property Name Proposed Use Location
3M Administration Building 3M Administration Building Office St. Paul
Ely State Theater Ely State Theater Theatre Ely
Euclid View Flats Euclid View Flats Housing St. Paul
Fergus Falls State Hospital Complex
Building #6
Fergus Falls Regional Treatment
Center Housing Fergus Falls
First National Bank Bank of St. Cloud Office St. Cloud
Hollywood Theater Hollywood Theater Office Minneapolis
Jackson Building Jackson Building Hotel Minneapolis
Kirch-Latch Building Kirch-Latch Building Mixed Use Winona
McLeod and Smith Inc.
Headquarters
McLeod and Smith Inc.
Headquarters Housing Minneapolis
Minneapolis Armory Minneapolis Armory Mixed Use Minneapolis
Oxford Flats (269 Selby Ave.) Oxford Flats Housing St. Paul
Oxford Flats (273 Selby Ave.) Oxford Flats Housing St. Paul
Oxford Flats (277 Selby Ave.) Oxford Flats Housing St. Paul
Pastoret Terrace Kozy Bar Housing Duluth
Philip Resler & Son Building Nate’s Office Minneapolis
Pillsbury A Mill Machine Shop Pillsbury A Mill Machine Shop Mixed Use Minneapolis
Pillsbury Academy Campus Historic
District
Pillsbury Academy Campus Historic
District Education Owatonna
Plymouth Building Plymouth Building Hotel Minneapolis
Thacker Apartments (268 Dayton) Thacker Apartments Housing St. Paul
Thacker Apartments (272 Dayton) Thacker Apartments Housing St. Paul
Thacker Apartments (280 Dayton) Thacker Apartments Housing St. Paul
The Lonoke The Lonoke Housing Minneapolis
Wellington Flats (276 Dayton) Wellington Flats Housing St. Paul
Source: Part A applications submitted to the Minnesota Historical Society.

ECONOMIC IMPACT OF HISTORIC REHABILITATION TAX CREDIT IN FISCAL YEAR 2015 4
Projects developers reported on the Part A application that total estimated rehabilitation costs for
the 23 projects would be $272.7 million (Table 2). Included in this amount are costs for items such
as property acquisition, site development and grading, demolition, construction supplies,
furnishings, electrical and plumbing work, permits, and fees.
Table 2: Direct Impact of Fiscal Year 2015 Minnesota Historic Rehabilitation Tax Credit Projects
Total Estimated Rehabilitation Project Costs
Total Estimated Rehabilitation Project Costs (Excluding Acquisition)
Estimated Minnesota Historic Rehabilitation Tax Credit
$272,692,011 $244,001,608 $38,536,797
In economic impact analysis theory, acquisition costs do not create an economic impact. This is
because they are a transfer of wealth (cash for land and/or a building). Therefore, acquisition costs
are not included in the economic impact. Project costs, with acquisition fees removed, were an
estimated $244.0 million in FY 2015. This is the direct impact of the tax credit.
The projects are being leveraged by an estimated $38.5 million in tax credits and/or grants. Given
these estimates, for every dollar of the Minnesota Historic Rehabilitation Tax Credit, private
developers invest $7.08 of their own funds.
Indirect and Induced Effects
Using the direct impacts from above (Table 2), $244.0 million was entered into the input-output
model, IMPLAN. Input-output models trace the flow of dollars throughout a local economy and
capture the indirect and induced effects of an economic activity.
Indirect effects are those associated with a change in economic activity due to business spending for
goods and services. In this case, these are the changes in the local economy occurring because
developers need to purchase construction materials (for example, lumber, cement, or equipment)
and construction-related services (i.e. architectural and engineering). These are business-to-business
impacts.
Induced effects are those associated with a change in economic activity due to spending by the
employees of businesses (labor) and by households. In this study, these are primarily economic
changes related to spending by construction workers hired to perform the rehabilitation work. These
are business-to-consumer impacts.
Total Impact in Fiscal Year 2015
The total economic impact of projects leveraged by the Minnesota Historic Rehabilitation Tax Credit
in FY 2015 is an estimated $449.4 million dollars (Table 3). Total economic contribution is
comprised of direct, indirect, and induced impacts. To produce $449.4 million in output, an
estimated 2,607 full-time equivalent (FTE) workers were employed, and an estimated $157.8 million
in payments were made to the employees.
The following are specific contributions for FY 2015.
Direct impacts include an estimated $244.0 million in new construction-related sales (output),
1,447 FTE construction jobs, and $88.3 million in payments to construction workers.

ECONOMIC IMPACT OF HISTORIC REHABILITATION TAX CREDIT IN FISCAL YEAR 2015 5
The Minnesota Historic Rehabilitation Tax Credit
supported $449.4 million of economic activity in FY 2015.
Spending on construction-related materials
creates indirect impacts. Indirect impacts from
the tax credit in FY 2015 total an estimated
$94.4 million in sales (output), including 480
FTE jobs in all sectors of the economy and
$32.5 million in payments to the workers.
Labor spending creates induced impacts.
Induced impacts from the tax credit total an
estimated $111.0 million in sales (output), including 680 FTE jobs in all sectors of the economy
and $37.0 million in payments to the workers.
Table 3: Total Economic Impact of Projects Leveraged by Minnesota Historic Rehabilitation Tax Credit in the Fiscal Year 2015
Direct Indirect Induced Total
Output (millions) $244.0 $94.4 $111.0 $449.4
Employment (FTE’s) 1,447 480 680 2,607
Labor Income (millions) $88.3 $32.5 $37.0 $157.8
Estimates by the University of Minnesota Extension Center for Community Vitality
Provided the projects are completed as planned, the Minnesota Historic Rehabilitation Tax Credit
allowed for FY 2015 projects will total $38.5 million. For every state dollar of tax credit or grant
allowed, $11.67 in economic activity is generated in Minnesota. This activity is mostly driven by
additional investments by project developers, but it also includes the indirect and induced effects of
construction-related spending.
The $11.67 in economic activity represents a significant increase from FY 2014 ($8.09). This is
explained, in part, by a higher ratio of private investment to tax credit. In 2014, developers invested
$6.22 for every $1 of tax credit. In 2015, the amount jumped to $7.08. This difference may also be
driven by an increase in impact from the additional investments. Both the type of rehabilitation
project and the nature of spending by project developers affects the magnitude of impact.
Top Industries Impacted
The top 15 industries impacted by Minnesota Historic Rehabilitation Tax Credit projects during FY
2015 are shown in Charts 1 and 2. Chart 1 illustrates the top 15 industries sorted by output, and
Chart 2 is sorted by employment. The charts do not include direct impacts within the construction
industries.
In terms of output, the magnitude of impacts of the Minnesota Historic Rehabilitation Tax Credit is
highest in the wholesale trade, housing (owner-occupied dwellings and real estate), and petroleum
industries (Chart 1). Projects undertaken by contractors will create approximately $19.0 million in
activity within the wholesale trade industry. Of this amount, roughly two-thirds is the result of
spending by the contractors for supplies and services, and one-third is the result of spending by
employees of the contracting firms.

ECONOMIC IMPACT OF HISTORIC REHABILITATION TAX CREDIT IN FISCAL YEAR 2015 6
Not surprisingly, significant indirect impacts are observed in the wholesale trade industry; the
petroleum industry; the architectural and engineering industry; and the trucking industry. They are
core components of the construction supply chain. They also sell products that are typically
available on a local basis.
High induced impacts occur in the housing market (both owner-occupied and rental), as well as
health care (including hospitals, offices of physicians, and insurance carriers). These results are
indicative of average household spending, which is often concentrated in housing and health care.
In terms of employment, the magnitude of the Minnesota Historic Rehabilitation Tax Credit impact
is highest in the wholesale trade industry, the real estate (rental) industry, the restaurant industry,
the architectural and engineering industry, and the health care industry (Chart 2). The restaurant
industry, including both limited-service and full-service dining, shows higher impacts on the
employment chart than in the output chart. Restaurants tend to have a lower output per employee
ratio.
As with output impacts indirect impacts are highest within industries that include the supply chain
of construction contractors (for example, architects and engineers and wholesale suppliers). Induced
impacts, on the other hand, are higher in industries that provide goods and services to employees of
the contractors (e.g. housing and health care).
$0
$2
$4
$6
$8
$10
$12
$14
$16
$18
$20
Mill
ion
s
Chart 1: Top Indirect and Induced Effects, Sorted by Output
Induced
Indirect

ECONOMIC IMPACT OF HISTORIC REHABILITATION TAX CREDIT IN FISCAL YEAR 2015 7
Economic Impact in Fiscal Year 2015 In Context of Minnesota’s Economy
The study area for this analysis is Minnesota, since the Minnesota Historic Rehabilitation Tax Credit
is available throughout the state. Interpreting economic impact figures requires understanding the
current economy. In FY 2015, the tax credit directly created $244.0 million of construction-related
activity. Direct construction-related spending created a total of $449.4 million of activity across all
industries in the state, the highest impacts being in the wholesale trade, housing, restaurant, and
health care sectors.
In 2014, businesses and enterprises in Minnesota produced $614.9 billion of output.1 Of that output,
33 percent was derived from the professional services sector, 25 percent from the manufacturing
sector, and 10 percent from the trade (wholesale and retail) sector (Chart 3). The construction sector
was responsible for 5 percent of Minnesota’s total output, or $32.3 billion.
1 Source: IMPLAN. Output is not GDP.
0
10
20
30
40
50
60
70
80
90
Emp
loym
en
t
Chart 2: Top Indirect and Induced Effects, Sorted by Employment
Induced
Indirect

ECONOMIC IMPACT OF HISTORIC REHABILITATION TAX CREDIT IN FISCAL YEAR 2015 8
In 2014, businesses and enterprises created 3.6 million jobs in Minnesota. Of those, 27 percent were
in the professional services sector, 14 percent in the trade sector, and 13 percent in the health and
social services sector (Chart 4). Construction jobs accounted for 5 percent of the state’s jobs in 2014.
CASE STUDIES OF COMPLETED PROJECTS
Since the Minnesota Historic Rehabilitation Tax Credit became law, more than 80 properties have
received Part A approval. In the five year period, several projects moved from Part A approval to
completion. This section of the report highlights three completed projects. The projects were
selected for this report as they were the first three projects to be completed and receive the tax
credit.
Ag, Forestry, Fish & Hunting
3% Mining & Utilities
3% Construction
5%
Manufacturing 25%
Trade 10%
Transport & Warehouse
3%
Professional Services
33%
Health & Social Services
7%
Leisure & Hospitality
3%
Other Services 2%
Government 6%
Chart 3: Output by Industry, Minnesota 2014
Ag, Forestry, Fish & Hunting
3% Mining & Utilities
1% Construction
5%
Manufacturing 9%
Trade 14%
Transport & Warehouse
3% Professional
Services 27%
Health & Social Services
13%
Leisure & Hospitality
9%
Other Services 5%
Government 11%
Chart 4: Employment by Industry, Minnesota 2014

ECONOMIC IMPACT OF HISTORIC REHABILITATION TAX CREDIT IN FISCAL YEAR 2015 9
Background
Designed by Butler Brothers Company of St. Paul, the O’Donnell Shoe Company factory was
constructed at 509 Sibley Street in St. Paul. Completed in 1914, the six-story brick building was the
company’s second home. The building was a reflection of the success of the business, an enterprise
established in 1910 that evolved into the most successful shoe manufacturer in the state by the
1920s.
After the building’s completion, the O’Donnell Shoe Company had substantial open space to house
the varied mechanics required to make shoes and boots. The manufacturing process began on the
upper floors and was completed on the bottom floor, where the finished product was boxed and
shipped directly to stores or wholesalers.
In 1935 the O’Donnell Shoe Company moved its operations to Humboldt, Tennessee. The building
was subsequently filled by a number of tenants during the following decades, and by the turn of the
twenty-first century, it was known as the “Renaissance Box”. The building was rehabilitated during
2010-2011. According to the project developer, Aeon, “The redevelopment of the Renaissance Box
pays tribute to Minnesota’s heritage while meeting today’s needs for quality affordable apartment
homes.” The renovations, in part spurred by the Minnesota Historic Rehabilitation Tax Credit,
resulted in 70 apartment homes in the building.2
Project Financing and Economic Impact
Aeon received Part A approval for the project in FY 2011, with anticipated project costs of $16.8
million and an estimated tax credit of $2.2 million. The building was placed into service on
December 23, 2011.
At project’s end, Aeon reported spending $17.9 million, of which $11.9 million were costs qualifying
for the tax credit (Table 4). Aeon was awarded $2.2 million in tax credits. Based on reported final
2 Lucas, A. M. (March 2009). Preserving a piece of St. Paul’s history: Redeveloping the O’Donnell Shoe Factory. Retrieved from http://www.aeonmn.org/wp-content/uploads/2014/10/Ren_Box_History.pdf.
ADDRESS 509 Sibley Street
St Paul, Minnesota
DATE BUILT 1914
REHABILITATION 2010-2011
DEVELOPER Aeon
ORIGINAL USE Shoe Factory
NEW USE Affordable Housing
O’DONNELL
SHOE FACTORY
Photo Credit: Minnesota Historical Society

ECONOMIC IMPACT OF HISTORIC REHABILITATION TAX CREDIT IN FISCAL YEAR 2015 10
expenditures, the project generated an estimated $33.1 million in economic activity during the
rehabilitation phase. For every one dollar of tax credit invested, the project generated $15.05 of
economic activity. This amount includes private investment by the developer, as well as the
additional economic activity generated.3
Property values also increased. Prior to the rehabilitation, the property value was $1.6 million. Upon
project completion, the property value increased by 225 percent to $5.2 million.
Table 4: Project Financing and Economic Impact of O’Donnell Shoe Factory
Total Final Project Costs (millions) $17.9
Total Qualifying Rehabilitation Costs (millions) $11.9
Tax Credit (millions) $2.2
Economic Impact of Construction (millions) $33.1
Total Economic Activity Per Dollar of Tax Credit $15.05
Property Value 2010 (millions) $1.6
Property Value 2015 (millions)4 $5.2
3 The ratio of total economic activity per dollar of tax credit can vary, depending on the nature of the project. Two factors influence the ratio. One, the amount of additional investment by the developer (above and beyond the tax credit). Two, the nature of the project and the type of spending influence the magnitude of indirect and induced impacts. 4 Property value is estimated market value. Property tax values accessed via https://www.ramseycounty.us/residents/property-home/taxes-values.

ECONOMIC IMPACT OF HISTORIC REHABILITATION TAX CREDIT IN FISCAL YEAR 2015 11
Background
Designed by the Duluth architectural firm German and Lignell, the YWCA of Duluth was completed
in 1908 at 202 West Second Street. The handsome Second Renaissance Revival-style building served
as home to YWCA for a century, before closing in 2008.
The YWCA contributed significantly to the women’s social and labor movements. It was a “home
away from home” for untold numbers of young women. It provided safe lodging and meals in the
port city, while helping women seek employment opportunities. The YWCA was also a social hub,
affording ample opportunity for interaction between tenants. Physical activity was encouraged, and
Bible study was expected. Newly arrived immigrants received English language training and were
offered citizenship classes. In short, the mission of the YWCA was “to advance the physical, social,
intellectual, moral, and spiritual interests of young women.”
After the YWCA of Duluth closed, the building was acquired by the American Indian Community
Housing Organization (AICHO). The AICHO rehabilitated the building during 2010-2011. The
building is now known as Gimaajii Mino Bimaadiziyaan, an Ojibwe phrase meaning “together we are
beginning a good life.” The building houses 29 units of permanent housing, with a focus on
households experiencing long-term homelessness, poverty, and violence. Since its opening, more
than 400 people have applied to Gimaajii.5 AICHO also provides support (including a temporary
shelter) for victims of domestic violence, transitional housing for homeless single mothers, and low
income housing for the homeless. In addition, the Gimaajii building is home to Duluth’s first
American Indian Center.
5 Minnesota Coalition for the Homeless. Tribal Organizing Update Spotlight on AICHO. Retrieved from http://www.mnhomelesscoalition.org/tribal-organizing-update-spotlight-on-aicho/.
ADDRESS 202 W 2nd Street
Duluth, Minnesota
DATE BUILT 1908
REHABILITATION 2010-2011
DEVELOPER American Indian Community
Housing Organization
ORIGINAL USE Housing
NEW USE Affordable Housing
DULUTH YWCA
Photo Credit: Minnesota Historical Society

ECONOMIC IMPACT OF HISTORIC REHABILITATION TAX CREDIT IN FISCAL YEAR 2015 12
The present use of the building mirrors one of the original purposes of the building, which was to
house those in need.6
Project Financing and Economic Impact
The American Indian Community Housing Organization, the project coordinator, received Part A
approval for the project in FY 2011 with anticipated project costs of $8.0 million and an estimated
tax credit of $1.3 million. The building was placed into service on December 31, 2011.
The AICHO brought together financing from 19 sources, including the Minnesota Historic
Rehabilitation Tax Credit, to complete the project. A major financer was the Minnesota Housing
Finance Agency, which committed more than $3.5 million to the project. Additionally, Dr. Robert
Powless, a member of the Oneida Tribe of Wisconsin, and the former head of University of
Minnesota Duluth’s American Indian Studies Department, along with his wife, donated $50,000
towards the project. Tribal sources were also used for financing.7
At project’s end, the American Indian Community Housing Organization reported total spending of
$8.2 million on the project, of which $6.9 million were costs qualifying for the tax credit (Table 5).
The American Indian Community Housing Organization was awarded $1.2 million in tax credits.
Based on the final reported expenditures, the project generated an estimated $16.2 million in
economic activity during the rehabilitation phase. For every one dollar of tax credit invested, the
project generated $13.50 of economic activity.
Property values also increased. Prior to the rehabilitation, the property value was $0.7 million. Upon
project completion, the property value increased by 86 percent to $1.3 million.
Table 5: Project Financing and Economic Impact of Duluth YWCA
Total Final Project Costs (millions) $8.2
Total Qualifying Rehabilitation Costs (millions) $6.9
Tax Credit (millions) $1.2
Economic Impact of Construction (millions) $16.2
Total Economic Activity Per Dollar of Tax Credit $13.50
2011 Property Value (millions) $0.7
2015 Property Value (millions)8 $1.3
6 Lucas, A.M., Zellie, C.S. (November 2012). Young Women’s Christian Association of Duluth. St. Paul: Minnesota Historical Society. 7 Pember, M.A. (April 2012). New Center in Duluth Offers Housing for Natives Hoping to Start New Lives. Retrieved from http://indiancountrytodaymedianetwork.com/2012/04/10/new-center-duluth-offers-housing-natives-hoping-start-new-lives-107430. 8 Property value is estimated market value. Retrieved from http://apps.stlouiscountymn.gov/auditor/parcelInfo2005Iframe/. 2012 is the oldest record available.

ECONOMIC IMPACT OF HISTORIC REHABILITATION TAX CREDIT IN FISCAL YEAR 2015 13
Background
Known today as the Copham, the Parlin and Orendorff Plow Company Warehouse is part of the
Minneapolis Warehouse Historic District. The district developed on the edge of the city in the late
19th and early 20th centuries. It is a largely architecturally-cohesive expanse, historically significant
as an important wholesaling district during a period of substantial development in Minneapolis.
The agricultural implement company founded by William Parlin and William J. Orendorff
constructed its warehouse on a half block along the frontage of Washington Avenue North between
Sixth and Seventh Avenues North. Completed in 1910, the seven-story building was designed by
local architects Emile Bertrand and Arthur Bishop Chamberlain and formed of a reinforced-concrete
frame dressed in dark red brick.
At the time, railroad lines were important in the warehouse district for bringing in and shipping out
wholesale goods, and the Parlin and Orendorff Company benefited from a Great Northern rail spur
located behind its warehouse.
The warehouse eventually served other tenants, including International Harvester and the Holden
Printing Company. The Holden Printing Company was a long-term tenant, and therefore many still
refer to the building as the Holden building.
During 2010-2012, Greco Development rehabilitated the warehouse for residential and commercial
use.9 The Copham apartments are now situated in Minneapolis’ trendy and rapidly growing North
Loop.
Project Financing and Economic Impact
Greco Development received Part A approval for the rehabilitation project in FY 2011 with
anticipated project costs of $25.3 million and an estimated tax credit of $3.5 million (Table 6). The
building was placed into service on August 31, 2012.
9 Hess, Roise and Company. (December 2010). Parlin and Orendorff Plow Company Warehouse. , St. Paul: Minnesota Historical Society.
ADDRESS 601-607 Washington Ave N
Minneapolis, Minnesota
DATE BUILT 1910/1925-1926
REHABILITATION 2010-2012
DEVELOPER Greco Development
ORIGINAL USE Warehouse & Offices
NEW USE Residential & Commercial
Parlin and
Orendorff Plow
Company
Warehouse
Photo Credit: Hess, Roise and Company

ECONOMIC IMPACT OF HISTORIC REHABILITATION TAX CREDIT IN FISCAL YEAR 2015 14
At project’s end, Greco Development reported spending $25.7 million on the project, of which $20.6
million were costs qualifying for the tax credit. Greco Development was awarded $4.1 million in tax
credits. Based on final report expenditures, the project generated an estimated $46.5 million in
economic activity during the rehabilitation phase. For every one dollar of tax credit invested, the
project generated $11.34 of economic activity.
Property values also increased. Prior to the rehabilitation, the property value was $1.2 million. Upon
project completion, the property value increased by 1308 percent to $16.9 million.
Table 6: Project Financing and Economic Impact of Parlin and Orendorff Plow Company
Warehouse
Total Project Cost (millions) $25.7
Total Qualifying Rehabilitation Costs (millions) $20.6
Tax Credit (millions) $4.1
Economic Impact of Construction (millions) $46.5
Total Economic Activity Per Dollar of Tax Credit $11.34
2014 Property Tax Value (millions) $1.2
2015 Property Tax Value (millions)10
$16.9
10 Property tax value is estimated market value. Retrieved from http://www.hennepin.us/residents/property/property-information-search. Value changed mid-year due to rehabilitation.
ECONOMIC IMPACT OF HISTORIC REHABILITATION TAX CREDIT IN FISCAL YEAR 2015 15
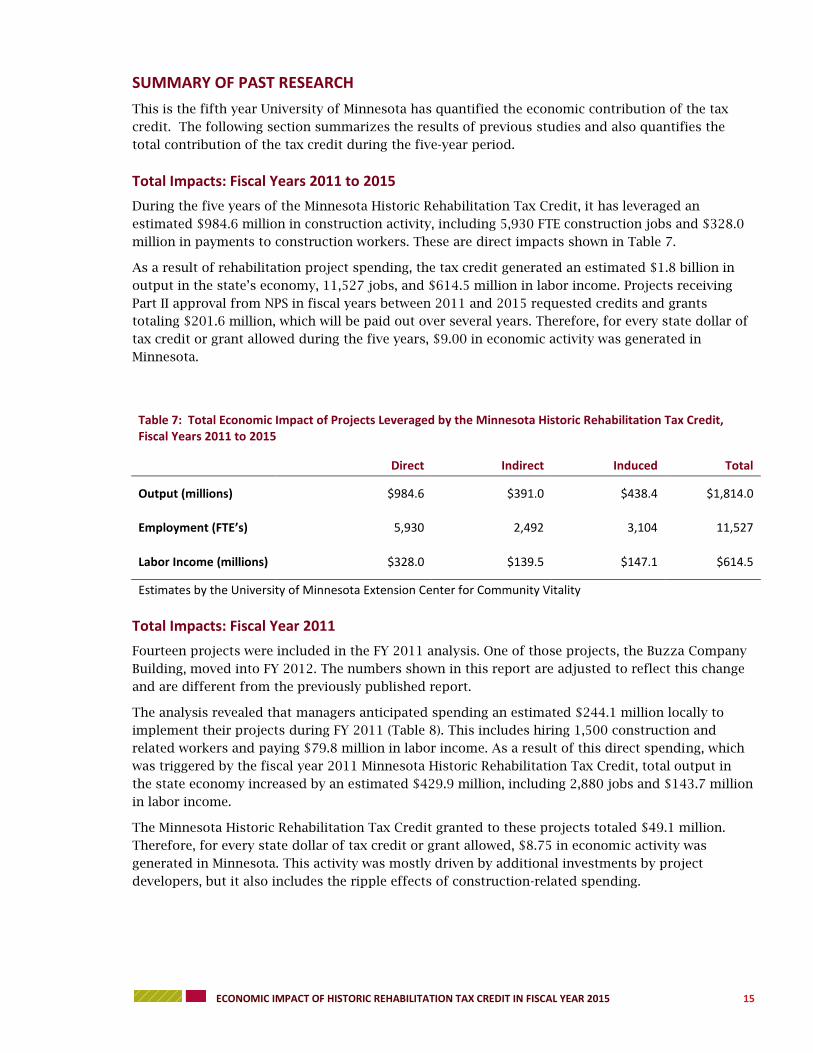
SUMMARY OF PAST RESEARCH
This is the fifth year University of Minnesota has quantified the economic contribution of the tax
credit. The following section summarizes the results of previous studies and also quantifies the
total contribution of the tax credit during the five-year period.
Total Impacts: Fiscal Years 2011 to 2015
During the five years of the Minnesota Historic Rehabilitation Tax Credit, it has leveraged an
estimated $984.6 million in construction activity, including 5,930 FTE construction jobs and $328.0
million in payments to construction workers. These are direct impacts shown in Table 7.
As a result of rehabilitation project spending, the tax credit generated an estimated $1.8 billion in
output in the state’s economy, 11,527 jobs, and $614.5 million in labor income. Projects receiving
Part II approval from NPS in fiscal years between 2011 and 2015 requested credits and grants
totaling $201.6 million, which will be paid out over several years. Therefore, for every state dollar of
tax credit or grant allowed during the five years, $9.00 in economic activity was generated in
Minnesota.
Table 7: Total Economic Impact of Projects Leveraged by the Minnesota Historic Rehabilitation Tax Credit, Fiscal Years 2011 to 2015
Direct Indirect Induced Total
Output (millions) $984.6 $391.0 $438.4 $1,814.0
Employment (FTE’s) 5,930 2,492 3,104 11,527
Labor Income (millions) $328.0 $139.5 $147.1 $614.5
Estimates by the University of Minnesota Extension Center for Community Vitality
Total Impacts: Fiscal Year 2011
Fourteen projects were included in the FY 2011 analysis. One of those projects, the Buzza Company
Building, moved into FY 2012. The numbers shown in this report are adjusted to reflect this change
and are different from the previously published report.
The analysis revealed that managers anticipated spending an estimated $244.1 million locally to
implement their projects during FY 2011 (Table 8). This includes hiring 1,500 construction and
related workers and paying $79.8 million in labor income. As a result of this direct spending, which
was triggered by the fiscal year 2011 Minnesota Historic Rehabilitation Tax Credit, total output in
the state economy increased by an estimated $429.9 million, including 2,880 jobs and $143.7 million
in labor income.
The Minnesota Historic Rehabilitation Tax Credit granted to these projects totaled $49.1 million.
Therefore, for every state dollar of tax credit or grant allowed, $8.75 in economic activity was
generated in Minnesota. This activity was mostly driven by additional investments by project
developers, but it also includes the ripple effects of construction-related spending.

ECONOMIC IMPACT OF HISTORIC REHABILITATION TAX CREDIT IN FISCAL YEAR 2015 16
Table 8: Total Economic Impact of Projects Leveraged During Fiscal Year 2011 Minnesota Historic Rehabilitation Tax Credit
Direct Indirect Induced Total
Output (Sales) $244.1 $88.3 $97.5 $429.9
Employment (FTE’s) 1,500 632 747 2,880
Labor Income $79.8 $31.9 $32.1 $143.7
Estimates by the University of Minnesota Extension Center for Community Vitality
Note: Due to a reclassification of one project (Buzza Building), these numbers have changed since publication of
the initial report.
Total Impacts: Fiscal Year 2012
In 2012, 16 projects were included in the analysis. The 16 projects planned to spend an estimated
$292.4 million on rehabilitations and improvements (Table 9). Contractors estimated they would
hire 1,480 individuals to complete the projects.
The economic impact of the Minnesota Historic Rehabilitation Tax Credit projects during fiscal year
2012 was an estimated $558.7 million in Minnesota. This impact includes $180.5 million of labor
income paid to the estimated 3,502 workers whose jobs were created as a result of the tax credit.
The Minnesota Historic Rehabilitation Tax Credit granted to these projects totaled $69.7 million.
Therefore, for every state dollar of tax credit or grant allowed, $8.00 in economic activity was
generated in Minnesota. This activity was mostly driven by additional investments by project
developers, but it also includes the ripple effects of construction-related spending.
Table 9: Total Economic Impact of Projects Leveraged During Fiscal Year 2012 Minnesota Historic Rehabilitation Tax Credit
Direct Indirect Induced Total
Output (Sales) $292.4 $127.4 $138.9 $558.7
Employment (FTE’s) 1,480 935 1,087 3,502
Labor Income $85.7 $47.4 $47.4 $180.5
Estimates by the University of Minnesota Extension Center for Community Vitality
Total Impacts: Fiscal Year 2013
In 2013, 15 projects were included in the analysis. The 15 projects planned to spend an estimated
$72.7 million on rehabilitation (Table 10). Contractors estimated they would hire 785 individuals to
complete the projects.
The economic impact of the Minnesota Historic Rehabilitation Tax Credit projects during fiscal year
2013 was an estimated $138.8 million in Minnesota. This impact includes $46.5 million of labor
income paid to the estimated 1,200 workers whose jobs were created as a result of the tax credit.
ECONOMIC IMPACT OF HISTORIC REHABILITATION TAX CREDIT IN FISCAL YEAR 2015 17
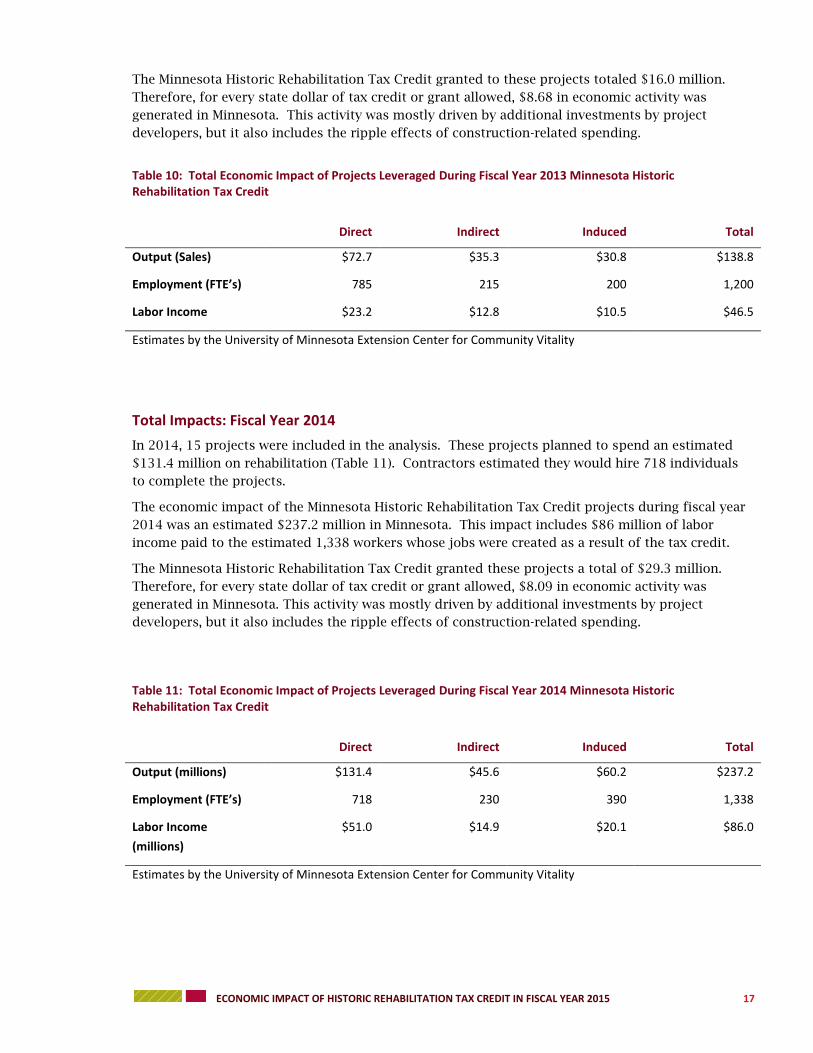
The Minnesota Historic Rehabilitation Tax Credit granted to these projects totaled $16.0 million.
Therefore, for every state dollar of tax credit or grant allowed, $8.68 in economic activity was
generated in Minnesota. This activity was mostly driven by additional investments by project
developers, but it also includes the ripple effects of construction-related spending.
Table 10: Total Economic Impact of Projects Leveraged During Fiscal Year 2013 Minnesota Historic Rehabilitation Tax Credit
Direct Indirect Induced Total
Output (Sales) $72.7 $35.3 $30.8 $138.8
Employment (FTE’s) 785 215 200 1,200
Labor Income $23.2 $12.8 $10.5 $46.5
Estimates by the University of Minnesota Extension Center for Community Vitality
Total Impacts: Fiscal Year 2014
In 2014, 15 projects were included in the analysis. These projects planned to spend an estimated
$131.4 million on rehabilitation (Table 11). Contractors estimated they would hire 718 individuals
to complete the projects.
The economic impact of the Minnesota Historic Rehabilitation Tax Credit projects during fiscal year
2014 was an estimated $237.2 million in Minnesota. This impact includes $86 million of labor
income paid to the estimated 1,338 workers whose jobs were created as a result of the tax credit.
The Minnesota Historic Rehabilitation Tax Credit granted these projects a total of $29.3 million.
Therefore, for every state dollar of tax credit or grant allowed, $8.09 in economic activity was
generated in Minnesota. This activity was mostly driven by additional investments by project
developers, but it also includes the ripple effects of construction-related spending.
Table 11: Total Economic Impact of Projects Leveraged During Fiscal Year 2014 Minnesota Historic Rehabilitation Tax Credit
Direct Indirect Induced Total
Output (millions) $131.4 $45.6 $60.2 $237.2
Employment (FTE’s) 718 230 390 1,338
Labor Income
(millions)
$51.0 $14.9 $20.1 $86.0
Estimates by the University of Minnesota Extension Center for Community Vitality

ECONOMIC IMPACT OF HISTORIC REHABILITATION TAX CREDIT IN FISCAL YEAR 2015 18
A NOTE ON THE ANALYSIS
As part of Minnesota’s legislation, the Minnesota Historical Society “must annually determine the
economic impact to the state from the rehabilitation of property for which credits or grants are
provided” (Minnesota Statues, Chapter 290.0681, Subdivision 9). To complete this charge, the
Minnesota Historical Society contracted with University of Minnesota Extension’s Economic Impact
Analysis (EIA) program. In 2011, University of Minnesota Extension first completed the analysis,
covering projects receiving part II approval from NPS during fiscal year 2011. Since then, Extension
has completed the analysis in each year following. Reports are available at
http://www.extension.umn.edu/community/economic-impact-analysis/reports/.
Pursuant to Minnesota Statutes, Chapter 3.197 regarding the cost of reports, the total for this study
was $4,500.

ECONOMIC IMPACT OF HISTORIC REHABILITATION TAX CREDIT IN FISCAL YEAR 2015 19
APPENDIX 1: DEFINITION OF TERMS
Special models, called input-output models, exist to conduct economic impact analysis. There are
several input-output models available, and IMPLAN (IMpact Analysis for PLANning, Minnesota
IMPLAN Group)11 is one such model. Many economists use IMPLAN for economic contribution
analysis because it can measure output and employment impacts, is available on a county-by-county
basis, and is flexible for the user. While IMPLAN has some limitations and qualifications, it is one of
the best tools available to economists for input-output modeling. Understanding the IMPLAN tool, its
capabilities, and its limitations helps ensure the best results from the model.
One of the most critical aspects of understanding economic impact analysis is the distinction
between the “local” and “non-local” economy. The local economy is identified as part of the model-
building process. Either the group requesting the study or the analyst defines the local area.
Typically, the study area (the local economy) is a county or a group of counties that share economic
linkages. In this study, the study area is the entire state of Minnesota.
A few definitions are essential in order to properly read the results of an IMPLAN analysis. These
terms and their definitions are provided below.
Output
Output is measured in dollars and is equivalent to total sales. The output measure can include
significant “double counting.” Think of limestone, for example. The value of limestone is counted
when it is sold as a component in the manufacturing of cement, again when the cement is sold to
the contractor, and yet again when the contractor charges the building owner. The value of the
limestone is built into the price of each of these items, and then the sale of each of item is added to
get total sales (or output).
Employment
Employment includes full- and part-time workers and is measured in annual average jobs, not full-
time equivalents (FTE). IMPLAN includes total wage and salaried employees, as well as the self-
employed, in employment estimates. Because employment is measured in jobs and not in dollar
values, it tends to be a very stable metric.
Labor Income
Labor income measures the value added to the product by the labor component. So, in the limestone
example, when the limestone is sold to the cement manufacturing company, a certain percentage of
the sale is for the labor to quarry the limestone. Then when the cement is sold to the contractor, it
includes some markup for its labor costs in the price. When the contractor charges the building
owner, he/she includes a value for the labor. These individual value increments for labor can be
measured, which amounts to labor income. Labor income does not include double counting.
Labor income includes both employee compensation and proprietor income. It is measured as wages,
salaries, and benefits.
Direct Impact
Direct impact is equivalent to the initial activity in the economy. In this study, it is construction
spending generated by projects leveraged by the Minnesota Historic Rehabilitation Tax Credit.
11 IMPLAN Version 3.0 with 2014 data was used in this analysis. The trade flows model with SAM multipliers was implemented.
ECONOMIC IMPACT OF HISTORIC REHABILITATION TAX CREDIT IN FISCAL YEAR 2015 20
Indirect Impact
The indirect impact is the summation of changes in the local economy that occur due to spending
for inputs (goods and services) by the industry or industries directly impacted. For instance, if
employment in a manufacturing plant increases by 100 jobs, this implies a corresponding increase
in output by the plant. As the plant increases output, it must also purchase more inputs, such as
electricity, steel, and equipment. As the plant increases purchases of these items, its suppliers must
also increase production, and so forth. As these ripples move through the economy, they can be
captured and measured. Ripples related to the purchase of goods and services are indirect impacts.
In this study, indirect impacts are those associated with spending by the developers to purchase
construction materials (lumber, cement, equipment, and so forth) and construction-related services
(i.e. architectural and engineering).
Induced Impact
The induced impact is the summation of changes in the local economy that occur due to spending
by labor -- that is, spending by employees in the industry or industries directly impacted. For
instance, if employment in a manufacturing plant increases by 100 jobs, the new employees will
have more money to spend on housing, groceries, and going out to dinner. As they spend their new
income, more activity occurs in the local economy. This can be quantified and is called the induced
impact. Primarily, in this study, the induced impacts are economic changes related to spending by
construction workers hired to perform the rehabilitation work.
Total Impact
The total impact is the summation of the direct, indirect, and induced impacts.


