
Economic Impacts of the Timeshare Industry in Aruba
Foreword
Timesharing in Aruba plays an important role with nearly 40 percent of our total hotel unit‟s
inventory consisting of timeshare units. Thanks to this inventory and the high occupancies of the
16 timeshare resorts on the island we can boost a consistent occupancy all year which is the envy
of many of our Caribbean competitors.
The Aruba Time Share Association (ATSA) is very much aware of the importance of this sector
of our industry but just how important is timeshare for Aruba and what is the impact on our
economy?
The University of Aruba, under the guidance of Dr. Ryan Peterson, conducted a survey and study
on this very same subject in 2008. ATSA is conscious that a similar study should be conducted
every 5 years because of changing patterns and the dynamics of our industry.
The report you are about to read are the results of a study made by a recent graduate of the
University of Aruba, Ziphora Baarh, under the guidance of her mentor, Mrs. Thais Nierop-
Kappel.
We thank Ziphora for the results of this new study which we value very much. As a student of
the University of Aruba, in the Faculty of Hospitality and Tourism Management Studies, she has
worked diligently in researching and interviewing numerous timeshare owners and guests in
relation to their spending patterns and reasons for repeatedly coming to Aruba. The results do
indicate that timeshare has a very significant impact on our local economy.
On behalf of ATSA we also thank the General Managers for their cooperation of “subjecting”
their members and guests to the survey but also in collaborating with Ziphora in providing
information that generated this report.
We wish Ziphora Baarh success in her future career in the tourism industry.
Sincerely,
Jan van Nes
General Manager
Introduction

This study is about the timeshare industry in Aruba, and the impacts of timeshare resorts and
timeshare tourists on Aruba‟s economy. The industry is very broad and has many factors. For the
purposes of this research, two main categories will be studied. One is timeshare tourists‟
expenditures and the other is revenue gained by the taxes and maintenance fees that timeshare
owners pay, which is returned to the community through maintenance costs, utilities, and
employees‟ payroll.
It is important to know how the timeshare industry affects spending patterns of tourists in Aruba.
The ancillary revenue generated by the timeshare industry in Aruba includes the products and
services that timeshare owners spend their money on. Tourists coming to Aruba usually spend
money on restaurants, shopping, touring, recreational activities, etc. This study will analyze
timeshare owners‟ spending in these categories, and seek to find patterns among them, in terms
of what motivates them to spend money in Aruba, what factors affect their spending patterns,
and how much money is being spent in each category, which in turn will give an implication as
to how much the timeshare owners in Aruba affect the economy. In the retailers‟ perspective, it
is important to know how much money the timeshare tourists are spending, and what the
demands are from these types of tourists. The study is based on primary data gathered
concerning the economic effects in Aruba, in terms of tourist expenditures. The data has been
gathered by surveying timeshare owners from different resorts. This study seeks to find not only
the timeshare industry‟s expenditures in Aruba, but how big of an impact these expenditures
have on the tourism industry, and ultimately, the economy of Aruba, and why it is important to
know the demands of timeshare owners in Aruba. In addition, the economic impact analysis has
been done by gathering information from the timeshare resorts regarding their maintenance fees,
taxes, and expenses. Since Aruba‟s economy is dependent on tourism, it is important to know
how much of the money from the tourists coming in are coming from those owning, or staying in
a timeshare in Aruba. Because the timeshare industry in Aruba has grown so much over past
decades, it is extremely important to study its economic impacts on the island, and how it has
changed.
The multiplier effect that the timeshare industry produces in Aruba is from the expenses of the
timeshare resorts. Studies show that in Aruba, room taxes in timeshare resorts generate
approximately $11,379,799 per year (ATSA, 2011). This tax contribution is an important
revenue source for the government. Maintenance fees cover a multitude of costs, which are
divided differently amongst all timeshare resorts. Some of the costs that will be analyzed in this
study include utilities costs such as electricity, water, gas, AZV, AOV, and ground (property)
tax. The amount of money that the timeshare resorts invest on refurbishing also impacts the
economy, especially through import duties they pay. In addition, one extremely significant way
the timeshare industry affects the economy of Aruba is through employee‟s payroll expenses.
Over 2,000 people living in Aruba work in a timeshare resort and payroll expenses are over $30
million (ATSA, 2011).
Business Situation

The timeshare industry is known as one of the fastest growing segments of the tourism industry.
According to American Resort Development Association (ARDA), the U.S. timeshare industry
generated $70 billion of economic output, including $23 billion in income in 2011 (ARDA,
2012). Even through the financial crisis, the timeshare industry has shown impressive stability;
in which the average shared vacation ownership sales price has been more stable, declining only
around 9%, and had occupancy rate of 76% in 2010 (ARDA, 2012). Their research has also
shown that the worldwide hotel industry rates are substantially lower than shared vacation
ownership properties. Even in Aruba, since the year 2006 up to year 2010, timeshares had a
higher occupancy than hotels. Timeshare in Aruba ended the year 2010 with an average
occupancy of 80.6% while hotels had occupancy of 73.5%. (CBS, 2010). And in the US, the
sales volume in 2011 totaled to $6.5 billion, which was a 2.4% increase from 2010 (ARDA,
2012). As the president and CEO of ARDA states it, “The contribution of the timeshare industry
on local economies goes beyond the resort footprint… In addition to sales and corporate
operations, development of new resorts and renovation projects, it also includes the impact of
expenditures from vacationers during timeshare stays” (Burney, 2010).
Tourism is one of the main economic activities on the island, according to the Central Bureau of
Statistics (CBS). This means that Aruba‟s economy is dependent on the tourism industry. The
majority of tourists coming to Aruba are from the U.S., followed by Venezuela and the
Netherlands, according to research done by Aruba Tourism Authority (ATA) (CBS, 2010). As a
result, economic conditions worldwide, and especially in the U.S., have an impact on Aruba. In
2008, the uncertainties surrounding the international economy and the deteriorating employment
conditions in the U.S. had a negative impact on Aruba‟s tourism sector; with stay over visitors
coming to Aruba dropping 4% in 2008 (CBS, 2010). Consequently, the occupancy rate of the
hotels dropped with 2.5% to a level of 73.2% and decreased even more to 72% in 2009,
according to CBS. This drop in visitors coming to Aruba resulted in lowering tourism
expenditures, from a growth rate of 7.1% in 2008 to a level of -5.2% in 2009 (CBS, 2009). The
same decrease counts for timeshare occupancy, which decreased 2% in 2008 (from 82.3% to
80.3%) and decreased another 3% in 2009, reaching 77.3%. However, both timeshare and hotel
occupancy had an increase in 2010, with hotels increasing 1.5% to 73.5% occupancy, and
timeshares increasing 3.3% to 80.6% (CBS, 2010). These figures show how quickly tourism in
Aruba is impacted, but most importantly, how worldwide economic conditions greatly affect the
island.
Figure 1
Occupancy Rates
2008 2009 2010
Hotels 73.2% 72% 73.5%
Timeshares 80.3% 77.3% 80.6%
Source: CBS Aruba

Challenge
Because of the size and impact of tourism in Aruba, it is important to know the segments of the
tourism market. A fair amount of research has been conducted on tourism in Aruba, especially
with hotel tourists. However, there has been very little academic research on the timeshare
industry in the island of Aruba, despite the fact that it has grown so rapidly over the past years.
In addition, as was stated before, the average occupancy for timeshare or vacation ownership
properties has been higher than those of the hotel industry, worldwide and in Aruba, which is
why these types of tourists and their financial input in the economy are extremely important to
Aruba. It is important to know not only how much money timeshare tourists in Aruba spend, but
where and why they spend. By gaining this information, much more can be done to promote and
develop strategies to increase the economic returns of the timeshare industry on the island. In
addition, the expenditures timeshare owners make on maintenance fees and other taxes is also
important to know. ARDA states that “The timeshare industry produces significant amounts of
individual income tax and employment tax at the federal level and contributes to property tax,
sales tax, and occupancy tax revenue for state and local governments” (Burney, 2010).
Research Objective
The objective of this study is to analyze the economic contribution of the timeshare industry in
Aruba. Economic impact is represented by measures of spending, employment, payroll, and tax
revenues generated by traveler spending (U.S. Travel Association , 2010). These include the
retail expenditures, the maintenance fees, and the taxes they pay. When studying retail
expenditures, this study is not only analyzing how much money timeshare tourists spend while in
Aruba, but also why they spend and what factors play a role in their spending patterns. The
reason for this is that if these crucial factors remain unknown, there is nothing that can be done
with the expenditure information to improve it. It is important to know the consumers, their
behaviors, their motives, even their demographics, in finding what influences their buying
behavior. Understanding spending behavior of tourists can help to create policies in order to
increase per person tourist expenditure (Bingöl & Bahar, 2012).Tourist destinations that can
identify the activities that relate to the tourist‟s style can in turn provide souvenir merchandise in
retail environments that will enhance the experience of tourists (Fairhurst, Costello, & Holmes,
2007). The initial direct expenditures of tourists generally stimulate economic activity and create
additional business turnover, personal income, employment, and government revenue in the
destination (Crompton, Lee, & Shuster, 2001). Increasing tourist expenditure is a means to
increase tourist income, which is extremely important for local economies; and in order to
propose plans to increase tourism expenditure, the expenditure pattern of travelers should be
understood (Bingöl & Bahar, 2012). This study will benefit the timeshare resorts and the
different types of retailers in the tourism industry on Aruba, in understanding what the spending
patterns, demands, and needs are of the timeshare owners in Aruba. In addition, this study will
benefit the community of Aruba, in knowing how the timeshare industry is affecting the
economy. A study done by the U.S. Travel Association stated that travelers produce “multiplier”

impacts on the economy; in addition to the goods and services that are purchased directly by
travelers, the inputs used to produce these goods and services are also purchased through travel
industry business operators – indirect travel spending (U.S. Travel Association, 2011). In the
timeshare industry of Aruba, the direct travel expenditures include transportation, lodging,
meals, entertainment & recreation, etc, and the indirect travel spending includes timeshare owner
– generated payroll, employment, tax revenue, and trade surplus. Each of these factors
contributes greatly to the economy.
Research Questions
What is the economic contribution of the timeshare industry on Aruba?
Direct
- What is the average expenditure of timeshare owners in Aruba?
- Where do timeshare owners spend their money?
- What factors influence where timeshare owners spend their money on?
Indirect
- How much money goes into the economy of Aruba by maintenance fees and room
taxes timeshare tourists pay?
- How much money goes into the economy of Aruba by the utility, refurbishing, and
payroll expenses the timeshare resorts pay?
Review of Literature
History of Timeshare

Timeshare, or vacation ownership, is a purchase of the right to occupy an accommodation or
facility for a specified period of time every year over a certain number of years (Powanga &
Powanga, 2008). The timeshare industry first emerged in Europe in the 1960s, in a skiing resort
in France (Kaufman, Lashley, & Schreier, 2009). The skiers wanted to ensure guaranteed
accommodation for skiing. The property owners found that they could sell their rights to have
access to the same accommodation across the whole year (Kaufman, Lashley, & Schreier, 2009).
Soon after, various US resorts began selling timeshare weeks in their resorts (Kaufman, Lashley,
& Schreier, 2009). The affluent years at that time after World War II gave millions of people in
the United States and other nations that were industrialized, the time and money to spend
traveling and on recreational activities, which resulted in an expanding economy and desire to
travel within the states (ARDA, 2002). This led to the rapid development of vacation homes and
condominiums in popular tourist destinations.
During the 1970s, the vacation ownership industry established itself as a permanent part of the
hospitality and leisure industry. Since the 1970s, timeshare has evolved through different
international resort locations and resort types, number of resorts, number of owners, and
variations in the nature of the timeshare offer (Kaufman, Lashley, & Schreier, 2009). The
timeshare owners, in the early stages of timeshare, bought a fixed week in a fixed property. This
could be a fully equipped luxury apartment, villa, cottage, or suite (Kaufman, Lashley, &
Schreier, 2009).
However, over the years, more flexibility has been built into the offer to consumers. These
include different combinations of fixed or float seasons, and fixed or float units. These vary
among the options of purchasing a timeshare in a fixed time period every year, or a float time
within a season of the year, and a fixed unit which is the same exact unit each time, or a float
unit which means they are not tied to the same resort. There is also the point system, which
provides the ultimate flexibility, allowing the consumer to buy enough „points‟ based on their
estimated vacation needs (unit size, length of stay, location, seasonality) (Kaufman, Lashley, &
Schreier, 2009).
Legally, there are several models of approaches taken for handling the sale of timeshare. The
three most common types are deeded interests, right to use, and leasehold agreement. The deeded
interest method is similar to a real estate purchase, where the purchaser receives a title for the
real property being purchased from the timeshare developer, and the unit owner buys the right to
use that unit in perpetuity, and the right to sell it, rent it, or convey it in a will (Kaufman,
Lashley, & Schreier, 2009).
The right-to-use type of conveyance is different; the individual is given contractual rights to use
the timeshare facilities for a specified period of time, usually one week, but for time periods
limited in the agreements, for example 25 years. And a leasehold agreement method is similar to
a right-to-use contract in the way that the purchaser holds a leasehold interest less than a full

ownership interest; the difference is that the time period concerned is shorter than with a right-to-
use agreement (Kaufman, Lashley, & Schreier, 2009).
There are also exchange programs that are known to be crucial to the industry. Exchanging is
when the owner of a timeshare trades the stay at a particular location for a stay at another
equivalent resort in a different location or time or both, usually at some exotic place for a similar
vacation period. This arrangement is facilitated by an exchange company functioning as a broker
between the timeshare owners that charge membership fees for the service. The major exchange
companies timeshare developers tend to affiliate with are Resort Condominiums International
(RCI) and Interval International (II), which allows timeshare owners to instantly become club
members once the contracts become effective (Powanga & Powanga, 2008).
Irrespective of the legal nature of the different agreements, the timeshare consumer is generally
known as the owner. Timeshare developers can build and sell an individual unit for 51 or 52
weeks out of a year, depending on whether a week is excluded for maintenance purposes
(Kaufman, Lashley, & Schreier, 2009). The many different variations in timesharing are
specifically designed to meet the many needs of consumers, so that each timeshare owner has a
product that works for him or her. For that reason, it is extremely important to know and
understand timeshare consumers. This starts with consumer behavior research.
Consumer Behavior and Drivers
Consumer behavior research is important in finding out what drives people to spend on travel,
tourism, retailers, etc. Consumer behavior research can be characterized as the study of people
operating in a consumer role involving acquisition, consumption, and disposition of marketplace
products, services, and experiences (Macinnis & Folkes, 2010). Consumer behavior studies are
done to understand how and why consumers behave as they do (Wilkie & Moore, 2003). This
means that motivation is the starting point for any effort to understand consumer behavior, which
is a dynamic and continuous process (Hsu, Cai, & Li, 2010). In tourism, consumer behavior
research is extremely important. Tourism and hospitality marketers need to tailor their offerings
to each market segment because of different psychological needs, values, and concerns that drive
consumer behavior in the tourism marketplace (Cleaver, Green, & Muller, 2000). Once these
drivers are determined, then the ability to understand how to influence the consumer decision
making process becomes more of an art than an assumption process (Kaufman & Upchurch,
2007). Research has been done evaluating demographics of tourists and its effect on their
behavior. It is evident that studying consumer behavior has a major role in finding out why and
where consumers spend their money. Since this study is on how the timeshare owners spend their
money, it is crucial to understand their motivations and behavior in order to optimize resources
and increase their expenditures.
Previous Studies
Timeshare in the Tourism Industry in the US

Tourism in any community has a great economic impact in it. Tourism expenditure can be
defined as the total consumption expenditure made by a visitor or on behalf of a visitor, for and
during his/her trip and stay at the destination (WTO, 1995). According to previous studies,
tourists spend around one-third of their total tourism expenditures on retail purchases (Gratton &
Taylor, 1987) (Littrel, et al., 1994). According to the Tourism Satellite Account (TSA), the
starting point of any analysis of the economic impact of tourism is represented by tourist
expenditure. The TSA is a conceptual framework proposed by international organizations such
as United Nations World Tourism Organization, that measures the size and economic importance
of the tourism industry, including the timeshare sector. The tourists that own timeshares incur no
accommodation expenditure, instead, there are “maintenance costs” paid by the owners. All
these costs/expenditures are very important when analyzing the impact of timeshares from an
economic point of view. The TSA proposed two categories of tourism expenditure related to
vacation homes. The first is the usual expenditures made by tourists during their stay in a
vacation home (timeshare) such as expenditure for transportation, outside meals (e.g.
restaurants), cultural and sporting activities, car rental, etc. The second category includes the
current expenditures related to a vacation home by its owner (developer) as a producer of
accommodation services. This category represents maintenance costs of the timeshare; these
involve fees for use of timeshare facilities (for linen service, cleaning, etc.) which are included in
tourism expenditure. These also account for day-to-day running expenses like property
management services, and also expenditure on major improvements that extend the life of the
physical property (Frent, 2009).
Expenditures
Worldwide, the timeshare, or shared vacation ownership industry supported nearly 1.1 million
jobs in 2010, of which industry operations, off resort vacation expenditures, and capital
expenditures generated over 498,000 direct jobs (ARDA, 2012). This shows the crucial
economic impacts that the timeshare industry has on economies worldwide. In the U.S., spending
by timeshare owners and guests during stays was estimated at $9.2 billion in 2011; of which $1.5
billion was spent on-site at resorts, while $7.8 billion was spent off-site in the communities
where the timeshare resorts are located, based on ARDA‟s study of the economic impact of the
timeshare industry on the U.S. economy. An average of $1,509 each traveling party spends per
vacation. This was based on an average travel party size of 3.45 people, with the average total
spending per person being $437. The category that most money is spent on is restaurant, bar, and
drinking place activities, with an average total spending per party of $265. For the categories
clothing and accessories, groceries, amusement parks, arcades, and gambling, ground transit, and
gasoline stations, total spending average per party is usually between $100- $150 (ARDA, 2012).
Timeshare owners are repeat visitors, and repeat visitors are arguably the backbone of a local
tourist economy (Ragatz & Crotts, February 2000). Timeshare owners inject new spending into
local economies, which in turn ripples through the economy, creating additional income and
jobs. In addition, even though timeshare owners have paid the majority of their lodging costs

“up-front,” their trip expenditures on average are more often greater that tourists‟ in general
(Ragatz & Crotts, February 2000).
Maintenance Costs
While hotel operations earn revenues largely from hotel room charges, timeshare resorts have
multiple sources, which include timeshare contract sales, interest payments on mortgaged suites,
maintenance fees and club membership fees. Moreover, timeshares tend to be immune to
variations in economic performance because the timeshare owners are contractually bound to
occupy their units (Powanga & Powanga, 2008). In addition to the purchase price of their
timeshare, which creates local jobs in construction, marketing, and other industries, timeshare
owners are assessed an annual fee, to pay for on-going maintenance and operations at their
resort, property management, plus local property tax assessments (Ragatz Associates, RCI,
2003). There is always a risk that maintenance, operational or other levies of the timeshare
scheme may increase. However, these levies are normally contractually payable annually by the
timeshare members. Increases in costs associated with operations or maintenance will of course
be passed on to members, though some constitutions limit these increases (Hovey, 2002). The
annual maintenance fee is generally quite high. Maintenance fees are made up of both building
maintenance and service to members (Hovey, 2002). The typical expenses included in the
maintenance fee are shows in the table below. (Ziobrowski & Ziobrowski, 1997) (Hovey, 2002).
Maintenance Expenses
Accounting and auditing fees Local authority charges, levies and rates
Activities provision Loss prevention
Administration Management fees
Building Maintenance Other contingencies
Cable television Pest control
Cleaning: general Pool and spa heating
Cleaning fees Pool and spa maintenance
Directors and other management expenses Postage, printing and handling
Electricity Professional fees
Elevator expense Reservations and front desk
Entertainment facilities Reserve for replacement fund
Furniture and chattels replacement/maintenance Resort fees
Grounds and landscaping maintenance Taxes: state and federal
Housekeeping services Telephone
Insurances Tennis court maintenance
Internet fees Waste collection
Inventory replacement Water and sewage
It should be noted that resort maintenance fees or exchange fees are usually not calculated into
the average expenditures of timeshare owners, indicating that most of these expenditures are to
other businesses. These unreported maintenance fees that support the timeshare resorts create
local jobs and additional income as these employees and the resorts themselves purchase a

variety of goods and services locally (Ragatz & Crotts, February 2000). During 2002, owners of
U.S. timeshares spent about $1.55 billion in communities to maintain their resorts, plus $319
million in local property taxes that helped support local schools and other community services.
These figures are from more than a decade ago, which means that today these are much higher
(Ragatz Associates, RCI, 2003).
Tourism in Aruba
Economic impact is defined as the net economic change in the incomes of host residents that
results from spending attributed to tourists (Crompton J. , 2006). In Aruba, the Central Bureau of
Statistics has done much research on tourists, their demographics, how much they spend, where
they spend, etc. This information is important in finding information on the types of tourist
coming to Aruba. In the year 2011, 871,316 tourists visited Aruba, and the average length of stay
was 7.5 days (CBS, 2011). The household income of the visitors coming to Aruba is on average
more than $50,000. The estimated total tourism expenditure in Aruba for the year 2011 was
$822,457,142 according to Central Bank of Aruba, (CBA, 2012). According to CBA, tourism
receipts totaled to $1,431,428,571 in 2012. The average daily expenditure for tourists in Aruba is
the highest among tourists from Venezuela, with a figure of $144.49 per day, and the second
highest is from US tourists, which was $88.24, in 2011. The household income level of tourists
has a major effect on average daily expenditure while on Aruba. Naturally, the higher the income
is, the higher the expenditures will be. Research shows that the average daily expenditure are the
highest among the tourists who have a household income of $100,001 and over, with an average
of $118.41 per person, and the second largest income group, which have a household income of
$75,001 to $100,00, spend an average of $103.49 per person (CBS, 2010). When it comes to
what the tourists spend their money on, the category with the highest figures is food and
beverage, with an average daily expenditure of $21.60 per person. The second category that most
money is spent on is shopping, with an average daily expenditure of $20.86 per person. The rest
of the categories, with the exception of casino that accounts for an average of $13.80 per day,
have average daily expenditures between $1 to $10 (CBS, 2011). The total average expenditure
per person per trip totaled to $661.80 in 2011 (CBS, 2011). These figures account for all types of
tourists that stayed in Aruba.
Timeshare Industry in Aruba
Timeshare has been around in Aruba for more than 30 years, ever since Aruban developer
Raymond Maduro opened Aruba Beach Club in 1977 (van Nes & Heijdeman, 2006). The
timeshare industry not only attracts tourists to Aruba, but it also produces a constant flow,
because most people return to Aruba for years. Besides the revenue that the timeshare owners
bring to Aruba, they also help generate jobs on the island. In 2006, nearly 15% of the jobs in
Aruba were in the hotel and restaurant sector, according to a study done by student Marieke
Heijdeman and Jan van Nes, General Manager at the Playa Linda Beach Resort Aruba. Now this
percentage has grown to 24.8% (CBS, 2011). Aruba‟s timeshare members are known to be very

loyal and generally return to Aruba, giving the island a steady base of income, even during low
season (van Nes & Heijdeman, 2006). Another study was done on the timeshare industry in
Aruba by Dr. Ryan R. Peterson in 2008. Over 1500 surveys from all timeshare properties on the
island were collected and analyzed. The findings were benchmarked and Dr. Peterson produced
significant results and conclusions. Over 90% of the respondents were US residents, of which
80% are considered baby boomers. Approximately 50% of the respondents earn more than
$90,000. The study also found that in Aruba, 70.2% of timeshare tourists purchased their first
timeshare before the year 2000; and 29.8% purchased their first timeshare after 2001. This shows
that a large percentage of timeshare owners in Aruba have bought their timeshare more than ten
years ago, and most of them are between 50 to 69 years of age. From these, 57% of the
respondents acquired timeshare through new purchase, yet 37% buy on resale. More than 50% of
the respondents have bought more timeshare at the same property, and approximately 40% have
bought timeshare at a different property. Furthermore, 70% of respondents have never exchanged
their timeshare in Aruba, which shows that they are loyal to the destination. Out of all the
respondents, almost 60% are considered heavy repeaters, having visited more than 10 times. The
average length of stay is 12.5 days (Peterson R. R., 2008).
From the total tourists coming into Aruba, 28.8% were timeshare tourists in 2011 (CBS, 2011).
This figure has varied a lot over the years. In the year 2000, timeshare owners accounted for
29.5% of all tourist visitors in Aruba. By 2005, they accounted for 32.9%, and had grown to
40.1% by 2007 (CBS, 2010). However, recession hit the US in 2008 and since most tourists are
from the US, Aruba‟s timeshare industry was greatly affected by it. The percentage of timeshare
visitors in Aruba dropped in the years following 2007 until it reached 28.8% in 2011 (CBS,
2011). From the tourists staying in a timeshare, 62.1% are owners, 3.3% are transient, and 34.6%
are exchange and other non owners (CBS, 2010). During the past decades, there has been
substantial growth in timeshare tourism in Aruba; however, the recession has inevitably
inevitably affected all tourism sectors.
The timeshare resorts in Aruba have also grown in room numbers. In 2000, the total rooms in
Aruba, including both hotels and timeshare was 6,730, and timeshare rooms accounted for 37%
of these. By 2005, timeshare had 41.2% of rooms on Aruba (CBS, 2009). In 2009, timeshare had
a high of 49.2% of all 7,500 rooms. This number decreased and by 2010, the total amount of
rooms on Aruba was 7,314, and timeshare had 46% of these rooms (CBS, 2010). According to
the Aruba Timeshare Association, Aruba has approximately 3,100 timeshare units in total, which
has the potential of generating 1,376,796 room nights (ATSA, 2011). The average yearly
occupancy is 80.6%, which generates 911,989 room nights. The taxes per night paid by the
timeshare owners, based on the average occupancy, generates approximately $11,379,799 for the
community (ATSA, 2011). From the year 2007-2011, utilities expenses have increased
significantly. These are displayed in the table below.
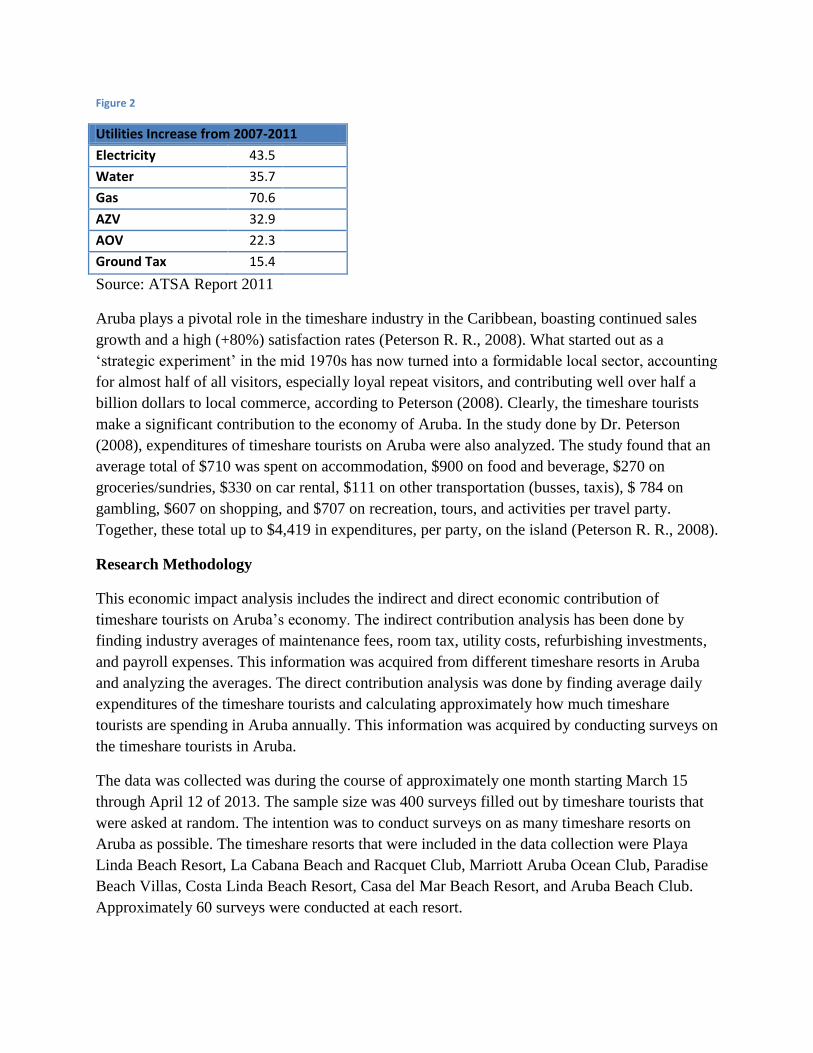
Figure 2
Utilities Increase from 2007-2011
Electricity 43.5
Water 35.7
Gas 70.6
AZV 32.9
AOV 22.3
Ground Tax 15.4
Source: ATSA Report 2011
Aruba plays a pivotal role in the timeshare industry in the Caribbean, boasting continued sales
growth and a high (+80%) satisfaction rates (Peterson R. R., 2008). What started out as a
„strategic experiment‟ in the mid 1970s has now turned into a formidable local sector, accounting
for almost half of all visitors, especially loyal repeat visitors, and contributing well over half a
billion dollars to local commerce, according to Peterson (2008). Clearly, the timeshare tourists
make a significant contribution to the economy of Aruba. In the study done by Dr. Peterson
(2008), expenditures of timeshare tourists on Aruba were also analyzed. The study found that an
average total of $710 was spent on accommodation, $900 on food and beverage, $270 on
groceries/sundries, $330 on car rental, $111 on other transportation (busses, taxis), $ 784 on
gambling, $607 on shopping, and $707 on recreation, tours, and activities per travel party.
Together, these total up to $4,419 in expenditures, per party, on the island (Peterson R. R., 2008).
Research Methodology
This economic impact analysis includes the indirect and direct economic contribution of
timeshare tourists on Aruba‟s economy. The indirect contribution analysis has been done by
finding industry averages of maintenance fees, room tax, utility costs, refurbishing investments,
and payroll expenses. This information was acquired from different timeshare resorts in Aruba
and analyzing the averages. The direct contribution analysis was done by finding average daily
expenditures of the timeshare tourists and calculating approximately how much timeshare
tourists are spending in Aruba annually. This information was acquired by conducting surveys on
the timeshare tourists in Aruba.
The data was collected was during the course of approximately one month starting March 15
through April 12 of 2013. The sample size was 400 surveys filled out by timeshare tourists that
were asked at random. The intention was to conduct surveys on as many timeshare resorts on
Aruba as possible. The timeshare resorts that were included in the data collection were Playa
Linda Beach Resort, La Cabana Beach and Racquet Club, Marriott Aruba Ocean Club, Paradise
Beach Villas, Costa Linda Beach Resort, Casa del Mar Beach Resort, and Aruba Beach Club.
Approximately 60 surveys were conducted at each resort.

The survey firstly measures the type of timeshare tourist visiting Aruba, starting with whether
the respondent is a timeshare owner in Aruba or not. If they are a timeshare owner, it asks what
kind of timeshare ownership they have (right of use, deeded interests, etc.). And if they are not a
timeshare owner, it asks the way they are affiliated with timesharing (renting, exchange, etc).The
survey also measures length of stay and weeks owned. Secondly, the survey measures the
interests of the timeshare tourists while on Aruba, to find what motivates them to spend. These
include questions on importance of activities and primary interests while on Aruba. The third
part of the survey measure expenditures. These include traveling expenditures and expenditures
made while on Aruba, in the different categories of expenditures, and total. Lastly, the survey
measures the demographics of the timeshare tourists, such as age, income, and education.
Results
Figure 3
Nearly 70% of the survey respondents that are staying in a timeshare are an owner. This means
that a large majority of Aruba‟s timeshare tourist are owners in Aruba‟s timeshare resorts. Those
that don‟t own a timeshare in Aruba, are either renting one, exchanged their timeshare to one in
Aruba, received it as a gift, or are a guest of a timeshare owner.
69%
31%
Do you own a timeshare in Aruba?
Yes
No

Figure 4
From the 69% of timeshare tourists that are owners, a majority of owners are fixed week. These
include the 39% that have simply a fixed week, the 11% that have fixed week/membership, and
another 11% that have fixed week/deeded interests. Together, the owners with fixed week part of
their timeshare ownership make up for make up for 61% of timeshare owners in Aruba.
Figure 5
1%
22%
39%
7%
9%
11%
11%
Types of timeshare owership
Right of use
Deeded interests
Fixed week
Point program
Membership
Fixed week/ Membership
Fixed week/ Deededinterests
46%
33%
15%
6%
Affiliated with timesharing
Renting a timeshare
Exchanged timeshare toresort in Aruba
Received it as a gift
As guest
From the 31% of respondents who do not own a timeshare in Aruba the majority (46%) are
renting a timeshare, followed by 33% that are exchangers. A small percentage received it as a
gift or are guests of timeshare owners.
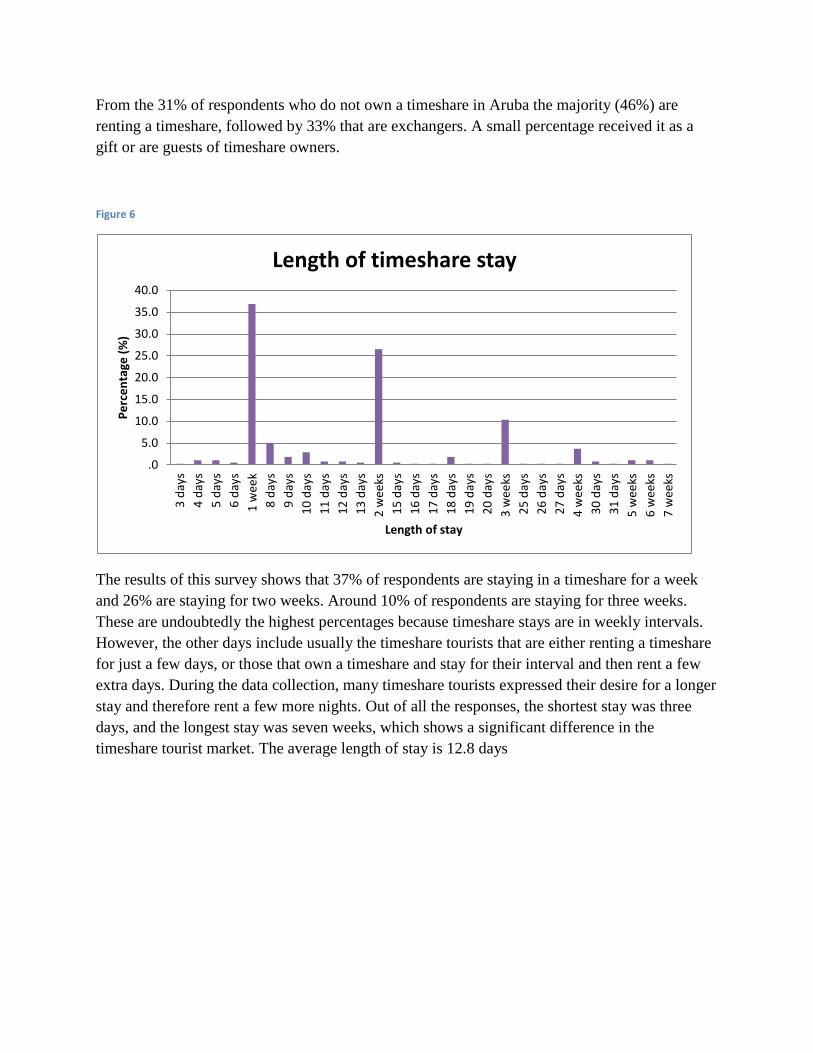
Figure 6
The results of this survey shows that 37% of respondents are staying in a timeshare for a week
and 26% are staying for two weeks. Around 10% of respondents are staying for three weeks.
These are undoubtedly the highest percentages because timeshare stays are in weekly intervals.
However, the other days include usually the timeshare tourists that are either renting a timeshare
for just a few days, or those that own a timeshare and stay for their interval and then rent a few
extra days. During the data collection, many timeshare tourists expressed their desire for a longer
stay and therefore rent a few more nights. Out of all the responses, the shortest stay was three
days, and the longest stay was seven weeks, which shows a significant difference in the
timeshare tourist market. The average length of stay is 12.8 days
.0
5.0
10.0
15.0
20.0
25.0
30.0
35.0
40.0
3 d
ays
4 d
ays
5 d
ays
6 d
ays
1 w
eek
8 d
ays
9 d
ays
10
day
s
11
day
s
12
day
s
13
day
s
2 w
eeks
15
day
s
16
day
s
17
day
s
18
day
s
19
day
s
20
day
s
3 w
eeks
25
day
s
26
day
s
27
day
s
4 w
eeks
30
day
s
31
day
s
5 w
eeks
6 w
eeks
7 w
eeks
Pe
rce
nta
ge (
%)
Length of stay
Length of timeshare stay

Figure 7
The highest percentage of respondents own two weeks being 34% and the second highest is one
week, which is 29%. This is because timeshares are generally sold in weekly intervals, and the
most common purchases are for one or two weeks. Evidently, the more weeks owned, the less
the percentages of timeshare owners there are, simply because the cost for each extra week is
very high. The average amount of weeks owned is 2.5 weeks.
Importance of Activities
29%
34%
17%
10%
5%
2% 1%
0% 1% 1%
0%
Weeks Owned
1 week
2 weeks
3 weeks
4 weeks
5 weeks
6 weeks
7 weeks
8 weeks
9 weeks
10 weeks
12 weeks
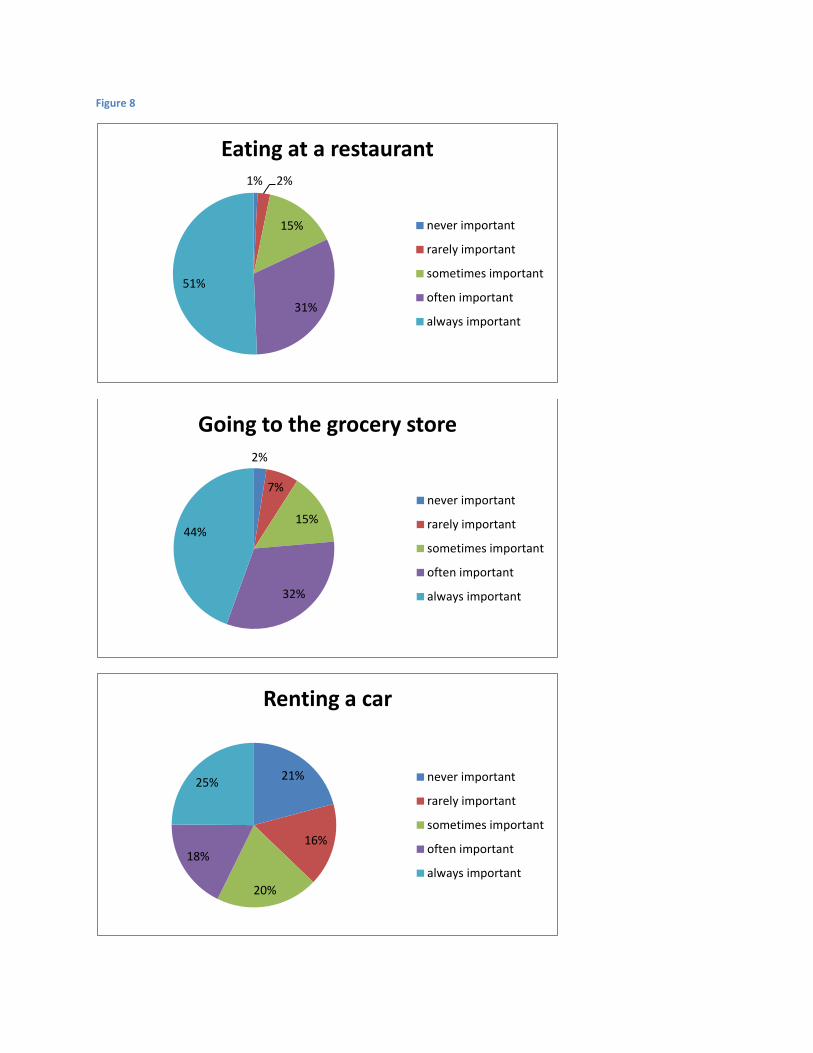
Figure 8
1% 2%
15%
31%
51%
Eating at a restaurant
never important
rarely important
sometimes important
often important
always important
2%
7%
15%
32%
44%
Going to the grocery store
never important
rarely important
sometimes important
often important
always important
21%
16%
20%
18%
25%
Renting a car
never important
rarely important
sometimes important
often important
always important

8%
20%
39%
19%
14%
Shopping
never important
rarely important
sometimes important
often important
always important
25%
34%
24%
10%
7%
Buying jewelry
never important
rarely important
sometimes important
often important
always important
16%
30%
32%
15%
7%
Buying local crafts and souvenirs
never important
rarely important
sometimes important
often important
always important

26%
24% 20%
15%
15%
Going to a casino
never important
rarely important
sometimes important
often important
always important
29%
29%
27%
12%
3%
Participating in sport activities
never important
rarely important
sometimes important
often important
always important
22%
30%
34%
11%
3%
Going to entertainment events
never important
rarely important
sometimes important
often important
always important
28%
35%
27%
7%
3%
Going on tours
never important
rarely important
sometimes important
often important
always important
18%
21%
23%
19%
19%
Buying liquor
never important
rarely important
sometimes important
often important
always important
39%
30%
19%
8%
4%
Buying luxury brands
never important
rarely important
sometimes important
often important
always important

These charts show the percentages of the responses for each category of activities. Eating at a
restaurant for most timeshare tourists is important; for 51% it is always important, and for 31% it
is often important. Going to the grocery store is also of great importance to timeshare tourists,
with 44% saying it‟s always important, and 32% saying it‟s often important. Eating at a
restaurant and going to the grocery store are naturally the two most important activities for
timeshare tourists.
Renting a car is the variable with the most differentiating opinions. 25% stated that renting a car
is always important and 21% stated it was never important. These are the opposite categories and
also the ones with the highest percentage. However, all the options from never important all the
way to always important are almost equal in percentage. Adding up the never important and
rarely important categories would equal up to37% of the respondents, and often important and
always important make up for 43% of the total. In addition, those who filled in sometimes
important make up for 20% of the total. These results show that only a small percentage of
timeshare tourists prefer renting a car over other taking other forms of transportation, but
generally half of timeshare tourists find renting a car important and half do not.
With shopping, the results show that nearly 40% found shopping sometimes important, 19%
often important, and 20% rarely important. This shows that a majority of timeshare tourists find
shopping sometimes important, and the rest are divided at around half, between finding shopping
important or not.
The chart for buying jewelry shows that a majority of respondents don‟t find buying jewelry
important, with 25% saying it‟s never important, and 34% saying its rarely important. The results
for buying local crafts and souvenirs is shows that 32% find it sometimes important, yet 16%
find it never important, and 30% find it rarely important, which if added together, shows that
36% find that buying local crafts and souvenirs are rarely, if ever, important to them.
Going to a casino presents a different case, where the responses are very spread apart. 26% stated
it is never important, and 24% stated it is rarely important. From this chart can be concluded that
50% of respondents find casino never or rarely important, 30% finds it often or always
important, and 20% finds it sometimes important.
The results for the variables participating in sport activities and going to entertainment events are
very similar. For a majority of respondents, these activities are rarely or never important, and
around 30% find them sometimes important.
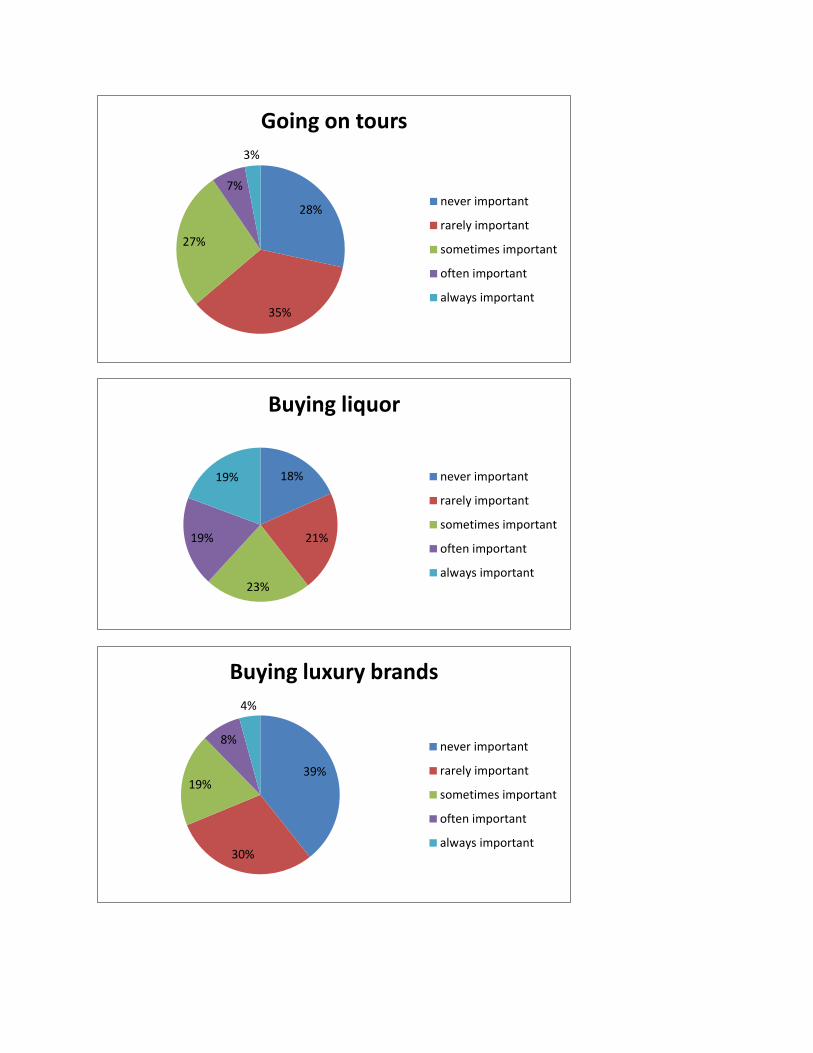
For the activity, going on tours, a 28% said it‟s never important, and 35% said it‟s rarely
important. This shows that a majority of respondents do not care for going on tours. From
conversations with the tourist completing the survey, it was clear to see that because a majority
of timeshare tourists have been retuning for many years, they have seen all of Aruba, and are not
interested in going on tours and seeing the same places. In their words, touring is a “been there,
done that” activity.
For the activity buying liquor, the percentages for each response are almost equal to each other.
This means that around 40% of timeshare tourists find buying liquor important, 40% do not, and
around 20% find it sometimes important. Lastly, a majority of timeshare tourists find buying
luxury brands rarely or never important.
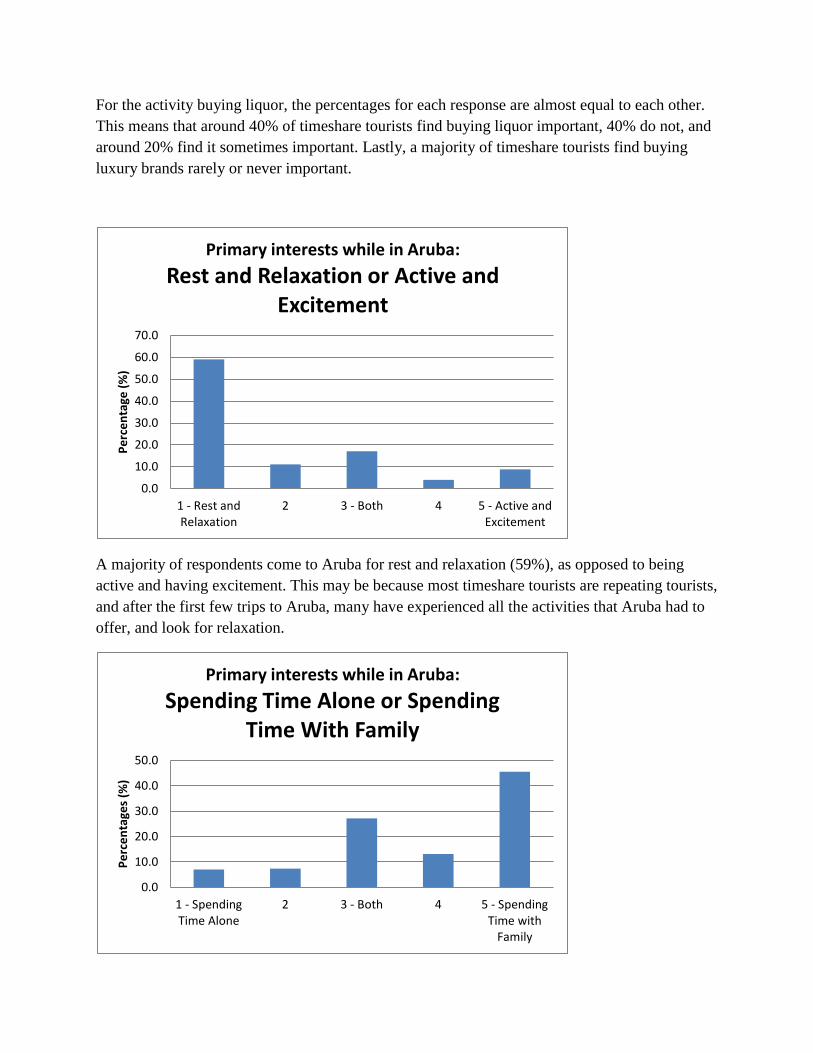
A majority of respondents come to Aruba for rest and relaxation (59%), as opposed to being
active and having excitement. This may be because most timeshare tourists are repeating tourists,
and after the first few trips to Aruba, many have experienced all the activities that Aruba had to
offer, and look for relaxation.
0.0
10.0
20.0
30.0
40.0
50.0
60.0
70.0
1 - Rest andRelaxation
2 3 - Both 4 5 - Active andExcitement
Pe
rce
nta
ge (
%)
Primary interests while in Aruba:
Rest and Relaxation or Active and Excitement
0.0
10.0
20.0
30.0
40.0
50.0
1 - SpendingTime Alone
2 3 - Both 4 5 - SpendingTime with
Family
Pe
rce
nta
ges
(%)
Primary interests while in Aruba:
Spending Time Alone or Spending Time With Family

It is also apparent that spending time with family is what is important to most respondents
(45%); however, there is a significant amount (27%) that checked in the middle, meaning they
would like both spending time alone and spending time with family.
Around 30% of respondents did not fill in this question. This is a significant amount and it shows
that they are not interested in renting a car and exploring, nor taking guided tours. This is why
the factor is also included in the chart. A majority of respondents were not interested in either
activity, but 25% were in the middle of the two, showing that they were interested in both and
23% preferred renting a car and exploring.
0.0
5.0
10.0
15.0
20.0
25.0
30.0
35.0
1 - Rent acare andexplore
2 3 - Both 4 5 - Takingguidedtours
Neither
Pe
rce
nta
ge (
%)
Primary interests while in Aruba:
Rent a Car and Explore or Take Guided Tours
0.0
10.0
20.0
30.0
40.0
50.0
60.0
70.0
1 - Safety andSecurity
2 3 - Both 4 5 - Adventurous
Pe
rce
nta
ge (
%)
Primary interests while in Aruba:
Safety and Security or Adventurous

60% if respondents find safety and security a primary interest while on Aruba, as opposed to
being adventurous. Around 18% of respondents prefer both safety and security, and feeling
adventurous. This shows that a majority of timeshare tourists find it more important to feel safe
and secure than to feel adventurous while they are on Aruba.
In terms of travel party size, 63% of timeshare tourists had a travel party of 1-2 people, 23% with
a travel party of 3-4 people, and 14% with 5 of more people. The average timeshare tourist travel
party consists of 2.9 people.
63%
23%
14%
Travel Party Size
1-2 people
3-4 people
5 and more people
0
10
20
30
40
50
60
70
80
90
0 1 2 3 4 5 6 7 8 9
Pe
rce
nta
ges
(%)
Number of people
Travel Party: Adults and Children
Adults
Children

The chart displaying adults and children in the travel party shows that a majority of respondents,
81%, did not bring any children with them while staying in their timeshare, meaning that only
around 19% of timeshare tourists had children in their travel party. 66% of respondents had 2
adults in their travel party. During the data collection, it was surprising to see that there were not
as many timeshare tourists traveling with children as was expected. As was evident in both the in
the data collection period and the results, most travel parties consisted of 2 people, a man and a
woman.
The ages of respondents were at a wide range. 31% of the respondents were 55-64 years old, and
28% were 65-74 years old. These are the largest categories of timeshare visitors. In the figure, it
is apparent that around 67% of timeshare tourists are over 55 years old, and only 33% are less
than 55 years old. The average age is 58 years old. Out of all the respondents, the youngest was
25 years old and the oldest was 89 years old.
4%
11%
18%
31%
28%
7%
1%
Age Groups
25-34
35-44
45-54
55-64
65-74
75-84
85 and over

During the data collection period, it was apparent that most timeshare tourists are with their
spouse. This means that a majority of survey takers were with their husband or wife, however,
the women usually filled out the survey.
The timeshare tourists were chosen at random, yet 88% of respondents live in the United States,
showing that a significant majority of Aruba‟s timeshare tourists are U.S. residents. Another 6%
is from Canada, and 4%from Venezuela. Just a few people from the rest of the countries shown
had filled in a survey, and account for less than 1% each.
39%
61%
Gender
Male
Female
88%
1% 4%
0%
6%
0% 0% 1%
Country of Residence
United States
The Netherlands
Venezuela
Brazil
Canada
Colombia
Germany
Other

34% of respondents are timeshare tourists who have an annual household income of $100,001
and over, and 17% earn $75,001-$100,000. There are 24% of survey respondents that said they
prefer not to state, which means that the household income for about a quarter of the survey
respondents remain unknown. This is because many people do not like sharing this information
because it is personal.
As can be seen, a significant majority of timeshare tourists are married. During the data
collection, a majority of the widowed timeshare tourists expressed that they used to come with
their spouse and are now coming either alone or with friends or family members.
1% 1%
7%
13%
17%
34%
3%
24%
Income (US$)
less than $20,000
$20,000-$30,000
$30,001-$50,000
$50,001-$75,000
$75,001-$100,000
$100,001 and over
Unknown
Prefer not to state
84%
5% 6%
5%
Marital status
Married
Divorced
Single
Widowed

30% of the survey respondents have a four year college degree (BA or BS), 18% have a Master‟s
degree, and another 18% have some college education. Respondents who have a four year
college degree, master‟s degree, or doctoral degree, make up for 55% of the respondents.
0%
15%
18%
12% 30%
18%
7%
Education
Less than High School
High School
Some College
2 Year College Degree (Associate)
4 Year College Degree (BA, BS)
Master's Degree
Doctoral Degree

The majority of respondents (34%) spent $1001-$1500 on airfare, and 25% of respondents spent
$501-$1000 on airfare.
Average Total Daily Expenditure
Per Party Per Person
$506 $199
5%
25%
34%
15%
5%
6%
2%
2% 1%
3%
0% 1% 0% 1% 0% 0%
Traveling expenditures before coming to Aruba (airfare)
0-500
501-1000
1001-1500
1501-2000
2001-2500
2501-3000
3001-3500
3501-4000
4001-4500
4501-5000
5001-5500
5501-6000
7001-7500
7501-8000

The categories with the highest expenditure per day are restaurants ($165), jewelry ($72),
groceries ($57), and gambling and casino ($55). The average total daily expenditures per party is
$506. The average total daily expenditures per person is $199.
020406080
100120140160180
Expenditure in US$
Expenditure Category
Average Daily Expenditure Per Party

Timeshare Industry in Aruba – Then and Now
Although there have been various studies on consumer behavior, on tourists, and on
expenditures, there are very few that concerns the timeshare industry. The Timeshare Value
Study done by Dr. Ryan Peterson in 2008 is a very good reference for comparison, especially
because it was conducted in Aruba. One factor to take note of is that the sample size in the 2008
study was over 1500 surveys, and the sample size for this study was 400 surveys. There are
several similarities and differences between this current study and the study by Ryan Peterson. In
2008, the average length of stay was 12.5 days, and in this current study, the average length of
stay 12.8 days. This means that during the past 5 years, the average length of stay remained
almost the same. In both studies, the average travel party size was 2.9 people. In the 2008 study,
the total expenditure per party was estimated to be around $4,419. In this study, the average total
purchases per day ($506) multiplied by the average number of days (12.8) is estimated at $6,476
total in expenditures per party. This shows a big increase in average total expenditures. This can
also be seen in the average daily expenditures per person, which used to be $126 in 2008, and is
now $199. In the 2008 study by Peterson, the average expenditures were said to be down by 20%
since the years 2000-2006. This study shows the significant increase in average expenditures.
Comparison between 2008 and 2013 Peterson (2008) Baarh (2013)
Average Length of Stay 12.5 days 12.8 days
Average Travel Party Size 2.9 people 2.9 people
Average Expenditures Per Day Per
Person
$ 126.00 $ 199.00
Average Total Expenditures Per
Party
$ 4,419.00 $ 6,476.00
In terms of demographics, 93% of respondents were U.S. residents, 6% from Canada, and 1%
other, in the 2008 study. In this study, 88% are U.S. residents, 6% Canada, 4% from Venezuela,
and 2% are from other countries. Unfortunately, the annual household income data of the two
studies cannot be compared because the income categories are very different.

In age, there are several significant differences between 2008 and 2013. The table below displays
the percentages of respondents in the different age groups.
Peterson (2008) Baarh (2013)
-39 2% -39 10%
40-49 15% 40-49 11%
50-59 32% 50-59 26%
60-69 40% 60-69 36.5%
70+ 11% 70+ 16.5%
The average total amount of money spent in each category per travel party also shows several
changes. The expenditure categories are different in each study; therefore not all the averages
can be compared. As can be seen, the majority of expenditures increased, with food and beverage
category and grocery and sundries category having the highest increase. There is a slight
decrease in gambling, and a significant decrease in recreation/tours/activities categories.
Shopping has stayed almost the same over the past 5 years.
Expenditure Categories Peterson (2008) Baarh (2013)
Accommodation $ 710.00
Food and Beverage $ 900.00 $ 2,424.00
Groceries and Sundries $ 270.00 $ 735.00
Car Rental $ 330.00 $ 521.00
Other Transportation $ 111.00 $ 154.00
Gambling $ 784.00 $ 705.00
Shopping $ 607.00 $ 617.00
Recreation/Tours/Activities $ 707.00 $ 358.00
Local Souvenirs and Crafts $ 124.00
Jewelry and Luxury Brands $ 1,077.00
Other Purchases $ 171.00

What factors are affecting where they spend money?
Several analyses were done to find relationships between the variables concerning types
of timeshare tourists, preferred activities, interests, and demographics, with the different
categories of expenditures. This was done to find out what factors are affecting the spending
patterns of timeshare tourists.
Timeshare owners in Aruba spend more money on restaurants, jewelry, groceries, and
gambling and casino. Those that do not own a timeshare in Aruba spend more on shopping, local
souvenirs and crafts, general recreation, tours and sightseeing, and liquor. This is evidently
because most owners in Aruba come yearly and are not as interested in different activities like
recreation or buy souvenirs anymore because they have been coming to Aruba for many years.
Those that do not own in Aruba do not know the island as well and are more interested in doing
different activities. In terms of the different types of timeshare owners, they do not vary
significantly in where they spend money. From the non-owners in Aruba, the timeshare tourists
renting a timeshare have the highest expenditures in most categories.
The analysis on the different categories of activities has shown that the more important
the activity is, the higher the spending will be. The analysis on the interests has shown that the
timeshare tourists that are interested in rest and relaxation tourist spend more money on luxury
brands and tours, and active and excitement tourists spend more money on gambling/casino and
entertainment events. In addition, the timeshare tourists that prefer spending time alone are found
to spend more than those that prefer spend time with family. Those that are interested in renting a
car naturally have the highest expenditures in car rental, and those that prefer taking tours have
the highest expenditures in shopping and luxury brands. In terms of the timeshare tourists
interested in feeling safe and secure and those interested in feeling adventurous, there are no
significant differences in their spending patterns.
In terms of gender, men are spending more than women in most categories. This may be
because men are usually the one that covers the expenditures. The expenditure patters among age
groups vary. The youngest timeshare tourists (25-34) are spending the most on local souvenirs
and crafts, the timeshare tourists of 35-44 years old are spending the most on general recreation,
entertainment events, and luxury brand. The timeshare tourists of 45-54 years old are spending
the most on shopping and tours, and those that are 55-64 years old are spending the most on
jewelry. The timeshare tourists that are 65-74 are spending the most on car rental compared to
the rest. In terms of restaurant, groceries, and taxi, the spending is similar amongst all ages.
In terms of household income, the timeshare tourists that have an income of $75,001-
$100,000 are spending the most on restaurants and those with an income over $100,000 are
spending the most on jewelry. In marital status, the married timeshare tourists naturally spend the
most on restaurants, groceries, and recreation. This is evident because in for married tourists, the
expenditures such as restaurants and groceries are for two people. Divorced timeshare tourists

spend the most on gambling and casino while singles spend the most on jewelry and luxury
brands. Widowed and divorced timeshare tourists have the highest expenditures on sport
activities. Regarding the level of education, the timeshare tourists with the highest expenditures
in most categories are those with a master‟s degree.
Economic Impact Analysis
An economic impact analysis includes both the direct and the indirect economic impacts. In
order to carry out the indirect economic impact analysis, the averages of several factors were
taken. These include maintenance fees per room, room tax per night, total utility costs per year,
total investment in refurbishing per year, and total payroll expenses per year. The analysis for the
direct economic impact was done using the data on expenditures.
Indirect Factors:
Impact of Maintenance Fees Calculation:
Timeshare Units in Aruba x Timeshare Weeks in a Year = Total Potential Units to Sell
Total Potential Units to Sell x Average Yearly Occupancy = Total Used Units per Year
Total Used Units per Year x Percentage Being Used by Timeshare Owners = Amount of Owned
Weeks a Year
Amount of Owned Weeks a Year x Average Maintenance Fee per Room = Estimate Total
Impact of Maintenance Fees on Aruba.
Aruba has approximately 3,100 timeshare units. Timeshare resorts usually sell 51 weeks out of a
year. This means that Aruba has (3,100 x 51) = 158, 100 potential timeshare weeks in a year to
sell. Based on the yearly occupancy of 80.6%, Aruba has approximately 127,428 used weeks per
year. However, only timeshare owners pay maintenance fees. Based on the results of the survey,
approximately 70% of timeshare tourists in Aruba are owners. This implies that approximately
70% of the timeshare visitors using the 127,428 weeks a year, are paying the yearly maintenance
fees. The approximate amount of owned weeks a year is (70% x 127,428) = 89,199 weeks. Based
on the average maintenance fee per room of $1,097.33, the approximate total economic impact
of maintenance fees on Aruba is ($1,097.33 x 89,199) = $97,880,738.67.
Impact of Room Tax Calculation:
Timeshare Units in Aruba x Nights in a Year = Potential Room Nights per Year
Potential Rooms Nights per Year x Average Yearly Occupancy = Total Used Rooms Nights per
Year
Total Used Room Nights per Year x Average Room Tax = Estimated Total Impact of Room
Taxes on Aruba
The total timeshare units in Aruba multiplied by the nights in a year is (3100 x 365) = 1,131,500
Potential Room Nights per Year. This figure multiplied by the average yearly occupancy
(1,131,500 x 80.6%) = 911,989 total used room nights per year. The total used room nights per

year multiplied by the average room tax is (1,131,500 x $10.87) = $9,913,320.43, which is the
estimated total economic impact of room taxes on Aruba.
Impact of Utility Cost Calculation:
Average Utility Cost per Timeshare Resort x Number of Timeshare Resorts in Aruba =
Estimated Total Impact of Utility Expenses
The average yearly utility cost per timeshare resort is $3,385,500 and there are 16 timeshare
resorts in Aruba. These include Aruba Beach Club, Caribbean Pam Village, Casa del Mar Beach
Resort, Costa Linda Beach Resort, Divi Aruba Phoenix Beach Resort, Divi Village Gold and
Beach Resort, Divi Dutch Village Resort, La Cabana Beach and Racquet Club, La Quinta Beach
Resort, Marriott‟s Aruba Ocean Club, Marriott‟s Aruba Surf Club, Occidental Grand Aruba,
Paradise Beach Villas, Playa Linda Beach Resort, The Renaissance Ocean Suites, and Tropicana
Aruba Resort and Casino. The average yearly utility cost per timeshare resort multiplied by the
number of timeshare resorts is ($3,385,500.33 x 16) = $54,168,005.33. This is the estimated total
economic impact of utility costs on Aruba.
Impact of Refurbishing Investments Calculation:
Average Yearly Investments in Refurbishing per Timeshare Resort x Number of Timeshare
Resorts in Aruba = Estimated Total Impact of Refurbishing
The average yearly investments in refurbishing multiplied by the number of timeshare resorts is
($2,935,066.83 x 16) = $46,961,069.28. This means that the estimated total economic impact of
utility costs is $46,961,069.28.
Impact of Payroll Expenses
Average Yearly Payroll Expenses per Timeshare Resort x Number of Timeshare Resorts in
Aruba = Estimated Total Impact of Payroll Expenses
The average yearly payroll expenses per timeshare resort multiplied by the number of timeshare
resorts is ($4,347,136.80 x 16) = $69,554,188.80
The average total amount of money gained from maintenance fees and room taxes and the
expenses paid on utilities, refurbishing, and payroll averages to an estimate total economic
indirect contribution of $278,477,322.46 that the timeshare industry has on Aruba. This number
is excluding the revenues of sales and any other expenses.
Although it is common knowledge that revenue gained from maintenance fees and room taxes
are used to cover a multitude of expenses, each timeshare resort divides them differently, and as
a result, each of these factors are accounted for separately.
Direct Factor
For the direct economic impact analysis, the average expenditures of timeshare visitors were
used for the calculation.

Timeshare Units in Aruba x Nights in a Year = Potential Room Nights per Year
Potential Rooms Nights per Year x Average Yearly Occupancy = Total Used Rooms Nights per
Year
Total Used Room Nights per Year x Average Total Daily Expenditures per Travel Party =
Estimated Total Direct Economic Impact
As was mentioned before, there are approximately 3100 timeshare units in Aruba. This has the
potential of generating 1,131,500 room nights. Based on the average yearly occupancy of 80.6%,
this generates 911,989 room nights. The average total daily expenditures per travel party of
timeshare tourists is $506. The total daily expenditures multiplied by the approximate room
nights per year ($506 x 911,989) would result in a total timeshare visitor expenditure estimate of
$461,466,434, which is the estimated direct economic impact of the timeshare industry in Aruba.
The direct and indirect impacts that were calculated equal to a total estimate of $739,943,756.46
in economic impact the timeshare industry in Aruba has on our economy.
Conclusions
The overall purpose of this research was to find the direct and indirect impacts of timeshare
industry in Aruba. There are numerous factors in the timeshare industry that have an impact on
Aruba‟s economy. Therefore, this study includes the direct spending of timeshare tourists on
retailers and the indirect spending of timeshare tourists by analyzing several of the most
significant revenues and expenses of timeshare resorts in Aruba.
The results of this study show that expenditures of timeshare tourists are growing, especially on
restaurants and groceries. This means that in order to keep the spending growing, restaurants and
grocery stores have to not only maintain, but also increase their quality, service, and
accessibility. Timeshare tourists are known to be very loyal to their favorite restaurants. Many
tourists say that they have to go to certain restaurants every time they visit Aruba. The quality of
the restaurant industry in Aruba is high and should be maintained at these high standards.
Between timeshare tourists, especially the older ones, word of mouth is the best marketing, and
one tells the other about their favorite restaurants and it goes on. Activities such as tours,
recreation, sport, and entertainment events are the categories with the lowest expenditures. This
can be improved by marketing to the right types of timeshare tourists, mostly in the age group
35-44 because those are showing the most interest in these activities. In addition, since timeshare
tourists are generally older in age, most are interested in rest and relaxation while on their
vacation rather than being active and participating in tours and recreational activities. In
increasing the economic input of timeshare tourists, it is important to know the market of
timeshare tourists. This study gives an indication to who the timeshare tourists in Aruba are,
what they like, and where they are spending. The results from this study shows that a majority of
timeshare tourists in Aruba is a timeshare owner in Aruba, is interested in eating out, grocery
shopping, and want to rest and relax, and spend time with family while on the island.
The analysis made on the indirect factors contributing to the economy shows that the factor with
the highest input in the economy is maintenance fees. But overall, the revenues gained from the
timeshare industry and the expenses made by the timeshare resorts show that the timeshare

industry in Aruba has a significant contribution to Aruba‟s economy, including salaries, utilities,
and to different types of businesses catering to the tourism industry.

Bibliography ARDA. (2012). Economic Impact of the Timeshare Industry on the U.S Economy. DC: American
Resort Development Association.
ARDA. (2012). State of the Vacation Timeshare Industry. DC: American Resort Development
Association .
ARDA. (2002). The Timeshare Industry Resource Manual. Washington, DC: ARDA
International Foundation.
ARDA. (2012). World Wide Vacation Ownership Report. DC: American Resort Development
Association .
ATSA. (2011). Aruba Timeshare Association 2011. Aruba: Aruba Timeshare Association.
Bingöl, F., & Bahar, O. (2012). Factors Affecting Tourist Expenditure Coming To Mugla
Region. Journal of Social Sciences , 293-308.
Burney, L. A. (2010). The American Resort Development Association Releases Economic Study:
Timeshare Industry Contributed $69 Billion of Economic Output. Washington: ARDA.
CBS. (2010). Accomodation Statistics: Occupancy Rates - Timeshare. Oranjestad, Aruba:
Central Bureau of Statistics .
CBS. (2010). National Accounts of Aruba 2000 - 2009. Aruba: Central Bureau of Statistics.
CBS. (2011). Statistical Yearbook 2011. Oranjestad, Aruba: Cental Bureau of Statustics Aruba.
CBS. (2010). Total Number of Rooms and Share of Hotels and Timeshare. Oranjestad, Aruba:
Central Bureau of Statistics Aruba.
CBS. (2009). Tourist Profile - Year Report 2009. Aruba: Central Bureau of Statistics.
CBS. (2010). Tourist Profile - Year Report 2010. Aruba: Central Bureau of Statistics.
Cleaver, M., Green, C., & Muller, T. (2000). Consumer Behavior Research to Understand the
Baby Boomer Tourist. Journal of Hospitality & Tourism Research , 274-287.
Crompton, J. (2006). Economic Impact Studies: Instruments for Political Shenanigans? Journal
of Travel Resarch Vol. 45 , 67-82.
Crompton, J., Lee, S., & Shuster, T. (2001). A Guide for Undertaking Economic Impact Studies:
The Springfest Example. Journal of Travel Research Vol. 40 , 79-87.
Fairhurst, A., Costello, C., & Holmes, A. (2007). An examination of shopping behavior of
visitors to Tennessee according to tourist typologies. Journal of Vacation Marketing , 311-320.

Frent, C. (2009). The economic importance of vacation homes from the Tourism Satellite
Account (TSA) perspective. Tourism Review, Vol 64 Iss: 2 , 19-27.
Gratton, C., & Taylor, P. (1987). "Leisure and Shoppping". Leisure Management , 29-30.
Hovey, M. (2002). Is timeshare ownership and investment product. Journal of Financial Services
Marketing , 7 (2), 141-160.
Hsu, C., Cai, L., & Li, M. (2010). Expectation, Motivation, and Attitude: A Tourist Behavior
Model. Journal of Travel Research Vol 49 , 282-296.
Kaufman, T., & Upchurch, R. (2007). Vacation ownership: Gender positioning. Journal of Retail
and Leisure Property , 6, 8-14.
Kaufman, T., Lashley, C., & Schreier, L. (2009). Timeshare Management: The key issues for
hospitality managers. MA: Butterworth-Heinemann.
Littrel, M., Baizerman, S., Kean, R., Gahring, S., Neimeye, S., Reilly, R., et al. (1994).
"Souvenirs and Tourism Styles". Journal of Travel Research Vol.33 , 3-11.
Macinnis, D., & Folkes, V. (2010). The Disciplinary Status of Consumer Behavior: A Sociology
of Science Perspective on Key Controversies. Journal of Consumer Research Vol 36 Issue 6 ,
899-914.
Peterson, M. (2007). Effets of income, assets, and age on the vacationing behavoir of US
consumers. Journal of Vacation Marketing Vol.23 , 29-43.
Peterson, R. R. (2008). Timeshare Value Study Aruba. Aruba: Aruban Timeshare Association.
Powanga, A., & Powanga, L. (2008). An Econimic Analysis of a Timeshare Ownership. Journal
of Retail and Leisure Property , 69-83.
Ragatz Associates, RCI. (2003). Resort Timesharing in the United States - 2003 Edition
Summary Report. New Jersey: Resort Condominiums International.
Ragatz, R., & Crotts, J. (February 2000). U.S. TIMESHARE PURCHASERS: WHO ARE
THEY AND WHY DO THEY BUY? Journal of Hospitality & Tourism Research Vol. 24, No. 1
, 49-66.
U.S. Travel Association . (2010). Travel Economic Impact Model. Washington DC: U.S. Travel
Association.
U.S. Travel Association. (2011). Travel and Tourism Continue to Grow in 2011. Washington
DC: U.S. Traveler Association.

van Nes, J., & Heijdeman, M. (2006). A Short Course in Timeshare. Oranjestad, Aruba: Aruba
Time Share Association.
Wilkie, W. L., & Moore, E. (2003). Scholarly Research in Marketing: Exploring the Four Eras of
Thought Development. Journal of Public Policy and Marketing , 116-46.
WTO. (1995). Collection of Tourism Expenditure Statistics. Technical Manual World Tourism
Organization , 3.
Ziobrowski, A., & Ziobrowski, B. (1997). Resort timeshares as an investmen. Appraisal Journal
, 65, 371-381.


