
Economic Outlook &Capital Markets
Investment Counsel Association of Canada
MontrealJune 19th, 2008
Clément GignacVP Chief Economist& Strategist
Topics
1. U.S. recession in the offing: How long and deep?
2. Emerging countries: How long will the decoupling with the U.S. last?
3. Canada: Our reasons to remain “cautiously optimistic”
4. Capital markets: Where are we heading?

DisclaimerParts of this presentation contain material that may not be suitable for some viewers. National Bank of Canada leaves it to the discretion of its clients whether or not to accept the implications of this scenario.
4
Part 1:The world has changed !
A U.S. housing bubble pop and a halt to securitization activity!

2.6
2.7
2.8
2.9
3.0
3.1
3.2
3.3
3.4
3.5
3.6
3.7
3.8
3.9
4.0
4.1
80 82 84 86 88 90 92 94 96 98 00 02 04 06
Average 1980-2000
NBF Economic Research, Federal Reserve
Price of a single-family home as a ratio of median family income
Ratio

-80
-60
-40
-20
0
20
40
60
80
100
120
140
160
90 91 92 93 94 95 96 97 98 99 00 01 02 03 04 05 06 07
U.S. mortgage securitization activity suspended
Quarterly change in value outstanding ($ billion)
NBF Economy & Strategy (data via Federal Reserve)
From 4% of GDP…
…to -2.0% !

7
A recipe for bubble creation by John Kenneth Galbraith (1972)
Ingredients needed:
1- Wall Street Financial Innovation (like CDOs now) 2- Easy access to credit (ex subprime mortgages)3- Lack of disclosure by participants (off balance sheet items)
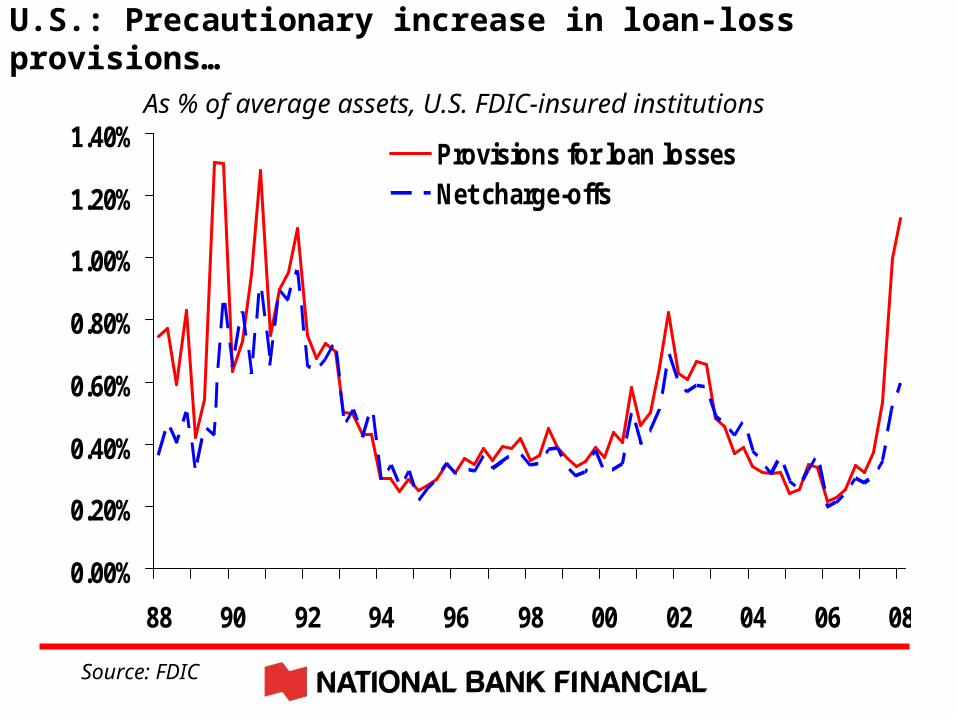
U.S.: Precautionary increase in loan-loss provisions… As % of average assets, U.S. FDIC-insured institutions
0.00%
0.20%
0.40%
0.60%
0.80%
1.00%
1.20%
1.40%
88 90 92 94 96 98 00 02 04 06 08
Provisions for loan lossesNet charge-offs
Source: FDIC
Credit crunch:
Implications on banks and monetary policy

550
600
650
700
750
800
850
900
950
1000
1050
1100
1150
1200
1250
2001 2002 2003 2004 2005 2006 200740
50
60
70
80
90
100
110
120
1999 2000 2001 2002 2003 2004 2005 2006 2007
Risk aversion is back = ABCP are back on banks balance sheets
NBF Economy & Strategy
CanadaU.S.$ billions $ billions

Now playing at a Wall Street theatre:“The Survivor”
Meredith Whitney, Oppenheimer analyst 15
20
25
30
35
40
45
50
55
Jun-07 Sep-07 Dec-07 Mar-08 May-08
Citigroup share price
Dividend cut predicted
Dividend cut confirmed
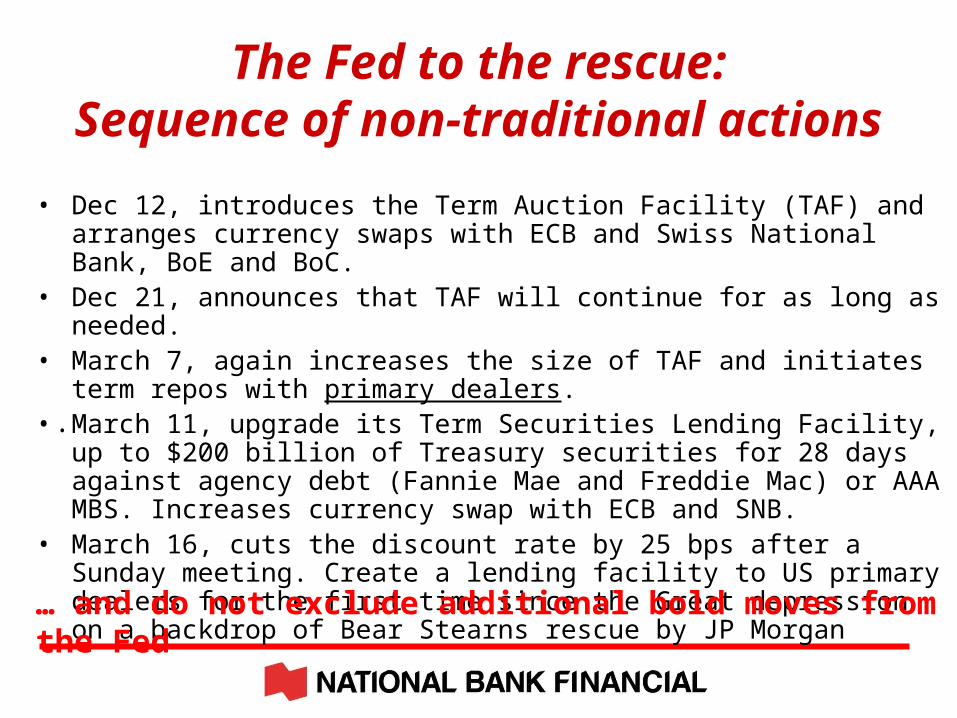
The Fed to the rescue:Sequence of non-traditional actions
• Dec 12, introduces the Term Auction Facility (TAF) and arranges currency swaps with ECB and Swiss National Bank, BoE and BoC.
• Dec 21, announces that TAF will continue for as long as needed.• March 7, again increases the size of TAF and initiates term repos with
primary dealers.• March 11, upgrade its Term Securities Lending Facility, up to $200 billion
of Treasury securities for 28 days against agency debt (Fannie Mae and Freddie Mac) or AAA MBS. Increases currency swap with ECB and SNB.
• March 16, cuts the discount rate by 25 bps after a Sunday meeting. Create a lending facility to US primary dealers for the first time since the Great depression on a backdrop of Bear Stearns rescue by JP Morgan
•
… and do not exclude additional bold moves from the Fed

US: CRE concentration larger than ever One third of institutions with CRE loans more than 3 times equity
0
5
10
15
20
25
30
35
40
84 85 86 87 88 89 90 91 92 93 94 95 96 97 98 99 00 01 02 03 04 05 06 07 08
300%
400%
500%
600%
FDIC-insured institutions with commercial real estateloans to total equitygreater than:
Source: FDIC
33.4%%
2008: As at March 31End of year

120
140
160
180
200
220
240
260
280
300
1999 2000 2001 2002 2003 2004 2005 2006 20072.0
2.5
3.0
3.5
4.0
4.5
5.0
5.5
6.0
6.5
7.0
06M01 06M04 06M07 06M10 07M01 07M04 07M07 07M10 08M01 08M04
Monetary Policy: Broken transmission mechanism?
%
Fed funds et Mortgage rates Spread Mortgage rate and government bonds
Basis pointsMortgage rate
Fed funds

US Economic Outlook:Choosing between 4 scenarios?
• Sub par GDP growth (1966, 1986 or 1995 episodes)
• Recession (7 times over the last 50 years)
• Stagflation (a 1973-75 commodities like the 70’s)
• Depression (US in the 30’s and Japan in the 90’s)
PS: As usual, we are trying to stay middle of the Road!!!
16
U.S. BUSINESS CYCLE
The real question is no longer whether or not the U.S. will go through a recession,
but rather how long and deep it will be

21.0
21.5
22.0
22.5
23.0
23.5
24.0
24.5
25.0
25.5
78 80 82 84 86 88 90 92 94 96 98 00 02 04 06 08-8
-7
-6
-5
-4
-3
-2
-1
0
1
2
3
4
5
6
7
45
50
55
60
65
70
75
80
85
90
95
100
105
110
115
120
78 80 82 84 86 88 90 92 94 96 98 00 02 04 06 08
* Deflated with CPI inflation
U.S.: Consumers feel miserable
Michigan sentiment survey and real wage bill*
Financial obligations and spending on energy as a % of disposable income
%% (y/y)
Michigan Sentiment(right)
indexWage bill
(left)
0.0
0.5
1.0
1.5
2.0
2.5
3.0
3.5
4.0
4.5
5.0
5.5
6.0
6.5
91 92 93 94 95 96 97 98 99 00 01 02 03 04 05 06 07-1
0
1
2
3
4
5
6
7
8
9
10
11
12
13
76 78 80 82 84 86 88 90 92 94 96 98 00 02 04 06
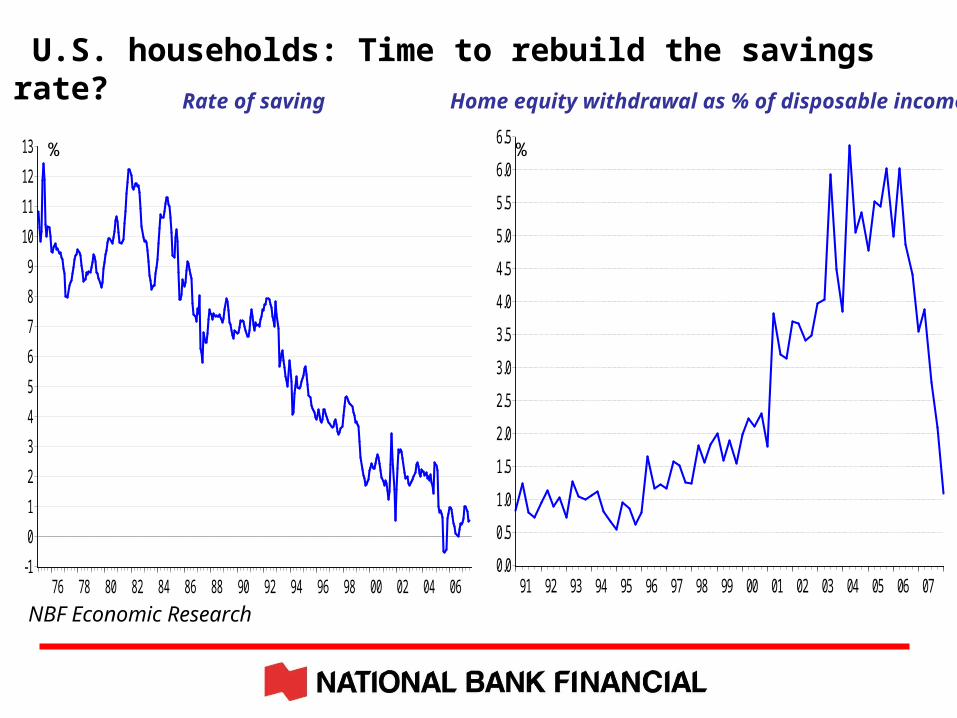
U.S. households: Time to rebuild the savings rate?
Home equity withdrawal as % of disposable income
%
Rate of saving
%
NBF Economic Research

-4
-3
-2
-1
0
1
2
3
4
5
1950 1955 1960 1965 1970 1975 1980 1985 1990 1995 2000 2005
Global Insight
%
US: 1% increase in unemployment rate usually heralds a recessionChange over 12 months

0 2 4 6 8 10 12 14 16 18
2001
1990-91
1981-82
1980
1973-75
1969-70
1960-61
NBF Economy & Strategy (data from Datastream)
U.S.: Recessions could have different amplitude and duration
Duration in Months
Duration of GDP contraction Rise in unemployment rate
Percentage points0.0 0.5 1.0 1.5 2.0 2.5 3.0 3.5 4.0 4.5
2001
1990-91
1981-82
1980
1973-75
1969-70
1960-61
Mean:9 months
Mean: 2.6 pp

Any message of hope?

0.8
1.2
1.6
2.0
2.4
2.8
3.2
3.6
4.0
4.4
4.8
5.2
5.6
2002 2003 2004 2005 2006 2007
NBF Economic Research, Datastream
US: Unprecedented amount of rate cuts in a short period of time
%
Fed funds
2-year Treasuries
23
-7
-6
-5
-4
-3
-2
-1
0
1
2
3
1965 1970 1975 1980 1985 1990 1995 2000 2005
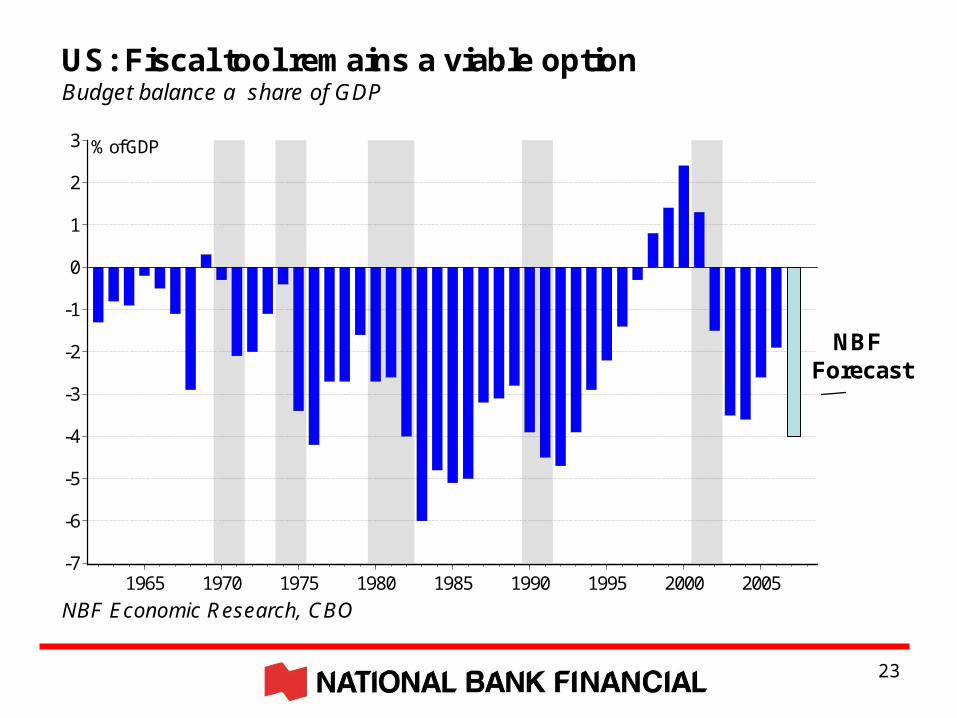
US: Fiscal tool remains a viable optionBudget balance a share of GDP
% of GDP
NBF Economic Research, CBO
NBFForecast
24
-6.5
-6.0
-5.5
-5.0
-4.5
-4.0
-3.5
-3.0
-2.5
-2.0
-1.5
-1.0
-0.5
0.0
1984 1986 1988 1990 1992 1994 1996 1998 2000 2002 2004 2006
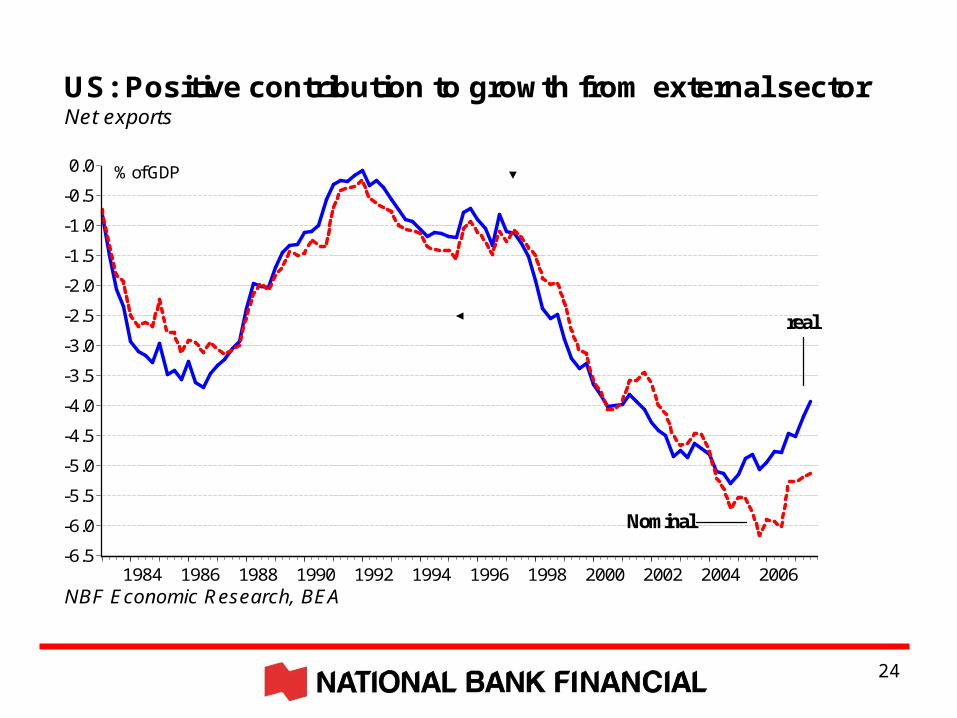
US: Positive contribution to growth from external sectorNet exports
% of GDP
real
Nominal
NBF Economic Research, BEA

The ongoing rates cuts, falling dollar and upcoming fiscal stimulus should prevent a
deep and prolonged US recession…
… at least for now as we believe oil price will return to $80 over the next 12 months
U.S. Economy: Bottom line

0
10
20
30
40
50
60
70
80
90
100
110
120
130
1970 1975 1980 1985 1990 1995 2000 2005
Risk factor: Geopolitics in Middle East and higher oil prices
*
OIL Price: Nominal and real
$
Réel ($ de 2006)
Nominal

U.S. Risk factor: Protectionism on the rise?

The world has changed !
The U.S. is no longer the powerhouse of the global economy
Part II: International

10
11
12
13
14
15
16
17
18
19
20
21
22
23
24
1980 1982 1984 1986 1988 1990 1992 1994 1996 1998 2000 2002 2004 2006 2008
World economy: An ebbing of U.S. hegemony
% of global GDP
U.S.
BRIC
NBF Economic Research, IMF (World Economic Outlook, April 2008)

35
3
27
46
811
0
5
10
15
20
25
30
NBF Economic Research, IMF (World Economic Outlook, April 2008)
BRIC and Middle East account for half of global growth
%, share of global GDP growth
Advanced economies Emerging markets
Over half of the 3.7% increase in world GDP in 2008 to come from emerging markets !

10
20
30
40
50
60
70
80
1840 1860 1880 1900 1920 1940 1960 1960 1980
China: Industrializing very fastPercentage of population living in cities: China versus U.S.
U.S. urbanization since 1840
% of total population
Every year more than 25 million Chinese people move to cities
NBF Economic Research, Census Bureau, China Statistical Yearbook
1978
1990
2000
2004
Forecast for 2011

Commodities: A new paradigm or history likely to repeat itself
100
150
200
250
300
350
400
450
500550
1965 1970 1975 1980 1985 1990 1995 2000 2005

Any risk factors?
Emerging countries theme
0
2
4
6
8
10
12
14
16
18
78 80 82 84 86 88 90 92 94 96 98 00 02 04 06 08
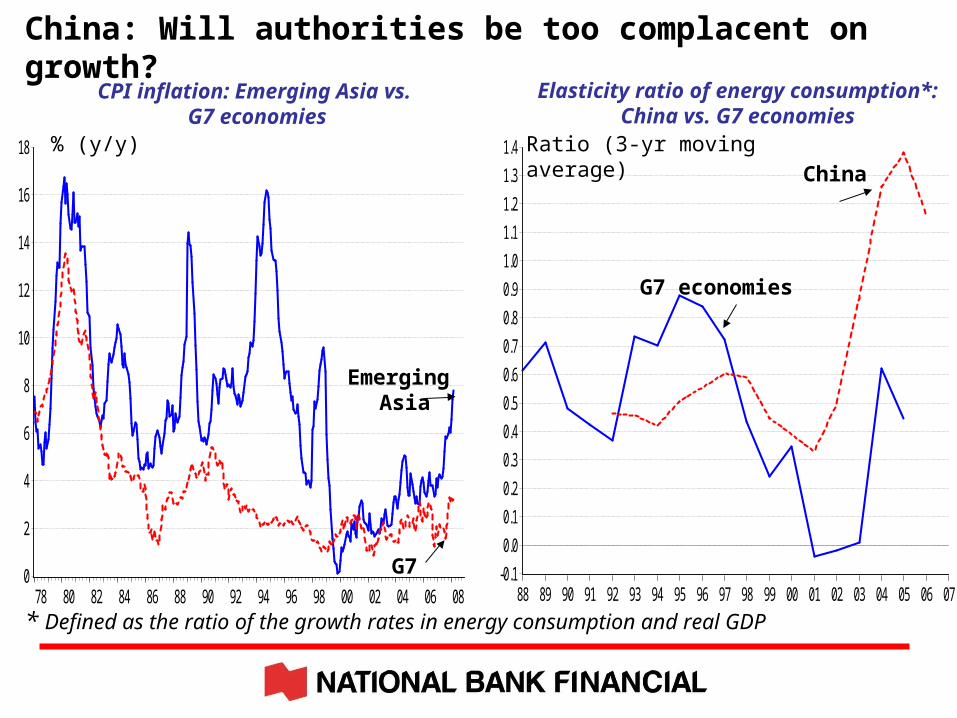
China: Will authorities be too complacent on growth?
% (y/y)
Emerging Asia
G7 -0.1
0.0
0.1
0.2
0.3
0.4
0.5
0.6
0.7
0.8
0.9
1.0
1.1
1.2
1.3
1.4
88 89 90 91 92 93 94 95 96 97 98 99 00 01 02 03 04 05 06 07
CPI inflation: Emerging Asia vs. G7 economies
Elasticity ratio of energy consumption*:China vs. G7 economies
China
Ratio (3-yr moving average)
G7 economies
* Defined as the ratio of the growth rates in energy consumption and real GDP
20
25
30
35
40
45
50
55
1950 1955 1960 1965 1970 1975 1980 1985 1990 1995 2000 2005 2008
80
120
160
200
240
280
320
360
400
440
72 74 76 78 80 82 84 86 88 90 92 94 96 98 00 02 04 06
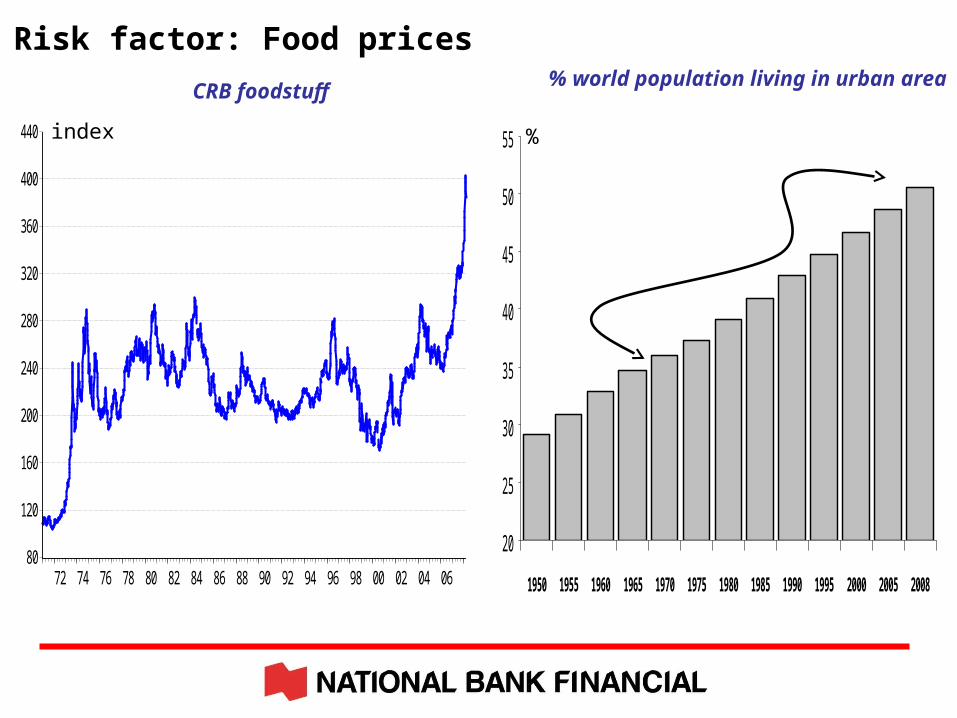
Risk factor: Food prices
CRB foodstuff
index
% world population living in urban area
%
-6
-4
-2
0
2
4
6
8
10
12
14
16
18
1999 2000 2001 2002 2003 2004 2005 2006 2007 2008
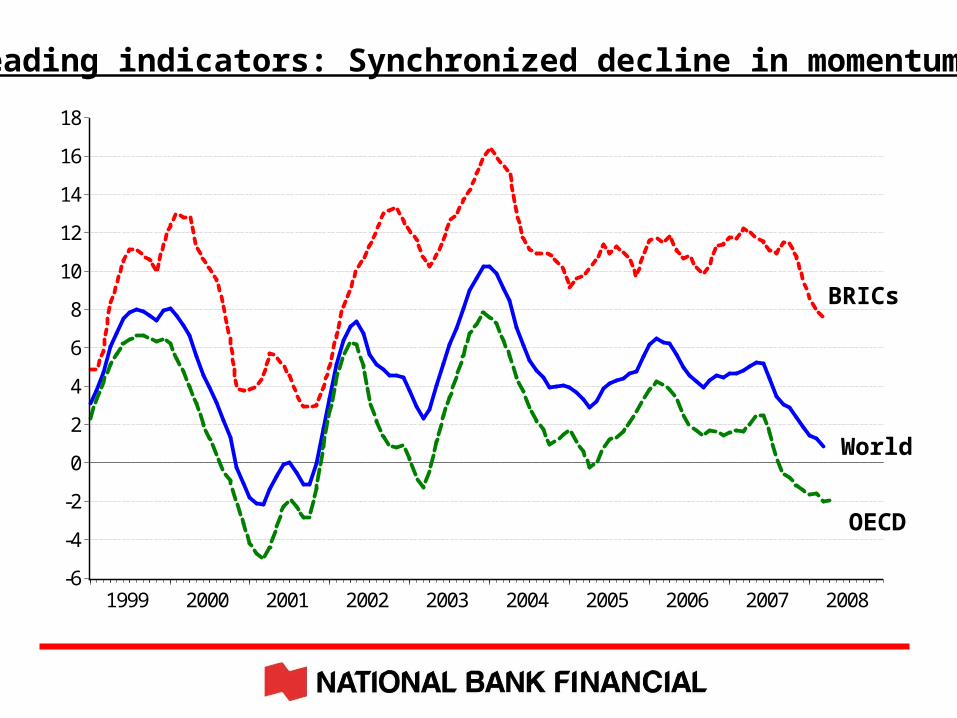
Leading indicators: Synchronized decline in momentum!!!
BRICs
World
OECD

0.5
1.5
2.5
3.5
4.5
5.5
6.5
70 72 74 76 78 80 82 84 86 88 90 92 94 96 98 00 02 04 06 08
%
Average 1970 – 2006
World GDP: Back to trend growth rate in 2008?Real world GDP growth
NBF economic research, IMF
Canadian Economy
Why are we much more upbeat about prospects in Canada than in the USA?

-10
-5
0
5
10
15
20
25
30
35Ire
land
Net
herla
nds U
K
Aus
tralia
Fran
ce
Nor
way
Den
mar
k
Bel
gium
Spai
n
Swed
en Italy
Japa
n US
Finl
and
Ger
man
y
Can
ada
Aus
tria
International Monetary Fund (April 2008)
Real estate: Canada not at risk according to the IMFIncrease in home prices over the period 1997-2007 not accounted by fundamentals
House price gap (%)

NBF Economic Research, Finance Canada
% of GDP
Canada: Strongest public finances in the G-7Net government debt

76
80
84
88
92
96
100
104
108
112
74 76 78 80 82 84 86 88 90 92 94 96 98 00 02 04 06
Net exporter of resources = Surging terms of trade Ratio of export to import prices
NBF Economic Research
0
4
8
12
16
20
24
28
32
36
40
44
48
90 91 92 93 94 95 96 97 98 99 00 01 02 03 04 05 06-7
-6
-5
-4
-3
-2
-1
0
1
2
3
90 91 92 93 94 95 96 97 98 99 00 01 02 03 04 05 06
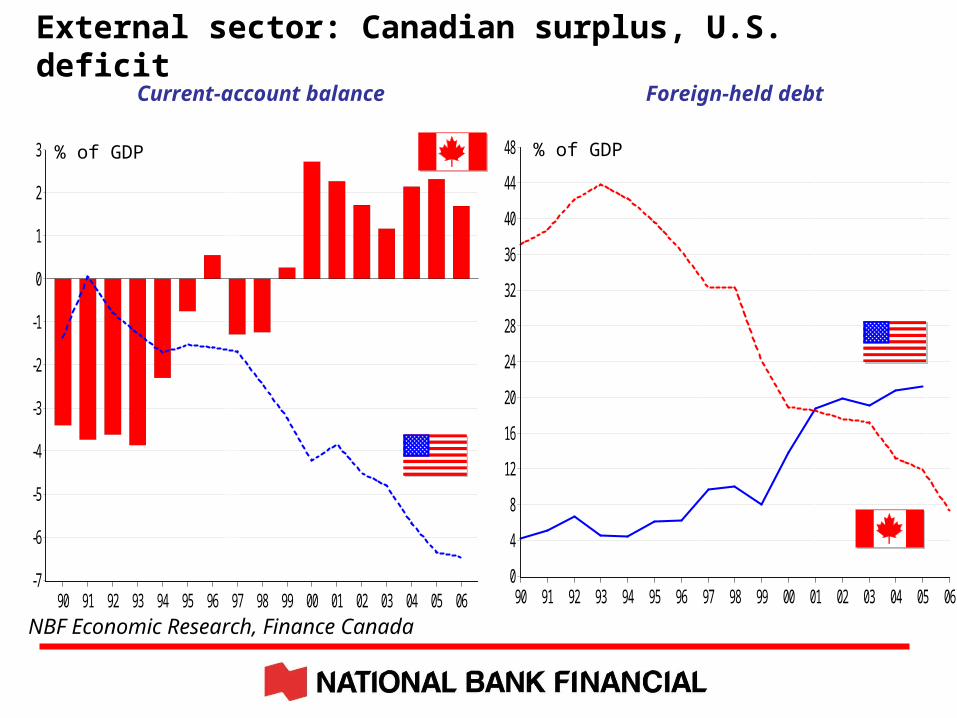
NBF Economic Research, Finance Canada
External sector: Canadian surplus, U.S. deficit
% of GDP
Current-account balance Foreign-held debt
% of GDP
160
200
240
280
320
360
400
440
480
520
560
600
0.60
0.65
0.70
0.75
0.80
0.85
0.90
0.95
1.00
1.05
1.10
1.15
1995 1996 1997 1998 1999 2000 2001 2002 2003 2004 2005 2006 2007
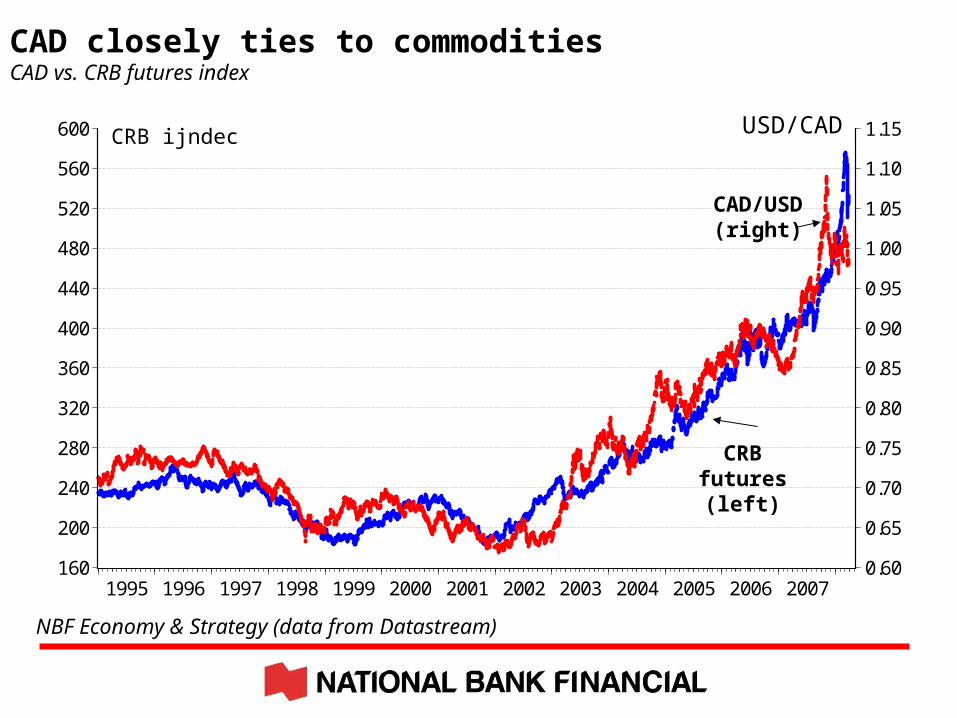
CAD closely ties to commoditiesCAD vs. CRB futures index
CRB ijndec
CAD/USD(right)
USD/CAD
CRB futures(left)
NBF Economy & Strategy (data from Datastream)
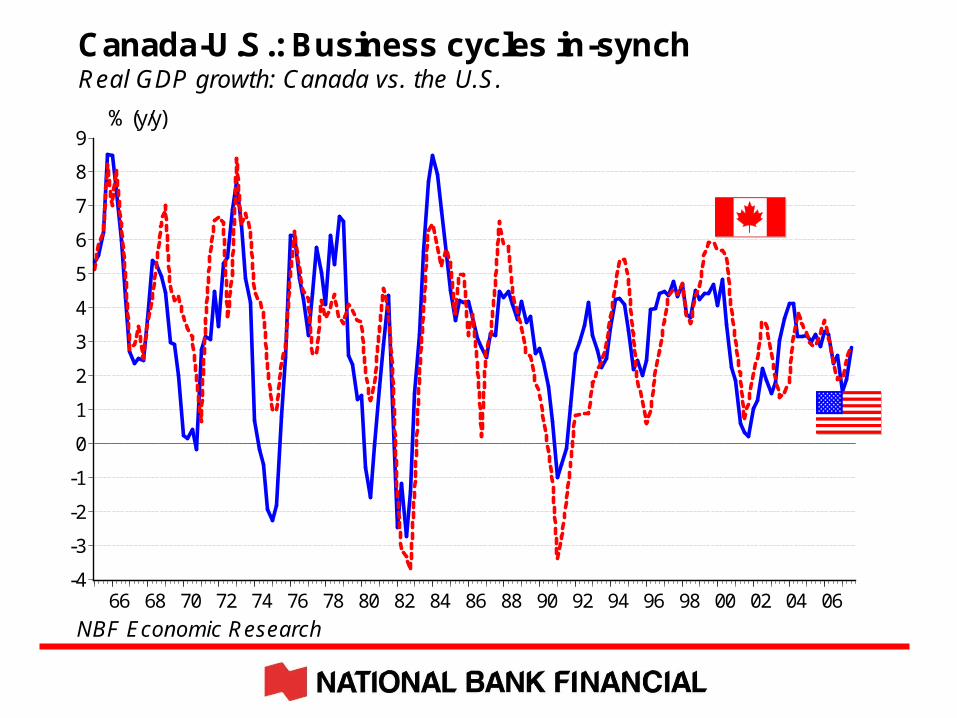
Warning: Economics 101
Canada has great fundamentals but our economy will not be immune from
a U.S. recession
-4
-3
-2
-1
0
1
2
3
4
5
6
7
8
9
66 68 70 72 74 76 78 80 82 84 86 88 90 92 94 96 98 00 02 04 06
Canada-U.S.: Business cycles in-synchReal GDP growth: Canada vs. the U.S.
NBF Economic Research
% (y/y)

3.5
3.12.9
2.6
0.5
1.8 1.81.7
1.5
1.0
0.0
0.5
1.0
1.5
2.0
2.5
3.0
3.5
4.0
ALB MAN SASK BC NS PEI NB NFLD QUE ONT
NBF Economic Research
GDP growth: Temporary soft-patch to be expected in 2008 Real GDP, 2008 forecast
%
Canadian average: 1.5%

0.8
1.2
1.6
2.0
2.4
2.8
3.2
3.6
4.0
4.4
4.8
5.2
5.6
6.0
6.4
6.8
1997 1998 1999 2000 2001 2002 2003 2004 2005 2006 2007
NBF Economic Research, Datastream
Bottom line: BOC rate cuts not over yet in Canada
BoC overnight rate
Fed funds rate
%

ForecastsIndicators 2008 2009
GDP U.S. 1.4% 1.6%Canada 1.1% 1.9%
Inflation U.S. 3.5% 1.9%Canada 2.2% 1.4%
Current Jun. 2009
Policy rate U.S. 2.00% 2.00%Canada 3.00% 3.00%
10-year U.S. 4.19% 4.25%yield Canada 3.84% 4.02%
CAD 1.016 0.92
S&PTSX 12,80014,863
49
Capital markets:
Volatility will remain for some time
60
70
80
90
100
110
120
130
140
Apr-88 Feb-91 Jan-94 Nov-96 Oct-99 Aug-02 Jul-05 May-08
10
15
20
25
30
35
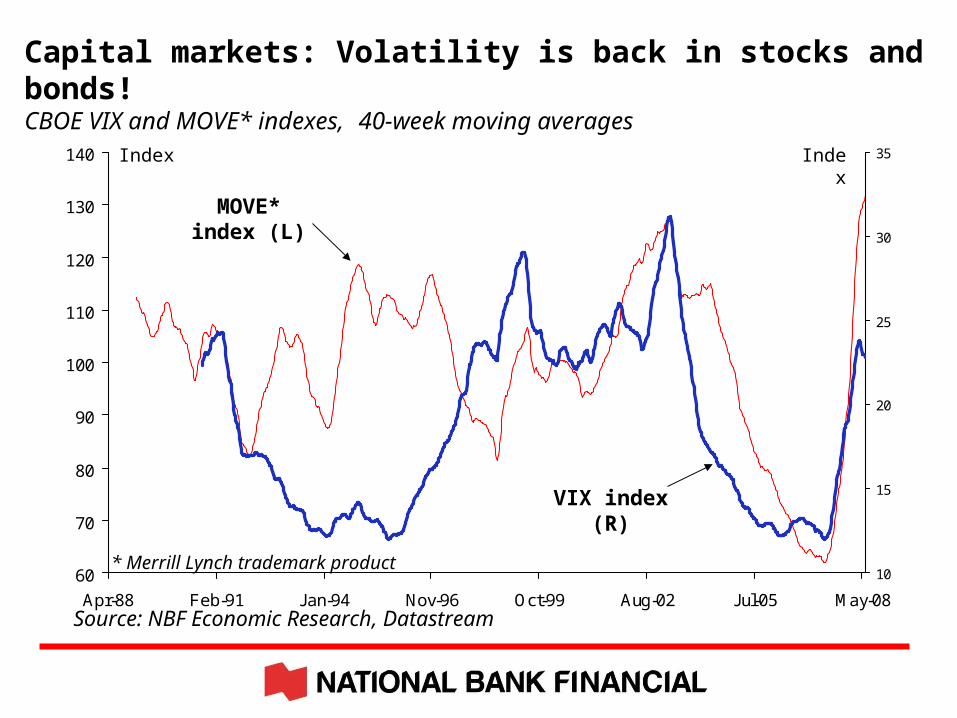
Capital markets: Volatility is back in stocks and bonds!CBOE VIX and MOVE* indexes, 40-week moving averages
Source: NBF Economic Research, Datastream
MOVE* index (L)
Index Index
VIX index (R)
* Merrill Lynch trademark product
0%
10%
20%
30%
40%
50%
60%
70%
80%
Q1-51
Q1-54
Q1-57
Q1-60
Q1-63
Q1-66
Q1-69
Q1-72
Q1-75
Q1-78
Q1-81
Q1-84
Q1-87
Q1-90
Q1-93
Q1-96
Q1-99
Q1-02
Q1-05
Q1-08
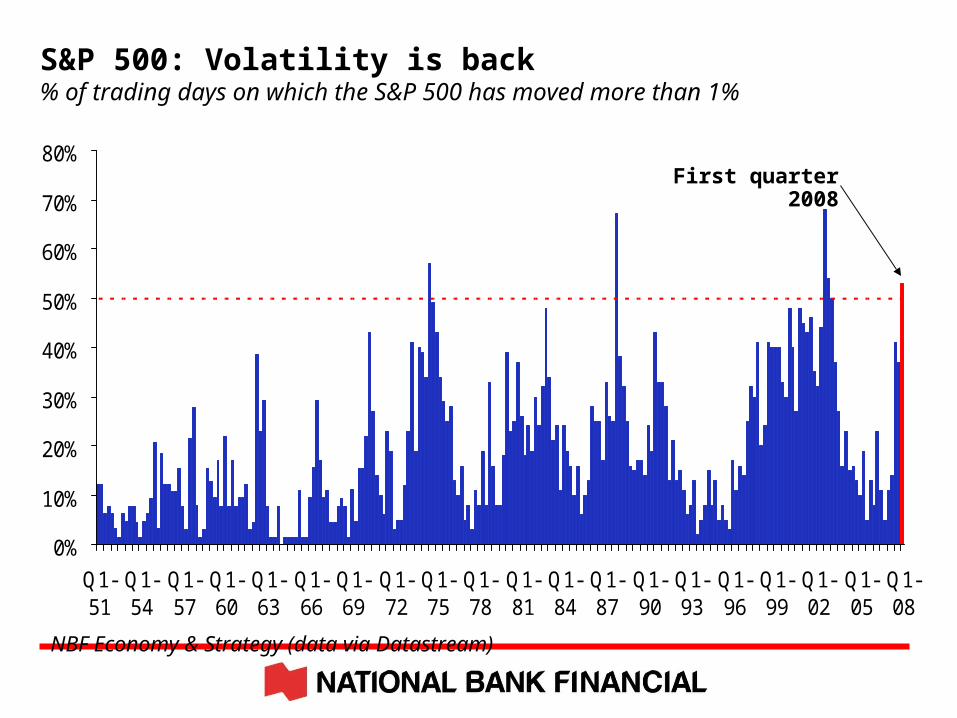
S&P 500: Volatility is back% of trading days on which the S&P 500 has moved more than 1%
First quarter 2008
NBF Economy & Strategy (data via Datastream)

-12
-8
-4
0
4
8
12
16
20
50
100
150
250
500
1000
15002000
68 70 72 74 76 78 80 82 84 86 88 90 92 94 96 98 00 02 04 06
NBF Economic Research, Datastream
Performance of equities in five U.S. recessions S&P 500 Composite and U.S. real GDP growth
In recession periods, the S&P 500 pulls
back an average 36% from peak to trough
-36% -48% -27%
-20%
-49% -19%% q/q annualized
S&P 500 (R)
U.S. real GDP growth (L)U.S. recessions in gray
From pre-recession peak to trough
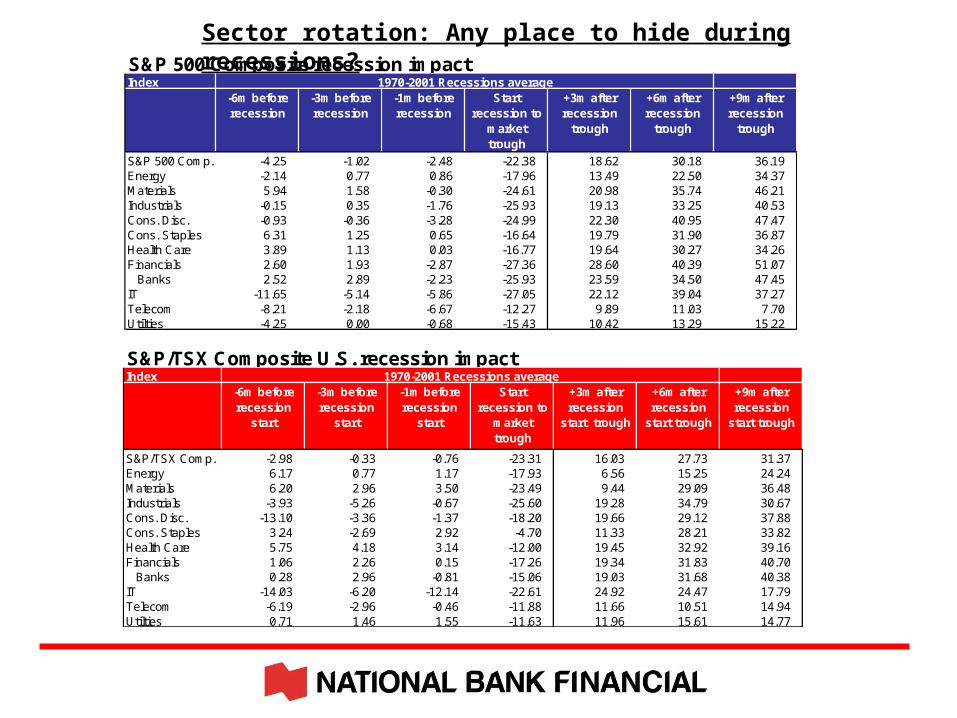
Sector rotation: Any place to hide during recessions?S&P 500 Composite recession impactIndex
-6m before recession
-3m before recession
-1m before recession
Start recession to
market trough
+3m after recession
trough
+6m after recession
trough
+9m after recession
trough
S&P 500 Comp. -4.25 -1.02 -2.48 -22.38 18.62 30.18 36.19Energy -2.14 0.77 0.86 -17.96 13.49 22.50 34.37Materials 5.94 1.58 -0.30 -24.61 20.98 35.74 46.21Industrials -0.15 0.35 -1.76 -25.93 19.13 33.25 40.53Cons. Disc. -0.93 -0.36 -3.28 -24.99 22.30 40.95 47.47Cons. Staples 6.31 1.25 0.65 -16.64 19.79 31.90 36.87Health Care 3.89 1.13 0.03 -16.77 19.64 30.27 34.26Financials 2.60 1.93 -2.87 -27.36 28.60 40.39 51.07
Banks 2.52 2.89 -2.23 -25.93 23.59 34.50 47.45IT -11.65 -5.14 -5.86 -27.05 22.12 39.04 37.27Telecom -8.21 -2.18 -6.67 -12.27 9.89 11.03 7.70Utilties -4.25 0.00 -0.68 -15.43 10.42 13.29 15.22
1970-2001 Recessions average
S&P/TSX Composite U.S. recession impactIndex
-6m before recession
start
-3m before recession
start
-1m before recession
start
Start recession to
market trough
+3m after recession
start trough
+6m after recession
start trough
+9m after recession
start trough
S&P/TSX Comp. -2.98 -0.33 -0.76 -23.31 16.03 27.73 31.37Energy 6.17 0.77 1.17 -17.93 6.56 15.25 24.24Materials 6.20 2.96 3.50 -23.49 9.44 29.09 36.48Industrials -3.93 -5.26 -0.67 -25.60 19.28 34.79 30.67Cons. Disc. -13.10 -3.36 -1.37 -18.20 19.66 29.12 37.88Cons. Staples 3.24 -2.69 2.92 -4.70 11.33 28.21 33.82Health Care 5.75 4.18 3.14 -12.00 19.45 32.92 39.16Financials 1.06 2.26 0.15 -17.26 19.34 31.83 40.70
Banks 0.28 2.96 -0.81 -15.06 19.03 31.68 40.38IT -14.03 -6.20 -12.14 -22.61 24.92 24.47 17.79Telecom -6.19 -2.96 -0.46 -11.88 11.66 10.51 14.94Utilties 0.71 1.46 1.55 -11.63 11.96 15.61 14.77
1970-2001 Recessions average

55
Capital markets currently on the edge!!!
Downside and upside risks about the same?
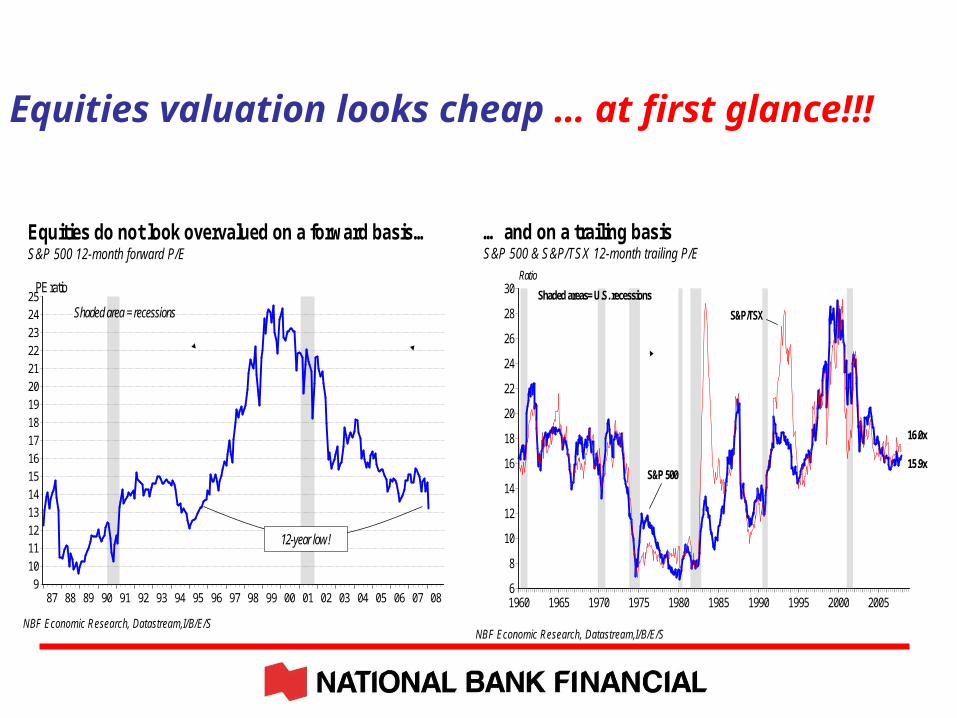
Equities valuation looks cheap … at first glance!!!
9
10
11
12
13
14
15
16
17
18
19
20
21
22
23
24
25
87 88 89 90 91 92 93 94 95 96 97 98 99 00 01 02 03 04 05 06 07 08
PE ratio
Shaded area = recessions
12-year low !
Equities do not look overvalued on a forward basis…S&P 500 12-month forward P/E
NBF Economic Research, Datastream,I/B/E/S
6
8
10
12
14
16
18
20
22
24
26
28
30
1960 1965 1970 1975 1980 1985 1990 1995 2000 2005
… and on a trailing basisS&P 500 & S&P/TSX 12-month trailing P/E
NBF Economic Research, Datastream,I/B/E/S
S&P/TSX
S&P 500
Shaded areas= U.S. recessions
Ratio
16.0x
15.9x
8
10
12
14
16
18
20
22
24
26
28
30
1999 2000 2001 2002 2003 2004 2005 2006 2007 2008 20094
6
8
10
12
14
16
18
20
22
24
26
28
30
0 1 2 3 4 5 6 7 8 9 10 11 12 13 14 15
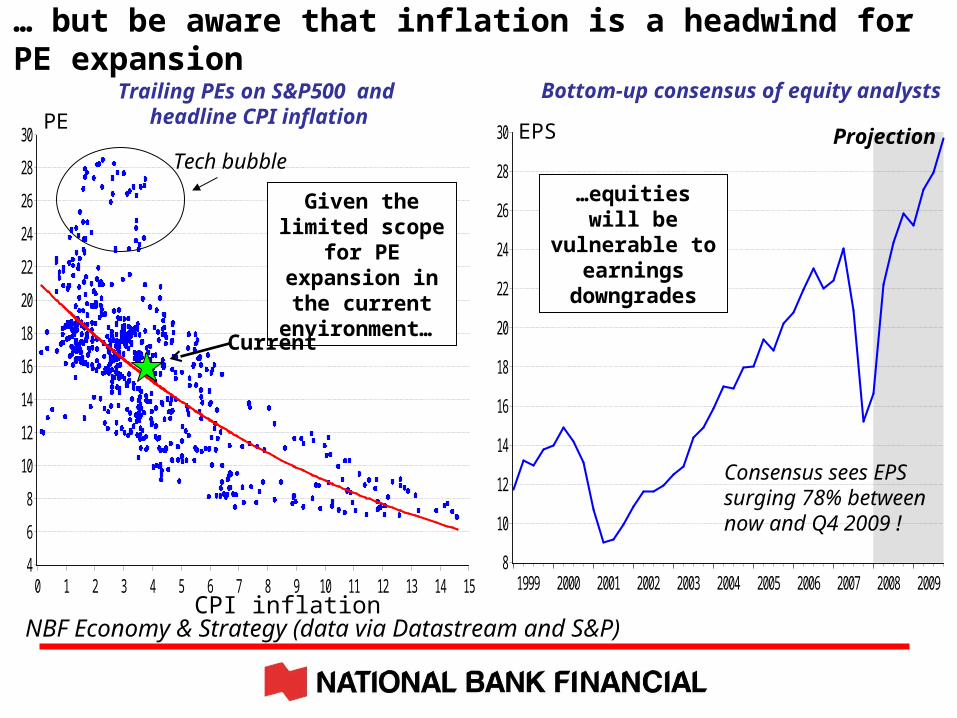
… but be aware that inflation is a headwind for PE expansion
PETrailing PEs on S&P500 and
headline CPI inflationBottom-up consensus of equity analysts
ProjectionEPS
NBF Economy & Strategy (data via Datastream and S&P)
Given the limited scope for PE
expansion in the current
environment…
CPI inflation
Current
Tech bubble
…equities will be vulnerable to
earnings downgrades
Consensus sees EPS surging 78% between now and Q4 2009 !

-30
-25
-20
-15
-10
-5
0
5
10
80 85 90 95 00 05
Shaded for recessions
US recessions = More downward earnings revisions???
Current year consensus earnings revisions, from start to end of a given year
%
YTD: -10.0%
-29.3%-24.2% -25.1%

Any message of hope?
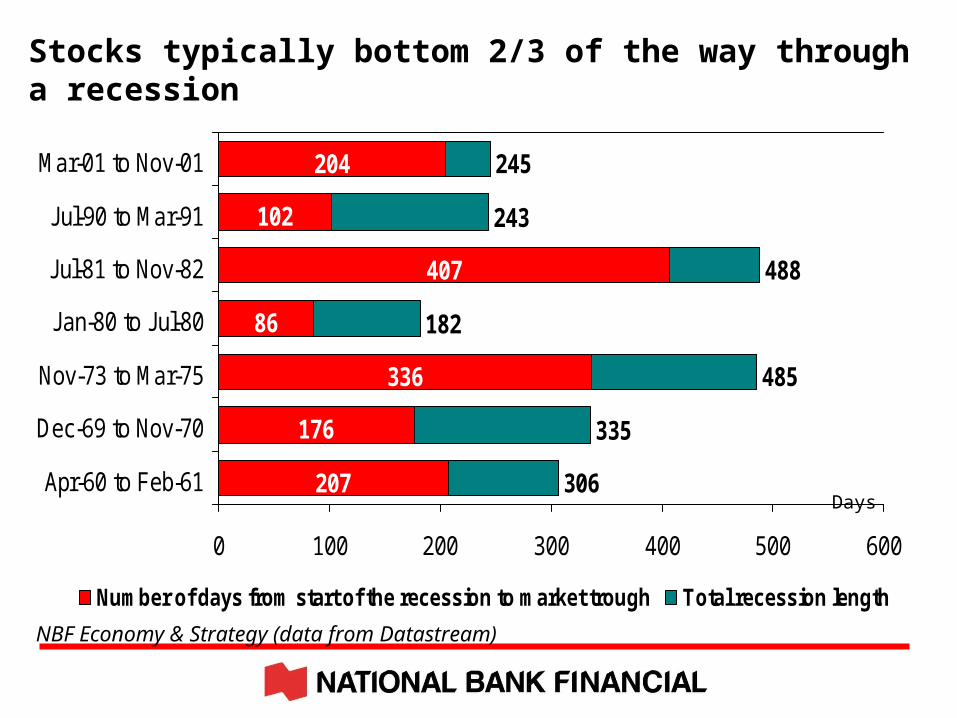
207
176
336
86
102
204
407
306
335
485
182
488
243
245
0 100 200 300 400 500 600
Apr-60 to Feb-61
Dec-69 to Nov-70
Nov-73 to Mar-75
Jan-80 to Jul-80
Jul-81 to Nov-82
Jul-90 to Mar-91
Mar-01 to Nov-01
0 100 200 300 400 500 600
Number of days from start of the recession to market trough Total recession length
NBF Economy & Strategy (data from Datastream)
Stocks typically bottom 2/3 of the way through a recession
Days
20
40
60
80
100
120
140
160
180
200
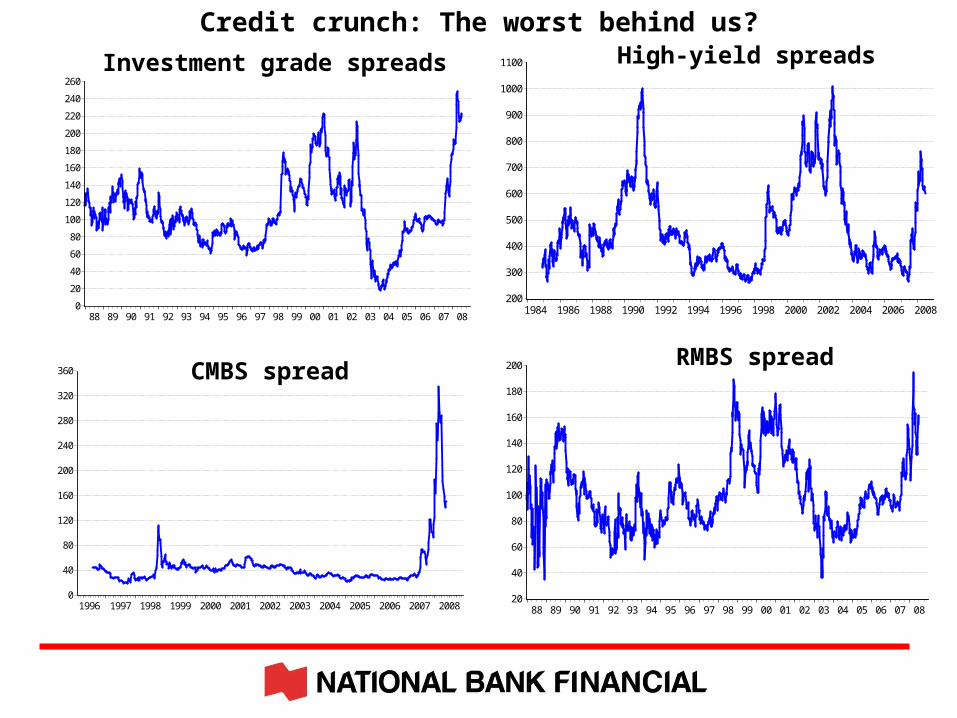
88 89 90 91 92 93 94 95 96 97 98 99 00 01 02 03 04 05 06 07 08
Credit crunch: The worst behind us?
0
40
80
120
160
200
240
280
320
360
1996 1997 1998 1999 2000 2001 2002 2003 2004 2005 2006 2007 2008
CMBS spread
200
300
400
500
600
700
800
900
1000
1100
1984 1986 1988 1990 1992 1994 1996 1998 2000 2002 2004 2006 2008
High-yield spreads
RMBS spread
0
20
40
60
80
100
120
140
160
180
200
220
240
260
88 89 90 91 92 93 94 95 96 97 98 99 00 01 02 03 04 05 06 07 08
Investment grade spreads

Our « cautious » view onoil price and S&P/TSX
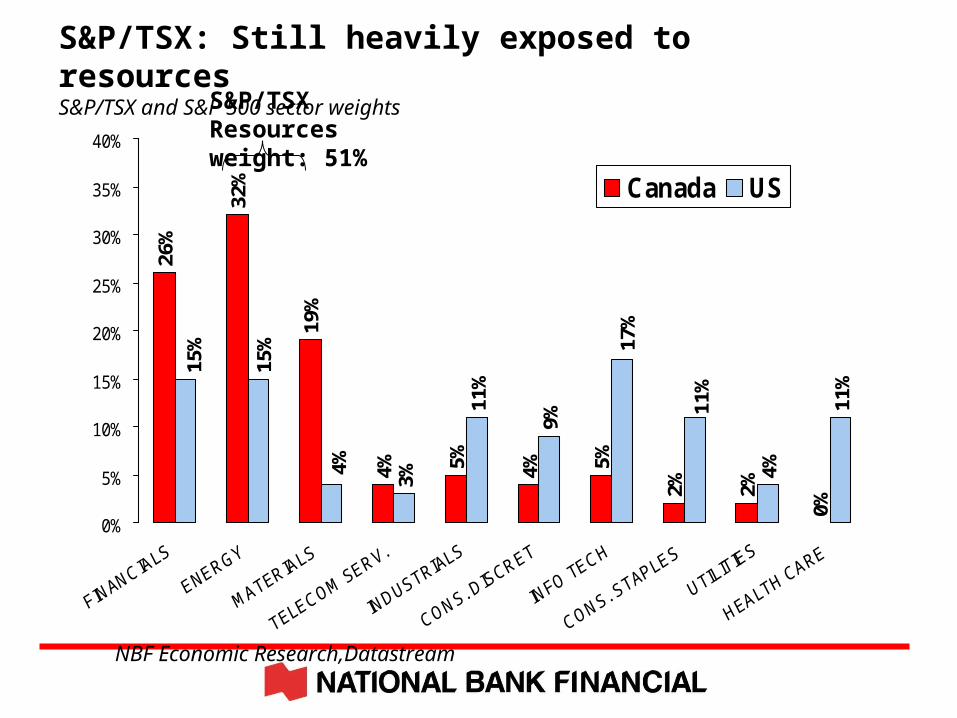
32%
19%
4% 5% 4% 5%
2% 2%
0%
3%
11%
9%
4%
11%
26%
11%
17%
4%
15%
15%
0%
5%
10%
15%
20%
25%
30%
35%
40%
Canada US
S&P/TSX: Still heavily exposed to resourcesS&P/TSX and S&P 500 sector weights
NBF Economic Research,Datastream
S&P/TSX Resources weight: 51%
-40%
-30%
-20%
-10%
0%
10%
20%
30%
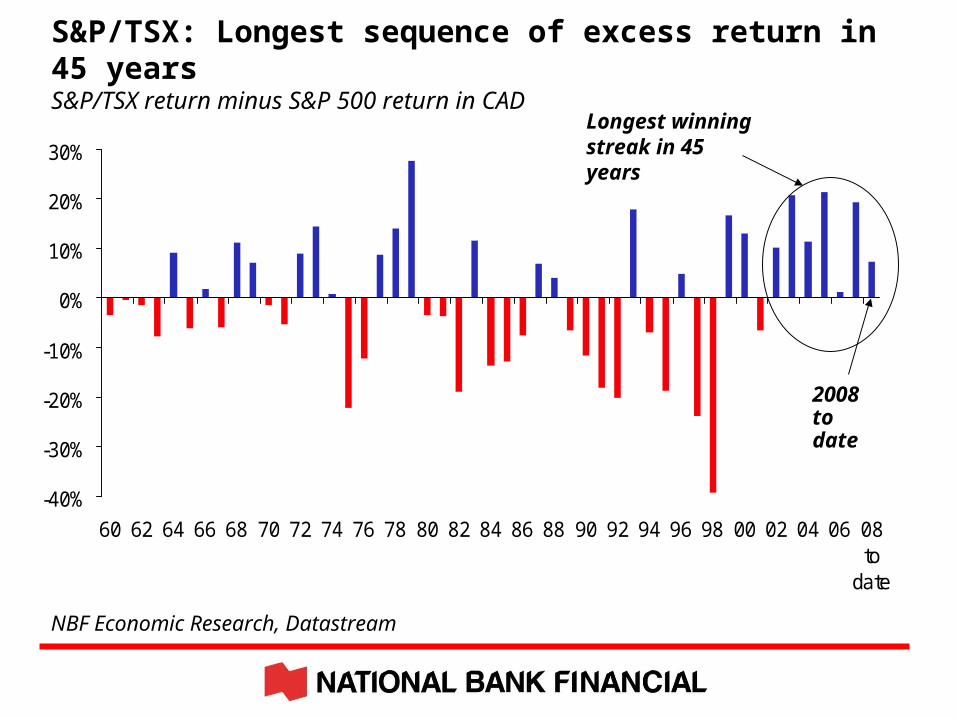
60 62 64 66 68 70 72 74 76 78 80 82 84 86 88 90 92 94 96 98 00 02 04 06 08to
date
S&P/TSX: Longest sequence of excess return in 45 yearsS&P/TSX return minus S&P 500 return in CAD
Longest winning streak in 45 years
2008 to date
NBF Economic Research, Datastream
-200
-150
-100
-50
0
50
100
150
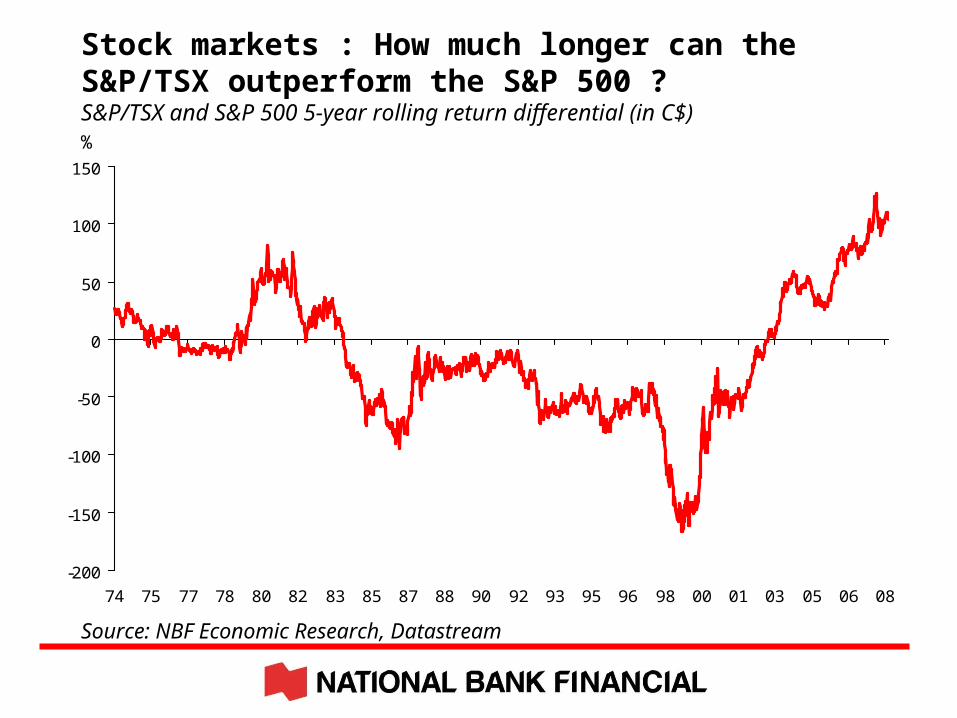
74 75 77 78 80 82 83 85 87 88 90 92 93 95 96 98 00 01 03 05 06 08
Stock markets : How much longer can the S&P/TSX outperform the S&P 500 ?S&P/TSX and S&P 500 5-year rolling return differential (in C$)
Source: NBF Economic Research, Datastream
%

-2
0
2
4
6
70 72 74 76 78 80 82 84 86 88 90 92 94 96 98 00 02 04 06 08
100
200
300
400
500
Commodity prices tend to slide when growth slows for 2 years Deviation of global growth from long-term trend (3.8%) vs. Reuters/Jefferies CRB
NBF Economy & Strategy (data via Datastream, IMF)NBF Economy & Strategy forecast for 2009: 3.5%
Reuters/Jefferies CRB
World GDP growth minus 3.8%
Percentage points
?
IndexShaded areas show two or more consecutive years of below-trend global growth

-4
-3
-2
-1
0
1
2
3
4
5
6
7
8
70 72 74 76 78 80 82 84 86 88 90 92 94 96 98 00 02 04 06 08
Slower GDP growth = weaker oil demand = lower oil price Real world GDP growth and global oil consumption
% y/y
EIA
World GDP
Oil consumption
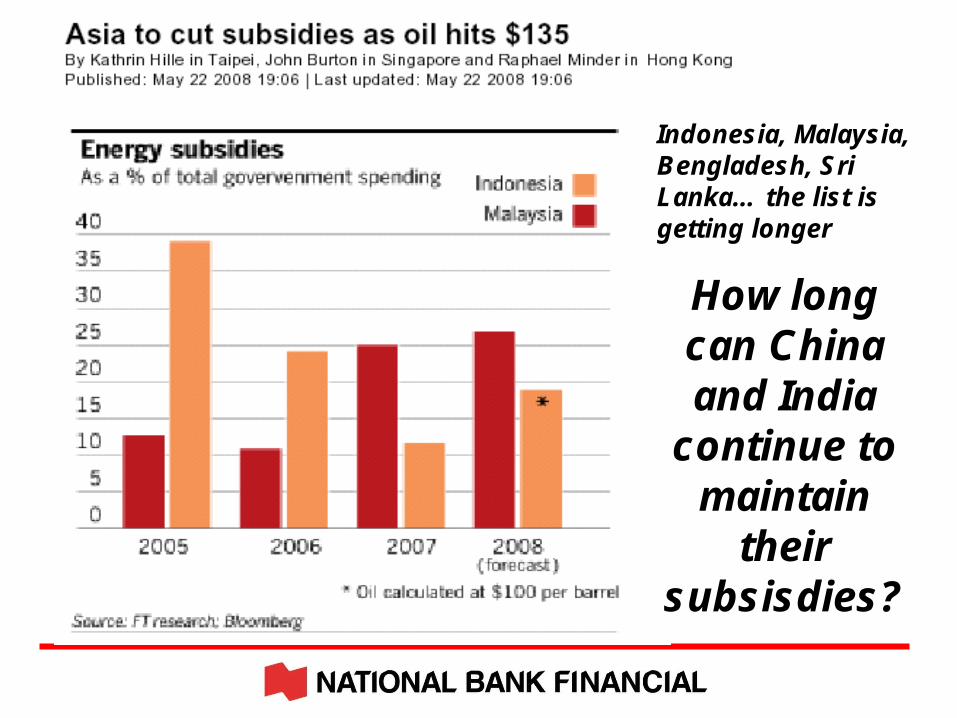
How long can China and India
continue to maintain
theirsubsisdies?
Indonesia, Malaysia, Bengladesh, Sri Lanka… the list isgetting longer

OPEC Surplus Crude Oil Production Capacity
0
1
2
3
4
5
6
1997 1999 2001 2003 2005 2007 2009
Millionbarrelsper day
Forecast
Note: Shaded area represents 1997-2007 average (2.5 million barrels per day)
Short-Term Energy Outlook, June 2008

Investment strategy
Preference for • Low debt companies
•Large capitalisations
•Dividend paying
•U.S. equities over S&P/TSX
Some sectors we currently favour Consumer staples, Utilities, Health care
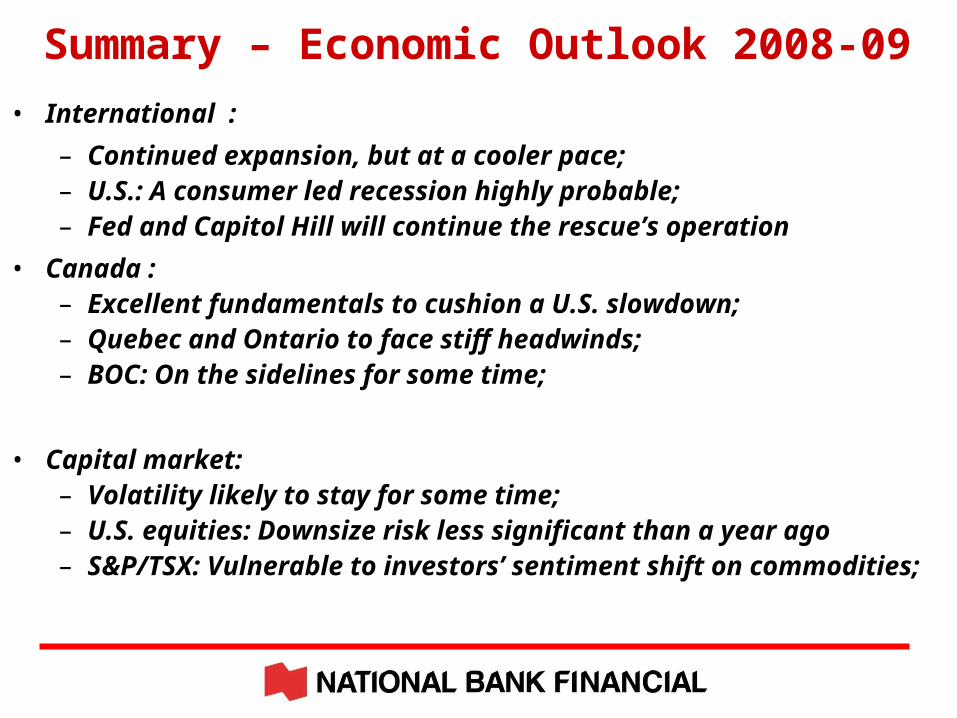
Summary – Economic Outlook 2008-09
• International :
– Continued expansion, but at a cooler pace;– U.S.: A consumer led recession highly probable;– Fed and Capitol Hill will continue the rescue’s operation
• Canada :– Excellent fundamentals to cushion a U.S. slowdown;– Quebec and Ontario to face stiff headwinds;– BOC: On the sidelines for some time;
• Capital market:– Volatility likely to stay for some time;– U.S. equities: Downsize risk less significant than a year ago – S&P/TSX: Vulnerable to investors’ sentiment shift on commodities;

Thank you for your attention


