
Economic Policy, Quality of Institutions and Mechanisms of
“Resource Curse”
Victor Polterovich, Vladimir Popov, Alexander Tonis
New Economic School, 2007

2
Curse or blessing?• “So here’s my prediction: You tell me the price of
oil, and I’ll tell you what kind of Russia you’ll have. If the price stays at $60 a barrel, it’s going to be more like Venezuela, because its leaders will have plenty of money to indulge their worst instincts, with too few checks and balances. If the price falls to $30, it will be more like Norway. If the price falls to $15 a barrel, it could become more like America — with just enough money to provide a social safety net for its older generation, but with too little money to avoid developing the leaders and institutions to nurture the brainpower of its younger generation.” (THOMAS L. FRIEDMAN: Will Russia Bet on Its People or Its Oil Wells? - New York Times, February 16, 2007.)
• “How do we know that the God loves the Arabs? If he didn’t, why he would give them all the oil?” (American folklore)

3
Fuel production per capita, kg of oil equivalent, 2005Fig. 1. Fuel production per capita, kg of oil equivalent, 2005, top countries
1000 10000 100000 1000000
Qatar
Kuwait
Brunei
United Arab Emirates
Norway
Equatorial Guinea
Saudi Arabia
Trinidad and Tobago
Oman
Libya
Australia
Bahrain
Turkmenistan
Canada
Gabon
Kazakhstan
Venezuela, RB
Russian Federation
Algeria
Denmark
Angola
United States
Congo, Rep.
Iran, Islamic Rep.
Malaysia
Iraq
Netherlands
Azerbaijan
South Africa
United Kingdom
Uzbekistan
Mexico
Less than 5 tons per capita
5 to 10 tons per capita
Over 10 tons per capita

4
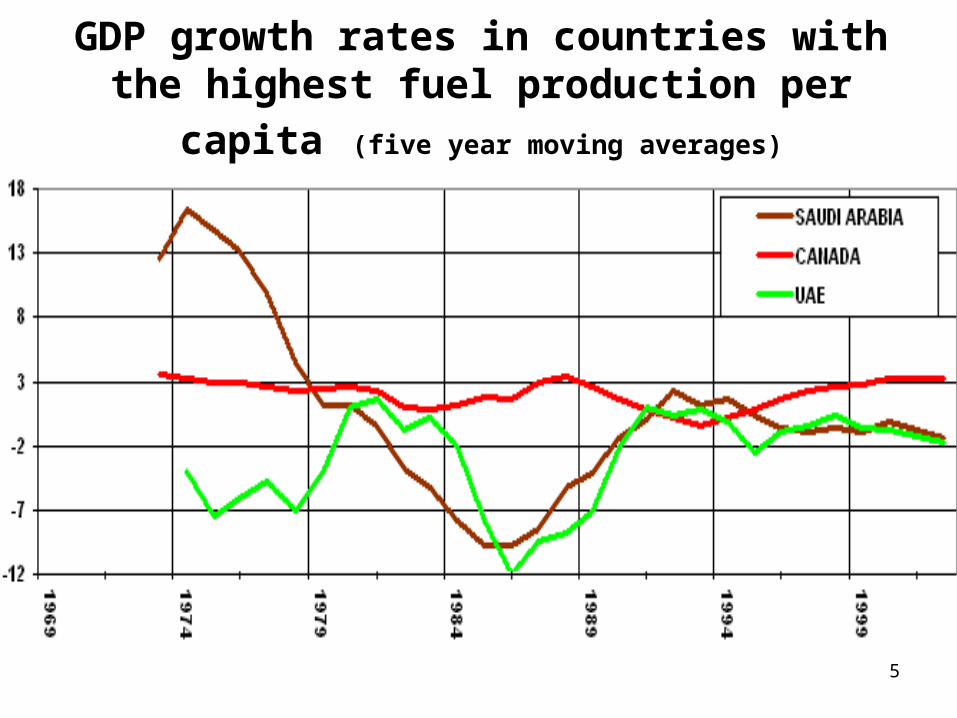
GDP growth rates in countries with the highest
fuel production per capita (five year moving averages)
5
GDP growth rates in countries with the highest
fuel production per capita (five year moving averages)

6
Literature
• Sachs, Warner (1995) were among the first to claim that "resource curse" is real and that resource abundant economies do indeed grow more slowly than the others.
• Hundreds of papers were published since then supporting the "resource curse" thesis and offering new explanations of mechanisms and effects that may inhibit growth in resource rich economies.
• Several recent papers, however (Alexeev, Conrad, 2005; Stijns, 2005; Brunnschweiler, 2006) question the mere existence of the "resource curse" and make it necessary to reconsider the hypotheses about the impact of resource abundance on economic growth.

7
Main points: review of theories and stylized facts• This paper compares various theories of "resource curse" with
a special focus on models allowing for the varying - positive or negative - impact of resources on development depending on the quality of institutions and economic policies.
• Several mechanisms leading to a potentially inefficient use of resources are being examined; it is demonstrated that each of these mechanism is associated with market imperfections and can be "corrected " with appropriate government policies.
• Our papers:• Экономическая политика, качество институтов и механизмы "ресурсного проклят
ия". М., Издательский дом ГУ ВШЭ, 2007 (в соавторстве с В. Полтеровичем и А. Тонисом).
• Resource abundance, political corruption, and instability of democracy. - NES Working Paper # WP2007/73 (Co-authored with V. Polterovich and A. Tonis).
• Механизмы ресурсного проклятия и экономическая политика. - Вопросы экономики, № 6, 2007 (в соавторстве с В. Полтеровичем и А. Тонисом).

8
Main points: conclusions• Empirical evidence seems to suggest that resource abundant
countries have on average:– lower budget deficits and inflation, higher foreign exchange reserves
and higher inflows of FDI; – lower domestic fuel prices => positive effect on long term growth even though
they are associated with losses resulting from higher energy intensity; – higher investment/GDP ratio, higher R&D/GDP ratio; – lower income inequalities.
• On balance, resource wealth turns out to be conducive to growth, especially in countries with strong institutions and low RER. However, resource abundance – weakens institutions, if they were poor to begin with, does not contribute to the
accumulation of human capital;– leads to higher RER (Dutch disease), low domestic fuel prices, high energy
intensity;– contributes to higher volatility of growth;– makes democratic political regimes very unstable - they tend to gravitate
towards authoritarianism.

9
Prebish–Singer theory:
• Prebish (1950), Singer (1950): relative prices of resources decline => lower growth of resource oriented economies. Remedy: temporary isolation from the world markets for developing manufacturing industries.
• However: relative resource prices fall only for some commodities and in some periods (Kelard, Wohar (2002)).

10
Staple Trap Theory
• Innis (1954), Baldwin (1956), Hirshman (1977); Auti , Kiiski (2001).
• The impact of resource export depends on the types of interaction of resource sector with the upstream and downstream industries. If machinery for the resource sector is imported, whereas resource output is exported, the country falls into a trap.

11
Dutch disease
• Gorden, Neary (1982) : increase in resource prices => appreciation of national currency => increase in imports of tradables => reallocation of capital and labor into resource sector and into non-tradables.
• Krugman (1987), Matsuyama (1992) – if there are externalities from manufacturing (exports, high tech industries) => slowdown of growth.
12
Government failure: distribution of resource rent, debt crisis
• Lobbying, unfair competition, corruption => slowdown of growth: Auty (1997), Sachs and Warner (1999a,b), Wantchekon and Yehoue (2002)), Bulte at al. (2003).
• Redistribution of resource rent by the government (govn’t investment and subsidies to support non-resource industries) can be inefficient.
• Debt crisis: Manzano, Rigobon (2001)

13
Overshooting effect
• Rodriguez and Sachs (1999), Boyce, Emery (2005) introduced another factor of production (oil) into the Ramsey model – it grows more slowly than capital and labor
• This resulted in the overshooting effect: first the resource economy grows faster, than – more slowly than non-resource economy.
• Venezuelan negative growth path in 1972-1993 may be explained by their theory.
• External;ities are not accounted for.

14
Empirical evidence
• High share of resources in export => slower growth: Sachs, Warner (1995);
• Low quality of institutions : Leamer et al (1998), Sala-i-Martin, Subramanian (2003) Gylfason (2004), Stijns, (2005 )
• Deterioration of human capital: Gylfason (2001), Suslova, Volchkova (2006).

15
Empirical evidence
• No resource curse: Alexeev, Conrad (2005), Stijns (2005), Brunnschweiler (2006)
• Critique of Sachs and Warner:
The share of resource industries (production, export) in GDP is endogenous.
Controlling for the per capita GDP in 1970 (instead of 1960) does not allow to fully account for the overshooting effect.
16
Empirical evidence
• Non-linearity: Mehlum, Moene, Torvik (2005), Robinson, Torvik, Verdier (2006).
• Chystyakov (2006) – modification of (Leite, Weidmann, 1999), threshold effect:
Resource orientation stimulates corruption in
countries with poor initial quality of institutions,
but not in countries with strong institutions.

17
Three channels of “resource curse”
• «Technological” – inability to reap externalities from the development of non-resource industries
• Macroeconomic: poor management of resource rent (budget deficits, inflation).
• Institutional: – Struggle for resource rent – Instability of democracy
Fundamental contradiction: Market failure requires government intervention, but low institutional quality results in government failure.

18
Data
• Macroeconomic indicators - World Development Indicators, about 100 countries, 25 years (1975 –99), including the share of fuel in exports and mineral rent.
• Proven reserves and production of hydrocarbons - BP Statistical Review of World Energy, June 2006.
• Corruption perception index – Transparency International
• Democracy – political rights index - Freedom House

19
Indicators of resource abundance
• EXfuel - share of fuel in exports in 1960-99), %.
• Imfuel – average ratio of net import of fuel to total import, %
• Prodf- production of oil and gas per capita in 1980-1999, tons of oil equivalent.
• ResOG – proven reserves of oil and gas per capita in 1980-1999, tons of oil equivalent.
• SSA – sub-soil assets per capita in $ US in 1994 [Kunte et al., 1998].

20
Different indicators of resource abundance – correlation coefficients

21
Is there resource “curse” or “blessing”?y = - 0.03 Y75*** + 0. 016*PopDens + - 1.01***n + 0. 10***ICres +
0.012**SSA + 4.02,
N= 63, R-squared = 0.4892
• Neither of other indicators of the resource wealth (EXfuel, Imfuel, Prodf, ResOG) is significant in growth regressions after controlling for:
– Y75 – PPP GDP per capita in 1975, % of the US level;
– PopDens – density of the population (persons per 1 square km)
– n – average annual population growth rates in 1975-99, %
– ICres – residual index of investment climate (residual from the regression of investment climate on Y75)

22
Indicators of the quality of institutions
• IC – average investment climate index in 1984-90 (varies from 0 to 100, the higher the better investment climate), International Country Risk Guide
• IC2000 – same for 2000.
• CC – index of control over corruption (varies from -2.5 to +2.5, the higher, the greater the control), 2000, World Bank
23
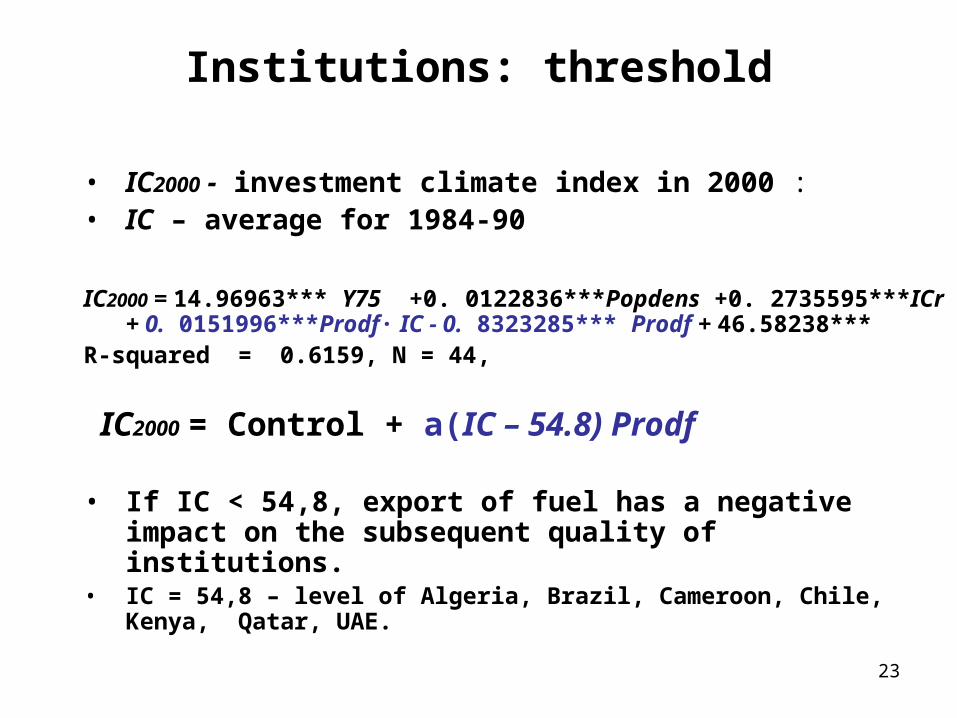
Institutions: threshold
• IC2000 - investment climate index in 2000 : • IC – average for 1984-90
IC2000 = 14.96963*** Y75 +0. 0122836***Popdens +0. 2735595***ICr + 0. 0151996***Prodf∙ IC - 0. 8323285*** Prodf + 46.58238***
R-squared = 0.6159, N = 44,
IC2000 = Control + a(IC – 54.8) Prodf
• If IС < 54,8, export of fuel has a negative impact on the subsequent quality of institutions.
• IС = 54,8 – level of Algeria, Brazil, Cameroon, Chile, Kenya, Qatar, UAE.
24
Institutions: threshold
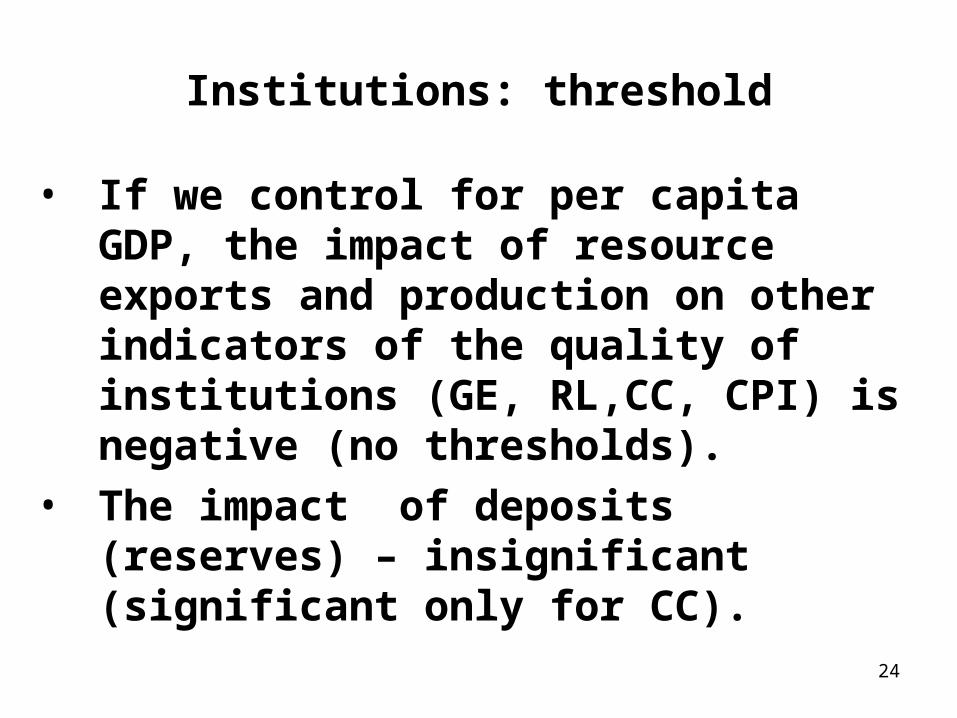
• If we control for per capita GDP, the impact of resource exports and production on other indicators of the quality of institutions (GE, RL,CC, CPI) is negative (no thresholds).
• The impact of deposits (reserves) – insignificant (significant only for СС).

25
Macroeconomic policy in resource rich countries: budget surplus
• EXfuel and Prodf are negatively correlated with inflation, positively with FDI and budget surplus
BS = 0. 0504827** IC + 0. 0360348 ** EXfuel -0. 0549348 D – 5.146773 ***,
• D – average government debt to GDP ratio in 1975-99, %
• R-squared = 0. 3825, N = 92• Regression works with and without D and
with Prodf instead of EXfuel

26
Macroeconomic policy in resource rich countries: inflation
• lnInf = 0, 0163441** Y75 – 0,0568581* Prodf – 0,0576217*** IC + 5,581482***,
R2 = 0,4267, N = 41.
• lnInf = –0,00673 Y75 – 2,880362** Prodf + 2,880362***,
R2 = 0,15083, N = 41,

27
Income inequalities in resource exporting countries are lower:
Ineq = –0.001*** Y95 + 0.002* PopDens – 1.21*1008
* POP +
+ 1.25*1006
***AREA – 10.09*** TRANS – 1.57*DEM –
- 0.06**EXfuel + 54.4***,
N= 115, R-squared = 0.4406
Where
Ineq – GINI coefficient in the latest available year of the period 1990-2005,
DEM – average level of authoritarianism (1 to 7) according to Freedom House, in 1970-2002

28
Income inequalities in resource exporting countries are lower:
Ineq = –0.26*** Y95us + 0.016*** PopDens + 6.47*1007
***AREA –
832.1***Y99/Area + + 0.18***URBAN - 4.11**Islam + 12.24*** TRANS –
4.07**GE2002 – 1.17*DEM – 0.09**EXfuel + 46.4***,
• N = 114, R-squared = 0.6089,
• where: GE2002 - government effectiveness index in 2002,
• URBANIZ –share of urban population in 2002,
• Y99/Area – ratio of PPP GDP in 1999 per 1 square km of national territory,
• Islam – dummy variable for the membership in Organization of Islamic Conference.

29
Investment• In linear regressions resource abundance
affects the share of investment in GDP positively. But the threshold regression works better:
Inv = – 0. 1307258***Y75 + 1.177838***Prodf – 0. 0139361 **Prodf ∙ IC + 0.2737717 *** IC + 11.84***,
R-squared = 0. 25, N = 44.
• Inv = Contr + a IC +b(84,5- IC) Prodf • If IC > 84,5 (Canada, Finland, New Zealand, UK),
increase in fuel production does not lead to higher share of investment in GDP.
30
FDI
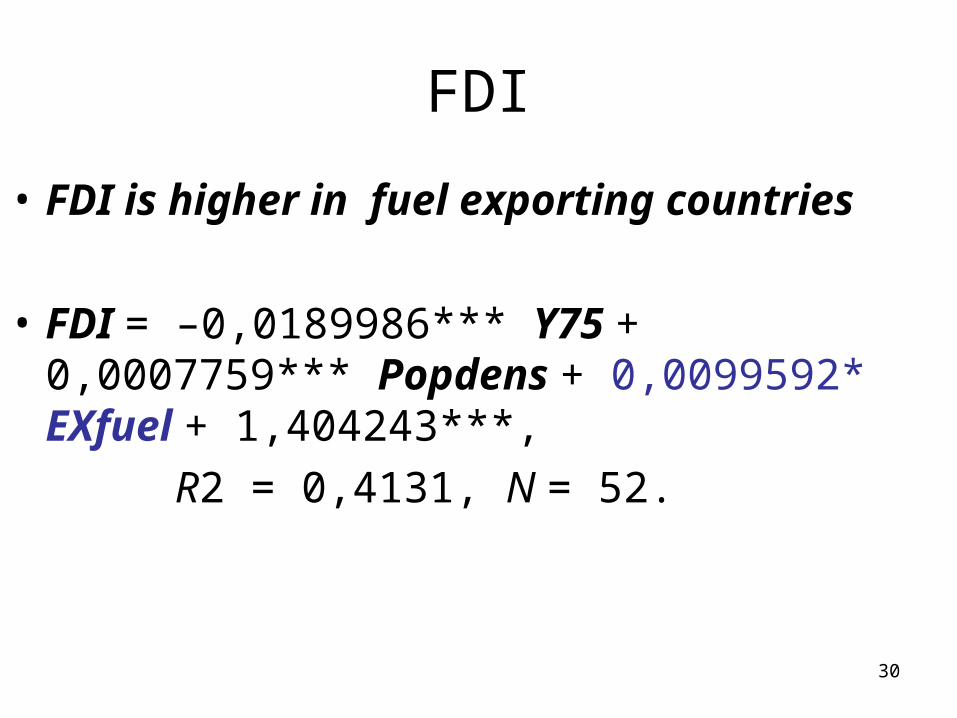
• FDI is higher in fuel exporting countries
• FDI = –0,0189986*** Y75 + 0,0007759*** Popdens + 0,0099592* EXfuel + 1,404243***,
R2 = 0,4131, N = 52.
31
Human capital
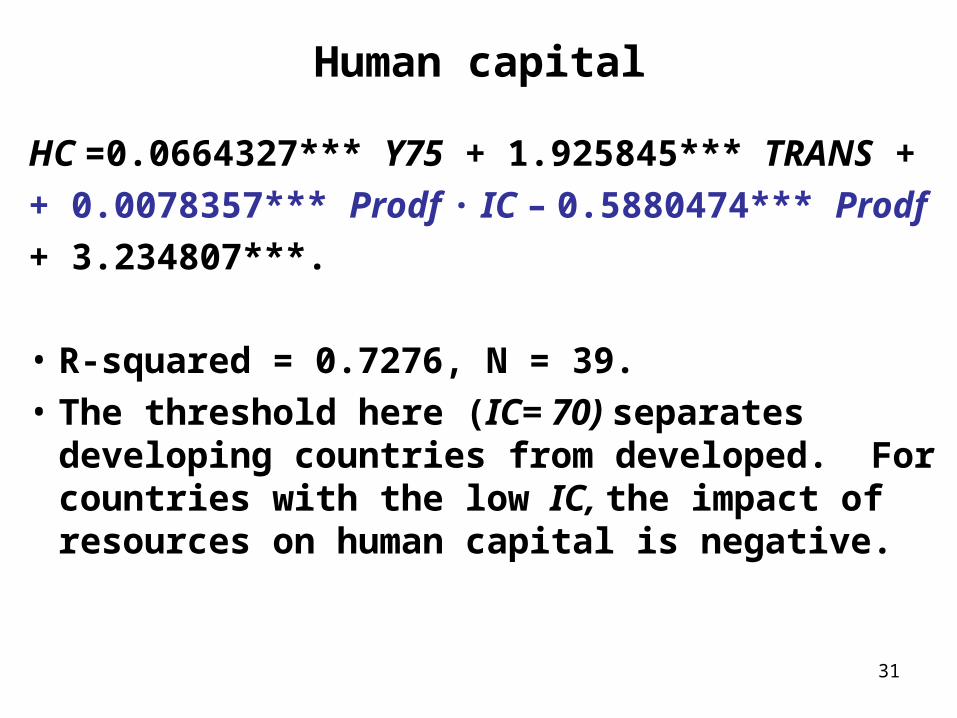
HC =0.0664327*** Y75 + 1.925845*** TRANS +
+ 0.0078357*** Prodf ∙ IC – 0.5880474*** Prodf
+ 3.234807***.
• R-squared = 0.7276, N = 39.
• The threshold here (IC= 70) separates developing countries from developed. For countries with the low IC, the impact of resources on human capital is negative.

32
Industrial policies in resource rich countries: low domestic fuel prices
• EnEff – PPP GDP per one kg of used fuel (oil equivalent), dollars, average in 1975-99 (or in 2003);
• PFuel – ratio of domestic fuel price to US fuel prices as a % of similar ratio for all prices in 1993;
• Ind – share of industry in GDP in 1995, %.
33
Industrial policies in resource rich countries: low domestic fuel prices
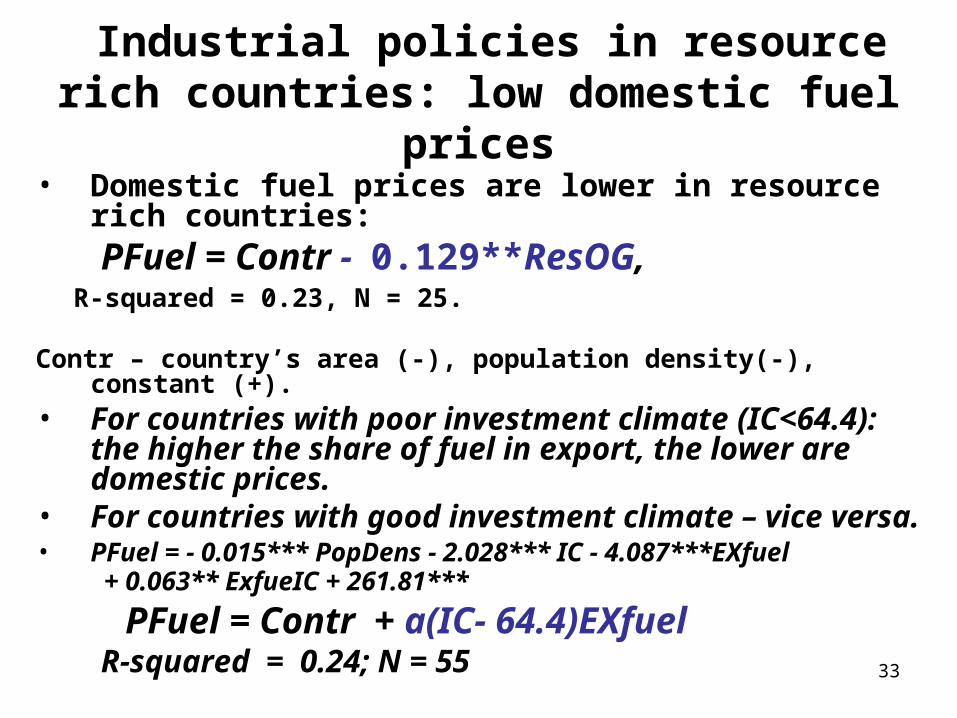
• Domestic fuel prices are lower in resource rich countries:
PFuel = Сontr - 0.129**ResOG, R-squared = 0.23, N = 25. Contr – country’s area (-), population density(-), constant (+).• For countries with poor investment climate (IC<64.4):
the higher the share of fuel in export, the lower are domestic prices.
• For countries with good investment climate – vice versa.
• PFuel = - 0.015*** PopDens - 2.028*** IC - 4.087***EXfuel + 0.063** ExfueIC + 261.81***
PFuel = Contr + a(IC- 64.4)EXfuel R-squared = 0.24; N = 55

34
Industrial policies in resource rich countries: low domestic fuel prices lead
to energy waste
• EnEff = Contr– 0.09** Ind + 0.01* PFuel
R-squared = 0.2572, N = 43,
Contr: PPP GDP per capita in 1975, area, population (+,+,+).
Energy efficiency is lower in fuel producing
and exporting countries
• EnEff = Contr– 0.076*** Prodf ,
• R-squared = 0.1821, N = 44.• Contr: lоg(Y75), Area, POP (+, -, +).

35
Industrial policies in resource rich countries: low domestic fuel prices lead
to higher growth
y = 0.14*** IC – 0.063 *** Y75 + 0.006** Pop – 0.011*** PFuel – 3.72***, R-squared = 0.5217, N = 50.
• When controlling for energy efficiency, the coefficient of PFuel increases:
y = 0.13*** IC – 0.06*** Y75 + 0.0048* Pop – 0.013*** PFuel +0.318*** EnEff – 4.13***.
R-squared = 0. 7183, N = 46.

36
Lower domestic fuel prices stimulate growth
AustraliaAustriaBahamas, TheBangladeshBelgium
Belize
Botswana
Cameroon
Canada
Congo, Rep.
Denmark Dominican Republic
Egy pt, Arab Rep.
Fiji
FinlandFrance
Gabon
Greece
Hong Kong, China
Hungary
Iceland
Indonesia
Iran, Islamic Rep.
Ireland
Italy
Jamaica
Japan
Keny a
Korea, Rep.
Luxembourg
Malawi
Mauritius
MoroccoNepalNetherlands
New Zealand
Nigeria
Norway Pakistan
Philippines
Portugal
Romania
Russian FederationSenegal
Sierra Leone
Singapore
Spain
Sri Lanka
SwazilandSwedenSwitzerland
Thailand
Trinidad and TobagoTunisia
TurkeyUnited KingdomUnited States
Zambia
Zimbabwe
-50
510
aver
age
annu
al g
r ra
te o
f GD
P p
0 100 200 300Relative fuel prices, % of aver P/P*

37
R&D spending is higher in countries with low domestic fuel prices
RD = 0,0106823* Y75 – 0,226082** IC – 0,0022511** PFuel + 0,4840302** TRANS – 0,7641969,
R2 = 0,73116, N = 37,
• RD — average R&D spending as a % of GDP in 1980—99
• With more control variables:
• RD = 0,0098996* Y75 + 0,0285666* IC – 0,0019651* PFuel + 0,6071381** TRANS – 0,0000719* PopDens -
– 4,99 • 10–8 ** Area + 0,004741*** Pop – 1,288969***, R2 = 0,7991, N = 37.

38
Industrial policies in resource rich countries: low domestic fuel prices lead
to higher growth
• y = – 0. 83***n – 0. 049 *** Y75 + 0. 00031*** PopDens + 0. 059** IC + 0.0078 *** Pop + 0.00087*EXfuel∙IC – 0.058* EXfuel – 0. 011 *** PFuel – 2.60***TRANS + 2.35,
• R-squared = 0. 6499, N = 47.
y = Contr – 0.011***PFuel+ 0.00087*EXfuel (IC - 66)
• If institutions are poor (IC < 66), export of fuel (EXfuel) is associated with lower growth.
• Close to the threshold were Cyprus, Hungary, Malaysia, Thailand.
• The lower the level of relative domestic fuel prices, the higher is growth.
39
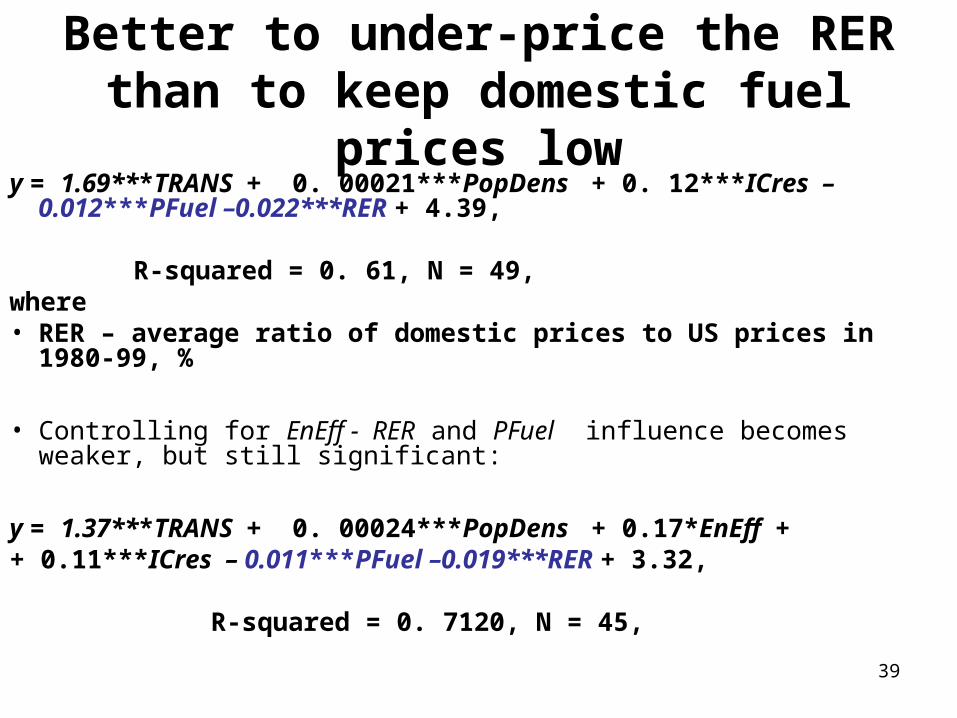
Better to under-price the RER than to keep domestic fuel prices low
y = 1.69***TRANS + 0. 00021***PopDens + 0. 12***ICres – 0.012***PFuel –0.022***RER + 4.39,
R-squared = 0. 61, N = 49, where • RER – average ratio of domestic prices to US prices in 1980-99, %
• Controlling for EnEff - RER and PFuel influence becomes weaker, but still significant:
y = 1.37***TRANS + 0. 00024***PopDens + 0.17*EnEff ++ 0.11***ICres – 0.011***PFuel –0.019***RER + 3.32,
R-squared = 0. 7120, N = 45,

40
Two policies are not linked
Antigua and Barbuda
Australia
AustriaBahamas, The
Bangladesh
Belarus
Belgium
Belize
Botswana
Bulgaria
Cameroon
Canada
Congo, Rep.
CroatiaCzech Republic
Denmark
Dominican Republic
Egy pt, Arab Rep.
Fiji
Finland
France
Gabon
Germany
Greece
Grenada
Guinea
Hong Kong, ChinaHungary
Iceland
Indonesia
Iran, Islamic Rep.
IrelandItaly
Jamaica
Japan
Keny a
Korea, Rep.
Luxembourg
Malawi
Mauritius
Moldov a
Morocco
NepalNetherlands
New ZealandNigeriaNorway
Pakistan
Philippines
Poland
Portugal
Romania
Russian Federation
Senegal
Sierra Leone
Singapore
Slov ak RepublicSlov enia
Spain
Sri Lanka
St. Kitts and Nev is
St. Lucia
St. Vincent and the Grenadines
Swaziland
Sweden
SwitzerlandThailand
Trinidad and Tobago
Tunisia
Turkey
Ukraine
United Kingdom
United States
Vietnam
Zambia
Zimbabwe
010
020
030
0R
elat
ive
fuel
pri
ces,
% o
f ave
r P
/P*
0 50 100 150 200PPP to off exch rate, average 1

41
How to underprice the RER? Accumulation of FOREX(Polterovich, Popov, 2004). Accumulation of Foreign Exchange Reserves and Long Term Economic Growth.
Does policy induced FOREX Does policy induced FOREX accumulation influence growth?accumulation influence growth?
GROWTH = CONST. + CONTR. VAR. + GROWTH = CONST. + CONTR. VAR. + RpolRpol (0.10 (0.10 –– 0.0015Ycap75us) 0.0015Ycap75us)
R2 = 56, N=70, all variables are significant at R2 = 56, N=70, all variables are significant at 10% level or less,10% level or less,
where Ycap75us where Ycap75us –– PPP GDP per capita in 1975 PPP GDP per capita in 1975 as a % of the US level. as a % of the US level.
It turns out that there is a threshold level of It turns out that there is a threshold level of GDP per capita in 1975 GDP per capita in 1975 –– about 67% of the US about 67% of the US level: countries below this level could stimulate level: countries below this level could stimulate growth via accumulation of FER in excess of growth via accumulation of FER in excess of objective needs, whereas for richer countries the objective needs, whereas for richer countries the impact of FER accumulation was negative impact of FER accumulation was negative

42
FOREX is higher in fuel exporting countries
• R_IM = 0.0014471* EXfuel + 0.2827523,• R-squared = 0.0279, N = 162,• where R_IM – ratio of FOREX to monthly import,
average for 1960-99, months• FOREX is correlated (significantly) with other
indicators of resource wealth – fuel production, proven reserves, resource rent:
• R_IM = 5.58*10-6*** SSA + 0.3174006,• R-squared = 0.0388, N = 77,• where SSA –«sub-soil assets», $ US per capita in
1994.

43
FOREX to GDP: Indonesia, Nigeria, Venezuela, 1960-2000
Foreign exchange reserves/GDP ratio (%) in 1960-99
0
5
10
15
20
25
30
35
Indonesia
Nigeria
Venezuela, RB

44
Fuel exporters have high level of FOREX, but it increases more slowly
• FOREXgr = -10.25**FOREX_IMP -4.01**logY75 – 0.13**EXfuel + 20,55***
• R-squared = 0.1979, N = 88.• where• FOREXgr – increase in FOREX to GDP
ratio in 1975-99, p.p.• FOREX_IMP – ratio of FOREX to
monthly import, average for 1960-99, months

45
Import tariffs are higher in fuel exporting countries
ID = -0.002***Y75 +.066* EXfuel +15.73 ***,
• R-squared = 0.3780, N = 100,
where• ID – average ratio of import duties to
imports in 1975-99, %

46
RER is higher in fuel exporting countries
• RER = 25.88*** log Y + 0.33***TRADEav +0.33*** EXfuel – 39.07* ,
• R-squared = 0.5255, N = 106,
• RER – average ratio of domestic prices to US prices in 1975-99, %
• TRADEav – average ratio of foreign trade to PPP GDP in 1980-99, %

47
Increase in the share of export in GDP is lower in resource exporting countries
EXPgr = 0.64***EXPav +0.14*** POP – 0.19** EXfuel -7.44**,
R-squared = 0.2956, N = 74,
Where:• EXPgr – increase in the share of export in GDP in 1980-99, p.p. • EXPav – average share of export in GDP in 1980-99, %
EXPgr = 0.56***EXPav - 0.003**Y75 + 0.51**IC + 0.10***POP –- 0.18**EXfuel - 24.6**,
R-squared = 0.3447, N =62,

48
Increase in the ratio of export to GDP in 1960-99, p.p.,
and the share of fuel in export in 1960-99, %
Algeria
Argentina
Austria
BangladeshBarbados
Belgium
Benin
BoliviaBrazilBurkina Faso
BurundiCentral African Republic
Chad
Chile
Colombia
Congo, Rep.
Costa Rica
Cote d'IvoireDenmarkDominican Republic
Ecuador
Egypt, Arab Rep.
El Salvador
Fiji
FinlandFrance GabonGhana
GreeceGuatemala
Guyana
Haiti
Honduras
Hong Kong, China
Iceland
Indonesia
Ireland
Israel
ItalyJamaica
JapanKenya
Korea, Rep.
Madagascar
Malawi
Malaysia
Mauritania
Mauritius
Mexico
MoroccoNetherlandsNicaraguaNiger
Nigeria
NorwayParaguay
Peru
Philippines
RwandaSaudi Arabia
Senegal
South Africa
Spain
Sri Lanka
Sweden
Syrian Arab Republic
Thailand
Togo
Trinidad and TobagoUganda
United KingdomUruguay
Venezuela, RB
Zambia
-50
05
01
00
Exp
/GD
P-i
ncr
60
-99
0 20 40 60 80 100Fuel exp-60-99

49
Increase in the share of foreign trade in PPP GDP is lower in fuel exporting states
TRADEgr = 0.17***Y75 – 0.68***EXfuel – 5.1*
• R-squared = 0.3551, N = 90,
• TRADEgr – increase in the share of foreign trade in PPP GDP in1980-99, p.p.

50
Increase in the ratio of foreign trade to PPP GDP in 1980-99, p.p.,
and the share of fuel in export in 1960-99, %
Algeria
ArgentinaAustralia
Austria
BangladeshBarbados
Belize
Benin Boliv iaBrazil
Bulgaria
Burkina FasoBurundiCameroon
CanadaCentral Af rican RepublicChad
ChileChina Colombia
Congo, Rep.
Costa Rica
Cote d'Iv oireCy prus
DominicaDominican Republic
EcuadorEgy pt, Arab Rep.El Salv adorFinlandFrance
Gabon
GhanaGreece
GuatemalaGuinea-BissauHonduras
Hong Kong, China
Hungary
IcelandIndia
Indonesia Iran, Islamic Rep.
Ireland
IsraelItalyJamaica
Japan
JordanKeny a
Korea, Rep.
Malawi
Malay sia
MaliMauritaniaMauritius
Mexico
Morocco
Mozambique
Nepal NetherlandsNicaragua
Niger
Nigeria
NorwayPakistan Panama
Papua New Guinea
ParaguayPeru
PhilippinesPortugal
RomaniaRwanda
Saudi Arabia
Senegal
Singapore
South Af rica
Spain
Sri LankaSt. Vincent and the Grenadines
SwedenSwitzerland
Sy rian Arab Republic
Thailand
Togo
Trinidad and Tobago
Tunisia
TurkeyUnited StatesUruguay
Venezuela, RB
Zambia
Zimbabwe
-100
-50
050
100
Icre
ase in
the
ratio
of fo
reig
n
0 20 40 60 80 100Fuel exp-60-99

51
Conclusions: typical policy of fuel exporters and its impact on growth
• Low domestic prices for fuel (stimulates R&D, investment, and growth, but also energy waste)
• Overvalued RER (bad for growth of export, growth of foreign trade, and growth of the economy)
• Relatively high import duties – can be bad and good for growth (depending on the quality of institutions)
52
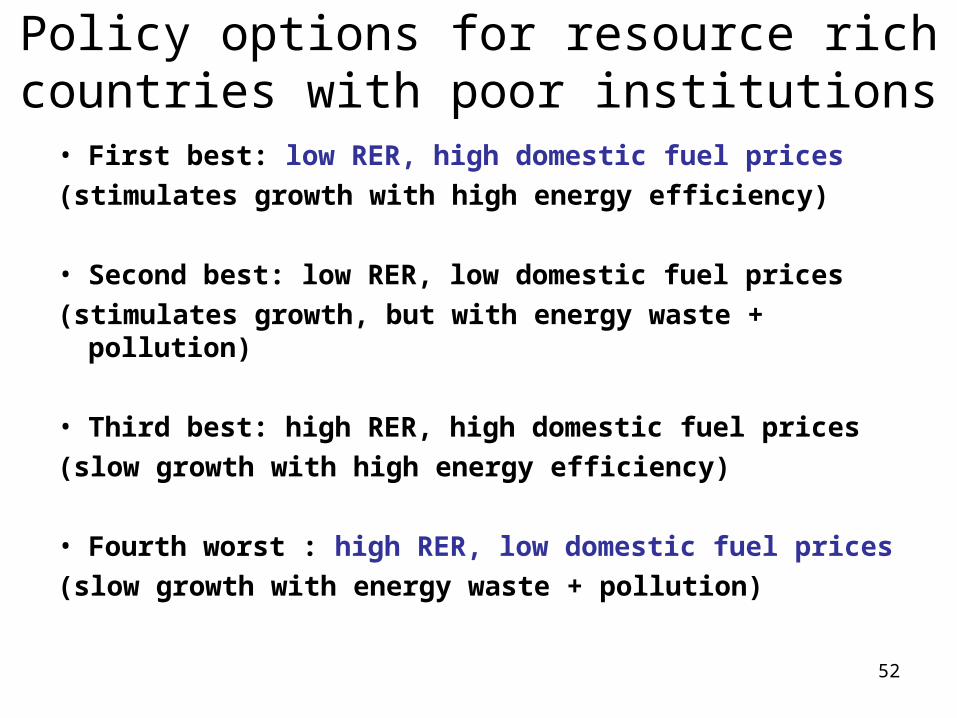
Policy options for resource rich countries with poor institutions
• First best: low RER, high domestic fuel prices
(stimulates growth with high energy efficiency)
• Second best: low RER, low domestic fuel prices
(stimulates growth, but with energy waste + pollution)
• Third best: high RER, high domestic fuel prices
(slow growth with high energy efficiency)
• Fourth worst : high RER, low domestic fuel prices
(slow growth with energy waste + pollution)

53
Conclusions for Russia
• Russia is a typical resource exporting country:– Low domestic fuel prices– High RER
• Needs to be the other way round:– High domestic fuel prices– Low RER

54
Domestic fuel and energy prices in $ terms
– much lower than world market prices
0
20
40
60
80
100
120
1995 1996 1997 1998 1999 2000 2001 2002 2003 2004
0
50
100
150
200
250
300
350
бен
зин
природный газ, за 1000 м3 электроэнергия, за 1000 квт/чнефть за 1 т бензин автомобильный за 1 т

55
RER in Russia in recent 15 years is more unstable than in China
Real exchange rate - effective (2000=100%, right scale) and to the US$ (ratio, %, left scale) in China and Russia, %
10%
20%
30%
40%
50%
60%
70%
80%
90%
1975
1977
1979
1981
1983
1985
1987
1989
1991
1993
1995
1997
1999
2001
0
50
100
150
200
250
300
350
China
Russia

56
RER in Russia is now higher than ever
Fig. 5. Real effective exchange rate, Dec. 1995=100%(left scale), and year end gross foreign exchange reserves, including gold, bln. $ (right log scale)
0
20
40
60
80
100
120
140
160
1991 1992 1993 1994 1995 1996 1997 1998 1999 2000 2001 2002 2003 2004 2005 2006 2007
1
10
100
1000
REER
FOREX

57
Fig. 1. Exchange rates of the ruble in real terms, 1992–2007, in percent of June 1992. Official exchange rates were deflated by the Consumer Price Index (CPI).
Sources: Calculated by S. Tabata (The Russian Stabilization Fund and Its Successor: Implications for Inflation, EURASIAN GEOGRAPHY AND ECONOMICS, 2008, No.1, p. 701).

58
Policy maneuver: possible, but requires good quality of
bureaucracy• Gradual increase in domestic fuel and energy
prices (via phasing out export tax + lifting access to pipeline restriction) to world level
• Higher taxes on fuel companies to capture windfall profits from increasing domestic fuel prices
• Spending increased budget revenues on infrastructure and non-tradables
• Lower RER (via accumulation of FOREX and import subsidies) to compensate losses of non-fuel industries from higher domestic fuel prices

59
Fuel production per capita, kg of oil equivalent, 2005

60
Oil prices (1869-2006)

61
Oil prices (1947-2006)

62
Major fuel exporters: inflation and institutions

63
Major fuel producers, 2001


