Editors: Ludo Cuyvers Wilma Viviers
Publishers: African Sun
Media 1
Background of the DSM research
• 2006 NWU, Univ of Antwerp and VU Brussels – research project on information needs of exporters
• Prof Cuyvers (UA) – Board of Directors of FIT (Flemish Investment and Trade: 1994 -): development of DSM
• Prof Viviers – research in international trade, SEDA trainer, ITRISA certificate etc..
• Viviers approached dti – DSM for SA – reasons: scarce resources, focused export promotion
• The DSM provides a focused approach to export promotion by identifying and prioritising export opportunities on a scientific basis
• 2007- 2011 DSM for SA – on SITC 4, HS 6 (twice)• Why this book on Export promotion and DSM – take stock of
developments of DSM since 1994 AND requests of dti, prov gov’t, export councils, etc
2
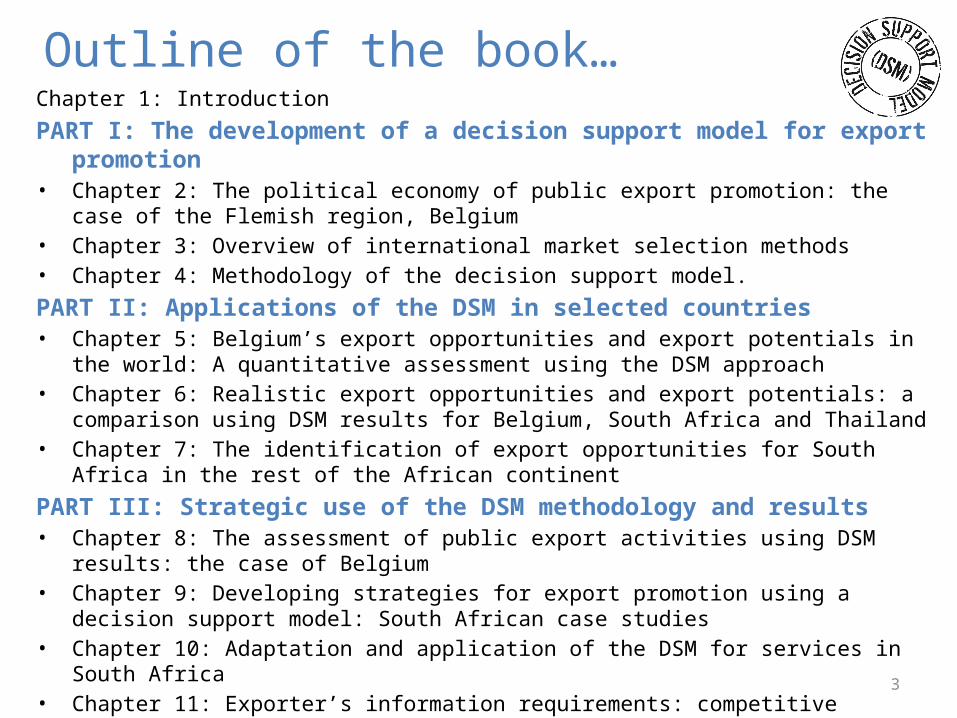
Outline of the book…Chapter 1: Introduction
PART I: The development of a decision support model for export promotion
• Chapter 2: The political economy of public export promotion: the case of the Flemish region, Belgium
• Chapter 3: Overview of international market selection methods• Chapter 4: Methodology of the decision support model.
PART II: Applications of the DSM in selected countries• Chapter 5: Belgium’s export opportunities and export potentials in the world: A
quantitative assessment using the DSM approach• Chapter 6: Realistic export opportunities and export potentials: a comparison
using DSM results for Belgium, South Africa and Thailand• Chapter 7: The identification of export opportunities for South Africa in the rest
of the African continent
PART III: Strategic use of the DSM methodology and results• Chapter 8: The assessment of public export activities using DSM results: the
case of Belgium• Chapter 9: Developing strategies for export promotion using a decision support
model: South African case studies• Chapter 10: Adaptation and application of the DSM for services in South Africa• Chapter 11: Exporter’s information requirements: competitive intelligence as an
export promotion instrument3
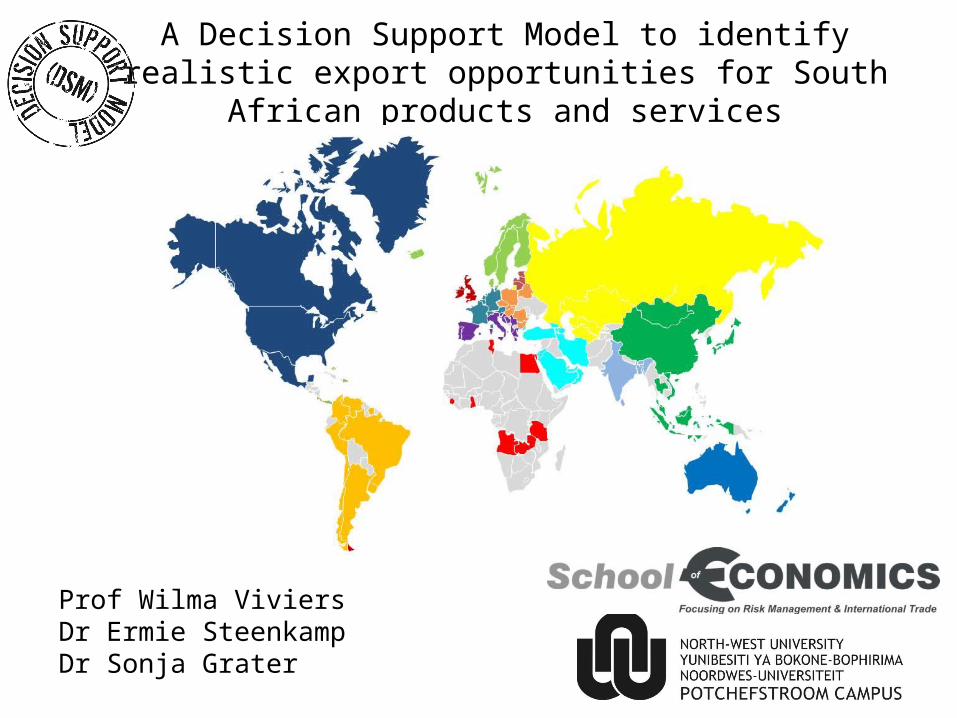
A Decision Support Model to identify realistic export opportunities for South African products
and services
Pr
Prof Wilma ViviersDr Ermie SteenkampDr Sonja Grater
Outline…
• Background• DSM Dashboard• Methodology• Results• Applications and work in progress
5
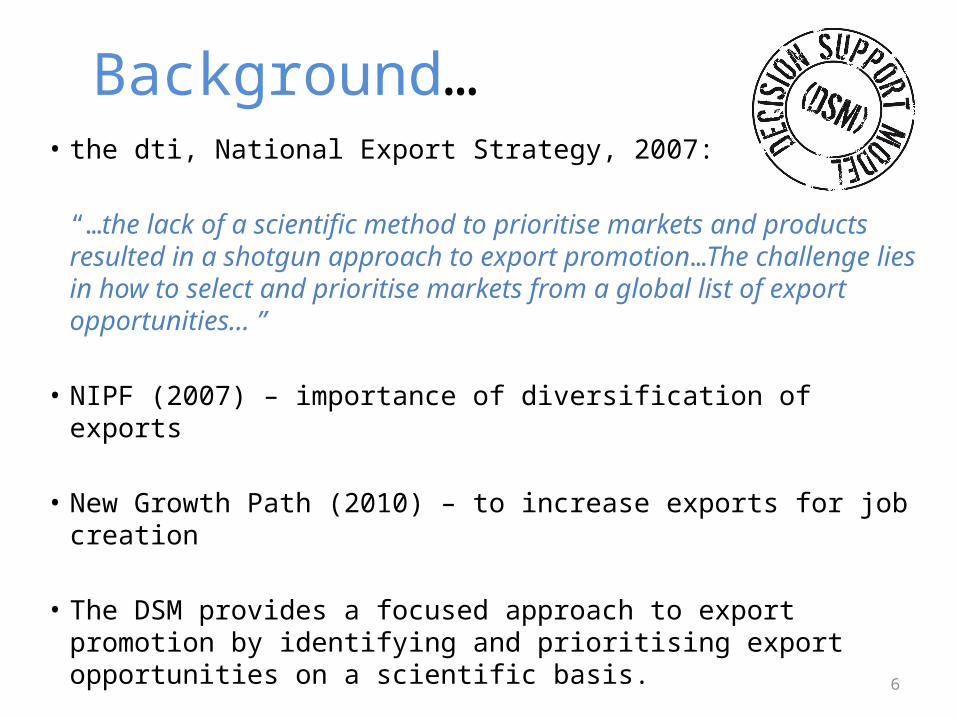
Background…• the dti, National Export Strategy, 2007:
“…the lack of a scientific method to prioritise markets and products resulted in a shotgun approach to export promotion…The challenge lies in how to select and prioritise markets from a global list of export opportunities... ”
• NIPF (2007) – importance of diversification of exports
• New Growth Path (2010) – to increase exports for job creation
• The DSM provides a focused approach to export promotion by identifying and prioritising export opportunities on a scientific basis.
6
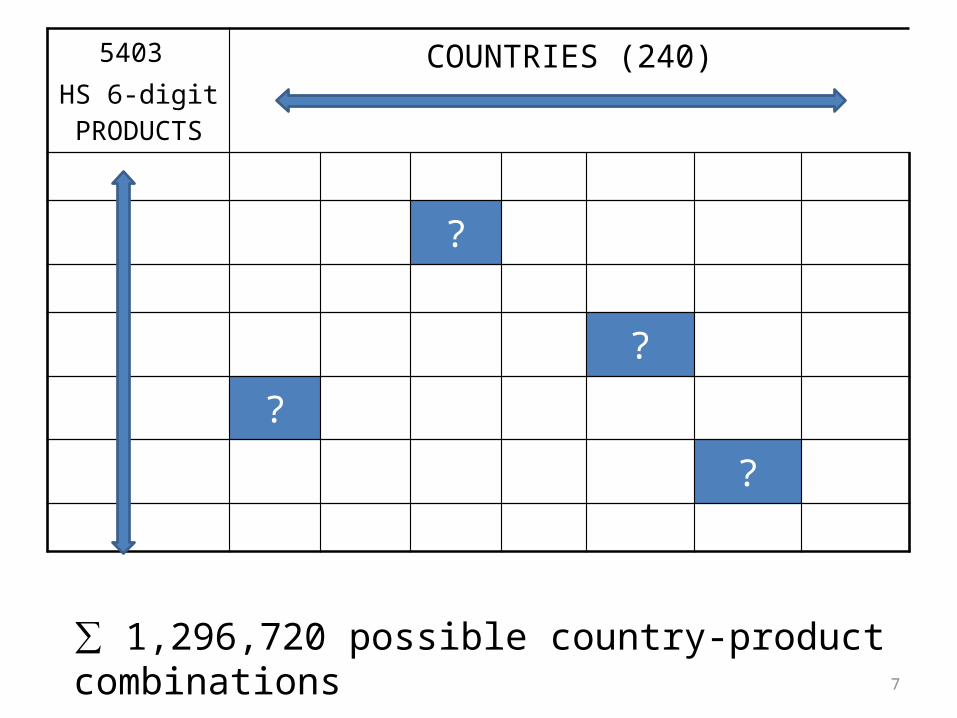
5403 HS 6-digit
PRODUCTS
COUNTRIES (240)
?
?
?
?
∑ 1,296,720 possible country-product combinations7
986 SITC 4-digit
PRODUCTS
COUNTRIES (240)
?
?
?
?
∑ 236 640 possible country-product combinations
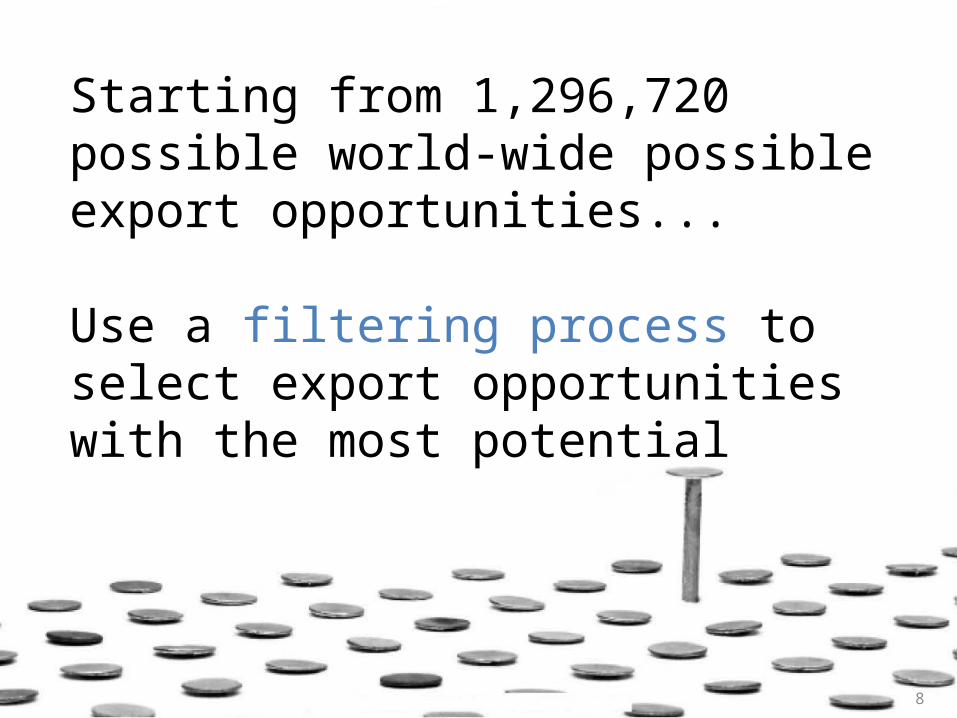
Starting from 1,296,720 possible world-wide possible export opportunities...
Use a filtering process to select export opportunities with the most potential
8
DSM methodology in a nutshell
The DSM uses a sequential filtering process (4 filters) that will eliminate less promising export opportunities
and focus on those countries and product-country combinations that
show the most potential
9
The DSM Dashboard…• Examples:– General DSM dashboard information– Product:• Oranges (HS 080510)• Automobiles (HS 870323)
10
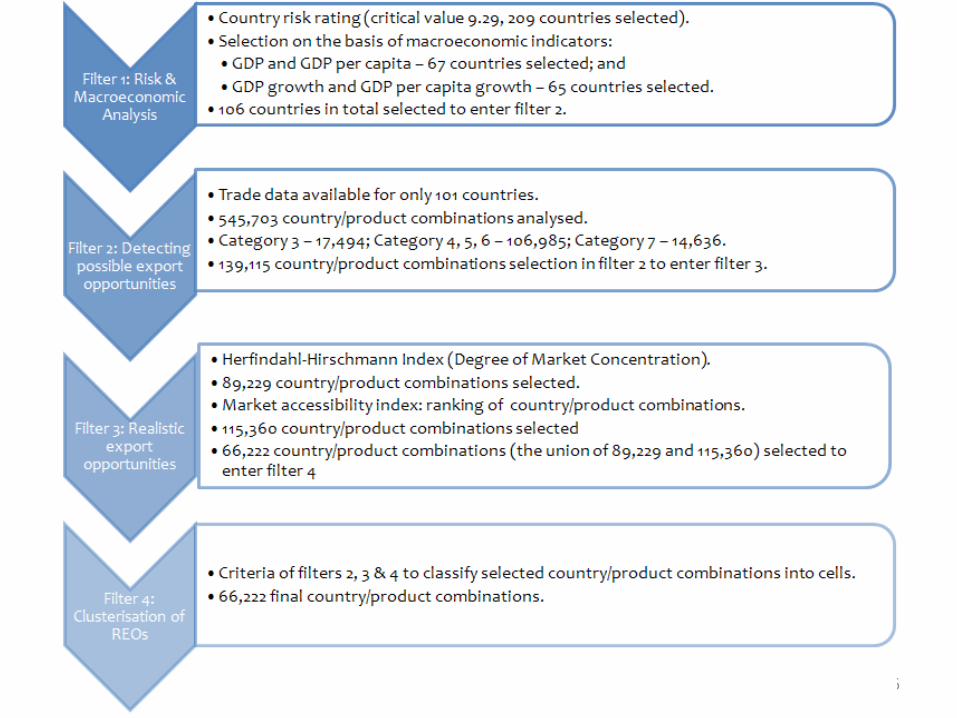
DSM methodology – Filtering process
Filter 1
Filter 2
Filter 3
Filter 4
11
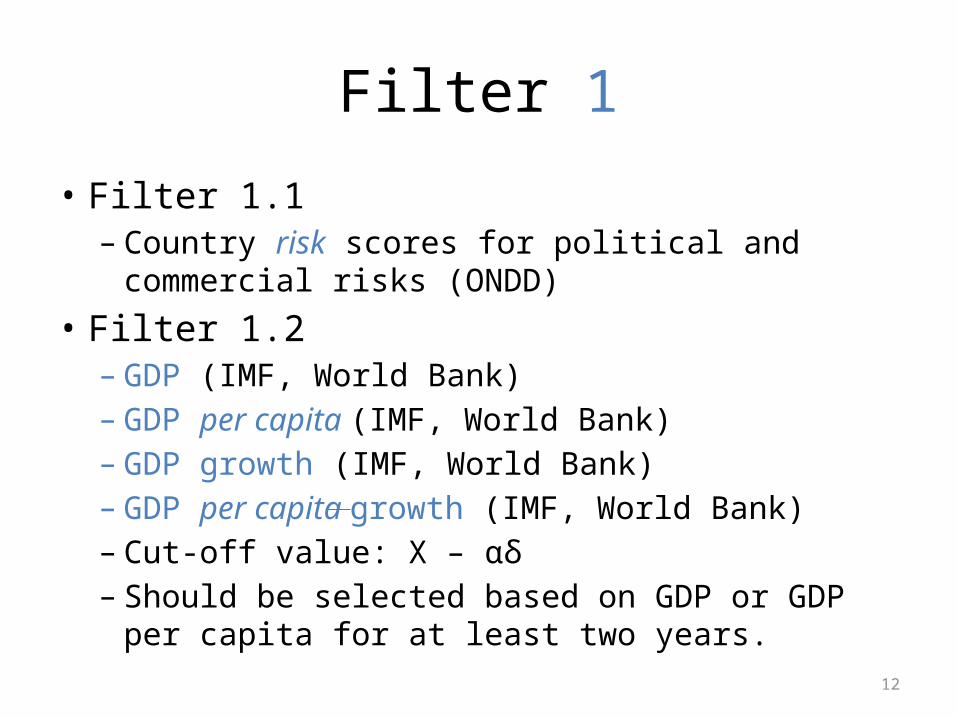
Filter 1
• Filter 1.1– Country risk scores for political and commercial risks
(ONDD)• Filter 1.2– GDP (IMF, World Bank)– GDP per capita (IMF, World Bank)– GDP growth (IMF, World Bank)– GDP per capita growth (IMF, World Bank)– Cut-off value: X – αδ– Should be selected based on GDP or GDP per capita for at
least two years.12
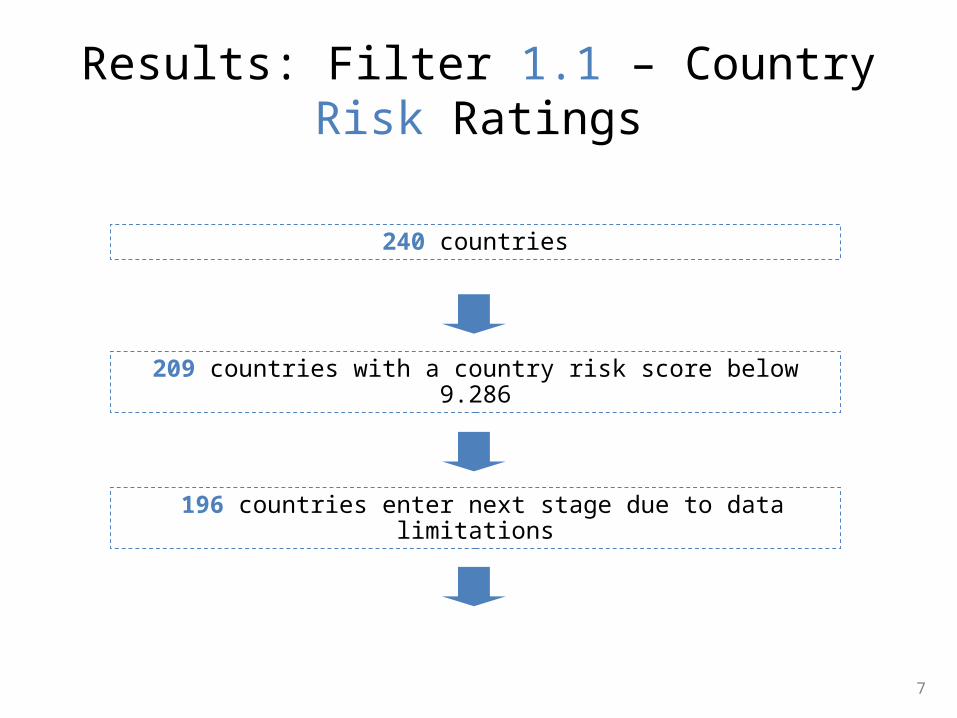
240 countries
209 countries with a country risk score below 9.286
196 countries enter next stage due to data limitations
Results: Filter 1.1 – Country Risk Ratings
7
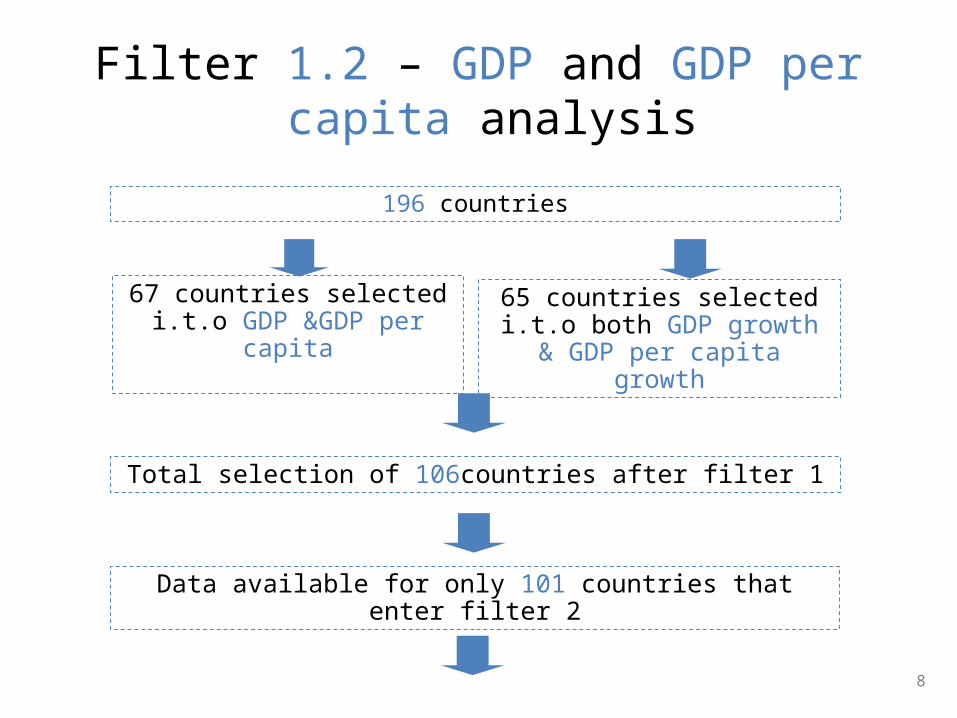
196 countries
65 countries selected i.t.o both GDP growth & GDP
per capita growth
Total selection of 106countries after filter 1
Data available for only 101 countries that enter filter 2
Filter 1.2 – GDP and GDP per capita analysis
67 countries selected i.t.o GDP &GDP per capita
8
the filtering process
Filter 1
Filter 2
Filter 3
Filter 4
15
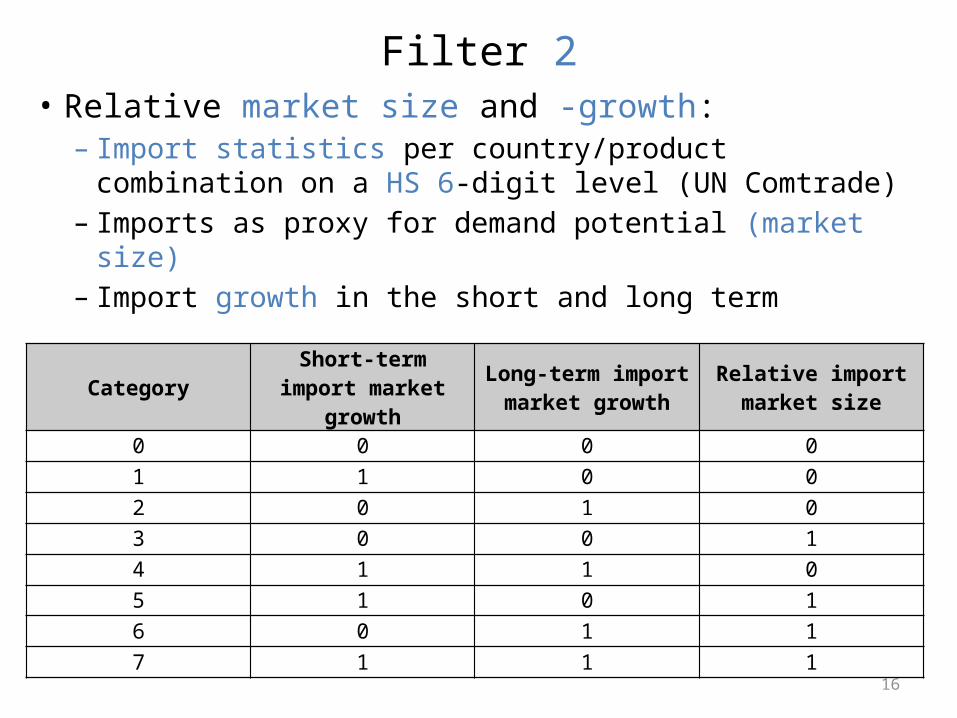
Filter 2• Relative market size and -growth:– Import statistics per country/product combination on
a HS 6-digit level (UN Comtrade)– Imports as proxy for demand potential (market size)– Import growth in the short and long term
16
Category Short-term import market growth
Long-term import market growth
Relative import market size
0 0 0 0
1 1 0 0
2 0 1 0
3 0 0 1
4 1 1 0
5 1 0 1
6 0 1 1
7 1 1 1
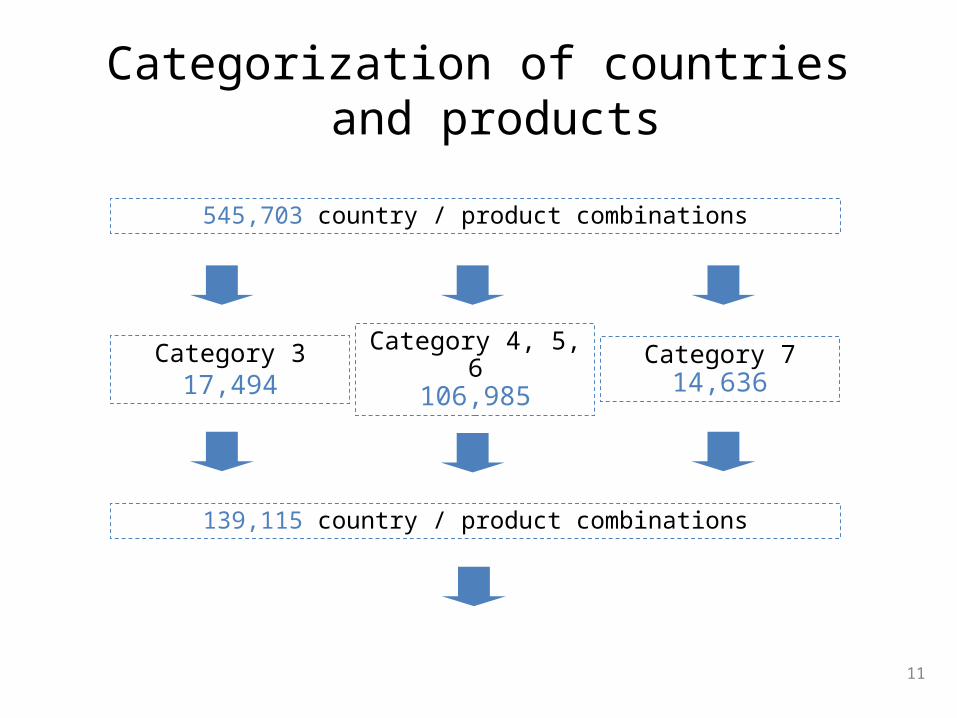
545,703 country / product combinations
Category 317,494
139,115 country / product combinations
Category 4, 5, 6106,985
Category 714,636
Categorization of countries and products
11
the filtering process
Filter 1
Filter 2
Filter 3
Filter 4
18
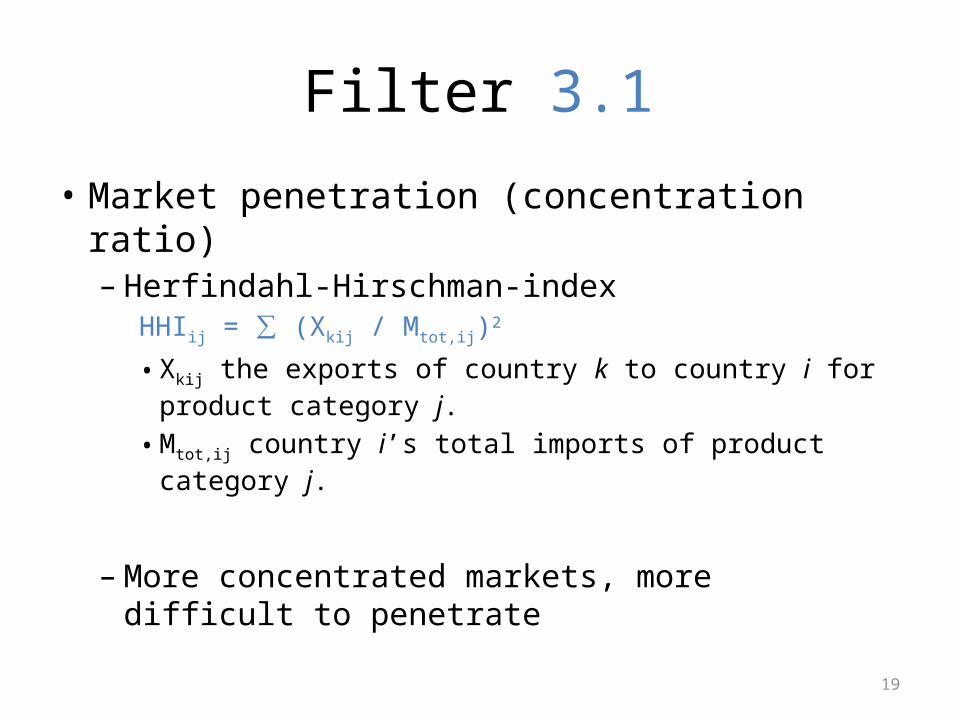
Filter 3.1
• Market penetration (concentration ratio)– Herfindahl-Hirschman-index
HHIij = ∑ (Xkij / Mtot,ij)2
• Xkij the exports of country k to country i for product category j. • Mtot,ij country i’s total imports of product category j.
– More concentrated markets, more difficult to penetrate
19
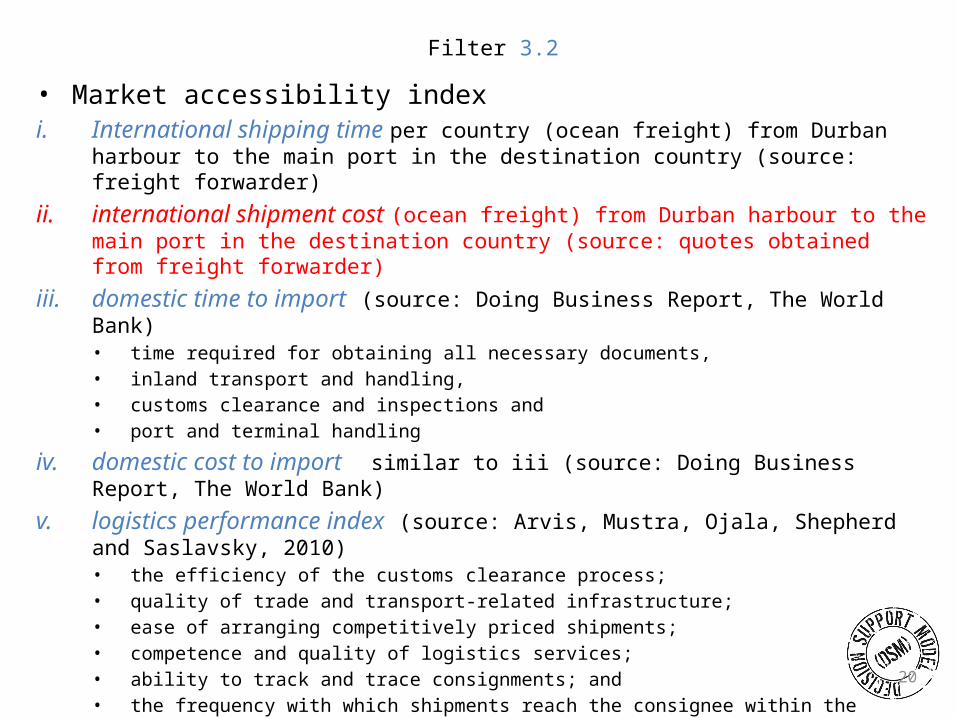
Filter 3.2
• Market accessibility indexi. International shipping time per country (ocean freight) from Durban harbour to the main port
in the destination country (source: freight forwarder)
ii. international shipment cost (ocean freight) from Durban harbour to the main port in the destination country (source: quotes obtained from freight forwarder)
iii. domestic time to import (source: Doing Business Report, The World Bank) • time required for obtaining all necessary documents, • inland transport and handling, • customs clearance and inspections and • port and terminal handling
iv. domestic cost to import similar to iii (source: Doing Business Report, The World Bank)
v. logistics performance index (source: Arvis, Mustra, Ojala, Shepherd and Saslavsky, 2010)• the efficiency of the customs clearance process; • quality of trade and transport-related infrastructure; • ease of arranging competitively priced shipments; • competence and quality of logistics services; • ability to track and trace consignments; and • the frequency with which shipments reach the consignee within the scheduled or expected time
vi. ad valorem equivalent tariffs per product-country combination (source: UN Comtrade )
vii. Ad valorem equivalent NTB per product (source: Kee, Nicita and Olarreaga, World Bank)
20
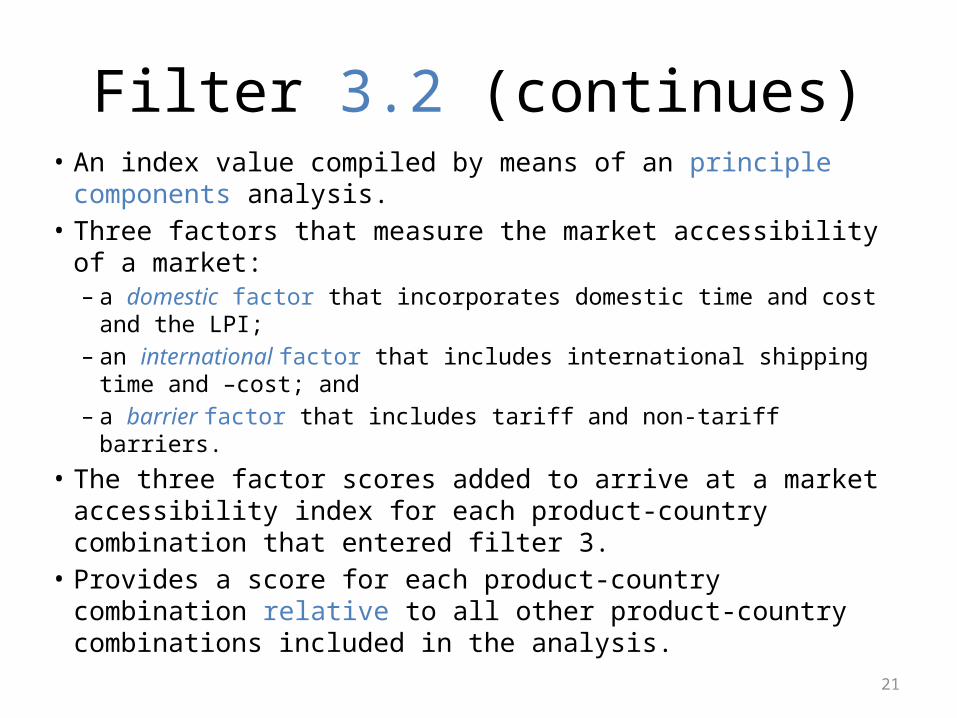
Filter 3.2 (continues)• An index value compiled by means of an principle components
analysis. • Three factors that measure the market accessibility of a market:
– a domestic factor that incorporates domestic time and cost and the LPI;
– an international factor that includes international shipping time and –cost; and
– a barrier factor that includes tariff and non-tariff barriers. • The three factor scores added to arrive at a market accessibility
index for each product-country combination that entered filter 3.
• Provides a score for each product-country combination relative to all other product-country combinations included in the analysis.
21
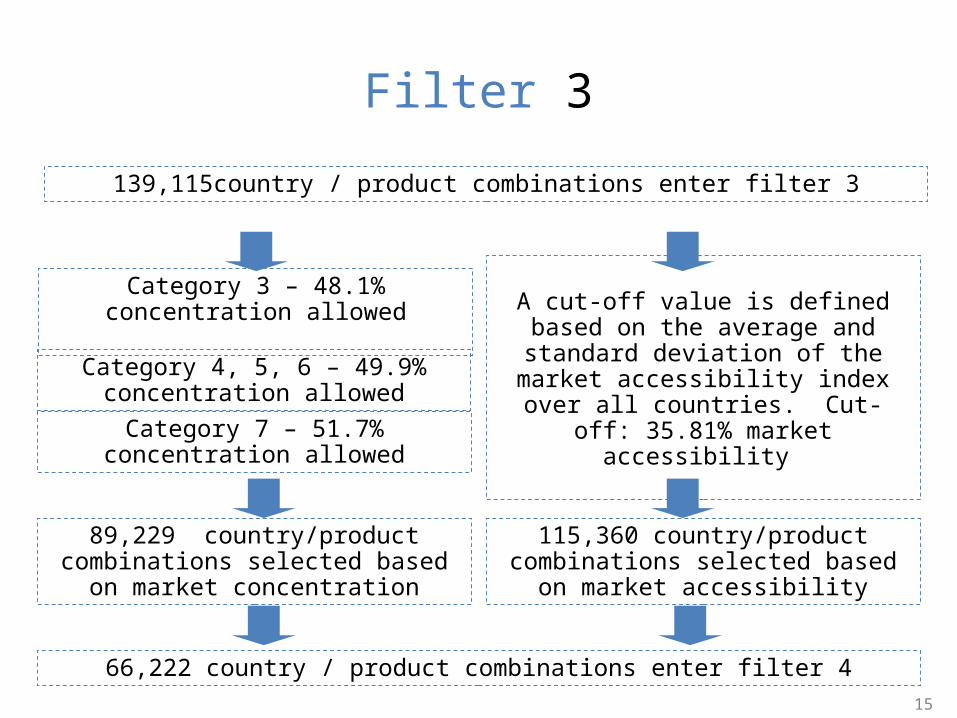
Category 3 – 48.1% concentration allowed
Category 4, 5, 6 – 49.9% concentration allowed
Category 7 – 51.7% concentration allowed
139,115country / product combinations enter filter 3
66,222 country / product combinations enter filter 4
Filter 3
89,229 country/product combinations selected based on
market concentration
115,360 country/product combinations selected based on
market accessibility
A cut-off value is defined based on the average and standard
deviation of the market accessibility index over all
countries. Cut-off: 35.81% market accessibility
15
the filtering process
Filter 1
Filter 2
Filter 3
Filter 4
23
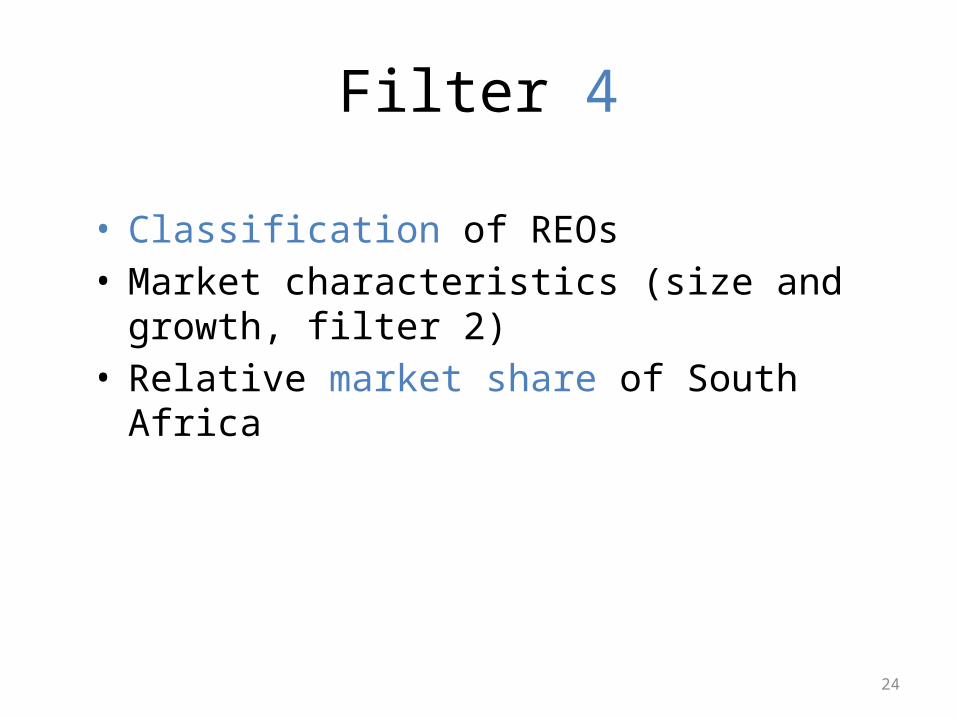
Filter 4
• Classification of REOs• Market characteristics (size and growth, filter 2)• Relative market share of South Africa
24
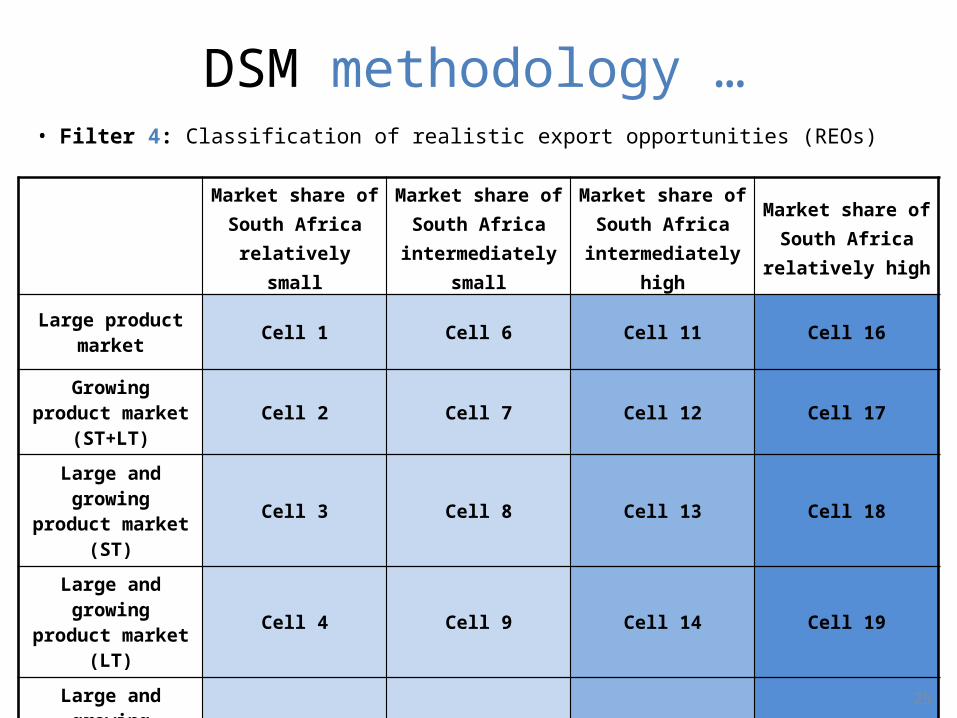
• Filter 4: Classification of realistic export opportunities (REOs)
Market share of South Africa
relatively small
Market share of South Africa
intermediately small
Market share of South Africa
intermediately high
Market share of South Africa
relatively high
Large product market
Cell 1 Cell 6 Cell 11 Cell 16
Growing product market
(ST+LT)Cell 2 Cell 7 Cell 12 Cell 17
Large and growing
product market (ST)
Cell 3 Cell 8 Cell 13 Cell 18
Large and growing
product market (LT)
Cell 4 Cell 9 Cell 14 Cell 19
Large and growing
product market (ST+LT)
Cell 5 Cell 10 Cell 15 Cell 20
25
DSM methodology …
26
DSM results…
27
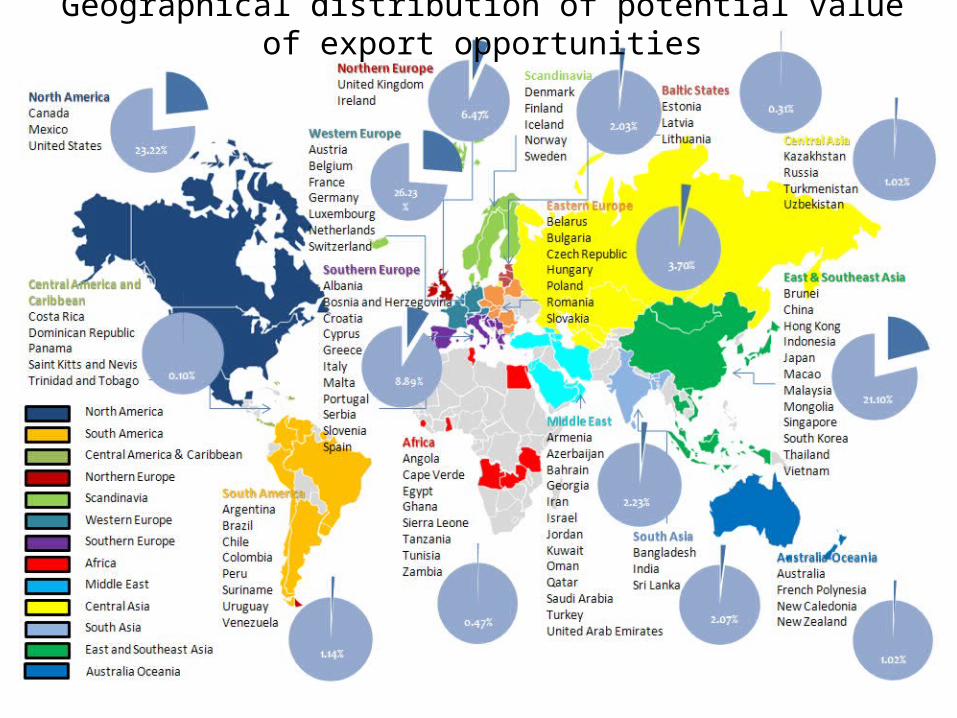
Geographical distribution of potential value of export opportunities
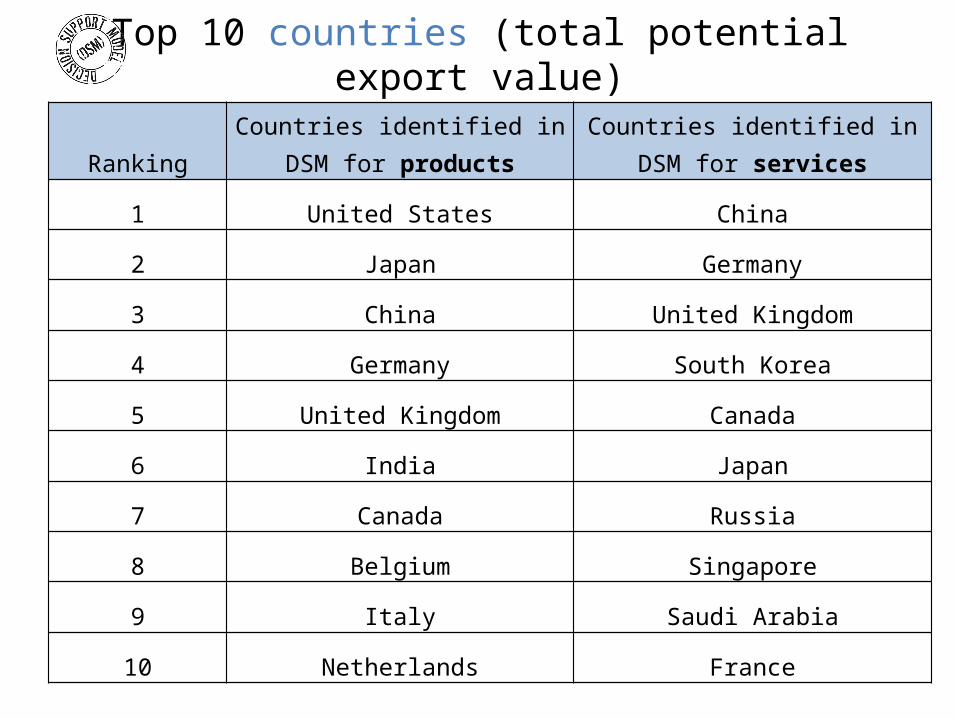
Top 10 countries (total potential export value)
RankingCountries identified in DSM for
productsCountries identified in DSM for
services
1 United States China
2 Japan Germany
3 China United Kingdom
4 Germany South Korea
5 United Kingdom Canada
6 India Japan
7 Canada Russia
8 Belgium Singapore
9 Italy Saudi Arabia
10 Netherlands France
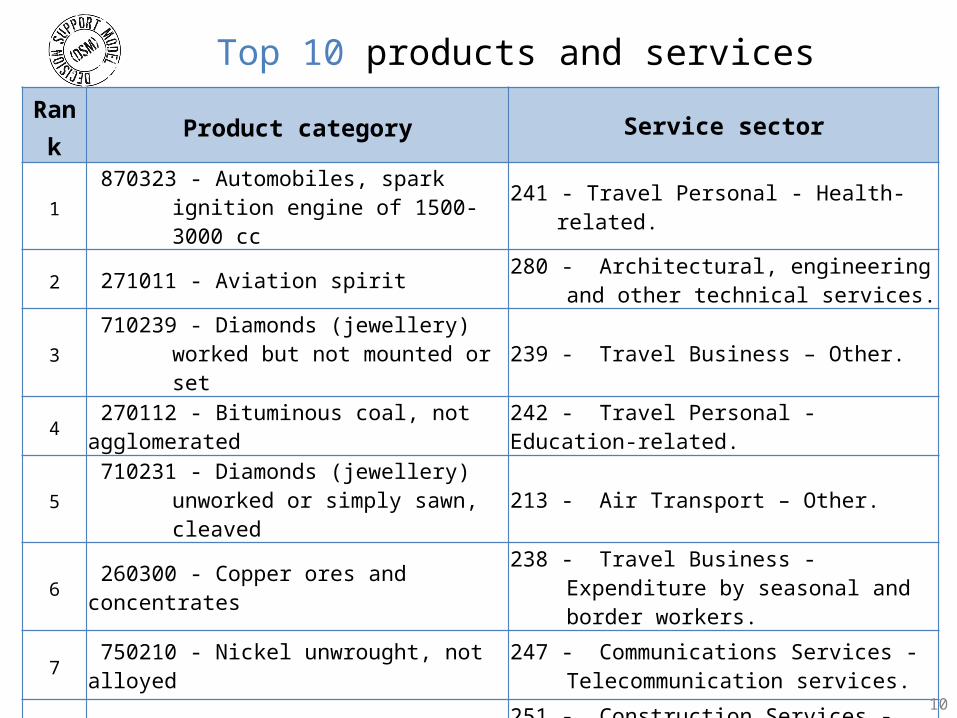
Top 10 products and services
Rank Product category Service sector
1 870323 - Automobiles, spark ignition engine of 1500-3000 cc 241 - Travel Personal - Health-related.
2 271011 - Aviation spirit 280 - Architectural, engineering and other technical services.
3 710239 - Diamonds (jewellery) worked but not mounted or set 239 - Travel Business – Other.
4 270112 - Bituminous coal, not agglomerated 242 - Travel Personal - Education-related.
5 710231 - Diamonds (jewellery) unworked or simply sawn, cleaved 213 - Air Transport – Other.
6 260300 - Copper ores and concentrates 238 - Travel Business - Expenditure by seasonal and border workers.
7 750210 - Nickel unwrought, not alloyed 247 - Communications Services - Telecommunication services.
8 760110 - Aluminium unwrought, not alloyed 251 - Construction Services - Construction in the compiling economy.
9 711011 - Platinum unwrought or in powder form 260 - Financial services.
10 940190 - Parts of seats 275 - Legal services.
10
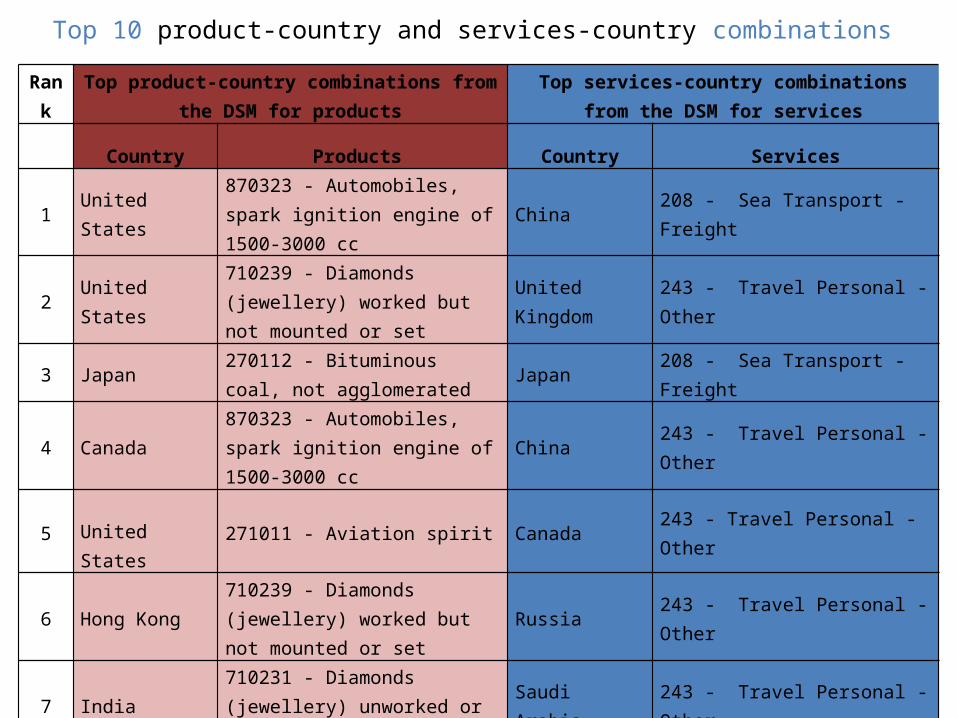
Top 10 product-country and services-country combinations
RankTop product-country combinations from the DSM for
productsTop services-country combinations from the DSM for
services
Country Products Country Services
1 United States 870323 - Automobiles, spark ignition engine of 1500-3000 cc China 208 - Sea Transport - Freight
2 United States 710239 - Diamonds (jewellery) worked but not mounted or set United Kingdom 243 - Travel Personal - Other
3 Japan 270112 - Bituminous coal, not agglomerated Japan 208 - Sea Transport - Freight
4 Canada 870323 - Automobiles, spark ignition engine of 1500-3000 cc China 243 - Travel Personal - Other
5 United States 271011 - Aviation spirit Canada 243 - Travel Personal - Other
6 Hong Kong 710239 - Diamonds (jewellery) worked but not mounted or set Russia 243 - Travel Personal - Other
7 India 710231 - Diamonds (jewellery) unworked or simply sawn, cleaved Saudi Arabia 243 - Travel Personal - Other
8 Japan 260300 - Copper ores and concentrates Germany 243 - Travel Personal - Other
9 United Kingdom 270799 - Coal tar distillation products Romania 243 - Travel Personal - Other
10 United States 940190 - Parts of seats France 243 - Travel Personal - Other
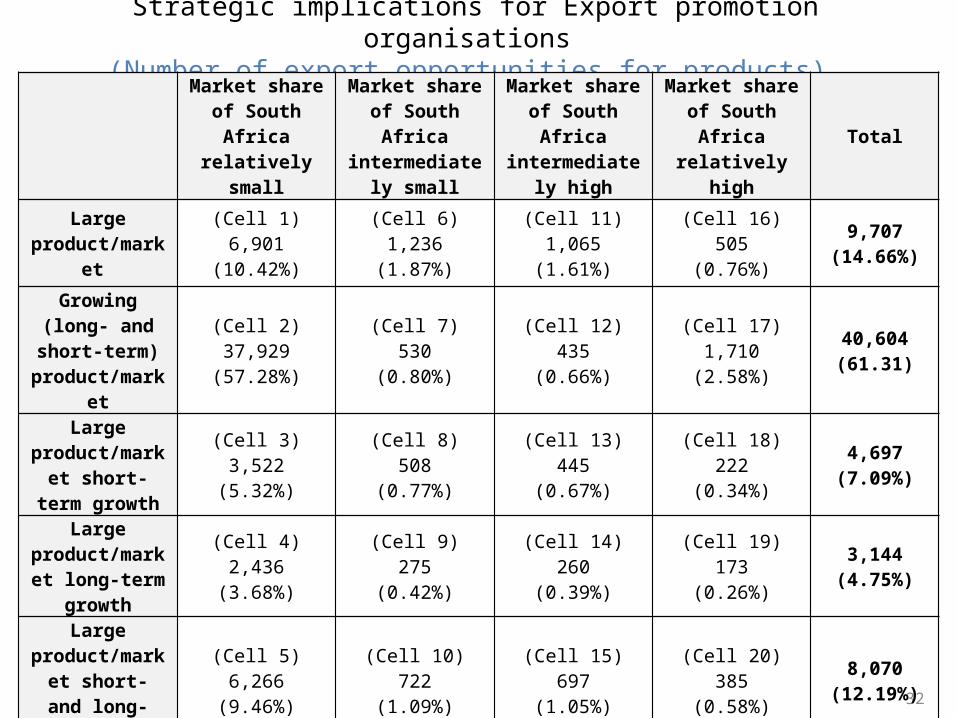
Strategic implications for Export promotion organisations (Number of export opportunities for products)
32
Market share of South
Africa relatively
small
Market share of South
Africa intermediatel
y small
Market share of South
Africa intermediatel
y high
Market share of South
Africa relatively
high
Total
Large product/mark
et
(Cell 1)6,901
(10.42%)
(Cell 6)1,236
(1.87%)
(Cell 11)1,065
(1.61%)
(Cell 16)505
(0.76%)
9,707(14.66%)
Growing (long- and
short-term) product/mark
et
(Cell 2)37,929
(57.28%)
(Cell 7)530
(0.80%)
(Cell 12)435
(0.66%)
(Cell 17)1,710
(2.58%)
40,604(61.31)
Large product/market short-term
growth
(Cell 3)3,522
(5.32%)
(Cell 8)508
(0.77%)
(Cell 13)445
(0.67%)
(Cell 18)222
(0.34%)
4,697(7.09%)
Large product/market long-term
growth
(Cell 4)2,436
(3.68%)
(Cell 9)275
(0.42%)
(Cell 14)260
(0.39%)
(Cell 19)173
(0.26%)
3,144(4.75%)
Large product/market short- and
long-term growth
(Cell 5)6,266
(9.46%)
(Cell 10)722
(1.09%)
(Cell 15)697
(1.05%)
(Cell 20)385
(0.58%)
8,070(12.19%)
Total57,054
(86.16%)3,271
(4.94%)2,902
(4.38%)2,995
(4.52%)66,222(100%)
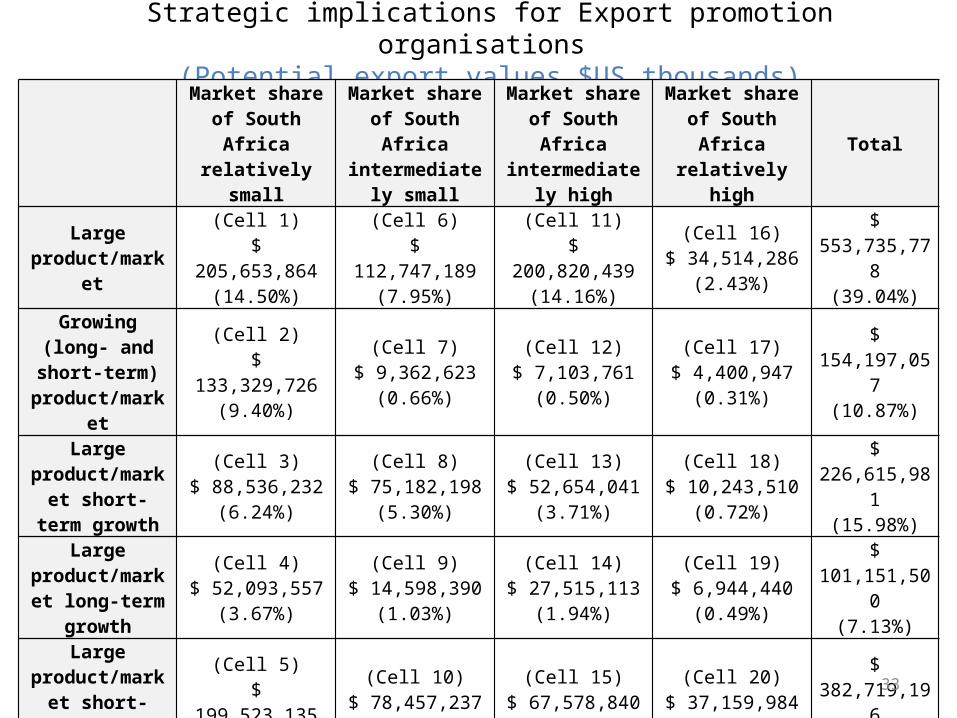
Strategic implications for Export promotion organisations (Potential export values $US thousands)
Market share of South
Africa relatively
small
Market share of South
Africa intermediatel
y small
Market share of South
Africa intermediatel
y high
Market share of South
Africa relatively
high
Total
Large product/mark
et
(Cell 1)$ 205,653,864
(14.50%)
(Cell 6)$ 112,747,189
(7.95%)
(Cell 11)$ 200,820,439
(14.16%)
(Cell 16)$ 34,514,286
(2.43%)
$ 553,735,77
8(39.04%)
Growing (long- and
short-term) product/mark
et
(Cell 2)$ 133,329,726
(9.40%)
(Cell 7)$ 9,362,623
(0.66%)
(Cell 12)$ 7,103,761
(0.50%)
(Cell 17)$ 4,400,947
(0.31%)
$ 154,197,05
7(10.87%)
Large product/market short-term
growth
(Cell 3)$ 88,536,232
(6.24%)
(Cell 8)$ 75,182,198
(5.30%)
(Cell 13)$ 52,654,041
(3.71%)
(Cell 18)$ 10,243,510
(0.72%)
$ 226,615,98
1(15.98%)
Large product/market long-term
growth
(Cell 4)$ 52,093,557
(3.67%)
(Cell 9)$ 14,598,390
(1.03%)
(Cell 14)$ 27,515,113
(1.94%)
(Cell 19)$ 6,944,440
(0.49%)
$ 101,151,50
0(7.13%)
Large product/market short- and
long-term growth
(Cell 5)$ 199,523,135
(14.07%)
(Cell 10)$ 78,457,237
(5.53%)
(Cell 15)$ 67,578,840
(4.76%)
(Cell 20)$ 37,159,984
(2.62%)
$ 382,719,19
6(26.98%)
Total$ 679,136,514
(47.88%)$ 290,347,637
(20.47%)$ 355,672,194
(25.08%)$ 93,263,167
(6.58%)
$ 1,418,419,
512(100%)
33
Applications of the DSM and work in progress
• New research unit: TRADE (Trade and Development) – June 2012• Rerun of DSM for South Africa to the rest of the world and Africa• Linking DSM export opportunities with provincial production
and IPAP 2 clusters and impact on employment.• Firm-level survey on exporters
– Production, sales and export, export destinations, employment, investment, capital and labour inputs, productivity, etc.
• In-depth market studies on selected realistic export opportunities– Examples: dried apricots, red meat, macadamia nuts to Germany,
extruders to Tunisia.
34
Other publications on DSM methodology and South Africa results
• STEENKAMP, E.A., ROSSOUW, R., VIVIERS, W. & CUYVERS, L. 2009. Export market selection methods and the identification of realistic export opportunities for South Africa using a decision support model. http://www.sadctrade.org/node/281. Date of access: 17 Dec. 2009.
• VIVIERS, W., STEENKAMP, E.A. & ROSSOUW, R. 2010. Identification of realistic export opportunities for South Africa: application of a decision support model (DSM) using HS 6-digit level product data: report prepared for the Department of Trade and Industry, South Africa, September. 57p.
• PEARSON, J.J.A., VIVIERS, W., CUYVERS, L. & NAUDE, W. 2010. Identifying Export Opportunities for South Africa in the Southern Engines: A DSM Approach. International Business Review 19(4): 345-359, August.
• GRATER, S., STEENKAMP, E.A. & VIVIERS, W. 2011. Identification and comparison of export opportunities for South African products and services. In Dumont, M. & Rayp, G. (eds). 2011. International Business. Garant Publishers: Antwerp, Belgium.
35