
OECD Indicators 2017
Global webinar
Education at a Glance

The demand for education is growing

Tertiary education is becoming the normFigure A1.2
Educational attainment of 25-34 year-olds (2016)
0
10
20
30
40
50
60
70
80
90
100
Kore
aCanada
Russ
ian…
Lith
uania
Irela
nd
United K
ingdom
Luxe
mbourg
Aust
ralia
Sw
itze
rland
Norw
ay
United S
tate
sIsra
el
Sw
eden
Denm
ark
Neth
erlands
Belg
ium
France
Pola
nd
New
Zeala
nd
Icela
nd
Slo
venia
OECD
ave
rage
Latv
iaFi
nla
nd
Est
onia
EU
22 a
vera
ge
Spain
Gre
ece
Aust
ria
Portugal
Slo
vak
Republic
Cze
ch R
epublic
Germ
any
Turk
ey
Hungary
Chile
Cost
a R
ica
Colo
mbia
Saudi Ara
bia
Italy
Mexi
coArg
entina
Chin
aBra
zil
India
Indonesia
South
Afric
a
Below upper secondary education Upper secondary or post-secondary non-tertiary education Tertiary education
%
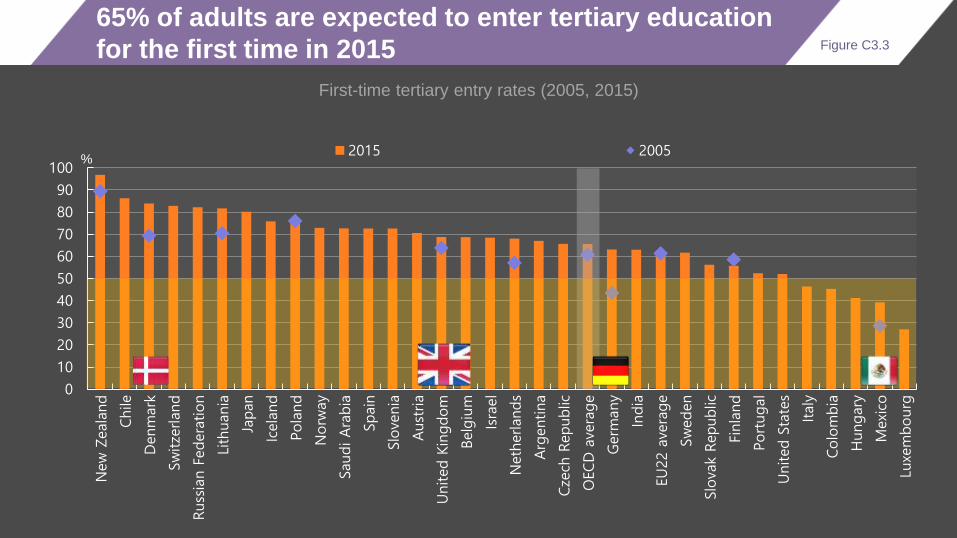
65% of adults are expected to enter tertiary education
for the first time in 2015 Figure C3.3
First-time tertiary entry rates (2005, 2015)
0
10
20
30
40
50
60
70
80
90
100
New
Zeala
nd
Chile
Denm
ark
Sw
itze
rland
Russ
ian F
edera
tion
Lith
uania
Japan
Icela
nd
Pola
nd
Norw
ay
Saudi Ara
bia
Spain
Slo
venia
Aust
ria
United K
ingdom
Belg
ium
Isra
el
Neth
erlands
Arg
entina
Cze
ch R
epublic
OECD
ave
rage
Germ
any
India
EU
22 a
vera
ge
Sw
eden
Slo
vak R
epublic
Finla
nd
Portugal
United S
tate
s
Italy
Colo
mbia
Hungary
Mexi
co
Luxe
mbourg
2015 2005%

New entrants by STEM field of studyFigure C3.1
Distribution of new entrants to tertiary education, by STEM field of study (2015)
0
5
10
15
20
25
30
35
40
Ge
rma
ny
Esto
nia
Fin
land
Me
xic
o
Slo
ve
nia
Au
str
ia
Ru
ssia
n F
ed
era
tion
Ko
rea
Isra
el
Cze
ch R
epu
blic
India
Sw
ede
n
Un
ite
d K
ingd
om
Lith
ua
nia
Co
lom
bia
Indo
ne
sia
Po
land
Ire
land
Latv
ia
EU
22 a
vera
ge
Ch
ile
OE
CD
avera
ge
Sw
itze
rlan
d
Ne
w Z
ea
lan
d
Sp
ain
Po
rtu
ga
l
Slo
va
k R
ep
ub
lic
Hu
ng
ary
Ice
land
No
rway
Ja
pa
n
De
nm
ark
Be
lgiu
m
Luxe
mb
ou
rg
Neth
erlands
Turk
ey
Information and communication technologies Natural sciences, mathematics and statistics
Engineering, manufacturing and construction%

Share of female entrants to STEM fields of tertiary
education (2015) Figure C3.1
Share of new female entrants to STEM fields of tertiary education (2015)
0
10
20
30
40
50
60
70
80
90
100
India
United K
ingdom
Icela
nd
New
Zeala
nd
Pola
nd
Portugal
Denm
ark
Cze
ch R
epublic
Est
onia
Sw
eden
Slo
vak
Republic
Isra
el
Colo
mbia
EU
22 a
vera
ge
OECD
ave
rage
Irela
nd
Mexi
co
Hungary
Slo
venia
Norw
ay
Aust
ria
Turk
ey
Germ
any
Spain
Neth
erlands
Kore
a
Lith
uania
Latv
ia
Sw
itze
rland
Indonesia
Finla
nd
Luxe
mbourg
Belg
ium
Chile
Japan
Share of male entrants Share of female entrants%
In many countries more 15-year-old students expect a career in science than actually enter into science-
related studies (C3.a)

Most will graduate with a bachelor’s degreeFigure A3.2
Distribution of first-time tertiary graduates by level of education (2015)
0%
10%
20%
30%
40%
50%
60%
70%
80%
90%
100%
Sw
itze
rland
Lith
uania
Slo
vak R
epublic
Mexi
co
Neth
erlands
Finla
nd
Cze
ch R
epublic
Portugal
United K
ingdom
Hungary
Germ
any
Norw
ay
Italy
Denm
ark
Aust
ralia
EU
22 a
vera
ge
OECD
ave
rage
Slo
venia
Latv
ia
New
Zeala
nd
Japan
Sw
eden
Turk
ey
United S
tate
s
Chile
Spain
Luxe
mbourg
Aust
ria
Russ
ian F
edera
tion
Bachelor’s or equivalent Master’s or equivalent Short-cycle tertiary (2-3 years)

Adults with tertiary-educated parents are twice more
likely to reach that level themselves than those without Figure A4.3
Share of 30-44 year-olds who completed tertiary-type A or an advanced research programme, by parents' educational attainment (2012 or 2015)
0
10
20
30
40
50
60
70
80
90
Italy
Slo
vak R
epublic
Pola
nd
Turk
ey
France
Sin
gapore
Cze
ch R
epublic
Gre
ece
Spain
Northern
Ire
land
Engla
nd
Isra
el
United S
tate
s
Chile
Irela
nd
Aust
ralia
Lith
uania
Ave
rage
Russ
ian F
edera
tion
Neth
erlands
Canada
Kore
a
Norw
ay
Slo
venia
Flem
ish C
om
.
Germ
any
New
Zeala
nd
Est
onia
Japan
Finla
nd
Sw
eden
Denm
ark
Aust
ria
%At least one parent has attained tertiary education Both parents have less than tertiary educational attainment

Adults with higher educational attainment have
better economic outcomes

Tertiary graduates are more likely to be employed…Figure A5.3
Employment rates of 25-34 year-olds, by educational attainment and programme orientation (2016)
40
50
60
70
80
90
100
Lith
uania
Icela
nd
Neth
erlands
Luxe
mbourg
Sw
itze
rland
Arg
entina
Aust
ria
Pola
nd
Russ
ian F
edera
tion
Latv
iaGerm
any
United K
ingdom
Belg
ium
Norw
ay
Sw
eden
Isra
el
New
Zeala
nd
Bra
zil
France
Japan
Canada
Chile
Aust
ralia
United S
tate
sIrela
nd
Indonesia
OECD
ave
rage
Denm
ark
Hungary
EU22 a
vera
ge
Portugal
Colo
mbia
Slo
venia
Est
onia
Cost
a R
ica
Finla
nd
Mexi
coSouth
Afric
aCze
ch R
epublic
Slo
vak
Republic
Spain
Kore
aTurk
ey
Gre
ece
Italy
Saudi Ara
bia
Below upper secondary Vocational General or no distinction Tertiary%
Employment rates for young adults with tertiary degrees have returned to pre-crisis levels, which is not true for
people without upper secondary qualifications

Tertiary graduates earn on average 56% more than
those with upper secondary level attainment Figure A6.1
Relative earnings of adults, by educational attainment. Upper secondary education = 100 (2015)
50
75
100
125
150
175
200
225
250
Sw
eden
Est
onia
Norw
ay
Denm
ark
Finla
nd
Gre
ece
Belg
ium
New
Zeala
nd
Aust
ralia
Kore
a
Italy
Canada
Latv
ia
Neth
erlands
Sw
itze
rland
Japan
Spain
United K
ingdom
Aust
ria
France
OECD
ave
rage
Luxe
mbourg
Isra
el
Pola
nd
Irela
nd
Germ
any
Turk
ey
Portugal
Cze
ch R
epublic
Slo
vak R
epublic
Slo
venia
United S
tate
s
Lith
uania
Hungary
Mexi
co
Cost
a R
ica
Colo
mbia
Chile
Bra
zil
Earning advantage of adults with tertiary education
Earning disadvantage of adults with below upper secondary educationIndex
The earnings advantage from attaining at least a master’s degree is lower in the United Kingdom than the OECD average, while attaining a bachelor’s degree is slightly more advantageous. Those who had a master’s or more earned 81% more than upper secondary graduates, 17 percentage points below the OECD average. Among those with a bachelor’s degree, earnings were 51% higher, compared to the OECD average of 46%.

Most countries have levelled up resources,
often faster than enrolment

Between 2010 and 2014, expenditure on tertiary
institutions increased twice as fast as enrolments… Table B1.3
Index of change in expenditure (current prices) and number of students in tertiary institutions for all services (2010 to 2014)
80
90
100
110
120
130
140
150
160
Turk
ey
Est
onia
Slo
vak R
epublic
Aust
ralia
Chile
Icela
nd
Latv
ia
Mexi
co
Isra
el
OECD
ave
rage
Norw
ay
Belg
ium
Germ
any
Neth
erlands
Sw
eden
Cze
ch R
epublic
United S
tate
s
Kore
a
Japan
France
Canada
EU
22 a
vera
ge
Pola
nd
Italy
Denm
ark
Finla
nd
Spain
Portugal
Slo
venia
Hungary
Irela
nd
Change in expenditure Change in the number of studentsGDP deflator 2010 = 100
230
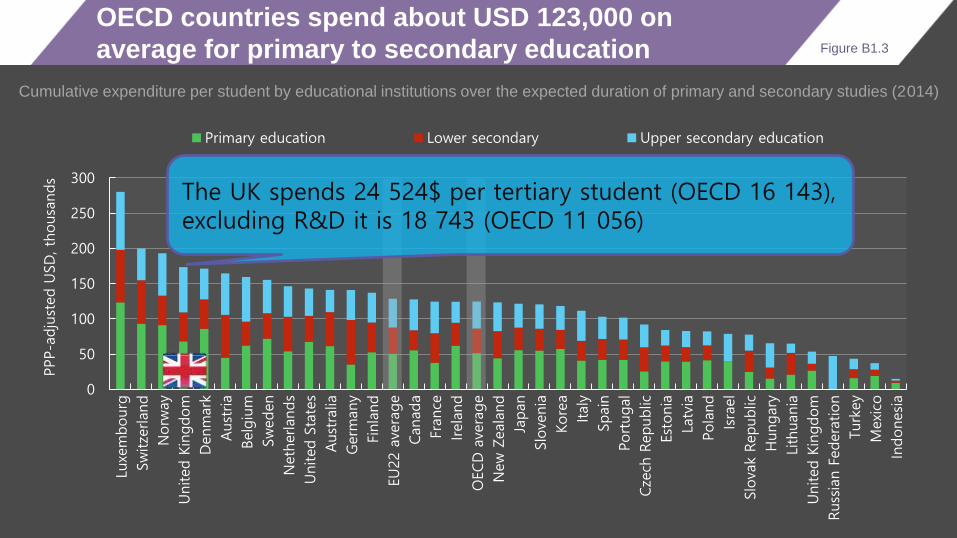
OECD countries spend about USD 123,000 on
average for primary to secondary education Figure B1.3
Cumulative expenditure per student by educational institutions over the expected duration of primary and secondary studies (2014)
0
50
100
150
200
250
300
Luxe
mbourg
Sw
itze
rland
Norw
ay
United K
ingdom
Denm
ark
Aust
ria
Belg
ium
Sw
eden
Neth
erlands
United S
tate
s
Aust
ralia
Germ
any
Finla
nd
EU
22 a
vera
ge
Canada
Fra
nce
Irela
nd
OECD
ave
rage
New
Zeala
nd
Japan
Slo
venia
Kore
a
Italy
Spain
Portugal
Cze
ch R
epublic
Est
onia
Latv
ia
Pola
nd
Isra
el
Slo
vak R
epublic
Hungary
Lith
uania
United K
ingdom
Russ
ian F
edera
tion
Turk
ey
Mexi
co
Indonesia
PPP-a
dju
sted U
SD
, th
ousa
nds
Primary education Lower secondary Upper secondary education
The UK spends 24 524$ per tertiary student (OECD 16 143), excluding R&D it is 18 743 (OECD 11 056)

And now funds 30% of total expenditure on tertiary
institutions on average across OECD countries Figure B3.2
Distribution of public and private expenditure on educational institutions (2014)
0 10 20 30 40 50 60 70 80 90
100
Finla
nd
Norw
ay
Luxe
mbourg
Denm
ark
Aust
ria
Icela
nd
Sw
eden
Belg
ium
Arg
entina
Slo
venia
Germ
any
Est
onia
Pola
nd
France
Latv
ia
EU
22 a
vera
ge
Slo
vak R
epublic
Lith
uania
Cze
ch R
epublic
Indonesia
Turk
ey
Irela
nd
Mexi
co
OECD
ave
rage
Neth
erlands
Hungary
Spain
Russ
ian F
edera
tion
Italy
Portugal
Isra
el
New
Zeala
nd
Canada
Colo
mbia
Aust
ralia
Chile
United S
tate
s
Kore
a
Japan
United K
ingdom
% Tertiary education
Public expenditure on educational institutions Household expenditureExpenditure of other private entities All private sources

Rising tuition fees are behind the increasing
contributions of households

High tuition fees are characteristic of tertiary
education in many countries Figure B5.1
Tuition fees charged by public and private institutions at bachelor's or equivalent level (2015/16)
0
2
4
6
8
10
12
United S
tate
s
Chile
Japan
Canada
Aust
ralia
Kore
a
New
Zeala
nd
Isra
el
Neth
erlands
Spain
Italy
Portugal
Sw
itze
rland
Aust
ria
Hungary
Luxe
mbourg
Flem
ish c
om
. (B
elg
ium
)
French
com
. (B
elg
ium
)
Slo
venia
Denm
ark
Est
onia
Finla
nd
Norw
ay
Pola
nd
Slo
vak
Republic
Sw
eden
Turk
ey
Mexi
co
Latv
ia
Engla
nd (United K
ingdom
)
PPP-a
dju
sted U
SD
, th
ousa
nds
Public institutions Private institutions21 189

Flexible funding mechanisms help studentsFigure B5.3
Distribution of financial support to students at bachelor's or equivalent level (2015/16)
11,951
0
4,763
8,202
0
3,095
0
7,654
624 420
1,658914 1,168
0
2,000
4,000
6,000
8,000
10,000
12,000
14,000
0 10 20 30 40 50 60 70 80 90
100
Engla
nd (U
nited
Kin
gdom
)*
Norw
ay
Aust
ralia
United S
tate
s
Turk
ey
Isra
el
Finla
nd
Chile
Flem
ish c
om
.
(Belg
ium
)
Mexi
co
French
com
.
(Belg
ium
)
Italy
Aust
ria
Sw
itze
rland
%
Not benefitting from public loans or scholarships/grants Benefitting from public loans and scholarships/grants
Benefitting from public loans only Benefitting from scholarships/grants only
Average public tuition fees (USD) (Table B5.1)
*All tertiary institutions are government-dependent private institutions in England (United Kingdom).

The returns are still worth it for individualsFigure A7.2
Private costs and benefits of education for a man or a woman attaining tertiary education (2013)
- 200
- 100
0
100
200
300
400
500
600
Luxe
mbourg
Irela
nd
Chile
United S
tate
s
Pola
nd
Portugal
Slo
venia
Kore
a
Spain
Turk
ey
Canada
Isra
el
Hungary
EU
22 a
vera
ge
OECD
ave
rage
Cze
ch R
epublic
France
Aust
ralia
Norw
ay
New
Zeala
nd
Neth
erlands
Germ
any
Aust
ria
Finla
nd
Est
onia
Italy
Denm
ark
Slo
vak R
epublic
Japan
Thousa
nds
Man: Total benefits Man: Total costs Woman: Total benefits Woman: Total costs

…and also for taxpayersFigure A7.3
Private costs and benefits of education for a man or a woman attaining tertiary education (2013)
- 200
- 100
0
100
200
300
400
500
600
Neth
erlands
Irela
nd
Luxe
mbourg
Slo
venia
Portugal
Japan
United S
tate
s
EU
22 a
vera
ge
Cze
ch R
epublic
Germ
any
Finla
nd
Aust
ralia
Pola
nd
Hungary
France
OECD
ave
rage
Aust
ria
Turk
ey
Italy
Spain
Canada
Isra
el
New
Zeala
nd
Norw
ay
Denm
ark
Slo
vak R
epublic
Kore
a
Est
onia
Chile
Sw
itze
rland
Thousa
nds
Man: Total benefits Man: Total costs Woman: Total benefits Woman: Total costs

International student flows keep rising
but remain uneven


International student mobility helps create networks of
competencies, particularly at higher levels of education Figure C4.3
International students (inflow) and national students abroad (outflow) as a percentage of total national students (2015)
New Zealand
Australia
United Kingdom
Switzerland
Austria
BelgiumCanada
Netherlands
DenmarkCzech RepublicFrance
FinlandGermanyHungary Ireland
Sweden Slovak RepublicLatvia
ItalyUnited States
Portugal
Estonia
Japan NorwayLithuania
Russian Federation SloveniaPoland KoreaTurkey
Chile China
0
2
4
6
8
10
12
14
16
18
20
22
24
26
28
0 1 2 3 4 5 6 7 8 9 10 11 12 13 14 15
Stu
dent in
flow
Student outflow
Tertiary
Luxembourg( 23;73)

Education
Arts and humanitiesSocial sciences, journalism and
information
Business, administration and law
Natural sciences, mathematics and statistics
Information and communication technologies
Engineering, manufacturing and construction
Health and welfare
Services 0
5
10
15
20
25
30
0 5 10 15 20 25 30
Inte
rnational doct
ora
te s
tudents
by
field
of
educa
tion (%
)
National doctorate students by field of education (%)
More open or attractive to international students
Less open or attractive tointernational
students`
International students are more drawn to science-
related fields, particularly at doctoral level Figure C4.2
Doctorate student mobility by field of education, OECD average (2015)

In spite of this positive trend for higher education,
some are still left behind

Completion of upper secondary level is still a
challenge for some Figure A9.2
Outcomes for students who entered upper secondary education, by duration (2015)
0%
20%
40%
60%
80%
100%
New
Zeala
nd
Est
onia
Fle
mish c
om
.
(Belg
ium
)
Latv
ia
Sw
eden
Fin
land
Ave
rage
Neth
erlands
Chile
Aust
ria
Norw
ay
Engla
nd (U
K)
Bra
zil
Portugal
Luxe
mbourg
By theoretical duration plus two years
Graduated from any upper secondary programme Still in education Not graduated and not enrolled

Particularly for those with less-educated parents or
from an immigrant background Figure A9.a
Completion rate of upper secondary education by parents' educational background (2015)
0
10
20
30
40
50
60
70
80
90
100
Israel United States Netherlands France Flemish com.
(Belgium)
Finland Sweden Norway
Below upper secondary (ISCED 0-2) Upper secondary or post-secondary non-tertiary (ISCED 3-4) Tertiary (ISCED 5-8)
%

The transition from school to work is not always smooth,
and reveals the relevance of skills acquired through education
to the labour market

15% of 18-24 year-olds were neither in employment
nor in education or training in 2016 Figure C5.1
Percentage of 18-24 year-olds in education/not in education, employed, unemployed or inactive (2016)
0
20
40
60
80
100
Slo
venia
Denm
ark
Luxe
mbourg
Neth
erlands
Gre
ece
Germ
any
Lith
uania
Belg
ium
Spain
Sw
itze
rland
Slo
vak
Republic
Finla
nd
Est
onia
Portugal
Irela
nd
Sw
eden
France
Italy
Aust
ralia
OECD
ave
rage
Icela
nd
Chile
Hungary
Norw
ay
Latv
ia
Aust
ria
Canada
United S
tate
s
New
Zeala
nd
Cost
a R
ica
Russ
ian F
edera
tion
Pola
nd
United K
ingdom
Turk
ey
Mexi
co
Colo
mbia
Isra
el
In education Not in education and employed Not in education and unemployed Not in education and inactive

Vocational programmes offer flexible pathways through
education and into the labour market

33% of upper secondary UK students were enrolled in
vocational programmes, below the OECD average of 43%Figure C1.1
Enrolment rates of 15-19 year-olds, by programme level and orientation (2015)
0
10
20
30
40
50
60
70
80
90
100
Irel
and
Lith
uan
ia
Slo
ven
ia
Sau
di A
rab
ia
Net
her
lan
ds
Po
lan
d
Au
stra
lia
Latv
ia
Bel
giu
m
Cze
ch R
epu
blic
Esto
nia
Po
rtu
gal
Ger
man
y
Icel
and
EU2
2 a
vera
ge
Spai
n
Den
mar
k
Fin
lan
d
No
rway
Ko
rea
Swed
en
Swit
zerl
and
Fran
ce
Hu
nga
ry
Slo
vak
Rep
ub
lic
Un
ited
Kin
gdo
m
OEC
D a
vera
ge
Ital
y
Ru
ssia
n F
eder
atio
n
New
Ze
alan
d
Un
ited
Sta
tes
Ch
ile
Au
stri
a
Ind
on
esia
Luxe
mb
ou
rg
Arg
enti
na
Turk
ey
Can
ada
Bra
zil
Isra
el
Ch
ina
Mex
ico
Co
sta
Ric
a
Co
lom
bia
Ind
ia
ISCED 3 - General programmes ISCED 3 - Vocational programmes ISCED 3 - No breakdown Other than ISCED 3
%
Different from most OECD countries, the UK spends less per vocational student than for academic student.
1.2% of GDP invested in upper secondary general programmes, 0.5%
in vocational programmes (OECD average 0.6% for both)

Financial investment in basic skills has been growing,
but varies a lot by country

In most countries spending rose faster than enrolmentTable B1.3
Index of change in expenditure per student by educational institutions for all services (current prices) and number of students (2010 to 2014)
80
90
100
110
120
130
140
150
Turk
ey
Isra
el
United K
ingdom
Latv
ia
Portugal
Mexi
co
Icela
nd
Chile
Denm
ark
Pola
nd
Hungary
OECD
ave
rage
Belg
ium
Sw
eden
Kore
a
Japan
Aust
ralia
EU
22 a
vera
ge
Cze
ch R
epublic
Slo
vak R
epublic
Canada
France
Norw
ay
Finla
nd
Germ
any
Luxe
mbourg
Italy
Neth
erlands
United S
tate
s
Est
onia
Slo
venia
Irela
nd
Spain
Sw
itze
rland
Primary, secondary, and post-secondary non-tertiary
Change in expenditure Change in the number of students
GDP deflator 2010 = 100

On average, expenditure on educational institutions has
increased faster than GDP between 2008 and 2014 Figure B2.3
Index of change in public expenditure on primary to tertiary educational institutions and in GDP (2008 to 2014)
80
90
100
110
120
130
140
150
160
Turk
ey
Kore
a
Slo
vak R
epublic
Denm
ark
Finla
nd
Sw
itze
rland
Mexi
co
Neth
erlands
Chile
Portugal
Aust
ralia
Germ
any
Bra
zil
OECD
ave
rage
Japan
Isra
el
Belg
ium
Cze
ch R
epublic
EU
22 a
vera
ge
Russ
ian F
edera
tion
Sw
eden
Norw
ay
France
Icela
nd
Latv
ia
Slo
venia
Pola
nd
Canada
Spain
Est
onia
Lith
uania
Italy
United S
tate
s
Hungary
Irela
nd
Index of change (2008 = 100)
Change in public expenditure on educational institutions
Change in GDP
Change in public expenditure on educational institutions as a percentage of GDP205

In primary and secondary education, how resources are
allocated is as important as total funds invested overall

Teachers still earn less than similarly tertiary-
educated workers Figure D3.1
Lower secondary teachers' salaries relative to earnings for tertiary-educated workers (2015)
0.5
1.0
1.5
Portugal
Luxe
mbourg
Latv
ia
Gre
ece
Fin
land
Germ
any
Isra
el
Est
onia
Fra
nce
EU
22 a
vera
ge
Engla
nd (U
K)
Slo
venia
Denm
ark
Fle
mish c
om
. (B
elg
ium
)
Lith
uania
OECD
ave
rage
New
Zeala
nd
Neth
erlands
Aust
ralia
Sw
eden
Pola
nd
Aust
ria
Fre
nch
com
. (B
elg
ium
)
Sco
tland (U
K)
Norw
ay
Chile
Hungary
Italy
United S
tate
s
Slo
vak R
epublic
Cze
ch R
epublic
Ratio

Both starting salaries and salary progressions varyFigure D3.2
Lower secondary teachers’ statutory salaries at different points in teachers' careers (2015)
0
20
40
60
80
100
120
140
Luxe
mbourg
Sw
itze
rland
Germ
any
Denm
ark
Spain
Aust
ralia
Neth
erlands
United S
tate
s
Canada
Norw
ay
Fle
mish c
om
. (B
elg
ium
)
Fin
land
Sw
eden
Aust
ria
Fre
nch
com
. (B
elg
ium
)
Portugal
OECD
ave
rage
Fra
nce
EU
22 a
vera
ge
Irela
nd
Italy
Japan
New
Zeala
nd
Kore
a
Sco
tland (U
K)
Turk
ey
Slo
venia
Mexi
co
Engla
nd (U
K)
Isra
el
Gre
ece
Chile
Cost
a R
ica
Cze
ch R
epublic
Est
onia
Lith
uania
Colo
mbia
Pola
nd
Hungary
Bra
zil
Slo
vak R
epublic
Latv
ia
Thousa
nds
Starting salary/minimum qualifications Salary after 15 years of experience/typical qualifications
Salary at top of scale/maximum qualifications
Equivalent USD converted using PPPs
Teacher statutory salaries in England fell by 12% and in Scotland by 6% in real terms between 2005 and 2015, while they rose on average across countries by 10% at pre-primary, 6% at primary and lower secondary and
4% at upper secondary levels
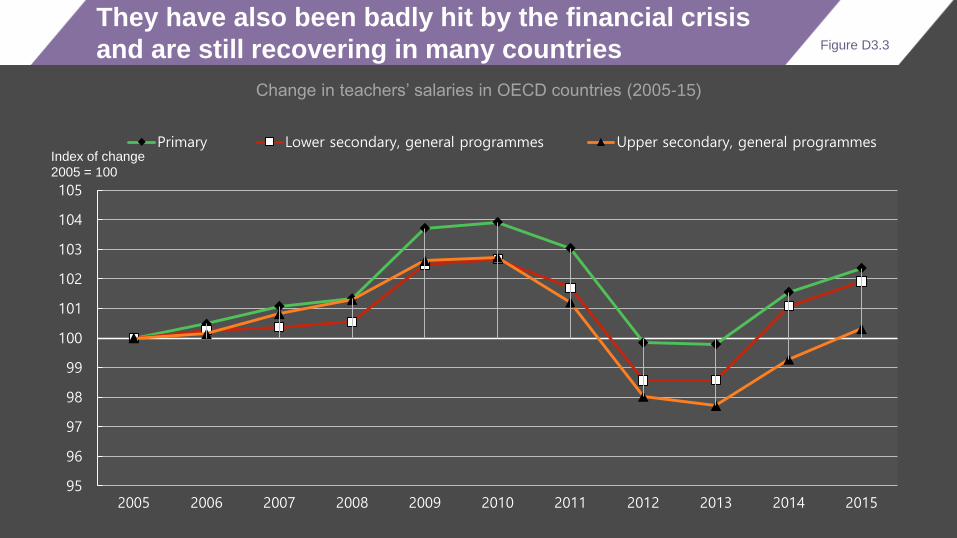
They have also been badly hit by the financial crisis
and are still recovering in many countries Figure D3.3
Change in teachers’ salaries in OECD countries (2005-15)
95
96
97
98
99
100
101
102
103
104
105
2005 2006 2007 2008 2009 2010 2011 2012 2013 2014 2015
Primary Lower secondary, general programmes Upper secondary, general programmesIndex of change
2005 = 100

Class sizes have been decreasing in most countriesFigure D2.2
Change in average class size (2005, 2015)
- 30
- 20
- 10
0
10
20
30Fr
ance
United S
tate
s
Spain
Icela
nd
Italy
Russ
ian F
edera
tion
Portugal
Slo
venia
Germ
any
Luxe
mbourg
Hungary
Japan
Mexi
co
OECD
ave
rage
EU
22 a
vera
ge
Cze
ch R
epublic
Pola
nd
Aust
ralia
Chile
Isra
el
Lith
uania
Aust
ria
United K
ingdom
Bra
zil
Gre
ece
Kore
a
Slo
vak R
epublic
Est
onia
Turk
ey
Neth
erlands
Index of change (2005 = 0) Primary education Lower secondary education

Smaller student/teacher ratios do not always translate
into smaller classes Tables D2.1-2
Relationship between average class size and student-teacher ratio, lower secondary education (2015)
Austria
Chile
Czech Republic
Estonia
Finland
FranceGermany
Hungary
Iceland
Israel
Italy
Japan
Korea
Latvia
Luxembourg
Mexico
PolandPortugal
Slovak Republic
Slovenia
Spain
Sweden
Turkey
United Kingdom
United States
5
10
15
20
25
30
35
5.0 10.0 15.0 20.0 25.0 30.0 35.0
Ave
rage C
lass
Siz
e
Student-Teacher Ratio

Teaching time has remained generally stableFigure D4.1
Number of teaching hours per year in general lower secondary public education (2000, 2005 and 2015)
0
200
400
600
800
1 000
1 200
1 400
Cost
a R
ica
Colo
mbia
Chile
Sw
itze
rland
Mexi
co
United S
tate
s
Sco
tland (UK)
New
Zeala
nd
Engla
nd (UK)
Aust
ralia
Denm
ark
Germ
any
Neth
erlands
Canada
Luxe
mbourg
Irela
nd
Spain
OECD
ave
rage
Isra
el
Latv
ia
French
com
. (B
elg
ium
)
Norw
ay
France
Slo
vak R
epublic
Slo
venia
Est
onia
Cze
ch R
epublic
Italy
Lith
uania
Japan
Hungary
Aust
ria
Portugal
Finla
nd
Flem
ish c
om
. (B
elg
ium
)
Kore
a
Gre
ece
Turk
ey
Pola
nd
Russ
ian F
edera
tion
Hours per year 2015 2005 2000

Combined, these parameters provide the salary cost of
teachers per student, an indication of the effectiveness
of funds invested in education
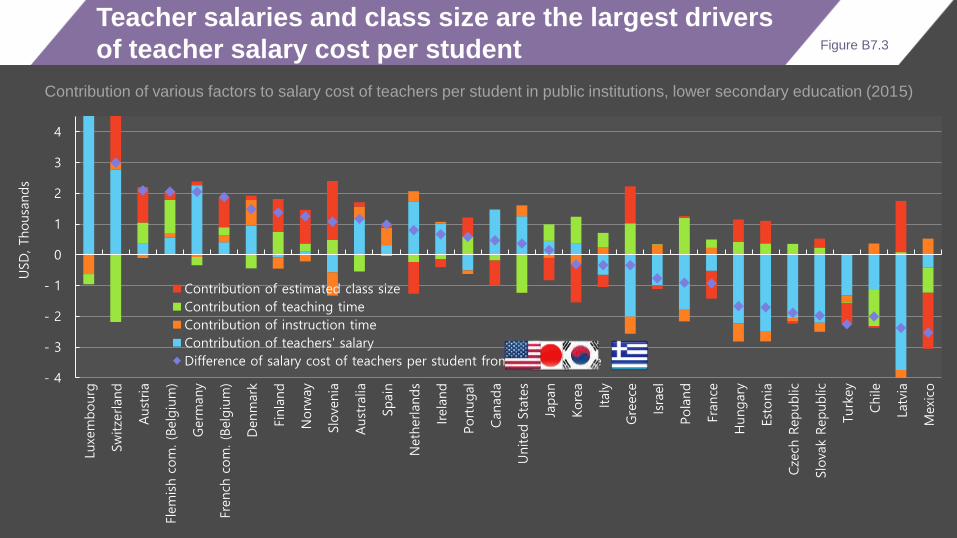
Teacher salaries and class size are the largest drivers
of teacher salary cost per student Figure B7.3
Contribution of various factors to salary cost of teachers per student in public institutions, lower secondary education (2015)
- 4
- 3
- 2
- 1
0
1
2
3
4
Luxe
mbourg
Sw
itze
rland
Aust
ria
Fle
mish c
om
. (B
elg
ium
)
Germ
any
Fre
nch
com
. (B
elg
ium
)
Denm
ark
Fin
land
Norw
ay
Slo
venia
Aust
ralia
Spain
Neth
erlands
Irela
nd
Portugal
Canada
United S
tate
s
Japan
Kore
a
Italy
Gre
ece
Isra
el
Pola
nd
Fra
nce
Hungary
Est
onia
Cze
ch R
epublic
Slo
vak R
epublic
Turk
ey
Chile
Latv
ia
Mexi
co
USD
, Thousa
nds
Contribution of estimated class size
Contribution of teaching time
Contribution of instruction time
Contribution of teachers' salary
Difference of salary cost of teachers per student from OECD average

The age and gender distribution of teachers
is characterized by strong contrasts

The teaching profession is ageingFigure D5.1
Average age of teachers by education level (2015)
30
35
40
45
50
55
Italy
Lith
uania
Latv
ia
Gre
ece
Est
onia
Cze
ch R
epublic
Finla
nd
Norw
ay
Neth
erlands
Sw
eden
New
Zeala
nd
Germ
any
Aust
ria
Slo
venia
Sw
itze
rland
EU
22 a
vera
ge
Portugal
Slo
vak R
epublic
Spain
United K
ingdom
France
OECD
ave
rage
Hungary
Isra
el
Japan
Pola
nd
United S
tate
s
Irela
nd
Luxe
mbourg
Belg
ium
Canada
Kore
a
Chile
Bra
zil
Indonesia
Icela
nd
India
Age
Lower secondary education Upper secondary education

And fails to attract men, particularly at lower levels of
education Figure D5.2
Gender distribution of teachers (2015)
0
10
20
30
40
50
60
70
80
90
100
Russ
ian F
edera
tion
Lith
uania
Slo
venia
Hungary
Italy
Cze
ch R
epublic
Latv
ia
Aust
ria
Est
onia
Slo
vak R
epublic
Bra
zil
United S
tate
s
Irela
nd
Germ
any
EU22 a
vera
ge
Neth
erlands
Pola
nd
Isra
el
United K
ingdom
New
Zeala
nd
OECD
ave
rage
France
Icela
nd
Sw
itze
rland
Belg
ium
Chile
Portugal
Finla
nd
Cost
a R
ica
South
Afric
a
Kore
a
Sw
eden
Colo
mbia
Spain
Luxe
mbourg
Norw
ay
Canada
Gre
ece
Mexi
co
Japan
Chin
a
Indonesia
Saudi Ara
bia
India
Share of female teachers (%)
Primary education All secondary education All tertiary education

Lifelong learning

About half of the adult population participates in
continuous education Figure C6.1
Adults' participation in formal and/or non-formal education, by type (2012 or 2015)
0
10
20
30
40
50
60
70
80
90
100
New
Zeala
nd
Fin
land
Denm
ark
Sw
eden
Norw
ay
Neth
erlands
United S
tate
s
Canada
Sin
gapore
Engla
nd (U
K)
Aust
ralia
Isra
el
Germ
any
Est
onia
Irela
nd
Kore
a
Cze
ch R
epublic
Ave
rage
Fle
mish C
om
. (B
elg
ium
)
Northern
Ire
land (UK)
Aust
ria
Slo
venia
Chile
Spain
Japan
Fra
nce
Pola
nd
Lith
uania
Slo
vak R
epublic
Italy
Turk
ey
Gre
ece
Russ
ian F
edera
tion
%
Participation in non-formal education only Participation in formal education only
Participation in both formal and non-formal education No participation in adult education
Find out more about our work at www.oecd.org/edu
– All publications
– The complete micro-level database
Email: [email protected]
Twitter: SchleicherOECD
Wechat: AndreasSchleicher
Thank you


