Evaluating the effectiveness of the Murchison Mountain Stoat trapping programme
Danilo Hegg
A report submitted in partial fulfilment of the Post-graduate Diploma in Wildlife Management
University of Otago
Year 2006 University of Otago Department of Zoology P.O. Box 56, Dunedin New Zealand
WLM Report Number: 196
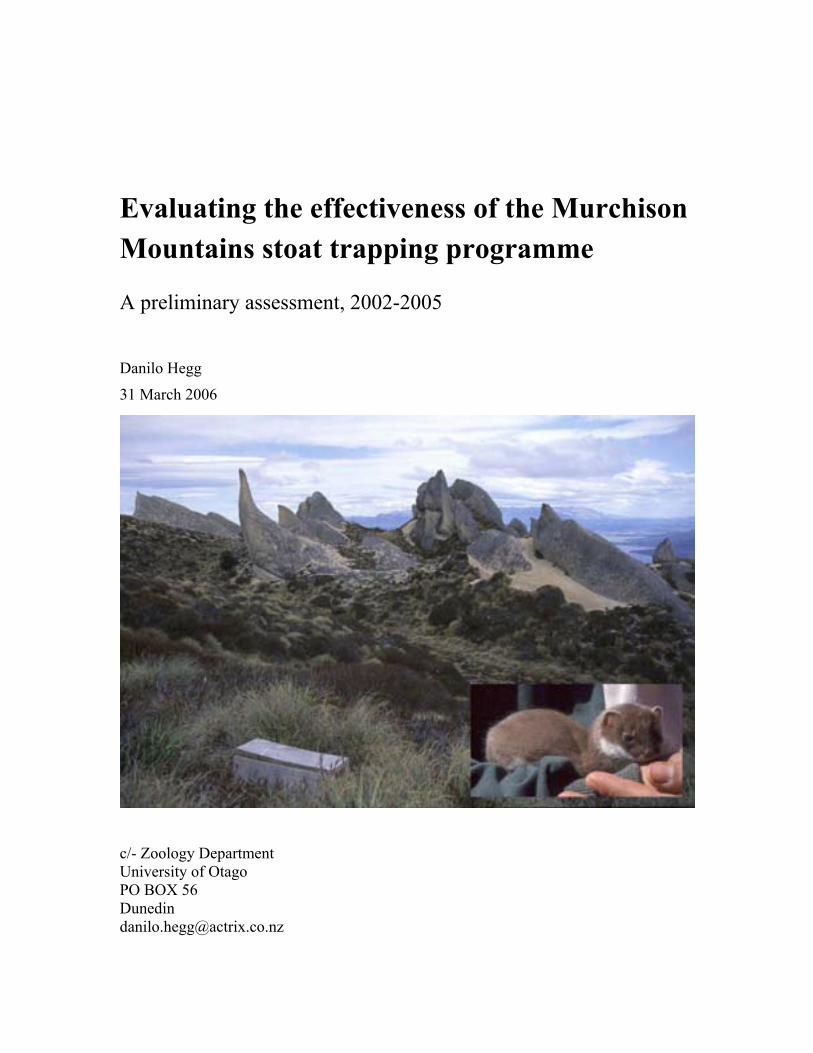
Evaluating the effectiveness of the Murchison Mountains stoat trapping programme A preliminary assessment, 2002-2005
Danilo Hegg
31 March 2006 c/- Zoology Department University of Otago PO BOX 56 Dunedin [email protected]

Murchison Mountains stoat trapping
Table of contents
Executive Summary…………………………………………………………......... iii
1. Introduction………………………………………………………………….. 1
2. Murchison Mountains stoat trapping and trap catch data analysis……… 5
2.1 Methods………………………………………………………………………... 6 2.2 Results…………………………………………………………………………. 7 A. General trends in stoat and rat kills……………………………………………….. 7 B. Spatial patterns in stoat kills………………………………………………………. 9 C. Seasonal patterns in stoat and rat kills…………………………………………….. 10 D. Stoat and rat kills in relation to habitat……………………………………………. 11 E. Correlation between stoat and rat kills…………………………………………….. 12 F. Sprung traps………………………………………………………………………... 13 2.3 Discussion…………………………………………………………………………….. 14
3. Tracking tunnels for monitoring of stoats and rodents……………………... 19
3.1 Methods………………………………………………………………………………. 20 3.1.1. Field techniques………………………………………………………………... 20 3.1.2. Statistical analysis……………………………………………………………… 21 3.2 Results……………………………………………………………………………….... 22 3.3. Discussion…………………………………………………………………………….. 26
4. Takahe breeding success and adult survival…………………………………... 31
4.1 Methods……………………………………………………………………………….. 33 4.1.1. Field techniques………………………………………………………………... 33 4.1.2. Statistical analysis – reproductive success……………………………………... 34 4.1.3. Statistical analysis – adult survival…………………………………………….. 35 4.2. Results………………………………………………………………………………… 37 4.2.1. Reproductive success…………………………………………………………... 37 A. Hatching success – % eggs laid that hatched…………………………………... 37 B. Hatching success – % fertile eggs that hatched………………………………... 38 C. Fledging success – % hatched eggs that produced chicks alive at >29 days old. 39 D. Breeding success – % eggs laid that produced chicks alive at >29 days old….. 40 E. Breeding success – % fertile eggs that produced chicks alive at >29 days old... 41 F. Nesting success – offspring produced per nesting pair………………………… 42 4.2.2. Adult survival………………………………………………………………….. 43 4.3. Discussion……………………………………………………………………………... 45
i

Table of contents
5. Mohua relative abundance……………………………………………………….. 47
5.1. Methods……………………………………………………………………………….. 48 5.1.1. Field techniques………………………………………………………………... 48 5.1.2. Statistical analysis……………………………………………………………… 49 5.2. Results………………………………………………………………………………… 49 5.3. Discussion…………………………………………………………………………….. 51
6. Kiwi monitoring programme…………………………………………………….. 55
6.1. Methods……………………………………………………………………………….. 56 6.2. Results………………………………………………………………………………… 58 A. Comparing level of predation between treatment and control area; Power = 90%.. 59 B. Comparing level of predation between treatment and control area; Power = 80%.. 60 C. Comparing breeding success between treatment and control area…………….….. 61 6.3. Discussion…………………………………………………………………………….. 62
7. Conclusions and Recommendations………………………………………….…. 65
Acknowledgements…………………………………………………………...…… 67
References………………………………………………………………….……….. 68
Appendix A Murchison Mountains stoat trapping: layout of experimental and monitoring areas
Appendix B Map of the takahe territories in the Murchison Mountains Appendix C Map of Murchison Mountains trap lines Appendix D Maps of Murchison Mountains trap captures Appendix E Maps of Murchison Mountains tracking tunnel lines Appendix F Logistic regression models for mice and weta tracking rates in the Murchison
Mountains tracking tunnels Appendix G Adult survival models for takahe in the Murchison Mountains, 1995 to 2004,
Program MARK.
ii

Murchison Mountains stoat trapping
Executive Summary
The Murchison Mountains are a region in Fiordland National Park, west of Lake Te Anau; best known for harbouring the only wild population of takahe (Porphyrio hochstetteri) in its original distribution range, they provide habitat for a number of endangered species.
In winter 2002, a stoat trapping programme covering 15,000ha in the south-east sector of the Murchison Mountains was started, with the aim of reducing the impact of stoat predation on the takahe population. The northern sector of the Murchison Mountains was set aside as a control area. The operation is planned to last eight years.
This report evaluates the effectiveness of the stoat trapping programme, three years into the experiment; the following components are analyzed:
Stoat and rat trap capture data Tracking tunnels for monitoring of stoats and rodents in the treatment and control area Breeding success and adult survival of takahe in the treatment and control area Relative abundance of mohua in the treatment and control area Kiwi monitoring programme
Trap capture data
An analysis of stoat and rat capture data from 725 trap tunnels, each containing two Fenn Mark 4 traps, gave the following results:
Stoat captures have decreased slightly (186 in the 2002/03 season; 161 in the 2004/05 season) while rat captures have increased five-fold (39 in the 2002/03 season, 191 in the 2004/05 season) since the onset of trapping.
Stoat captures have decreased 63% in the central sector of the trapped area, while they have remained constant at the edges, including the lake shores, and at the lower altitudes generally. The difference is highly significant (P = 0.006).
A strong relationship exists between stoat and rat numbers caught on the same trap-line (P < 0.001) and in the same trap-tunnel (P = 0.001).
These results suggest that:
The effectiveness of the trapping regime at removing stoats is not homogeneous throughout the treatment area.
There is a strong predator-prey relationship between rats and stoats. The abundance of rodents at the lower altitudes might explain the persistence of stoats in spite of trapping efforts.
As expected, stoat trapping is causing an increase of meso-predators.
iii
Executive Summary
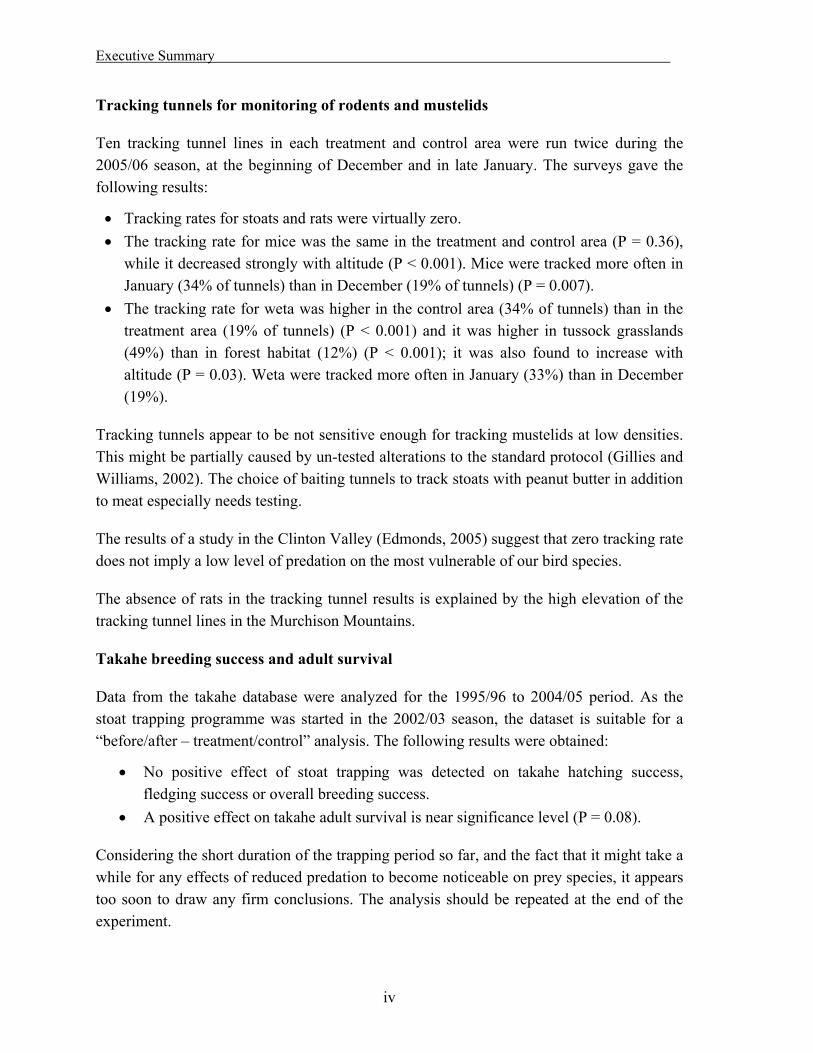
Tracking tunnels for monitoring of rodents and mustelids
Ten tracking tunnel lines in each treatment and control area were run twice during the 2005/06 season, at the beginning of December and in late January. The surveys gave the following results:
Tracking rates for stoats and rats were virtually zero. The tracking rate for mice was the same in the treatment and control area (P = 0.36),
while it decreased strongly with altitude (P < 0.001). Mice were tracked more often in January (34% of tunnels) than in December (19% of tunnels) (P = 0.007).
The tracking rate for weta was higher in the control area (34% of tunnels) than in the treatment area (19% of tunnels) (P < 0.001) and it was higher in tussock grasslands (49%) than in forest habitat (12%) (P < 0.001); it was also found to increase with altitude (P = 0.03). Weta were tracked more often in January (33%) than in December (19%).
Tracking tunnels appear to be not sensitive enough for tracking mustelids at low densities. This might be partially caused by un-tested alterations to the standard protocol (Gillies and Williams, 2002). The choice of baiting tunnels to track stoats with peanut butter in addition to meat especially needs testing.
The results of a study in the Clinton Valley (Edmonds, 2005) suggest that zero tracking rate does not imply a low level of predation on the most vulnerable of our bird species.
The absence of rats in the tracking tunnel results is explained by the high elevation of the tracking tunnel lines in the Murchison Mountains.
Takahe breeding success and adult survival
Data from the takahe database were analyzed for the 1995/96 to 2004/05 period. As the stoat trapping programme was started in the 2002/03 season, the dataset is suitable for a “before/after – treatment/control” analysis. The following results were obtained:
No positive effect of stoat trapping was detected on takahe hatching success, fledging success or overall breeding success.
A positive effect on takahe adult survival is near significance level (P = 0.08).
Considering the short duration of the trapping period so far, and the fact that it might take a while for any effects of reduced predation to become noticeable on prey species, it appears too soon to draw any firm conclusions. The analysis should be repeated at the end of the experiment.
iv
Murchison Mountains stoat trapping
Mohua relative abundance
Ten transects for mohua counts, each 1km long, were set up in each treatment and control area; walk through surveys were completed in October 2002, 2003 and 2004. The results from these surveys were also analyzed as a “before/after – treatment/control” dataset.
The number of mohua groups detected per transect line decreased 85% in the control area since the onset of trapping, while it decreased 28% in the treatment area (Interaction effect P = 0.008).
The most likely explanation for the different trends in treatment and control area is a positive effect of stoat trapping on the mohua population. The increase in rat numbers in the trapped area however is of concern, as it is known that one rat plague can outweigh the benefits of several years of stoat trapping (Dilks et al., 2003).
Kiwi monitoring programme
Ten adult male kiwi were captured and fitted with transmitters in each treatment and control area in 2003/04. During the breeding seasons, nests are monitored weekly, and chicks are fitted with transmitters soon after hatching. The fate for each egg/chick and the cause of any fatalities are recorded. No real comparison between treatment and control area has been possible so far because of the small sample size. The data collected during the last two years were used as a pilot study for a power analysis.
A sample size of 70 birds*years in each area would give a 90% probability of detecting a difference, in the event that the level of predation is 50% in the control area and less than 10 % in the treatment area.
If a five year study is planned, 14 birds should be monitored in each area. A larger sample needs to be captured to account for deaths and transmitter failures
Reducing the number of egg failures/chick deaths for which the cause cannot be identified would be an improvement to the study, as any unknowns impact severely on the power of the experiment.
Recommendations
The stoat trapping programme and associated bird monitoring should be continued for the initially planned duration of the experiment (8 years). If possible, at least two plague years should be included in the experiment.
A field trial should be set up near Te Anau, to test whether the tracking tunnel set-up in the Murchison Mountains is responsible for the low mustelid tracking rates.
v

Executive Summary
The tracking tunnel lines should be still run in the 2006/07 summer, as high stoat numbers are expected after a beech mast event. If a field trial indicates that the tracking tunnel set-up in the Murchison Mountains is not responsible for the low mustelid tracking rates, the use of tracking tunnels for monitoring stoats should be discontinued after the 2006/07 season.
The rodent monitoring system should be modified to cover all altitudes in forest habitat, from the lakeshore to the bush-line, in both treatment and control area.
Rat control should be implemented at the lower altitudes in addition to stoat control, possibly with poisoning operations triggered by a rodent monitoring system, or by beech seed-fall monitoring. Rat poisoning might enhance the performance of stoat control by secondary poisoning.
Yearly mohua monitoring transects should be re-established, starting October 2006.
If resources allow, both the kiwi and mohua monitoring programmes should be expanded to the Point Burn (treatment area) and the Chester Burn or Woodrow Burn (control area), as one valley is unlikely to be representative of a whole area.
The kiwi monitoring programme should aim at expanding the number of adults with transmitters to 16 birds in each area. The use of cameras triggered by photoelectric sensors could be investigated to reduce the number of unconfirmed predation events on kiwi nests.
vi

Murchison Mountains stoat trapping
1. Introduction The Murchison Mountains are a region in Fiordland National Park, enclosed by Lake Te Anau to the north, east and south, and by the ranges of the Main Divide running over Mt. Irene to the West (Figure 1.1). The area has high conservation values; thanks to its relative isolation, it has maintained a widely intact habitat for a number of endangered wildlife species. These include the takahe (Porphyrio hochstetteri), South Island brown teal (Anas chlorotis “South Island”) and the crested grebe (Podiceps cristatus australis) (Willans, 2003), all listed as “Nationally Critical” in the New Zealand Threat Classification System Lists (Hitchmough, 2002). Other endangered bird species present are the blue duck (Hymenolaimus malachorhynchos), yellowhead (Mohoua ochrocephala), South Island kaka (Nestor meridionalis meridionalis), kea (Nestor notabilis), rock wren (Xenicus gilviventris) and the Southern tokoeka (Apteryx australis). Figure 1.1. Murchison Mountains – geographic location
The vegetation is characterized by extensive forests below about 1000m of altitude, dominated by mountain beech (Nothofagus solandri var. cliffortioides) and silver beech (N. menziesii). The mountaintops above the bushline are covered by tussock grasslands (Chionochloa spp.), which occupy a high proportion of the area compared to other parts of Fiordland (Willans, 2003).
The Murchison Mountains host the only wild population of takahe in its original habitat. The bird was believed to be extinct in the early 20th century, and was rediscovered in 1948 on the shores of Lake Orbell (Ballance, 2001). Soon after its rediscovery, a 518km2 Special Area (“Murchison Mountains Special Takahe Area”) was set aside for its conservation. The takahe population continued to decline after its discovery and reached a low number of 120 individuals in 1981; thanks to intensive management, about 290
1
Introduction
takahe survive at present, about 170 of them in the Murchison Mountains, the rest in the Burwood Bush Reserve or on off-shore island sanctuaries (DoC, 2002, 2005a).
Among the many challenges faced by the takahe in the Murchison Mountains are competition by red deer, stoat predation, and the harsh climate in a less than optimal region of its original distribution range. Current management efforts include predator trapping, deer culling, captive rearing of chicks and relocations to off-shore islands (Lee, 2001).
Although there is circumstantial evidence that stoats can kill adult takahe, so far it has not been possible to quantify the true impact of predation on the takahe population (Maxwell, 2001; Maxwell and Christie, 2005). The takahe being a long-lived bird with a slow reproductive rate, even a small loss of adult birds could have a significant impact on an already small population. In 2002, the Department of Conservation has therefore started a stoat control programme based on low-intensity landscape style trapping, covering 15,000ha in the south-east sector of the Murchison Mountains (Crouchley, 2001). The control programme has a planned duration of eight years, and is designed as an experiment: while stoats are being targeted in the Ettrick Burn, Takahe Valley, Point Burn, Mystery Burn and William Burn, the adjacent Snag Burn, Miller Peaks and Woodrow Faces are set aside as a control area (see map in Appendix A). All other management activities such as nest manipulation, bird banding, transmitter monitoring and deer control are being applied equally in the trapped and un-trapped areas in order to avoid confounding effects. The only exception is the Waterfall Creek – Lake Eyles – Panda Basin area, which is being treated as a “Minimum Disturbance” Area, and where deer control and nest / chick surveys are the only management activities being undertaken (Crouchley, 2001). The basins south of the Dana Peaks (Ettrick catchment) and west of Mt. Lyall (Chester Burn catchment) are un-trapped, but are possibly affected by the trapping regime due to their vicinity to the stoat control area; they are therefore part of a “Buffer Zone” that is excluded from the experiment.
Concurrently with the trapping, a number of monitoring programmes have been started to asses the effectiveness of the stoat removal. Ten tracking tunnel lines were set in each treatment and control area to compare the numbers of stoats and rodents in the two areas (Loe and Willans, 2005). Tracking tunnels can tell us how good we are at removing stoats, but the true impact of stoat predation on the takahe population and on other bird species remains unknown. Moreover, the removal of stoats is likely to result in an increase of meso-predators, both introduced pests (rats, weasels) and native (weka), also with undetermined effects on the ecosystem. There is therefore the need to monitor the effect of stoat removal on the species we want to protect. Takahe monitoring has been ongoing for many years, and will continue for the duration of the experiment (Crouchley,
2

Murchison Mountains stoat trapping
2001). This should provide a valuable dataset for a “before/after – treatment/control” analysis. Yearly transects to monitor mohua numbers and a study of the Southern tokoeka population in the treatment and control areas were also set up (Willans, 2002, 2004).
The aim of this report is to give a preliminary assessment of the effectiveness of the stoat trapping programme, three years into the experiment. Sections 2 and 3 analyze the trap catch data since 2002, and the tracking tunnel results for the 2005/2006 season. Sections 4 and 5 report the results of takahe and mohua monitoring in the treatment and control areas, while a brief assessment of the kiwi monitoring programme is given in section 6. Section 7 summarizes the findings of this report and gives some recommendations to improve the current trapping and monitoring regimes.
3
Murchison Mountains stoat trapping
2. Murchison Mountains stoat trapping and trap catch data analysis
Various stoat trapping programmes have been carried out in the Murchison Mountains since 1949. While two of them were continued for over 5 years, most lasted for only a short period, mainly because of the difficulty of maintaining traps regularly (Lavers and Mills, 1978; Crouchley, 2001; Willans, 2003). Past trapping programmes shared the following limitations:
With few exceptions, trap-lines were single lines on the valley floors, along rivers; only seldom was any trapping done in the alpine region, the takahe’s breeding habitat.
Those few programmes that targeted the alpine region seemed to be limited to very small areas, e.g. a single alpine basin (Lavers and Mills, 1978).
None of the past trapping programmes were carried out in a way that made it possible to measure any effect, or otherwise, on the takahe population (DoC, 2002).
A recent study in the Murchison Mountains has shown that several stoats are resident in the alpine habitat; although fewer in number than on the beech forest valley floors, their home-ranges are entirely confined above the bushline. Thus trapping on valley floors is ineffective if the aim is to protect takahe during the breeding season (Smith and Jamieson, 2003, 2005). The same authors have also measured the size of stoat home-ranges during a plague year, and concluded that trap spacing should be 300m, preferably 200m, if at least one trap is to fall within the core of every stoat’s home range.
Another experiment conducted in the Dart Valley has shown that a trap layout on a rectangular perimeter (900m x 1000m) is just as effective as a grid at catching stoats (Lawrence and O’Donnell, 1999). This study did not include any mast years though, when food resources are more abundant and stoat home-ranges are smaller (Murphy and Dowding, 1995).
The current stoat trapping programme in the Murchison Mountains has been designed with these findings in mind. This is the first time that a large scale trapping programme has been implemented in Fiordland National Park, covering alpine regions and valley floors over a large area, concurrently with a monitoring programme that includes a control (un-trapped) area.
5
Trap capture data analysis
In this section, trap catch data are analyzed to examine the following: Trends in stoat and rat kills Seasonal patterns of stoat and rat kills Geographical patterns of stoat and rat kills Stoat and rat kills in relation to habitat
2.1. Methods
725 trap tunnels were placed 200m apart on lines covering an area of ca. 15,000ha in the south-east sector of the Murchison Mountains (see map in Appendix C). The distance between two lines is generally no more than 2km, except in areas where the geography is too rough.
The trap tunnels are 600mm long wooden boxes each holding two Mark 4 Fenn traps. A 19mm weld mesh netting with a 57mm x 57mm hole is used to reduce the entrance size at both ends. The tunnels have floors and lids to help keep the traps in good condition; the lids are secured with 55mm screws to prevent kea from being caught. A section of 50 x 25mm timber is nailed to the middle of the floor and has a depression in it to hold an egg, plus a small nail to attach a meat bait to. The tunnels are placed along tracks below the bushline, while the routes are only marked with poles in the alpine habitat (Crouchley, 2001).
Trap tunnels were first baited and checked during winter 2002. Since then, they have been cleared and rebaited four times a year, in July, November, February and May. On each occasion, any dead animals are removed from the traps, any sprung traps are reset, and each tunnel is rebaited with one fresh egg and one salted rabbit bait, approx 1cm x 2cm in size. The following data are recorded by the operators for each trap:
Trap empty (trap sprung, no kill and bait gone) Trap sprung (trap sprung, no kill and bait present) Trap rolled and sprung (tunnel rolled, usually by possums or kea) Bait gone (trap set and no kill, but bait disappeared) Any kill
The field-notes are subsequently entered in a Microsoft Office EXCEL spreadsheet stored on the Department of Conservation network. All data collected from August 2002 to March 2006 were analyzed using EXCEL and MINITAB 14 (Minitab Inc.).
6
Murchison Mountains stoat trapping
7
2.2. Results
A. General trends in stoat and rat kills
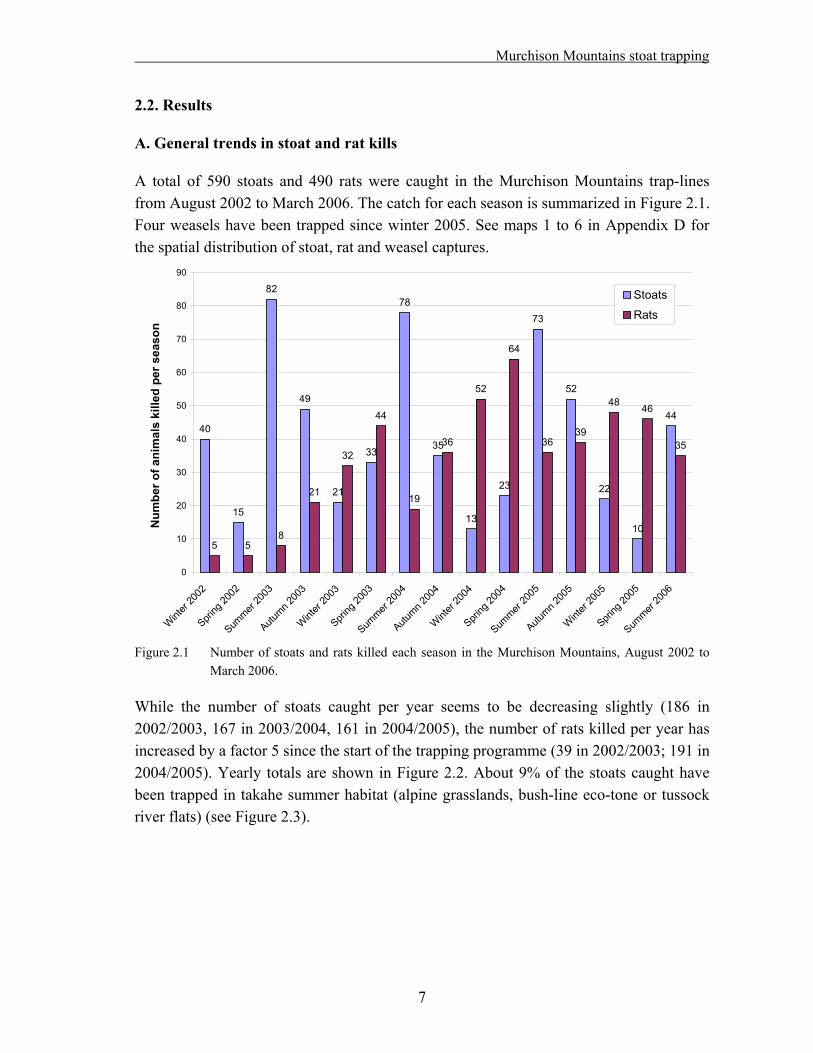
A total of 590 stoats and 490 rats were caught in the Murchison Mountains trap-lines from August 2002 to March 2006. The catch for each season is summarized in Figure 2.1. Four weasels have been trapped since winter 2005. See maps 1 to 6 in Appendix D for the spatial distribution of stoat, rat and weasel captures.
40
15
82
49
21
33
78
35
13
23
73
52
22
10
44
5 58
21
32
44
19
36
52
64
3639
48 46
35
0
10
20
30
40
50
60
70
80
90
Wint
er 20
02
Spring
2002
Summer
2003
Autumn 2
003
Wint
er 20
03
Spring
2003
Summer
2004
Autumn 2
004
Wint
er 20
04
Spring
2004
Summer
2005
Autumn 2
005
Wint
er 20
05
Spring
2005
Summer
2006
Num
ber o
f ani
mal
s ki
lled
per s
easo
n
Stoats
Rats
Figure 2.1 Number of stoats and rats killed each season in the Murchison Mountains, August 2002 to
March 2006.
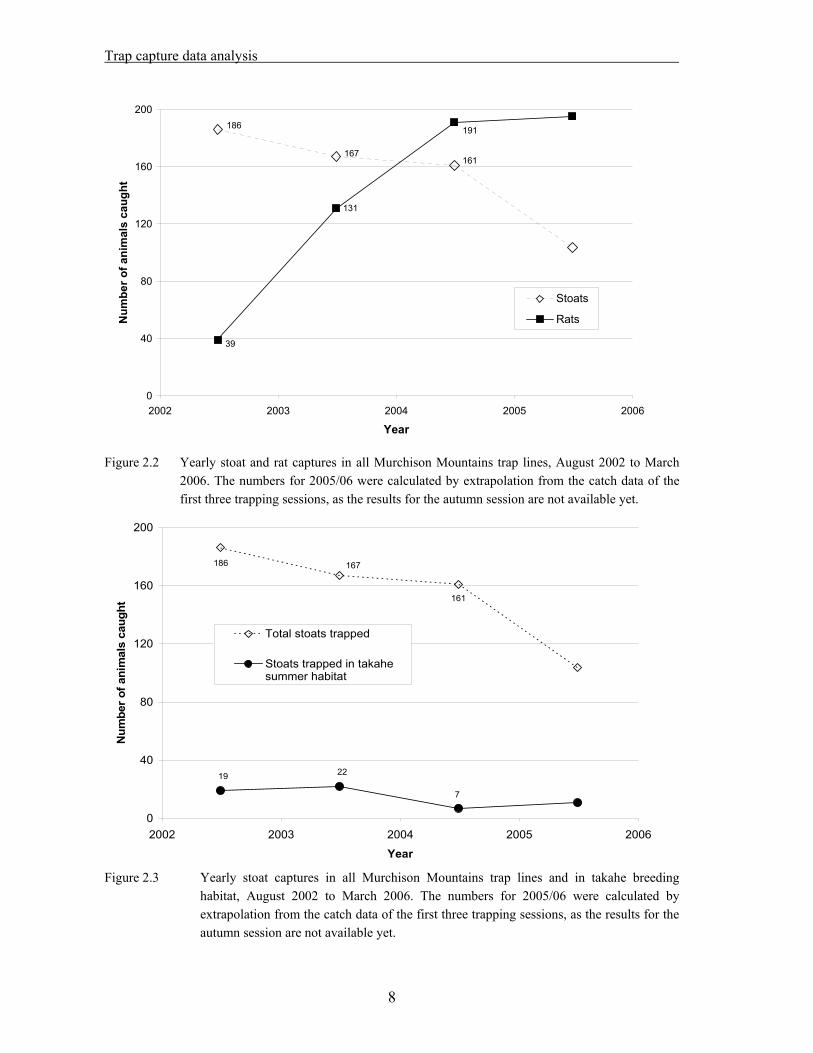
While the number of stoats caught per year seems to be decreasing slightly (186 in 2002/2003, 167 in 2003/2004, 161 in 2004/2005), the number of rats killed per year has increased by a factor 5 since the start of the trapping programme (39 in 2002/2003; 191 in 2004/2005). Yearly totals are shown in Figure 2.2. About 9% of the stoats caught have been trapped in takahe summer habitat (alpine grasslands, bush-line eco-tone or tussock river flats) (see Figure 2.3).
Trap capture data analysis
8
131
186
167161
39
191
0
40
80
120
160
200
2002 2003 2004 2005 2006
Year
Num
ber o
f ani
mal
s ca
ught
Stoats
Rats
Figure 2.2 Yearly stoat and rat captures in all Murchison Mountains trap lines, August 2002 to March
2006. The numbers for 2005/06 were calculated by extrapolation from the catch data of the first three trapping sessions, as the results for the autumn session are not available yet.
161
167186
7
2219
0
40
80
120
160
200
2002 2003 2004 2005 2006
Year
Num
ber o
f ani
mal
s ca
ught
Total stoats trapped
Stoats trapped in takahesummer habitat
Figure 2.3 Yearly stoat captures in all Murchison Mountains trap lines and in takahe breeding
habitat, August 2002 to March 2006. The numbers for 2005/06 were calculated by extrapolation from the catch data of the first three trapping sessions, as the results for the autumn session are not available yet.
Murchison Mountains stoat trapping
B. Spatial patterns in stoat kills
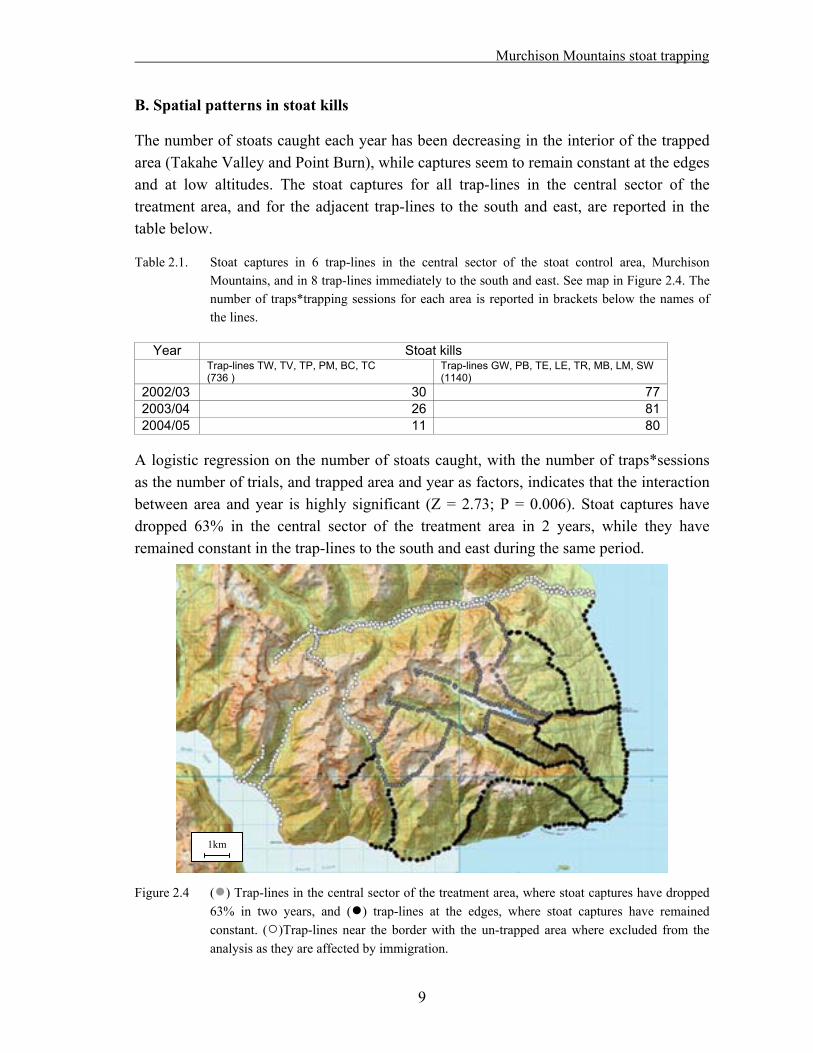
The number of stoats caught each year has been decreasing in the interior of the trapped area (Takahe Valley and Point Burn), while captures seem to remain constant at the edges and at low altitudes. The stoat captures for all trap-lines in the central sector of the treatment area, and for the adjacent trap-lines to the south and east, are reported in the table below.
Table 2.1. Stoat captures in 6 trap-lines in the central sector of the stoat control area, Murchison Mountains, and in 8 trap-lines immediately to the south and east. See map in Figure 2.4. The number of traps*trapping sessions for each area is reported in brackets below the names of the lines.
Year Stoat kills Trap-lines TW, TV, TP, PM, BC, TC
(736 ) Trap-lines GW, PB, TE, LE, TR, MB, LM, SW (1140)
2002/03 30 772003/04 26 812004/05 11 80
A logistic regression on the number of stoats caught, with the number of traps*sessions as the number of trials, and trapped area and year as factors, indicates that the interaction between area and year is highly significant (Z = 2.73; P = 0.006). Stoat captures have dropped 63% in the central sector of the treatment area in 2 years, while they have remained constant in the trap-lines to the south and east during the same period.
1km Figure 2.4 ( ) Trap-lines in the central sector of the treatment area, where stoat captures have dropped
63% in two years, and ( ) trap-lines at the edges, where stoat captures have remained constant. ( )Trap-lines near the border with the un-trapped area where excluded from the analysis as they are affected by immigration.
9
Trap capture data analysis
10
C. Seasonal patterns in stoat and rat kills
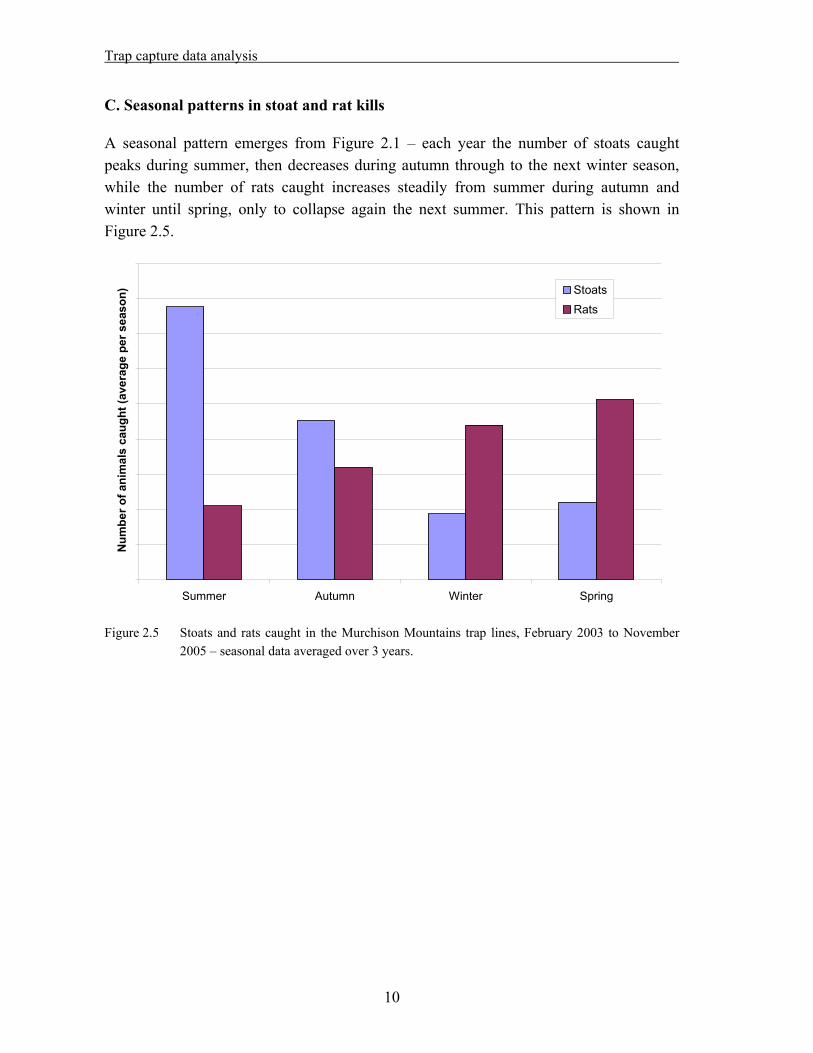
A seasonal pattern emerges from Figure 2.1 – each year the number of stoats caught peaks during summer, then decreases during autumn through to the next winter season, while the number of rats caught increases steadily from summer during autumn and winter until spring, only to collapse again the next summer. This pattern is shown in Figure 2.5.
Summer Autumn Winter Spring
Num
ber o
f ani
mal
s ca
ught
(ave
rage
per
sea
son) Stoats
Rats
Figure 2.5 Stoats and rats caught in the Murchison Mountains trap lines, February 2003 to November
2005 – seasonal data averaged over 3 years.
Murchison Mountains stoat trapping
11
D. Stoat and rat kills in relation to habitat
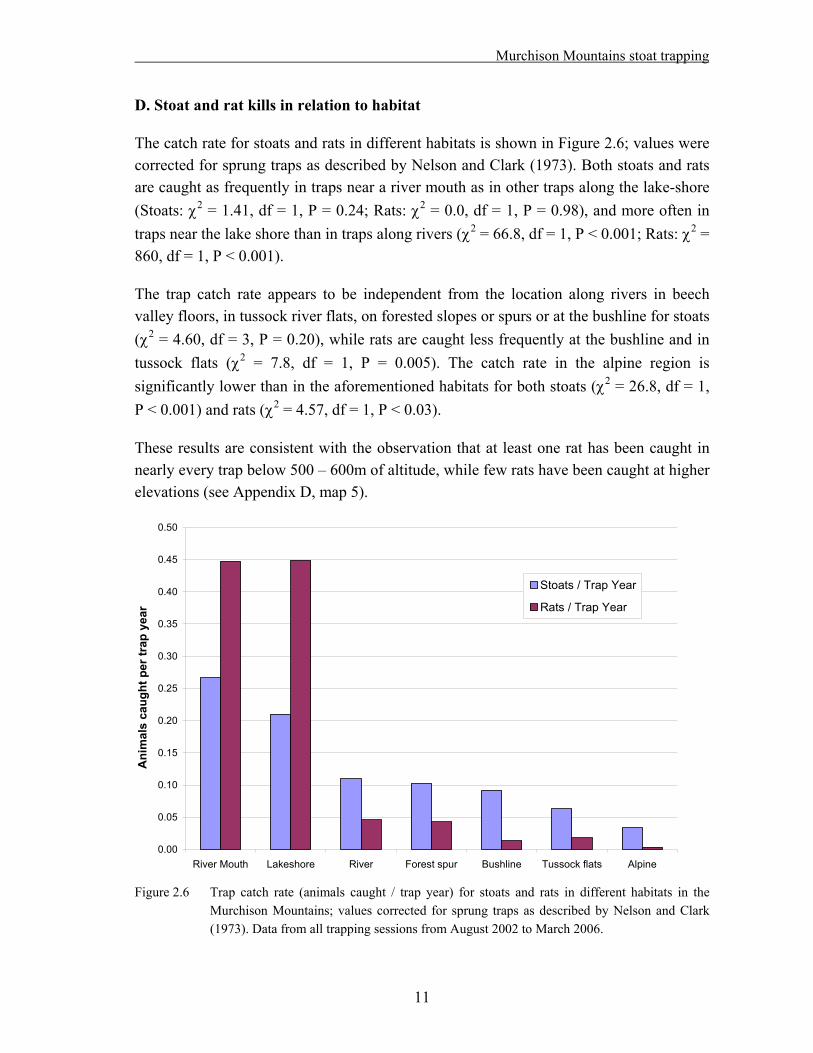
The catch rate for stoats and rats in different habitats is shown in Figure 2.6; values were corrected for sprung traps as described by Nelson and Clark (1973). Both stoats and rats are caught as frequently in traps near a river mouth as in other traps along the lake-shore (Stoats: 2 = 1.41, df = 1, P = 0.24; Rats: 2 = 0.0, df = 1, P = 0.98), and more often in traps near the lake shore than in traps along rivers ( 2 = 66.8, df = 1, P < 0.001; Rats: 2 = 860, df = 1, P < 0.001).
The trap catch rate appears to be independent from the location along rivers in beech valley floors, in tussock river flats, on forested slopes or spurs or at the bushline for stoats ( 2 = 4.60, df = 3, P = 0.20), while rats are caught less frequently at the bushline and in tussock flats ( 2 = 7.8, df = 1, P = 0.005). The catch rate in the alpine region is significantly lower than in the aforementioned habitats for both stoats ( 2 = 26.8, df = 1, P < 0.001) and rats ( 2 = 4.57, df = 1, P < 0.03).
These results are consistent with the observation that at least one rat has been caught in nearly every trap below 500 – 600m of altitude, while few rats have been caught at higher elevations (see Appendix D, map 5).
0.00
0.05
0.10
0.15
0.20
0.25
0.30
0.35
0.40
0.45
0.50
River Mouth Lakeshore River Forest spur Bushline Tussock flats Alpine
Ani
mal
s ca
ug
Stoats / Trap Year
Rats / Trap Year
ht p
er tr
ap y
ear
Figure 2.6 Trap catch rate (animals caught / trap year) for stoats and rats in different habitats in the
Murchison Mountains; values corrected for sprung traps as described by Nelson and Clark (1973). Data from all trapping sessions from August 2002 to March 2006.

Trap capture data analysis
E. Correlation between stoat and rat kills
A linear regression indicates that there is a significant correlation between the capture rate of stoats and rats on any given trap-line (t = 6.28, df = 14, P < 0.001). A straight line fits the log-transformed data reasonably well (R2 = 0.75); the positive slope means that the higher the rat catch rate on a trap line, the higher the stoat catch rate is likely to be on the same trap-line (see Figure 2.7).
The results are consistent if the analysis is repeated for single trap tunnels rather than for trap-lines. Trap tunnels that have caught at least one rat are significantly more likely to have caught at least one stoat compared to tunnels that have caught no rats (n = 725; 2 = 11.1, df = 1, P = 0.001) (see Table 2.2).
Table 2.2. Trapping success for all Murchison Mountains traps from August 2002 to March 2006.
Trap caught stoats Yes No
Yes 125 67Trap caught rats No 240 293
-8
-7
-6
-5
-4
-3
-2
-1
0
1
-4 -3.5 -3 -2.5 -2 -1.5 -1 -0.5 0
ln (Stoats / trap year)
ln (R
ats
/ tra
p ye
ar)
Figure 2.7 Correlation between the catch rates for stoats and rats from trap-lines in the Murchison
Mountains, August 2002 to March 2006 (R2 = 0.75). The equation of the fitted line is ln(rats / trap year) = 2.40•ln(stoats / trap year) + 1.53
12
Murchison Mountains stoat trapping
F. Sprung traps
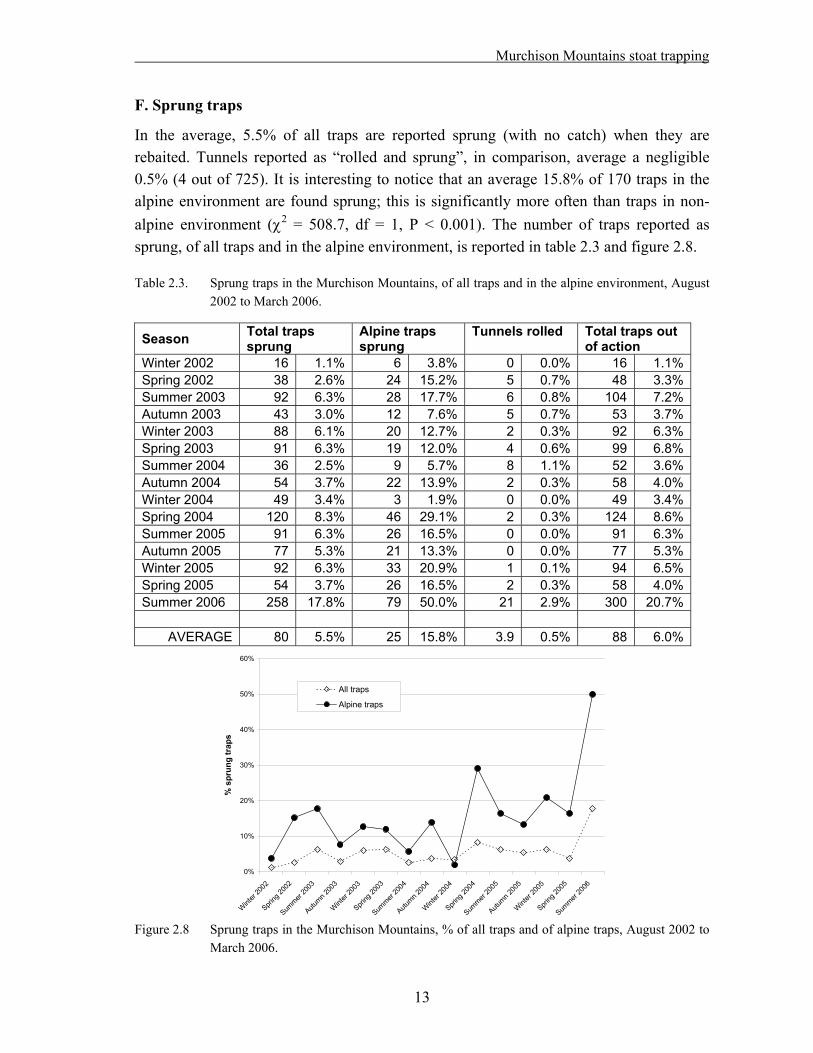
In the average, 5.5% of all traps are reported sprung (with no catch) when they are rebaited. Tunnels reported as “rolled and sprung”, in comparison, average a negligible 0.5% (4 out of 725). It is interesting to notice that an average 15.8% of 170 traps in the alpine environment are found sprung; this is significantly more often than traps in non-alpine environment ( 2 = 508.7, df = 1, P < 0.001). The number of traps reported as sprung, of all traps and in the alpine environment, is reported in table 2.3 and figure 2.8.
Table 2.3. Sprung traps in the Murchison Mountains, of all traps and in the alpine environment, August 2002 to March 2006.
Season Total traps sprung
Alpine traps sprung
Tunnels rolled Total traps out of action
Winter 2002 16 1.1% 6 3.8% 0 0.0% 16 1.1%Spring 2002 38 2.6% 24 15.2% 5 0.7% 48 3.3%Summer 2003 92 6.3% 28 17.7% 6 0.8% 104 7.2%Autumn 2003 43 3.0% 12 7.6% 5 0.7% 53 3.7%Winter 2003 88 6.1% 20 12.7% 2 0.3% 92 6.3%Spring 2003 91 6.3% 19 12.0% 4 0.6% 99 6.8%Summer 2004 36 2.5% 9 5.7% 8 1.1% 52 3.6%Autumn 2004 54 3.7% 22 13.9% 2 0.3% 58 4.0%Winter 2004 49 3.4% 3 1.9% 0 0.0% 49 3.4%Spring 2004 120 8.3% 46 29.1% 2 0.3% 124 8.6%Summer 2005 91 6.3% 26 16.5% 0 0.0% 91 6.3%Autumn 2005 77 5.3% 21 13.3% 0 0.0% 77 5.3%Winter 2005 92 6.3% 33 20.9% 1 0.1% 94 6.5%Spring 2005 54 3.7% 26 16.5% 2 0.3% 58 4.0%Summer 2006 258 17.8% 79 50.0% 21 2.9% 300 20.7%
AVERAGE 80 5.5% 25 15.8% 3.9 0.5% 88 6.0%
0%
10%
20%
30%
40%
50%
60%
Wint
er 20
02
Spring
2002
Summer
2003
Autumn 2
003
Wint
er 20
03
Spring
2003
Summer
2004
Autumn 2
004
Wint
er 20
04
Spring
2004
Summer
2005
Autumn 2
005
Wint
er 20
05
Spring
2005
Summer
2006
% s
prun
g tr
aps
All traps
Alpine traps
Figure 2.8 Sprung traps in the Murchison Mountains, % of all traps and of alpine traps, August 2002 to March 2006.
13
Trap capture data analysis
2.3. Discussion
Trap capture rates are used here as a relative index of abundance for stoats and rats. A linear relationship between capture rate and population density has been proven for ferrets (Mustela furo) (Cross et al., 1988) and mice (Ruscoe et al., 2004); the use of the index for stoats, with its advantages and disadvantages, was described by King and Edgar (1977) and was reviewed by Griffiths (1999). Trap capture rates vary with food availability (King, 1994; Lawrence, 1997; Alterio et al., 1999); their relationship to the population density is generally monotonous, and they provide a reliable relative index of abundance, provided same season indices are compared, as hunger might be an important confounding factor. The index is likely to be especially robust in the Murchison Mountains, as the large number of traps over a large area reduces any noise caused by localized random effects. When interpreting the results, it is important to bear in mind that zero catch does not mean zero density, and the proportion of un-trapped animals remains unknown.
Two important observations follow from the results in the previous section:
It appears that the effectiveness of the trapping regime at removing stoats is not homogeneous throughout the treatment area. Stoats have dropped to low numbers in the central sector of the stoat control area (compare maps 1 to 4 in Appendix D), while they seem to persist in high numbers at the edges, mainly in the Ettrick Burn and in proximity of Lake Te Anau.
The results suggest a strong predator-prey relationship between rats and stoats at the lower altitudes in the trapped area. Stoats are more abundant where rat numbers are high; this is also where they seem to persist in face of the trapping. On the other hand, rat numbers are increasing in response to a lower stoat density.
Trends in stoat kills
The fact that stoat captures remain high in the Ettrick Burn was to be expected, and is easily explained by immigration from the adjacent un-trapped area. The persistence of stoats at the eastern and southern boundaries of the treatment area cannot be explained by immigration. A viable breeding population remains in the area. In this regard, we should ponder the opinion expressed by King (1978):
“Control of the overall number of stoats in the Takahe Area is, in the foreseeable future, completely impractical. The reasons for this are: (a) A control programme would be effective only if an improbably high proportion (at least 80%) were killed every year. Such a high capture rate is necessary, because of the
14
Murchison Mountains stoat trapping
high reproductive capacity of stoats. Young females are extremely precocious and can be mated before leaving the nest. On the condition that ovulation is induced by copulation, ovarian histology suggests that by the time the family disperses in midsummer, 99% of females are already pregnant with blastocysts in delay, and the average litter size in NZ is 9 foetuses. This means that, even if every male is killed during the summer peak, the next generation is already assured. (b) Immigration from surrounding control areas cannot be prevented.”
Of interest is also an observation by Dilks (2005), who used video cameras to monitor stoat traps in the Eglinton, and found that although stoats were recorded approaching a tunnel on 45 occasions, on 8 (18%) of these they did not enter.
It remains to be understood why stoat control is more effective in some parts of the treatment area than in others. A comparison of the stoat and rat captures on a map (see Appendix D, maps 1 to 5) suggests that there is a substantial overlap between the area where stoats persist, and the area where rats are more abundant. It is possible that stoats there are simply less interested in entering traps because they have enough alternative food sources. Another explanation could be that stoat home ranges there are smaller because of greater food availability, and not all stoats come in contact with traps; a breeding stock could thus persist between the trap-lines. The fact that stoat home-ranges shrink during years of high food availability was confirmed by Murphy and Dowding (1995); Lawrence and O’Donnell (1999) also admit that their perimeter trapping layout could potentially fail in mast years.
The persistence of a breeding stock of stoats is of concern, as they can very easily migrate into any other areas where their numbers have been lowered. Some encouraging results have also been obtained though, and the opinion expressed by King (1978) seems pessimistic. Stoat captures have dropped in a relatively large area that contains several takahe territories, and where five blue ducks have been released in January 2006.
Stoat captures have dropped substantially in the whole trapped area during the 2005/06 season, but it is too soon to tell if this is due to the trapping programme starting to have a deeper impact, or if stoat trappability is lower this year due to super-abundance of food after a mild winter and a warm start of summer (the second scenario is more likely).
15
Trap capture data analysis
Relationship between stoat and rat kills
A strong evidence of a predator – prey relationship between stoats and rats is suggested by the analysis of the trapping data (figure 2.2 and 2.6; table 2.2). A previous study on stoat diet in the Murchison Mountains only partially supports this; its findings were that stoats mainly feed on small mammals (mice and rats, with the former occurring in four times as many stoat stomachs as the latter) and invertebrates, mainly ground weta (Smith and Jamieson, 2003; Smith et al., 2005). The stomach contents analyzed in this study originated from stoats caught in four trap-lines, at the Glow-worm caves, in Takahe Valley, in the Point Burn and in the Mystery Burn. The frequency of occurrence of rats in stoat stomachs was the same on the lakeshore and in the valleys at higher altitudes ( 2 = 0.642, df = 1, P = 0.42) (Smith, unpublished data). A tracking tunnel line on the lakeshore however tracked one rat but failed to detect any mice in March 2005 (Loe and Willans, 2005). It might be possible that the composition of the ecosystem has shifted since the start of the trapping programme, with rats becoming more common and a more important component of stoat diet at the lower altitudes.
The seasonal pattern of trap captures reported in Figure 2.2, showing rat captures increasing from summer through winter to spring, needs to be interpreted with caution. It might be possible that rats survive and keep reproducing during winter, and that their population crashes as a consequence of stoat numbers exploding the next summer. More likely, however, seasonal rat captures reflect hunger, not population density (Alterio et al., 1999). Rats are caught more often in winter and spring than in summer, when more food is available; this supports the best practice of King (1994) of comparing only indices of the same season.
Trends in rat kills
Of concern is the observation that rat numbers have increased five-fold since the start of trapping. The release of meso-predators in response to stoat trapping is a well-known fact (Barlow and Choquenot, 2002), and had been predicted for the Murchison Mountains (Willans, 2003). The observation that rats are at very low densities in the Murchisons, and that they will also be caught in traps (Willans, 2003) is not supported by the writer of this report. For a start, no rodent monitoring is in place at the lower altitudes in the Murchison Mountains, to compare rat numbers in the treatment and control area, or with other regions in Fiordland National Park. Secondly, although rats are caught in traps, and they are a target species, the trapping programme was not designed for rodent control. Rat home-ranges are small; while males occupy territories of up to 10ha (and 800m in length), a female’s home-range size can be as small as 0.3ha (Pryde et al., 2005). A trapping regime designed for stoats will therefore make but a small dent in the rat population.
16
Murchison Mountains stoat trapping
Not only are rats just a secondary kill in a stoat trapping operation, but they make stoat trapping less effective, as a trap that has killed a rat is not available to kill a stoat any longer. The total number of rats caught in one session has never exceeded 4% of all set traps so far, so this effect might appear unimportant. But rats are almost exclusively caught at the lower altitudes, and 20% to 25% of all lake shore traps might kill a rat during any one session (the most ever recorded has been 46% of all traps – not trap tunnels! – on the LW trap-line, spring 2004). This reduction in trapping capacity is not negligible, especially since the lake shore is also where stoats are most abundant. A plague following a beech mast year is expected during the coming summer season – imagine the following scenario: if every second trap out of three on the lake shore catches a rat, the effectiveness of the stoat trapping will be greatly reduced, right at the time when we need it the most.
Lessons learnt from similar programmes elsewhere should also be kept in mind. Ten years ago, Elliott (1996a) wrote that “the relative absence of rats in the Eglinton and other similar beech forests may help explain why mohua have survived there when they have disappeared from podocarp forests”. A large-scale stoat trapping programme to protect mohua was started in the Eglinton Valley in 1997/1998; although it met with some initial success, the mohua population was wiped out by a rat plague during a double beech mast in 2000 and 2001 (Dilks et al., 2003; Dilks, 2005). There is no evidence to support the hypothesis that the rat plague was caused by stoat removal, but lower stoat numbers are likely to have been a factor of some importance among others. While there is no reason to panic and expect a similar event in the Murchison Mountains, rodents should be monitored and their impact should be accounted for throughout any stoat control programme.
Weasels
Of interest is also the fact that four weasels have been killed during the 2005/2006 trapping season. This appears to be a first, as weasels are not recorded in any previous literature about the Murchison Mountains, and they are not listed among the Animal Pest Species Present in the Operational Report for the Murchisons Stoat Control (Willans, 2003). It is not clear whether weasels were already present in the area at a density too low to be detected, or whether they have recently immigrated. The locations of their captures suggest that the former option is more likely (see Appendix D, map 6). Weasels strongly depend on small rodents for their survival, and are generally rare in New Zealand. In addition, they suffer from interference competition from stoats (Erlinge and Sandell, 1988). An increase in mice and rat numbers and a concurrent decrease in stoat numbers could possibly assist their establishment.
17
Trap capture data analysis
Sprung traps
The fact that 16% of the alpine traps are found sprung (50% during the summer 2006!) should also be addressed. Several hypotheses have been proposed to explain why traps in the alpine region are more often out of action than traps below the bushline. Possible explanations include kea interference, high winds rocking the trap tunnels, or thermal expansion effects associated with extreme temperature oscillations. Freeze/melt of snow blown into the tunnels is also a possibility. This all suggests that trap tunnels in the alpine region might need some more careful placement – shelter offered by shrubs might solve some of the aforementioned problems; staking to the ground would reduce the effect of kea interference and high winds.
Conclusions
The effectiveness of the stoat trapping programme is not uniform in the whole trapped area. Stoats persist in higher numbers near the lake shores, possibly because of the abundance of rodents. The five-fold increase of rat captures since the start of trapping is also of concern. Rat poisoning operations should be planned, possibly triggered by a monitoring system. Rat poisoning would enhance the stoat trapping programme as it might cause secondary poisoning of stoats, thus removing some of the animals that are not caught in traps. Less rats caught in traps would also mean more traps available to kill stoats. Trappability of stoats is unlikely to increase after a rat control operation, as stoats would simply switch prey.
18
Murchison Mountains stoat trapping
3. Tracking tunnels for monitoring of stoats and rodents
Capture data can give us an indication about population trends in a trapped area, but not about the underlying causes, as there might be several confounding factors involved. If we detect a reduction in stoat numbers for instance, we cannot with certainty attribute it to the trapping – it could be caused by climatic factors, or by a decline in prey. There is therefore a need to monitor target species not only in the trapped area, but also in a comparable control area.
The control area must not be affected by the management operation – if this is a trapping programme, stoats in the control area cannot be monitored through trapping. A monitoring tool that does not affect the stoat population is required. Tracking tunnels fulfill this purpose; their use for tracking stoats was first described in New Zealand by King and Edgar (1977), and they have been widely applied since. Trapping and tracking tunnels share some limitations, as they both rely upon a stoat being attracted by a bait or lure and entering the tunnel. Both systems then have limitations of their own – while stoats can run through a trap without being caught, or traps can spring shut and be out of action, tracking tunnels can dry out and fail to record any footprints. One problem unique of tracking tunnels is that one animal can run through several tunnels in a row, giving the false impression that we have tracked two or more individuals instead of one (Brown and Miller, 1998; Griffiths, 1999). Despite these limitations, tracking tunnels are one of the most commonly used tools for monitoring stoats, and yield additional information in that they detect the presence of other small mammals, lizards and invertebrates (Gillies and Williams, 2002).
A system of tracking tunnels was set up in the Murchison Mountains early in 2005, with ten lines in the control area and ten lines in the treatment area. The tunnels were run once during March 2005, and tracked one stoat only (Loe and Willans, 2005). Two more runs were scheduled for December 2005 and January 2006. The goals of the monitoring system are the following:
To compare stoat density and population trends in the treatment and control area – and detect whether the trapping is having any effect, or otherwise.
To compare rodent density and population trends in the treatment and control area. If trapping is successful at controlling stoat numbers, an increase in rodent numbers might be expected in the treatment area. This could be an additional confirmation that the trapping programme is having an effect (or not).
Unfortunately, the tracking tunnels were set up after the start of the trapping programme – this means that, if a difference is detected between the two areas, we cannot with certainty attribute it to the trapping. The only firm conclusions can derive from trends
19

Tracking tunnels
observed over several surveys in successive years. Here, the results of the tracking tunnel runs in the 2005/06 season are analyzed and discussed. 3.1. Methods
3.1.1. Field techniques
During the 2004/05 summer season, twenty tracking tunnel lines were set out; ten lines within the stoat trapping area (Takahe Valley, Point Burn and Mystery Burn), and ten in the non-treatment area (Snag Burn / Miller Peaks) (see maps in Appendix E). Each line consists of 10 tunnels spaced at 50m intervals along a compass bearing. Lines cover a representative sample of different altitudes and habitat types; 40% of the lines in the treatment area and 30% of the lines in the control area were laid out in tussock and scrub habitat, the rest in forest. Location and bearing were randomized within logistical constraints set by the rough terrain (Loe and Willans, 2005).
The tunnels are built from black polypropylene plastics sheets, 900mm long, folded over a wooden base, 100mm wide by 535mm long, and are closed at either end by a #8 wire bracket to prevent disturbance by possums and kea (see Figure 3.1). Polycarbonate trays (95mm wide by 520mm long) are used to hold an ink sponge (5mm thick) glued at the centre, and pre-cut papers (95mm wide by 173mm long) at both ends. #8 wire is also used to anchor the tunnels to the ground.
Figure 3.1. Tracking tunnel and tray used in the Murchison Mountains. Photo M. Willans.
20

Murchison Mountains stoat trapping
The tracking tunnels were surveyed for the first time in both the treatment and control areas during March 20th – 24th, 2005 (Loe and Willans, 2005). Line ST10 (treatment area) was then moved from the lakeshore to the tops above Takahe Valley in November 2005. Two more runs followed, December 6th – 9th, 2005, and January 23rd – 27th, 2006. On each occasion, the papers were left in the tunnels for three consecutive nights before being collected. Line TT10 (control area) was set for two nights only during the December 2005 survey because of technical difficulties (no trays in place).
Each tunnel was baited with peanut butter in the middle of the sponge; every second tunnel also had a piece of rabbit meat added to it. The sponges were soaked with red or blue food dye. Gillies and Williams (2002) recommend surveying the tracking tunnels for rodents for one night, using only peanut butter as bait, then for mustelids for three nights, using only meat as bait. However, because of the unreliability of the weather, time constraints, labour demands and related costs, tunnels in the Murchison Mountains are surveyed for 3 nights for both rodents and mustelids (Loe and Willans, 2005). After three nights, the papers are taken out, and the footprints of mustelids, mice, rats and weta identified as described by Gillies and Williams (2000).
3.1.2. Statistical analysis
The data were analyzed separately for each species of interest. For rodents and weta, each tunnel is an experimental unit (Gillies and Williams, 2002), while for mustelids, a whole line is an experimental unit (Brown and Miller, 1998), as there is potential for one mustelid to run through several tunnels in one line. This means that for mustelids, a whole line is considered as either tracked or not tracked – regardless of whether footprints were found in all ten tunnels, or in one tunnel only.
The outcome for each experimental unit (tracked = 1, not tracked = 0) and for each species was analyzed as a function of area (treatment or control), habitat (tussock or forest), time (December 2005 or January 2006) and altitude by means of a logistic regression. The following model was fit to the data:
effectsnInteractioTimeBAltBHabBAreaBAp
p _1
ln 4321
Where p = probability of a unit being tracked Area = (1 = treatment; 0 = control) Hab = habitat (1 = forest; 0 = tussock) Alt = altitude [m] Time = (0 = December 2005; 1 = January 2006)
21

Tracking tunnels
Several reduced models were also fitted to the data, where one or more main effects and interaction effects were omitted (see Appendix F). The Akaike criterion (AIC) was used to select the best model; the goodness of fit of the model was tested with the Hosmer-Lemeshow test. A factor was considered to have a significant effect when the associated constant B was found to be significantly different from zero (P < 0.05). The software package SPSS v.11 was used for the analysis.
The results were corrected for overdispersion (Multinomial logistic regression procedure in SPSS) to account for the fact that the experimental units might not be independent – even for mice and rats there is a chance, in fact, for an animal to track two adjacent tunnels, as both animals are known to move more than 50m in one night (Fitzgerald et al., 1981; Pryde et al., 2005). Patchy distribution of rodents might also cause the condition of independence to fail for tunnels on the same line.
3.2. Results
The results of the tracking tunnel runs during the 2005/06 season only are analyzed in detail here; tracking rates are not comparable to the ones obtained during the previous season due to different timing (January vs. March) and because one of the lines was moved from the lakeshore to alpine grasslands above Takahe Valley. The results of the March 2005 survey are summarized in table 3.1.
Table 3.1. Number of units tracked by mustelids and rodents during the March 2005 tracking tunnel survey, Murchison Mountains (Loe and Willans, 2005). The total number of baited units is reported in brackets; 1 unit = 1 line for stoats, 1 tunnel for rodents.
Treatment area Control area Stoat 0 ( 10) 1 ( 9)
Rat 1 (100) 0 (90)
Mouse 38 (100) 30 (90)
Table 3.2. Number of units tracked by mustelids and rodents during the 2005/06 tracking tunnel surveys, Murchison Mountains. The total number of baited units is reported in brackets; 1 unit = 1 line for stoats, 1 tunnel for rodents and weta. Tunnels disturbed by possums were removed from the sample.
December 2005 January 2006 Treatment Control Treatment Control Stoat 0 ( 9) 0 (10) 1 (10) 0 (10)
Rat 0 (90) 0 (99) 1 (91) 0 (98)
Mouse 14 (90) 24 (99) 24 (91) 42 (98)
Weta 10 (90) 28 (99) 27 (91) 40 (98)
22

Murchison Mountains stoat trapping
One stoat was tracked in two surveys, in tunnel ST13, Line 2, Mystery Burn (treatment area), January 2006. One stoat had also been tracked during the March 2005 survey, in the control area.
One rat was tracked in two surveys, in tunnel ST19, Line 2, Mystery Burn (treatment area), January 2006. One rat had also been tracked during the March 2005 survey, in the treatment area, on the lakeshore line that has since been moved.
No disturbance by possums, kea or weka was reported in December 2005. Three lines in the treatment area were disturbed by possums in January 2006: Line 2 (one tunnel), Line 8 (three tunnels) and Line 9 (seven tunnels). Possums appeared to be able to force the #8 wire bracket open, slide the tray out of the tunnel, eat the bait and destroy sponge and papers. No disturbance by kea or weka was reported.
Line ST10 (treatment area) had to be removed from the analysis of the December 2005 survey because of operator’s negligence. Tracking tunnel TT75 (control area) was also excluded from the analysis as it had been smashed by a tree-fall. The tunnel was replaced early in January 2006, prior to the last survey. Tunnels TT59 and TT60 (control area) were excluded from the analysis of the January 2006 survey as they were washed away by a flood.
The sponges dried out before the papers were collected in most alpine tunnels, while they always retained enough moisture in the bush (and on occasion, the sponges were still wet from the March 2005 survey when the tunnels were baited in December 2005). Sponges in the alpine environment would have most likely dried out on day two during the December 2005 survey, and on day three during the January 2006 survey. However, no meat bait was ever taken from a tunnel where no footprints were recorded.
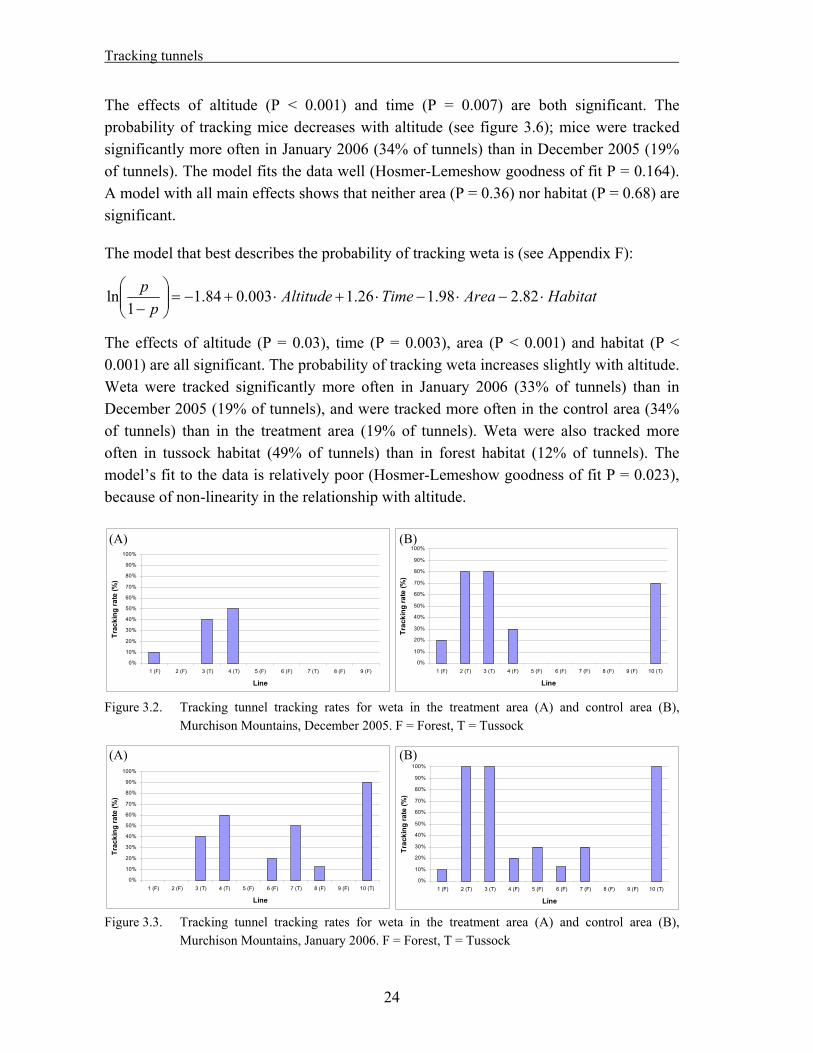
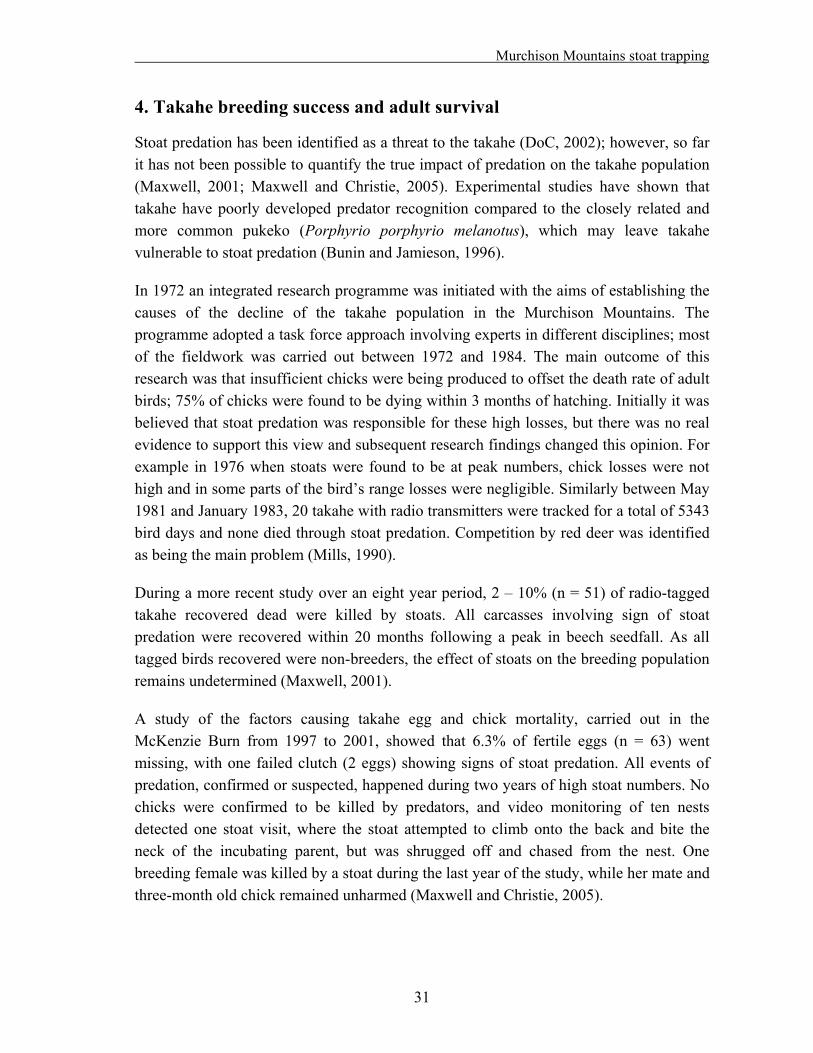
Mice and weta were the only animals tracked in significant numbers during both surveys. Mice were tracked in 16% of the tunnels in the treatment area and 24% of the tunnels in the control area in December 2005; the amounts increased to 26% and 43% in January 2006. Weta were tracked in 11% of the tunnels in the treatment area and 28% of the tunnels in the control area in December 2005; the amounts increased to 30% and 41% in January 2006. The tracking rates for weta and mice for each period and in each area are shown in figures 3.2 to 3.5.
The model that best describes the probability of tracking mice is (see Appendix F):
TimeAltitudep
p 06.1004.06.11
ln
23
Tracking tunnels
The effects of altitude (P < 0.001) and time (P = 0.007) are both significant. The probability of tracking mice decreases with altitude (see figure 3.6); mice were tracked significantly more often in January 2006 (34% of tunnels) than in December 2005 (19% of tunnels). The model fits the data well (Hosmer-Lemeshow goodness of fit P = 0.164). A model with all main effects shows that neither area (P = 0.36) nor habitat (P = 0.68) are significant.
The model that best describes the probability of tracking weta is (see Appendix F):
HabitatAreaTimeAltitudep
p 82.298.126.1003.084.11
ln
The effects of altitude (P = 0.03), time (P = 0.003), area (P < 0.001) and habitat (P < 0.001) are all significant. The probability of tracking weta increases slightly with altitude. Weta were tracked significantly more often in January 2006 (33% of tunnels) than in December 2005 (19% of tunnels), and were tracked more often in the control area (34% of tunnels) than in the treatment area (19% of tunnels). Weta were also tracked more often in tussock habitat (49% of tunnels) than in forest habitat (12% of tunnels). The model’s fit to the data is relatively poor (Hosmer-Lemeshow goodness of fit P = 0.023), because of non-linearity in the relationship with altitude.
0%
10%
20%
30%
40%
50%
60%
70%
80%
90%
100%
1 (F) 2 (F) 3 (T) 4 (T) 5 (F) 6 (F) 7 (T) 8 (F) 9 (F) 10 (T)
Line
Trac
king
rate
(%)
0%
10%
20%
30%
40%
50%
60%
70%
80%
90%
100%
1 (F) 2 (T) 3 (T) 4 (F) 5 (F) 6 (F) 7 (F) 8 (F) 9 (F) 10 (T)
Line
Trac
king
rate
(%)
0%
10%
20%
30%
40%
50%
60%
70%
80%
90%
100%
1 (F) 2 (F) 3 (T) 4 (T) 5 (F) 6 (F) 7 (T) 8 (F) 9 (F)
Line
Tra
)te
(%ck
ing
ra
0%
10%
20%
30%
40%
50%
60%
70%
80%
90%
1 (F) 2 (T) 3 (T) 4 (F) 5 (F) 6 (F) 7 (F) 8 (F) 9 (F) 10 (T)
Line
Trac
king
rate
(%)
100%(A) (B)
Figure 3.2. Tracking tunnel tracking rates for weta in the treatment area (A) and control area (B), Murchison Mountains, December 2005. F = Forest, T = Tussock
(A) (B)
Figure 3.3. Tracking tunnel tracking rates for weta in the treatment area (A) and control area (B), Murchison Mountains, January 2006. F = Forest, T = Tussock
24

Murchison Mountains stoat trapping
25
0%
10%
20%
30%
40%
50%
60%
70%
80%
90%
100%
1 (F) 2 (F) 3 (T) 4 (T) 5 (F) 6 (F) 7 (T) 8 (F) 9 (F)
Line
Trac
king
) ra
te (%
0%
10%
20%
30%
40%
50%
60%
70%
80%
90%
100%
1 (F) 2 (T) 3 (T) 4 (F) 5 (F) 6 (F) 7 (F) 8 (F) 9 (F) 10 (T)
Line
Trac
king
rate
(%)
(A) (B)
Figure 3.4. Tracking tunnel tracking rates for mice in the treatment area (A) and control area (B),
Murchison Mountains, December 2005. F = Forest, T = Tussock
0%
10%
20%
30%
40%
50%
60%
70%
80%
90%
100%
1 (F) 2 (F) 3 (T) 4 (T) 5 (F) 6 (F) 7 (T) 8 (F) 9 (F) 10 (T)
Line
Trac
(%ki
ng ra
te)
0%
10%
20%
30%
40%
50%
60%
70%
80%
90%
100%
1 (F) 2 (T) 3 (T) 4 (F) 5 (F) 6 (F) 7 (F) 8 (F) 9 (F) 10 (T)
Line
Trac
king
rate
(%)
(B) (A)
Figure 3.5. Tracking tunnel tracking rates for mice in the treatment area (A) and control area (B),
Murchison Mountains, January 2006. F = Forest, T = Tussock
Altitude [m a.s.l.]
14001300120011001000900800700600500
1.0
0.8
0.6
0.4
0.2
0.0
December 2005January 2006
Period
Pro
itr
g m
ice
acki
n
y o
f t
babi
l
Figure 3.6. Murchison Mountains tracking tunnels – probability of tracking mice as a function of
altitude. Logistic regression model ln[p/(1-p)] = 1.6 – 0.004·Altitude + 1.06·Time

Tracking tunnels
3.3. Discussion
Limitations of tracking tunnels as a tool for monitoring mustelids
The primary purpose of the tracking tunnel surveys in the Murchison Mountains was to compare the stoat density in the treatment and control area. In this regard, the surveys have proven a complete fiasco. The very low number of stoats tracked indicates that tracking tunnels are not a tool sensitive enough. To understand the situation better, we should look at the relationship between stoat density and tracking rate in tracking tunnels, as shown in figure 3.7. A previous study in the Murchison Mountains had found a strong correlation between the number of stoats known to be present through live-trapping / radio-tracking and the numbers of lines tracked (Smith and Jamieson, 2003), although the study was conducted in a year of high stoat numbers. We can assume the tracking rate to be a monotonous index of stoat density, although not necessarily linear – provided the stoat density falls between a low limit LL and a high limit HL. If the stoat density is less than LL, the tracking rate is zero – this appears to be the situation in the Murchison Mountains in years of low stoat numbers. Hypothetically, we could have a stoat density higher than HL, in which case the tracking tunnels would be saturated and would also fail as an index.
0
0.1
0.2
0.3
0.4
0.5
0.6
0.7
0.8
0.9
1
Stoat density
Prop
ortio
n of
tunn
els
trac
ked
LL HL
Figure 3.7. Tracking tunnel tracking rate as a function of stoat density. Diagrammatic representation only; the relationship is not necessarily linear. The line can shift to the left or to the right, as a function of the stoats’ hunger.
Tracking tunnels also share the same limitation as the trap catch index, in that tracking rates are confounded by hunger. They should not be relied upon as an index of abundance for comparisons between seasons, and even comparisons between years might be misleading (Lawrence, 1997).
26

Murchison Mountains stoat trapping
If the aim is to compare stoat numbers between two areas, tracking tunnels are a suitable tool, provided the two areas are surveyed simultaneously, and the stoat density falls between LL and HL in at least one of the two areas. One might conclude that, as stoat tracking rates were low in both treatment and control area, native species in the Murchison Mountains are safe from predation. In this regard, it is interesting to examine the results of the stoat trapping and tracking tunnel monitoring programme in the Clinton Valley, Fiordland National Park. The stoat tracking rate in the tunnels there has dropped from 80% to 0% since the onset of trapping (Edmonds, 2005). Stoat predation on blue ducks has also practically stopped (McMurtrie et al., 2004), while monitored kiwi chicks still suffer up to 100% stoat predation and mohua numbers continue to decline (Edmonds, 2005). This suggests that tracking tunnels are not sensitive enough to monitor the success of a trapping programme at protecting the most vulnerable of our bird species. Kiwi and mohua are present in the Murchison Mountains, but the fact that no stoats were tracked does not mean that these birds are safe from predation.
Possible limitations of the Murchison Mountains tracking tunnel set-up
Tracking tunnels in the Murchisons could still be a valuable monitoring tool if their sensitivity could be increased at low stoat densities. Possible solutions include increasing the survey effort by increasing the number of lines (Brown and Miller, 1998), or increasing the tracking rate by increasing the number of tunnels per line, or the duration of the monitoring period (Murphy et al., 1999). It is unlikely that increasing the number of tunnels or lines in this case would be of any help – the tracking rates being so low, it would take a huge survey effort to achieve any statistical power. Increasing the duration of the monitoring period, e.g. from three days to ten days, might be an option provided the tunnels are not baited with peanut butter, to prevent over-tracking by rodents. This would imply giving up on rodent monitoring. The addition of a detergent to prevent the sponges from drying out would be imperative, but should be tested beforehand as stoats might be deterred by the smell.
The issue has also been raised whether a non-random orientation of the lines would achieve a higher tracking rate, as stoats might follow hand-rails such as rivers and ridges. No evidence supporting this hypothesis was found in scientific literature. A literature review by Cameron et al. (2005) suggests that ferrets prefer moving along linear features, but ends with the remark that this was not supported by trapping data in the Waitaki Valley. An analysis of 572 traps in the Eglinton and Dart valleys failed to find any relationship between stoat trapping success and the geography of the terrain in the vicinity of the traps (DoC, 2001). The analysis in section 2 in this report also suggests that stoats are caught just as frequently on traps on forested slopes as in the vicinity of rivers or on ridges (see figure 2.6). It is unlikely that a different orientation of the lines
27

Tracking tunnels
would achieve a higher tracking rate, and there appears to be no need to alter the current layout.
Some doubts arise from modifications that were made to the standard tracking tunnel protocol without being tested. Gillies and Williams (2002) suggest baiting the tunnels with peanut butter for one night, then with meat for three nights, while tunnels in the Murchisons are baited for three nights with peanut butter and meat. It is possible that stoats are deterred by peanut butter, or that the smell of peanut butter covers the smell of rabbit meat, thus making meat baits ineffective as lures. The #8 wire bracket which restricts the tunnel entrance at either end might also act as a deterrent. It is recommended that a field trial be set up to test whether these changes to an established design reduce the sensitivity of tracking tunnels as a tool for tracking mustelids. A line of 40 tracking tunnels could be set up along the track between Brod Bay, the Control Gates and Rainbow Reach, with half the tunnels baited with peanut butter and rabbit meat, the other half with meat only. A simple 2 test can be used to analyze the data; more than one run might be necessary if tracking rates are low. The experimental layout can also be used to test the effect of detergents to prevent the sponges from drying. If no difference is detected between the two baiting protocols, the tracking tunnel lines in the Murchison Mountains should be run again during the 2006/07 summer, when a stoat plague is expected, then they should be discontinued.
Alternatives to tracking tunnels
Alternative methods of monitoring stoats should be investigated. Tracking of footprints in snow, and walking transects with stoat-trained dogs might be viable options; both have their limitations. The first technique has been used in the Murchisons in the past (Lavers and Mills, 1978), and in the right snow conditions it is likely to be the most sensitive method. However, it requires flexibility (staff ready to leave whenever conditions are right), and the employment of workers competent with winter travel in alpine country. The technique can usually not be applied during summer months, when birds are breeding and the monitoring of stoats is of greatest interest. Walking transects with stoat-trained dogs, on the other hand, is limited by the scarcity of trained dogs, and by the strict necessity of monitoring treatment and control area at the same time, due to the effect of climatic conditions on the persistence of scents.
As an aside, the remains of a stoat’s meal and scats were found by a stoat trained dog in the Snag Burn, in early January 2006. The location was no more than 50m from a radio-tagged kiwi chick (Nikau) and 100m from one of the tracking tunnel lines (TT5). The kiwi chick was still alive at the end of March ’06, and the stoat left no footprints in the tracking tunnels later in January.
28

Murchison Mountains stoat trapping
Tracking rates of rodents and weta
Of interest is the secondary outcome of the tracking tunnel survey, the tracking rate of mice and weta. A first look at the data (figures 3.4 and 3.5) suggests that mice are tracked more often in the control area (32% of tunnels) than in the treatment area (19% of tunnels). A more detailed analysis however shows that mouse density is strongly dependent on altitude, with mice being scarcer at higher elevations. As the tracking tunnel lines in the treatment area (average 910m a.s.l.) are an average 120m higher than in the control area (average 790m a.s.l.), mice are expected to be tracked more often in the latter. The effect of altitude does in fact explain the entire difference between the two areas, and the difference between areas is found to be non significant. Weta, on the other hand, were tracked more frequently in the control area, and more frequently in alpine grasslands than in forest habitat.
The abundance of mice and weta, and their distribution in relation to habitat and altitude, fits with the findings by Smith et al. (2005), who observed that both species are essential components of stoat diet, with weta being most important in alpine grasslands. Surprisingly, however, neither species appears to be more common in the treatment area than in the control area. This suggests that stoats are not having a major impact on either species, possibly another indicator, like the tracking tunnel results, the stoats in the Murchison Mountains are currently at low density.
The relative absence of rats from the tracking tunnel results is probably explained by the high elevation of the survey lines, as rats seem to be most common below 500 – 600m of elevation (see map 5, Appendix D). No tracking tunnel lines are below 670m a.s.l. in the treatment area, while the lowest line in the control area is at 470m a.s.l.
Conclusions
Tracking tunnels are a tool not sensitive enough for tracking mustelids at low densities. Surveys should be still run in the 2006/07 summer, as high stoat numbers are expected after a beech mast event. If a field trial indicates that the tracking tunnel set-up in the Murchison Mountains is not responsible for the low mustelid tracking rates obtained so far, the current tracking tunnel lines should be discontinued after the 2006/07 season. Alternative stoat monitoring methods should be trialed, especially walk-through transects to detect stoat prints in snow.
The rodent monitoring system should be modified to cover all altitudes in forest habitat, from the lakeshore to the bush-line, in both treatment and control area. Some of the current tracking tunnel lines might be used for the purpose, but there is a need for more
29

Tracking tunnels
lines at lower altitudes, where rats are most abundant. The tracking rates of both mice and rats are of interest.
30
Murchison Mountains stoat trapping
4. Takahe breeding success and adult survival
Stoat predation has been identified as a threat to the takahe (DoC, 2002); however, so far it has not been possible to quantify the true impact of predation on the takahe population (Maxwell, 2001; Maxwell and Christie, 2005). Experimental studies have shown that takahe have poorly developed predator recognition compared to the closely related and more common pukeko (Porphyrio porphyrio melanotus), which may leave takahe vulnerable to stoat predation (Bunin and Jamieson, 1996).
In 1972 an integrated research programme was initiated with the aims of establishing the causes of the decline of the takahe population in the Murchison Mountains. The programme adopted a task force approach involving experts in different disciplines; most of the fieldwork was carried out between 1972 and 1984. The main outcome of this research was that insufficient chicks were being produced to offset the death rate of adult birds; 75% of chicks were found to be dying within 3 months of hatching. Initially it was believed that stoat predation was responsible for these high losses, but there was no real evidence to support this view and subsequent research findings changed this opinion. For example in 1976 when stoats were found to be at peak numbers, chick losses were not high and in some parts of the bird’s range losses were negligible. Similarly between May 1981 and January 1983, 20 takahe with radio transmitters were tracked for a total of 5343 bird days and none died through stoat predation. Competition by red deer was identified as being the main problem (Mills, 1990).
During a more recent study over an eight year period, 2 – 10% (n = 51) of radio-tagged takahe recovered dead were killed by stoats. All carcasses involving sign of stoat predation were recovered within 20 months following a peak in beech seedfall. As all tagged birds recovered were non-breeders, the effect of stoats on the breeding population remains undetermined (Maxwell, 2001).
A study of the factors causing takahe egg and chick mortality, carried out in the McKenzie Burn from 1997 to 2001, showed that 6.3% of fertile eggs (n = 63) went missing, with one failed clutch (2 eggs) showing signs of stoat predation. All events of predation, confirmed or suspected, happened during two years of high stoat numbers. No chicks were confirmed to be killed by predators, and video monitoring of ten nests detected one stoat visit, where the stoat attempted to climb onto the back and bite the neck of the incubating parent, but was shrugged off and chased from the nest. One breeding female was killed by a stoat during the last year of the study, while her mate and three-month old chick remained unharmed (Maxwell and Christie, 2005).
31
Takahe breeding success and adult survival
Circumstantial evidence of adult takahe being killed by stoats is found in the notes of field-workers in the Murchison Mountains. The relevant information from notes still available is summarized in table 4.1.
Table 4.1. Summary of Murchison Mountains field-workers notes, showing evidence of stoat predation affecting adult takahe
Date Event 1966-67 One adult and one chick were killed by stoats, one nest was robbed and another adult was
killed, probably by a stoat, in the Takahe Valley alone (Reid, 1967). 01/08/1980 Observer stumbled onto stoat with jaws firmly clenched on the back of an adult takahe’s
neck, eyes closed and body wrapped around under the throat. The bird was raising its wings in an attempt to remove the stoat. Observer grabbed the stoat off the bird and dispatched it with a knife. The wounded takahe had lost several feathers and some blood, but was able to run off with its mate.
25/03/1982 Falls Creek, above Plateau Creek: dead takahe, found intact with skin and feathers, ca. 1 week old. Flesh wound to right side of neck and breast and feet were missing. Further up slope above this a trail of feathers was found – suggesting the bird had been killed there and dragged downhill. Some stoat scats were collected nearby under some rocks in a boulder pile.
18/10/1983 Takahe A63 killed by stoat at 535 448. 01/01/1991 Takahe Valley, female takahe found dead, stoat predated and eaten out on nest. The nest
had large un-hatched eggs shell pieces (i.e. eaten) and several stoat scats in it. It had also been ‘messed up’ and had stoat size tunnels and diggings underneath it. The bird’s stomach was found in a recently used stoat nest under a tussock. A latrine of stoat scats (mainly comprised of insects and grubs) was found 100m from the takahe nest.
18/01/1993 Freshly dead takahe found at 703 611 (Stuart Mountains), almost certainly killed by a stoat. Several puncture wounds in the skin on the back of the neck and bruising at the base of the skull. The muscle on the right breast had been eaten, otherwise the bird was intact.
15/01/1996 Stoat induced injury. Bird found limping on right leg but not severely; his right hock was swollen with a series of small holes which appeared to be tooth marks on the hock scales and just above. The injury looked a few days old but showed no sign of infection.
05/03/1996 Adult takahe found recently dead at 625 359. Suspected to be killed by stoat as there was a puncture (canine teeth) holes on the skin of his head and shield but these areas hadn’t been eaten. No other obvious cause of death.
The strongest evidence that stoat predation is having an impact on takahe derives from a recently completed analysis of the takahe database (Hamilton, 2005; Maxwell, 2005). The results indicate that from 1981 to 2004, for the 22 years where beech seed fall data was collected (no data for 1988) and not including data from 1995, the amount of beech seed fall was negatively correlated with fledging success (Spearman Rank Correlation, rs
= -0.39, n=22, 0.025<p<0.05) and with breeding success of all nests in the Murchison Mountains (Spearman Rank Correlation, rs = -0.44, n=22, 0.025<p<0.01). An analysis with program MARK (Cooch and White, 2005) of adult survival data from 1990 to 2003
32

Murchison Mountains stoat trapping
also showed that beech seed fall was negatively correlated with the overall survival of all birds banded as chicks in the Murchison Mountains (Spearman Rank Correlation, rs = -0.50, n=14, 0.025<p<0.05) and with the survival in first year (i.e. chick to yearling) of wild-raised takahe raised from one-egg clutches (Spearman Rank Correlation, rs = -0.55, n=14, 0.01<p<0.025) (Hamilton, 2005). These results suggest that both breeding success and adult survival are lower in years following beech seeding, when stoat numbers are highest. No information is gained, however, as to how much lower these demographic parameters are compared to a predator free situation.
It thus appears that predation does have an impact on the takahe population, especially in years of high stoat numbers. The question arises, whether the current trapping programme is making any positive difference. In this section, the breeding success and adult survival of takahe are compared in the treatment and control area, three years into the trapping programme.
4.1. Methods
4.1.1. Field techniques
The majority of adult takahe in the Murchison Mountains are banded; a four colour band combination is used, where one of four bands is always metal. Each banded bird can be identified either by colour code, or from the number on the metal band. About twenty adults additionally carry a radio transmitter.
The takahe population in the Murchison Mountains is currently surveyed twice a year: once in October/November, to search for nests, and once in February/March, for a chick survey. During the nest surveys, eggs are candled to test whether they are viable; infertile or addled eggs are removed to induce the pair to renest. During the November survey, eggs have usually hatched in some of the nests already. The survey at the end of summer allows to establish whether the nests located in spring have been successful or not, and how many chicks they have produced. Any young birds that can be captured during the chick survey are banded; birds released from Burwood at the beginning of summer are also banded.
During both surveys, and during any other summer field-work, any sightings of adult birds are accompanied by a reading of the colour bands if this is possible. Dead birds are also recovered. All bird sightings and recoveries are entered in an ACCESS database. Data have been collected for over 20 years.
33
Takahe breeding success and adult survival
4.1.2. Statistical analysis – reproductive success
Reproductive success of the Murchison Mountains takahe population was analyzed from the 1995/96 breeding season to the 2004/05 season; the current stoat trapping programme started in the 2002/03 season. The following measures of reproductive success were compared between different treatment areas:
Hatching success = % of eggs laid that hatched % of fertile eggs that hatched
Fledging success = % hatched eggs that produced chicks alive at >29 days old
Breeding success = % of eggs laid that produced chicks alive at >29 days old % of fertile eggs that produced chicks alive at >29 days old
Eggs transferred to Burwood were removed from the sample used to calculate hatching success. Eggs and chicks transferred to Burwood were removed from the sample used to calculate fledging success and breeding success.
All the above measures are binomial; each egg’s fate has two possible outcomes (hatched / not hatched), and so does each chick’s fate (dead / alive). The data were thus analyzed with a logistic regression model, with the number of eggs hatched (or chicks alive) being the number of successes, the number of eggs laid (or fertile eggs, or eggs hatched) being the number of trials, two main factors (“area” and “time”) as independent variables, and “year” as a factor nested within “time”. The factor “area” has three levels: “treatment area”, “buffer zone” and “un-trapped area”; the latter contains the data for the un-trapped area and minimum disturbance area, all pooled into one group, as sample size for the minimum disturbance area was too small for it to be analyzed separately. The factor “time” has two levels: “before” and “after” the start of the trapping programme. As some trapping was ongoing in the stoat control area during the three years immediately before the start of the current trapping programme, models where the factor “time” has three levels (1995 to 1998, 1999 to 2001, 2002 to 2004) were also trialed; however, when no significant difference between the first and second period was detected, the two periods were grouped together.
A further measure of the overall nesting success was defined as the number of chicks produced divided by the number of nesting pairs. Nesting success between areas was compared using a 2-factor ANOVA test, with “area” (three levels) and “time” (two levels) as fixed factors, and “year” as a random factor nested within “time”. The response (nesting successij) was weighted with the number of nesting pairs in the year i and area j. The program MINITAB 14 was used for all statistical analyses.
34

Murchison Mountains stoat trapping
4.1.3. Statistical analysis – adult survival
Adult survival in the Murchison Mountains takahe population was analyzed from the 1995/96 breeding season to the 2004/05 season; the current stoat trapping programme started in the 2002/03 season. All sightings of adult birds (one year of age or more) since 1995 were used; birds whose first record was in the final year of the dataset (i.e. 2004/05 season) were removed from the analysis.
The program MARK v. 4.2 (Cooch and White, 2005) was used to calculate adult survival. Two models were selected: the Cormack-Jolly-Seber (CJS) model for live resightings only (Cormack, 1964; Jolly, 1965; Seber, 1965) and the Barker model for joint recaptures and dead recoveries (Barker, 1997).
The CJS model makes use of two parameters
i Apparent survivorship between two encounter occasions i and i+1 (apparent because the model cannot tell death and emigration apart)
pi Probability of recapture (given an animal is alive and remains in the study area)
and is based on the following assumptions: Every banded animal present in the population at the time i has the same
probability of recapture pi. Every banded animal in the population immediately after the time i has the same
probability of surviving to time (i+1) Bands are not lost or misread All samples are instantaneous, relative to the interval between occasion i and
(i+1), and each release is made immediately after the sample.
Barker’s model makes use of the following parameters: Si the probability an animal alive at i is alive at i + 1 pi the probability an animal at risk of capture at i is captured at i ri the probability an animal that dies between i and i + 1 is found dead and
the band reported Ri the probability an animal that survives from i to i + 1 is resighted (alive)
some time between i and i + 1. R’i the probability an animal that dies between i and i + 1 without being found
dead is resighted alive between i and i + 1 before it died. Fi the probability an animal at risk of capture at i is at risk of capture at i + 1 F’i the probability an animal not at risk of capture at i is at risk of capture at
i+1.
35

Takahe breeding success and adult survival
Barker’s model is a multi-state model; it separates the probability of survival from the probability of moving between strata (i.e. locations, breeding status…), and is based on the following assumptions (Cooch and White, 2005):
survival from time i to i+1 does not depend on stratum at time i+1. all individuals make the transitions between strata at the same time (relative to the
start or end of the time interval), or if not, that the distribution of the transitions is known.
apart from group and time effects, the reporting rate of marks from dead animals depends only on the stratum that the animal was in at the immediately preceding live-capture occasion.
For both the CJS and Barker’s models, a takahe encounter history file was created as input for MARK, containing 10 encounter occasions (years 1995 to 2004) and four groups (trapped area, un-trapped area, buffer zone and minimum disturbance area). All sightings and recoveries during one field-season were pooled into one encounter occasion; the time span between two encounter occasions is approximated as one year. Birds that had moved from one area to another were removed from the sample. Dead recoveries were counted as resightings for the CJS models, unless the bird had been dead since the previous season. For Barker’s model, the probability of recapture p was set to 0, as birds are captured only for banding (initial encounter); all other encounters are either live resightings or dead recoveries.
Several group-and time-dependent models were fitted to the dataset, by modifying the Parameter Index Matrix (PIM) and the Design Matrix (see Appendix G). A bootstrap Goodness of Fit (GOF) test was performed on the most general model (the one including all group and time effects) with 10,000 simulations; the ‘variance inflation factor’ was then calculated to account for overdispersion (or underdispersion) of the data:
= observed deviance / mean simulated deviance
As a working “rule of thumb”, provided 3, we can feel comfortable that our model fits the data quite well (Cooch and White, 2005). MARK’s results were adjusted for , and the models sorted according to the Quasi Akaike Information Criterion (QAICc). The model with the lowest QAICc was selected as the best model.
36
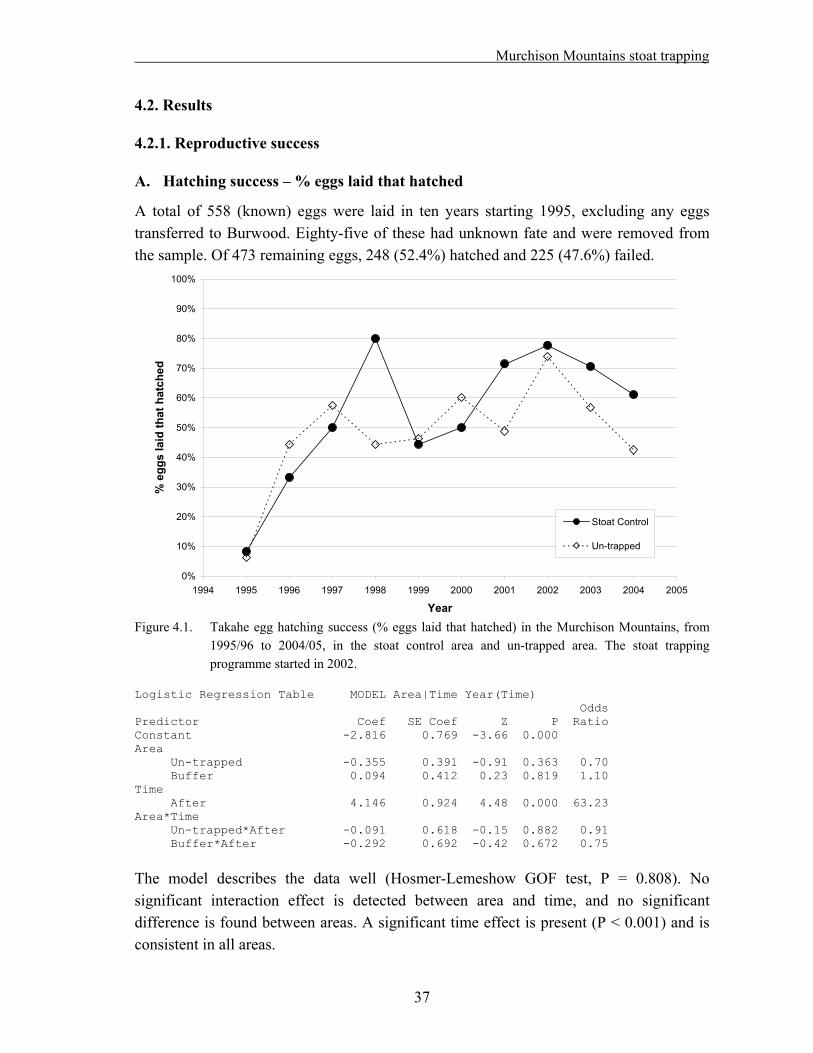
Murchison Mountains stoat trapping
37
4.2. Results
4.2.1. Reproductive success
A. Hatching success – % eggs laid that hatched
A total of 558 (known) eggs were laid in ten years starting 1995, excluding any eggs transferred to Burwood. Eighty-five of these had unknown fate and were removed from the sample. Of 473 remaining eggs, 248 (52.4%) hatched and 225 (47.6%) failed.
0%
10%
20%
30%
40%
50%
60%
70%
80%
90%
100%
1994 1995 1996 1997 1998 1999 2000 2001 2002 2003 2004 2005
Year
% e
ggs
laid
that
hat
ched
Stoat Control
Un-trapped
Figure 4.1. Takahe egg hatching success (% eggs laid that hatched) in the Murchison Mountains, from
1995/96 to 2004/05, in the stoat control area and un-trapped area. The stoat trapping programme started in 2002.
Logistic Regression Table MODEL Area|Time Year(Time) Odds Predictor Coef SE Coef Z P Ratio Constant -2.816 0.769 -3.66 0.000 Area Un-trapped -0.355 0.391 -0.91 0.363 0.70 Buffer 0.094 0.412 0.23 0.819 1.10 Time After 4.146 0.924 4.48 0.000 63.23 Area*Time Un-trapped*After -0.091 0.618 -0.15 0.882 0.91 Buffer*After -0.292 0.692 -0.42 0.672 0.75
The model describes the data well (Hosmer-Lemeshow GOF test, P = 0.808). No significant interaction effect is detected between area and time, and no significant difference is found between areas. A significant time effect is present (P < 0.001) and is consistent in all areas.
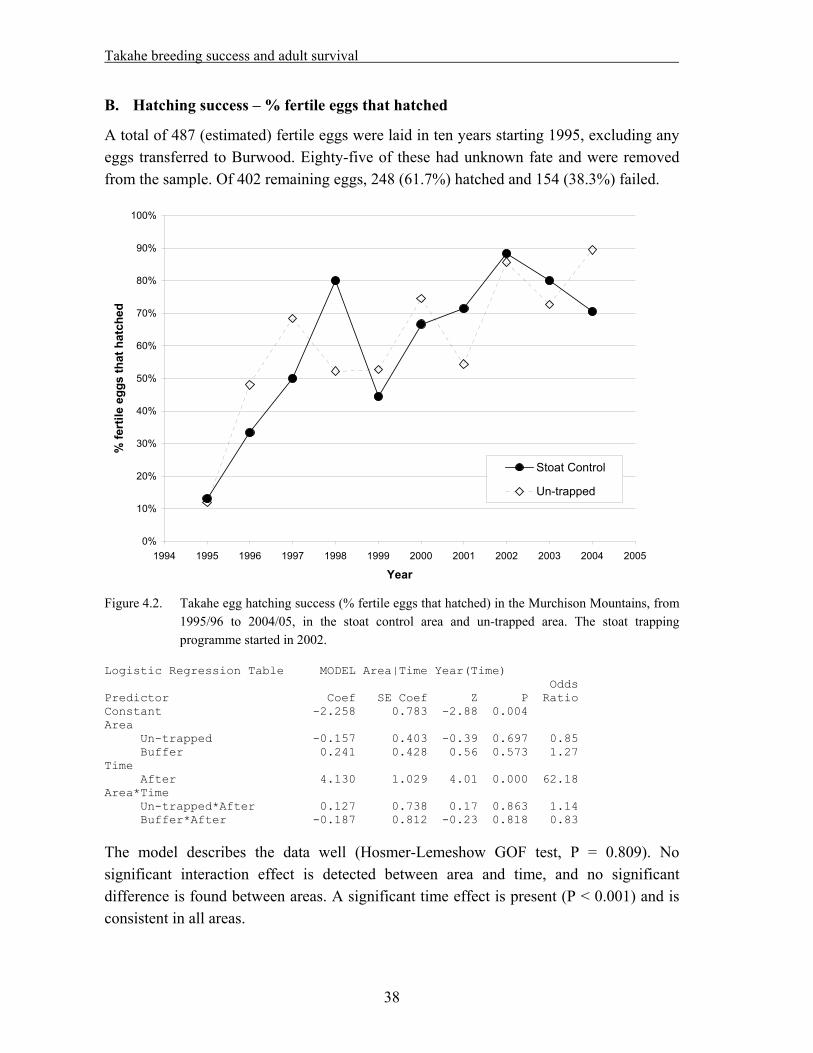
Takahe breeding success and adult survival
38
B. Hatching success – % fertile eggs that hatched
A total of 487 (estimated) fertile eggs were laid in ten years starting 1995, excluding any eggs transferred to Burwood. Eighty-five of these had unknown fate and were removed from the sample. Of 402 remaining eggs, 248 (61.7%) hatched and 154 (38.3%) failed.
0%
10%
20%
30%
40%
50%
60%
70%
80%
90%
100%
1994 1995 1996 1997 1998 1999 2000 2001 2002 2003 2004 2005
Year
% fe
rtile
egg
s th
at h
atch
ed
Stoat Control
Un-trapped
Figure 4.2. Takahe egg hatching success (% fertile eggs that hatched) in the Murchison Mountains, from
1995/96 to 2004/05, in the stoat control area and un-trapped area. The stoat trapping programme started in 2002.
Logistic Regression Table MODEL Area|Time Year(Time) Odds Predictor Coef SE Coef Z P Ratio Constant -2.258 0.783 -2.88 0.004 Area Un-trapped -0.157 0.403 -0.39 0.697 0.85 Buffer 0.241 0.428 0.56 0.573 1.27 Time After 4.130 1.029 4.01 0.000 62.18 Area*Time Un-trapped*After 0.127 0.738 0.17 0.863 1.14 Buffer*After -0.187 0.812 -0.23 0.818 0.83
The model describes the data well (Hosmer-Lemeshow GOF test, P = 0.809). No significant interaction effect is detected between area and time, and no significant difference is found between areas. A significant time effect is present (P < 0.001) and is consistent in all areas.
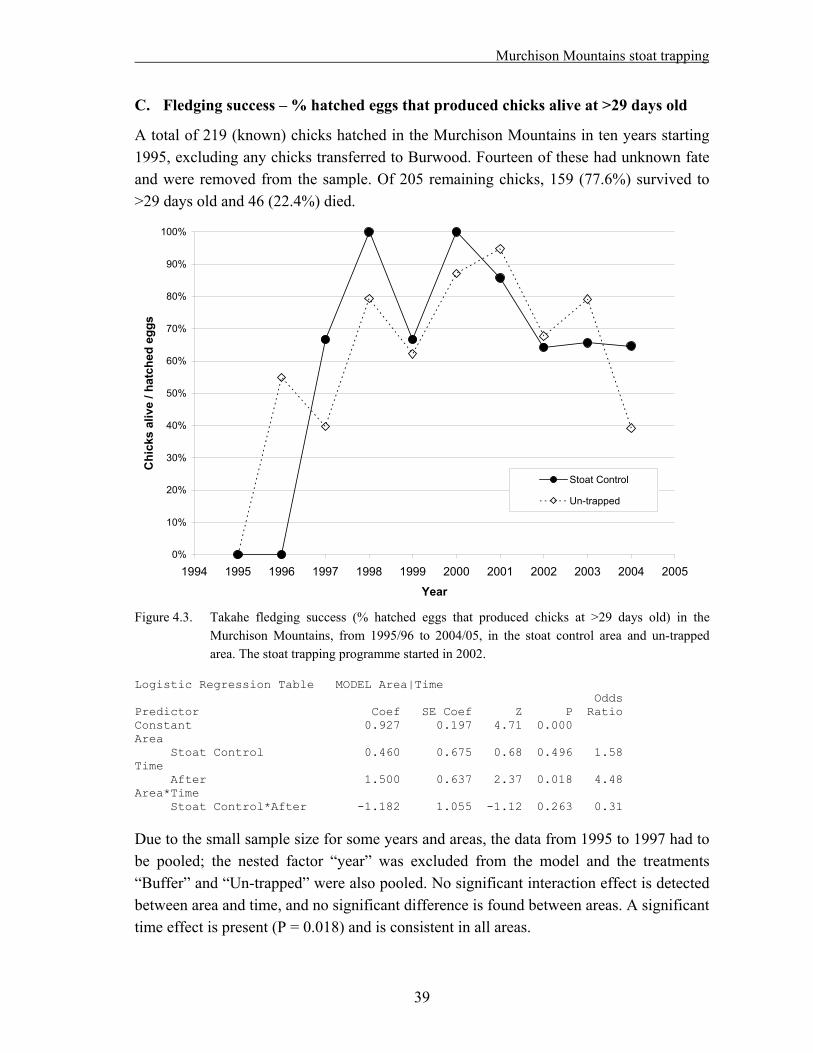
Murchison Mountains stoat trapping
39
C. Fledging success – % hatched eggs that produced chicks alive at >29 days old
A total of 219 (known) chicks hatched in the Murchison Mountains in ten years starting 1995, excluding any chicks transferred to Burwood. Fourteen of these had unknown fate and were removed from the sample. Of 205 remaining chicks, 159 (77.6%) survived to >29 days old and 46 (22.4%) died.
0%
10%
20%
30%
40%
50%
60%
70%
80%
90%
100%
1994 1995 1996 1997 1998 1999 2000 2001 2002 2003 2004 2005
Year
Chi
ckliv
etc
hgg
sed
e
/ ha
s a
Stoat Control
Un-trapped Figure 4.3. Takahe fledging success (% hatched eggs that produced chicks at >29 days old) in the
Murchison Mountains, from 1995/96 to 2004/05, in the stoat control area and un-trapped area. The stoat trapping programme started in 2002.
Logistic Regression Table MODEL Area|Time Odds Predictor Coef SE Coef Z P Ratio Constant 0.927 0.197 4.71 0.000 Area Stoat Control 0.460 0.675 0.68 0.496 1.58 Time After 1.500 0.637 2.37 0.018 4.48 Area*Time Stoat Control*After -1.182 1.055 -1.12 0.263 0.31
Due to the small sample size for some years and areas, the data from 1995 to 1997 had to be pooled; the nested factor “year” was excluded from the model and the treatments “Buffer” and “Un-trapped” were also pooled. No significant interaction effect is detected between area and time, and no significant difference is found between areas. A significant time effect is present (P = 0.018) and is consistent in all areas.
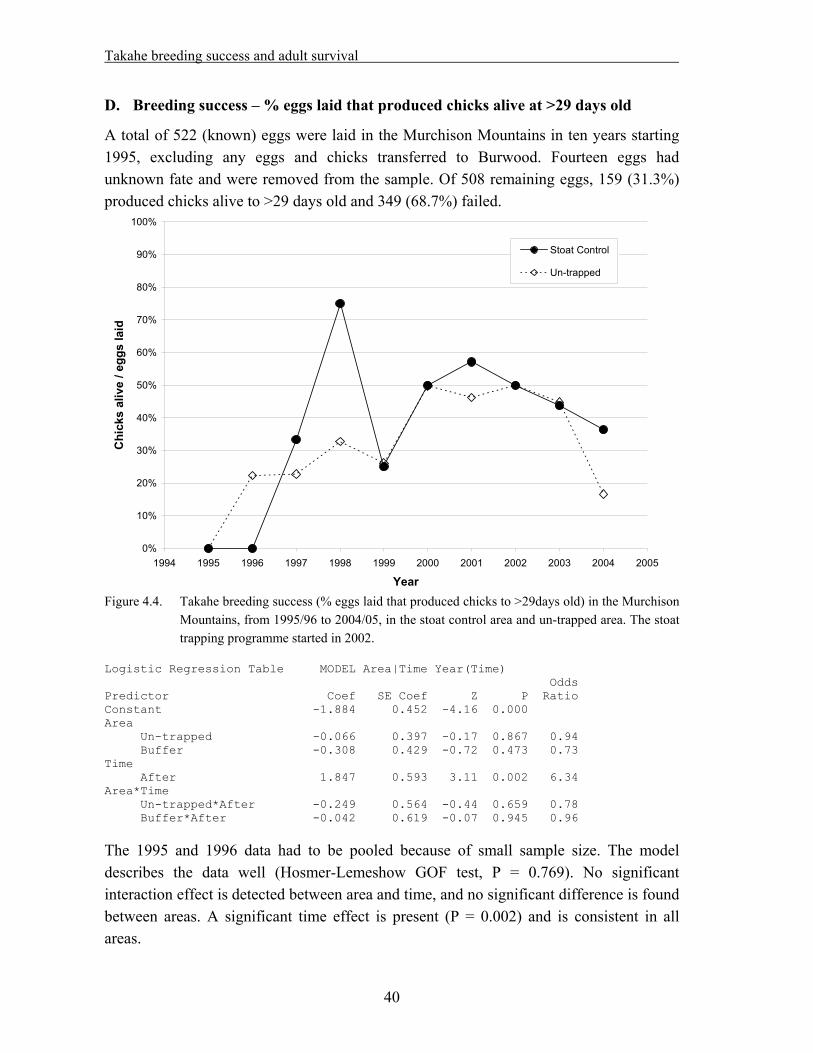
Takahe breeding success and adult survival
40
D. Breeding success – % eggs laid that produced chicks alive at >29 days old
A total of 522 (known) eggs were laid in the Murchison Mountains in ten years starting 1995, excluding any eggs and chicks transferred to Burwood. Fourteen eggs had unknown fate and were removed from the sample. Of 508 remaining eggs, 159 (31.3%) produced chicks alive to >29 days old and 349 (68.7%) failed.
0%
10%
20%
30%
40%
50%
60%
70%
80%
90%
100%
1994 1995 1996 1997 1998 1999 2000 2001 2002 2003 2004 2005
Year
Chi
cks
aliv
e / e
ggs
laid
Stoat Control
Un-trapped
Figure 4.4. Takahe breeding success (% eggs laid that produced chicks to >29days old) in the Murchison
Mountains, from 1995/96 to 2004/05, in the stoat control area and un-trapped area. The stoat trapping programme started in 2002.
Logistic Regression Table MODEL Area|Time Year(Time) Odds Predictor Coef SE Coef Z P Ratio Constant -1.884 0.452 -4.16 0.000 Area Un-trapped -0.066 0.397 -0.17 0.867 0.94 Buffer -0.308 0.429 -0.72 0.473 0.73 Time After 1.847 0.593 3.11 0.002 6.34 Area*Time Un-trapped*After -0.249 0.564 -0.44 0.659 0.78 Buffer*After -0.042 0.619 -0.07 0.945 0.96
The 1995 and 1996 data had to be pooled because of small sample size. The model describes the data well (Hosmer-Lemeshow GOF test, P = 0.769). No significant interaction effect is detected between area and time, and no significant difference is found between areas. A significant time effect is present (P = 0.002) and is consistent in all areas.
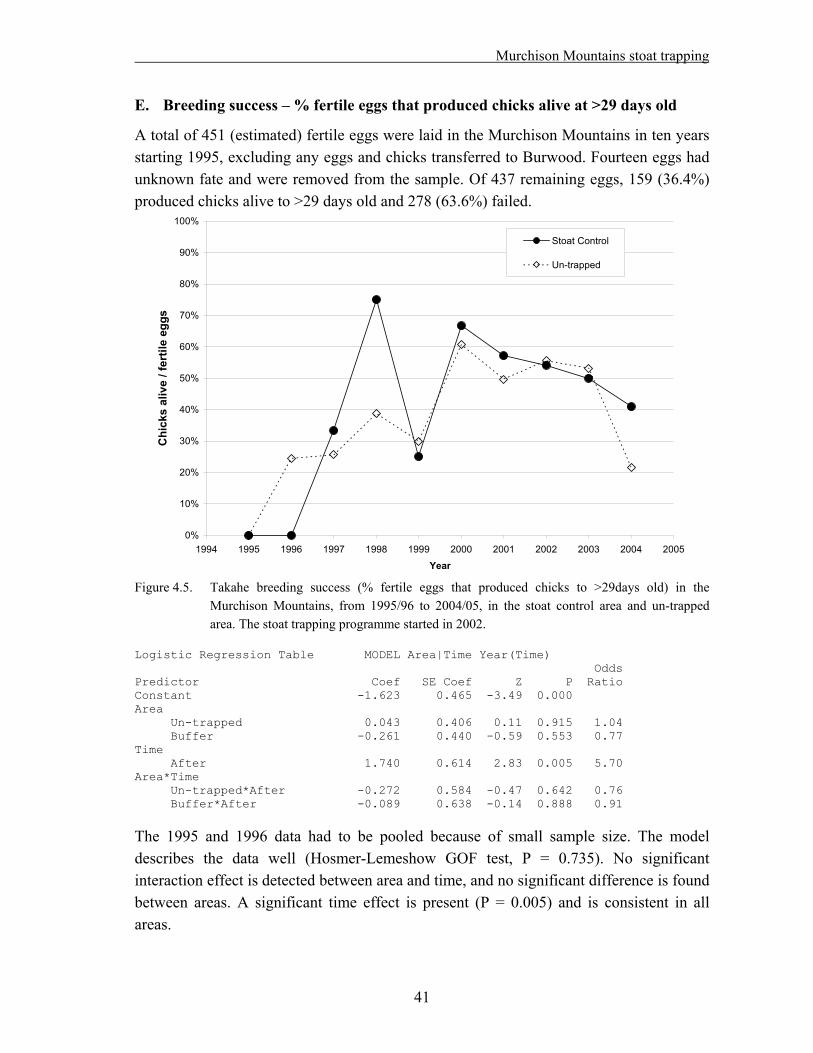
Murchison Mountains stoat trapping
41
E. Breeding success – % fertile eggs that produced chicks alive at >29 days old
A total of 451 (estimated) fertile eggs were laid in the Murchison Mountains in ten years starting 1995, excluding any eggs and chicks transferred to Burwood. Fourteen eggs had unknown fate and were removed from the sample. Of 437 remaining eggs, 159 (36.4%) produced chicks alive to >29 days old and 278 (63.6%) failed.
0%
10%
20%
30%
40%
50%
60%
70%
80%
90%
100%
1994 1995 1996 1997 1998 1999 2000 2001 2002 2003 2004 2005
Year
Chi
cks
aliv
e / f
ertil
e eg
gs
Stoat Control
Un-trapped
Figure 4.5. Takahe breeding success (% fertile eggs that produced chicks to >29days old) in the Murchison Mountains, from 1995/96 to 2004/05, in the stoat control area and un-trapped area. The stoat trapping programme started in 2002.
Logistic Regression Table MODEL Area|Time Year(Time) Odds Predictor Coef SE Coef Z P Ratio Constant -1.623 0.465 -3.49 0.000 Area Un-trapped 0.043 0.406 0.11 0.915 1.04 Buffer -0.261 0.440 -0.59 0.553 0.77 Time After 1.740 0.614 2.83 0.005 5.70 Area*Time Un-trapped*After -0.272 0.584 -0.47 0.642 0.76 Buffer*After -0.089 0.638 -0.14 0.888 0.91
The 1995 and 1996 data had to be pooled because of small sample size. The model describes the data well (Hosmer-Lemeshow GOF test, P = 0.735). No significant interaction effect is detected between area and time, and no significant difference is found between areas. A significant time effect is present (P = 0.005) and is consistent in all areas.
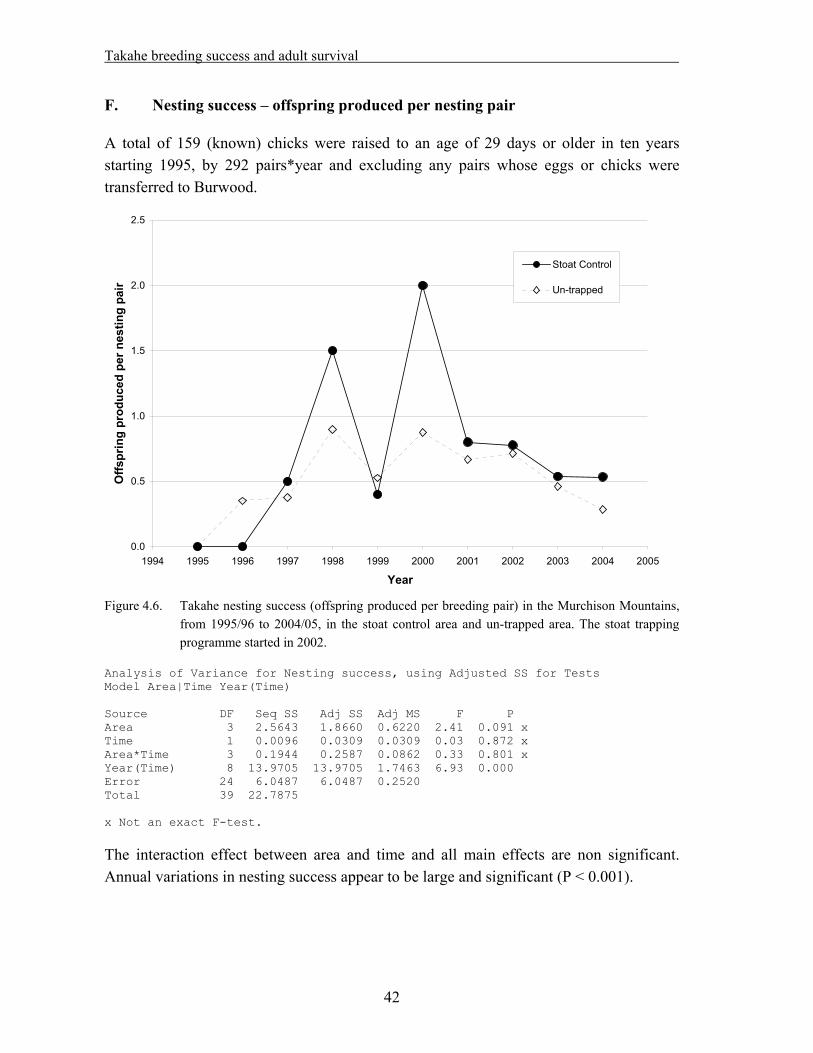
Takahe breeding success and adult survival
42
F. Nesting success – offspring produced per nesting pair
A total of 159 (known) chicks were raised to an age of 29 days or older in ten years starting 1995, by 292 pairs*year and excluding any pairs whose eggs or chicks were transferred to Burwood.
0.0
0.5
1.0
1.5
2.0
2.5
1994 1995 1996 1997 1998 1999 2000 2001 2002 2003 2004 2005
Year
Offs
prin
g pr
oduc
ed p
er n
estin
g pa
ir
Stoat Control
Un-trapped
Figure 4.6. Takahe nesting success (offspring produced per breeding pair) in the Murchison Mountains,
from 1995/96 to 2004/05, in the stoat control area and un-trapped area. The stoat trapping programme started in 2002.
Analysis of Variance for Nesting success, using Adjusted SS for Tests Model Area|Time Year(Time) Source DF Seq SS Adj SS Adj MS F P Area 3 2.5643 1.8660 0.6220 2.41 0.091 x Time 1 0.0096 0.0309 0.0309 0.03 0.872 x Area*Time 3 0.1944 0.2587 0.0862 0.33 0.801 x Year(Time) 8 13.9705 13.9705 1.7463 6.93 0.000 Error 24 6.0487 6.0487 0.2520 Total 39 22.7875 x Not an exact F-test.
The interaction effect between area and time and all main effects are non significant. Annual variations in nesting success appear to be large and significant (P < 0.001).

Murchison Mountains stoat trapping
4.2.2. Adult survival
A total of 677 useful live sightings and 53 dead recoveries were reported in the Murchison Mountains during ten years starting 1995. Multiple sightings of one bird within the same season were pooled into one useful sighting. Seventeen dead recoveries out of 53 were recorded during the 1995/96 season, with the remaining 36 recoveries uniformly scattered over the following nine seasons. Life histories were compiled for 265 individual birds: 71 in the stoat control area, 97 in the un-trapped area, 69 in the buffer zone and 28 in the minimum disturbance area.
A summary of all models tested with MARK, ranked according to the AICc (or QAICc), is tabled in Appendix G. The mean apparent survival rate calculated with the highest ranked CJS model is 80.4% (SE = 5.4%); the survival rate is 80.8% (SE = 4.3%) according to the highest ranked of Barker’s models. This compares well with an estimate of 80.3% by Hamilton (2005) for the period 1991 to 2003.
Barker’s model and the CJS model consistently yielded the same results. The average paired difference of the yearly survivorship for two groups of birds calculated with the highest ranked of the two models is 1.36%; a paired t-test shows that the difference is not significant (n = 18, t = 1.03, p = 0.32). Barker’s model makes the best use of the available data in that it accounts for dead recoveries, but it is also a more complex model, and contains a number of parameters of difficult interpretation. The CJS model was therefore selected as an appropriate model for this analysis, and is the only model referred to from here on.
The observed deviance for the most general CJS model is 538.8; the simulated deviance for the same model (bootstrap GOF, 10,000 simulations) is 412.5. The ratio of the deviances is = 1.30, which indicates a reasonably good model fit.
The highest ranked model has a constant probability of recapture p = 76.4%, while the survivorship is expressed by the following equation:
)(logit 10 tyTrapping
Where 0 = 0.62, 1 = 0.75 are constants; Trapping is 1 for birds in the stoat control area after the start of the trapping programme (2002/03 season), 0 otherwise; y(t) is an environmental factor, identical for all groups but different every year.
The model was created by modifying the Design Matrix in MARK. The yearly survival rates calculated by the model are shown in Figure 4.7.
43
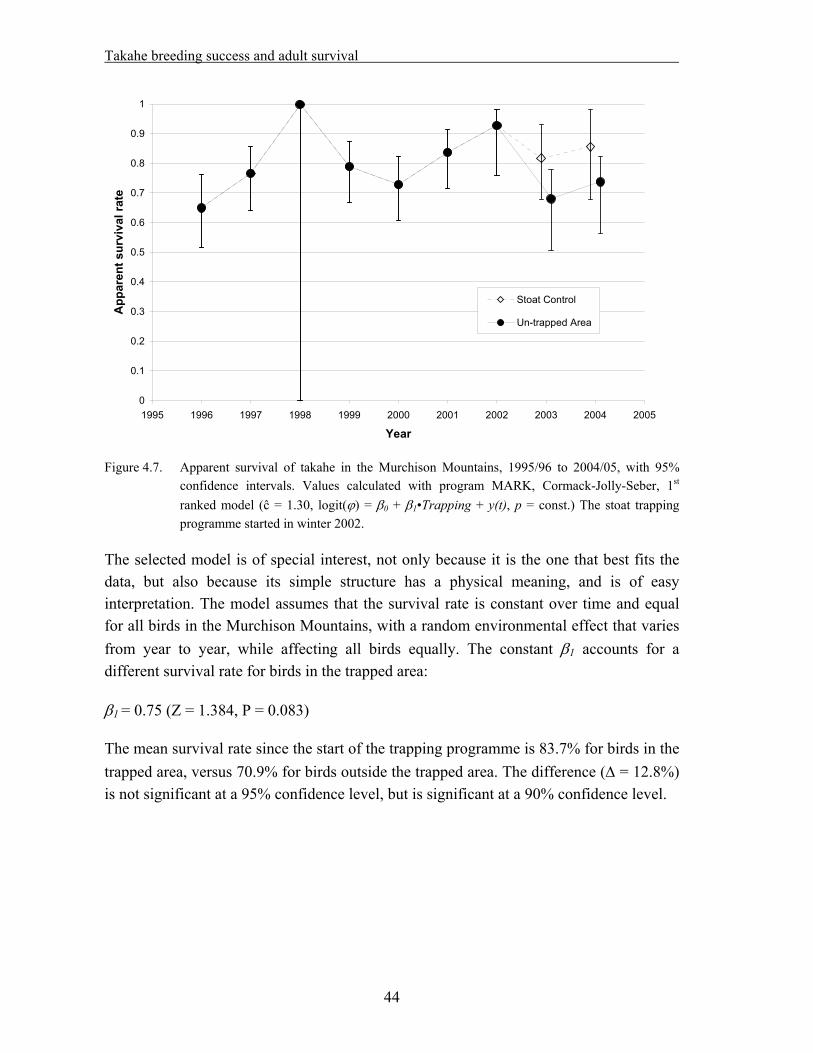
Takahe breeding success and adult survival
0
0.1
0.2
0.3
0.4
0.5
0.6
0.7
0.8
0.9
1
1995 1996 1997 1998 1999 2000 2001 2002 2003 2004 2005
Year
App
aren
t sur
viva
l rat
e
Stoat Control
Un-trapped Area
Figure 4.7. Apparent survival of takahe in the Murchison Mountains, 1995/96 to 2004/05, with 95%
confidence intervals. Values calculated with program MARK, Cormack-Jolly-Seber, 1st ranked model ( = 1.30, logit( ) = 0 + 1•Trapping + y(t), p = const.) The stoat trapping programme started in winter 2002.
The selected model is of special interest, not only because it is the one that best fits the data, but also because its simple structure has a physical meaning, and is of easy interpretation. The model assumes that the survival rate is constant over time and equal for all birds in the Murchison Mountains, with a random environmental effect that varies from year to year, while affecting all birds equally. The constant 1 accounts for a different survival rate for birds in the trapped area:
1 = 0.75 (Z = 1.384, P = 0.083)
The mean survival rate since the start of the trapping programme is 83.7% for birds in the trapped area, versus 70.9% for birds outside the trapped area. The difference ( = 12.8%) is not significant at a 95% confidence level, but is significant at a 90% confidence level.
44
Murchison Mountains stoat trapping
4.3. Discussion
Takahe reproductive success
An analysis of the takahe reproductive success over the last ten years failed to detect any positive effect of stoat control, three years into the trapping programme. There are two possible explanations for this:
a) The trapping makes no difference to takahe reproductive success.
b) The sample size is too small, thus making any statistical analysis not powerful enough to detect a difference.
The first option has, again, two possible explanations:
a1) Stoat predation on takahe eggs and chicks is a rare event and has no significant impact on takahe breeding success.
a2) Any positive effect of reduced stoat predation is compensated by other factors having a larger impact on takahe breeding success since the start of trapping, such as increased numbers of meso-predators.
Regarding the last point, it should be noticed that weka (Gallirallus australis) have also been known to prey on takahe chicks and eggs; records suggest that individual weka may learn to prey on takahe eggs and do so repeatedly (DoC, 2002). Weka populations throughout the country are seriously affected by stoat predation (Bramley, 1996; Beauchamp et al., 1999), and episodes of weka predation on blue duck nests have been observed in the Clinton and Arthur valleys for the first time after the start of a stoat control programme (McMurtrie et al., 2004). Weka were considered to be in low numbers in the eastern sector of the Murchison Mountains (DoC, 2002; Crouchley pers. comm.), but they have positively been observed in the Mystery Burn, Takahe Valley, Ettrick Burn (treatment area) and in the Snag Burn (control area) during the summer 2005/06 (pers. obs.). While an increased impact of meso-predators on takahe breeding success is mere speculation, the possibility should not be ruled out.
Takahe adult survival
The results produced by the program MARK show a positive effect of trapping on takahe adult survival that is near significance level. The possibility has been suggested before that stoats might be a greater threat to takahe after nesting time, during autumn when birds are ranging with their young through the alpine areas, or during winter when takahe descend to valley-floor habitats where stoats are more numerous (Maxwell and Christie, 2005). The sample size analyzed so far is too small to draw any firm conclusions.
45
Takahe breeding success and adult survival
Quality of the data
There are a few possible sources of errors in the data used in the adult survival study:
About 15% of banded birds have lost one or more colour bands, making identification ambiguous.
Bands are read wrong in the field. Reading colour bands on wild birds can be notoriously difficult, especially since takahe are often running, and their legs are mostly visible only for a fraction of a second.
Data are typed wrong into the database.
It might be easy (or not) to develop a better glue or solvent for colour bands – one white band was found during the nest surveys, fully intact and rolled up, but with no adhesive left (pers. obs.).
A step that really can be improved is, however, data entry into the database. A few (not many) typos were noticed (band numbers typed wrong); some difficulties were created by the fact that a computer can’t tell, for instance, territory “D6” from “D 6” or “D06” – in ACCESS or EXCEL, these are effectively three different territories. Much time was spent by workers trying to fix typos and errors, or manually changing data to make them consistent in format. A better user interface would allow users not to type in a territory name, but to select it from a drop-down menu; the database should only allow entry of band numbers of existing birds (known to be alive), and prompt users to create a record for a newly banded bird when an unrecognized band number is entered. The prospect of programming such an interface might sound daunting to a biologist or a manager, but would be an easy match for a software developer. It is recommended that a professional software developing company be contracted to create a “fool-proof” user interface for the takahe database to ensure consistency of data entered by different users.
Conclusions
With data from three seasons only analyzed so far, it is really too soon to draw any conclusions on the effectiveness of stoat control as a tool for increasing takahe reproductive success and adult survival. This is especially true since no stoat plague years have been recorded since the start of the trapping programme.
It is important that the stoat trapping programme be continued for at least five more years as originally planned; ideally, it should cover at least two stoat plague years. It is also important that takahe nest and chick surveys and recording of adult sightings be continued for the whole duration of the study.
46
Murchison Mountains stoat trapping
5. Mohua relative abundance
The yellowhead or mohua (Mohoua ochrocephala) is listed as “Nationally Endangered” in the New Zealand Threat Classification System Lists (Hitchmough, 2002), but is still present in good numbers in the Murchison Mountains. Most monitored populations in the South Island have been declining in recent years, and some have become locally extinct; marked declines and population crashes have been shown to coincide with stoat irruptions (O’Donnell, 1996).
Mohua are particularly vulnerable to stoats as they nest in holes, have long incubation periods, and nest in late spring and summer, when stoat numbers are highest. The effect of predation on the population is made worse by the fact that only females incubate, leaving a high proportion of males in populations surviving stoat plagues (Elliott, 1996a, 1996b).
Trapping in the Eglinton Valley, Fiordland National Park, has proved effective at significantly reducing predation on breeding mohua during a stoat irruption in 1990. Eighty percent of the nests in the trapped area fledged young, compared with only 36% in the un-trapped area (O’Donnell et al., 1996). Ongoing trapping maintained stoat predation on mohua at low levels during the following years; however, the mohua population in the Eglinton was all but wiped out during a rat plague in 2000/2001 (Dilks et al., 2003; Dilks, 2005).
In 2002, twenty transect lines were set up in the Murchison Mountains (ten transects in each treatment and control area) for monitoring mohua numbers, according to the protocol developed by Lawrence (2002). Mohua surveys were run from 2002 to 2004, to assess if the population is benefiting from the stoat trapping programme. Here, the results of the surveys in the Murchison Mountains are analyzed and discussed.
47

Mohua relative abundance
5.1. Methods
5.1.1. Field techniques
Twenty transects, each 1km long, were set up in the Murchison Mountains in 2002; ten transects in the Ettrick Burn (treatment area), and ten transects in the Snag Burn (control area) (see map Appendix A). Transect 1 in the Snag Burn was moved to a different location after the 2003 survey.
The method for the walk through surveys is based on the protocol developed by Lawrence (2002), and is described in the report by Willans (2002): • Two surveyors in each group, both surveying all ten transects to reduce observer bias. • Surveying begins at 9 am and finishes at 5 pm. An hour off between 12 – 1 pm, for
lunch and to reposition. • 1 km transects walking slowly (0.5-0.8 hour/km). Each transect follows on
immediately after the previous transect. • When mohua are heard or seen:
The number of mohua groups and the number of birds in each groups are recorded. The approximate distance and direction of the mohua (group) from the transect are recorded.
• No form of soliciting is to occur. • Each transect is repeated four times, with each repetition occurring at a different time
of the day. • At the beginning and in the middle of each transect two five minute bird count are
completed. • For each transect, start time and finish time, weather conditions and river noise are
recorded.
Walk through surveys were completed in October 2002, 2003 and 2004. The observers for each year’s survey are recorded in Table 5.1.
Table 5.1. Observers in Murchison Mountains mohua surveys, 2002 to 2004
Ettrick Burn Snag Burn 2002 Hannah Edmonds
John Henderson Megan Willans Greg Coates
2003 Jane Maxwell John Henderson
Megan Willans Jenny Willans
2004 Jane Tansell Richard Ewans
Sue Lake Fraser Maddigan
48
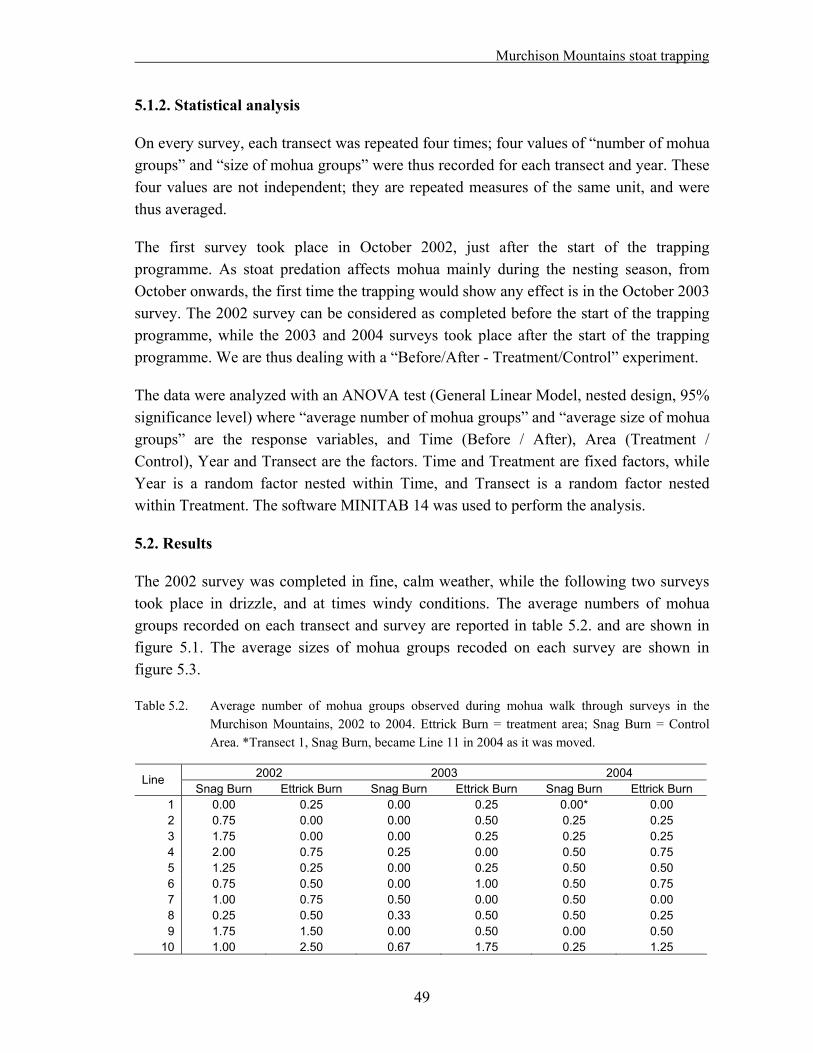
Murchison Mountains stoat trapping
5.1.2. Statistical analysis
On every survey, each transect was repeated four times; four values of “number of mohua groups” and “size of mohua groups” were thus recorded for each transect and year. These four values are not independent; they are repeated measures of the same unit, and were thus averaged.
The first survey took place in October 2002, just after the start of the trapping programme. As stoat predation affects mohua mainly during the nesting season, from October onwards, the first time the trapping would show any effect is in the October 2003 survey. The 2002 survey can be considered as completed before the start of the trapping programme, while the 2003 and 2004 surveys took place after the start of the trapping programme. We are thus dealing with a “Before/After - Treatment/Control” experiment.
The data were analyzed with an ANOVA test (General Linear Model, nested design, 95% significance level) where “average number of mohua groups” and “average size of mohua groups” are the response variables, and Time (Before / After), Area (Treatment / Control), Year and Transect are the factors. Time and Treatment are fixed factors, while Year is a random factor nested within Time, and Transect is a random factor nested within Treatment. The software MINITAB 14 was used to perform the analysis.
5.2. Results
The 2002 survey was completed in fine, calm weather, while the following two surveys took place in drizzle, and at times windy conditions. The average numbers of mohua groups recorded on each transect and survey are reported in table 5.2. and are shown in figure 5.1. The average sizes of mohua groups recoded on each survey are shown in figure 5.3.
Table 5.2. Average number of mohua groups observed during mohua walk through surveys in the Murchison Mountains, 2002 to 2004. Ettrick Burn = treatment area; Snag Burn = Control Area. *Transect 1, Snag Burn, became Line 11 in 2004 as it was moved.
2002 2003 2004 Line Snag Burn Ettrick Burn Snag Burn Ettrick Burn Snag Burn Ettrick Burn
1 0.00 0.25 0.00 0.25 0.00* 0.00 2 0.75 0.00 0.00 0.50 0.25 0.25 3 1.75 0.00 0.00 0.25 0.25 0.25 4 2.00 0.75 0.25 0.00 0.50 0.75 5 1.25 0.25 0.00 0.25 0.50 0.50 6 0.75 0.50 0.00 1.00 0.50 0.75 7 1.00 0.75 0.50 0.00 0.50 0.00 8 0.25 0.50 0.33 0.50 0.50 0.25 9 1.75 1.50 0.00 0.50 0.00 0.50
10 1.00 2.50 0.67 1.75 0.25 1.25
49
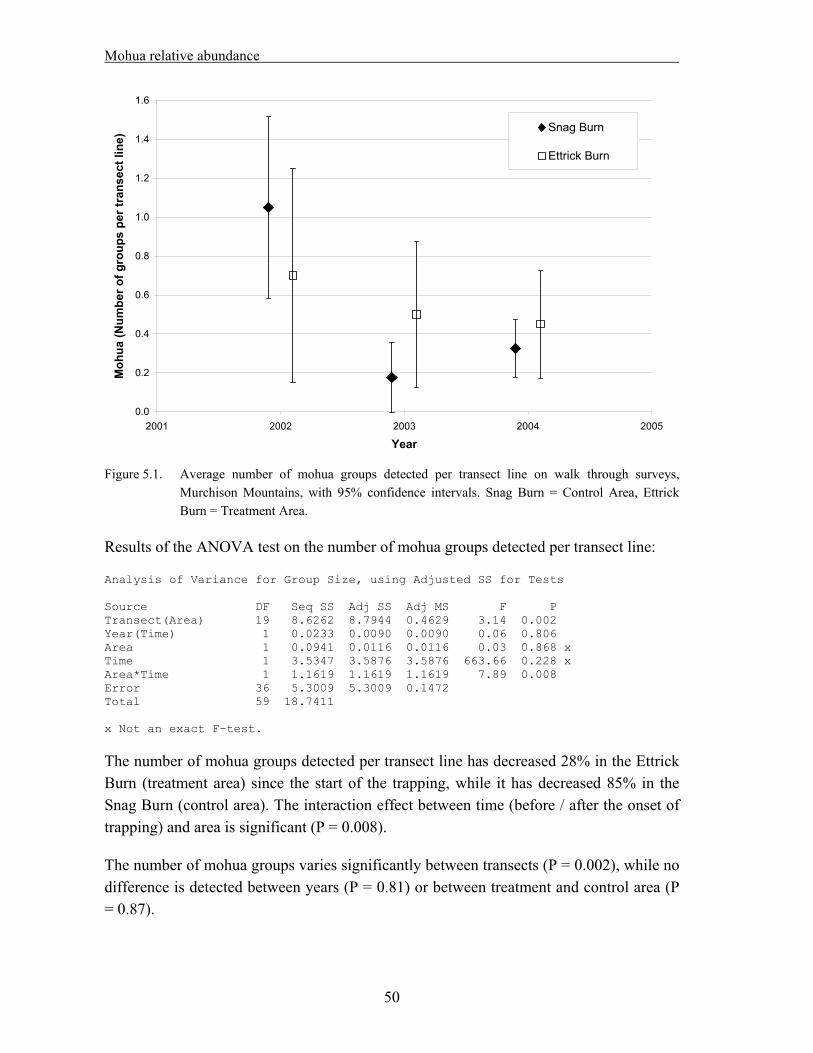
Mohua relative abundance
50
0.0
0.2
0.4
0.6
0.8
1.0
1.2
1.4
1.6
2001 2002 2003 2004 2005
Year
Moh
ua (N
umbe
r of g
roup
s pe
r tra
nsec
t lin
e) Snag Burn
Ettrick Burn
Figure 5.1. Average number of mohua groups detected per transect line on walk through surveys,
Murchison Mountains, with 95% confidence intervals. Snag Burn = Control Area, Ettrick Burn = Treatment Area.
Results of the ANOVA test on the number of mohua groups detected per transect line: Analysis of Variance for Group Size, using Adjusted SS for Tests Source DF Seq SS Adj SS Adj MS F P Transect(Area) 19 8.6262 8.7944 0.4629 3.14 0.002 Year(Time) 1 0.0233 0.0090 0.0090 0.06 0.806 Area 1 0.0941 0.0116 0.0116 0.03 0.868 x Time 1 3.5347 3.5876 3.5876 663.66 0.228 x Area*Time 1 1.1619 1.1619 1.1619 7.89 0.008 Error 36 5.3009 5.3009 0.1472 Total 59 18.7411 x Not an exact F-test.
The number of mohua groups detected per transect line has decreased 28% in the Ettrick Burn (treatment area) since the start of the trapping, while it has decreased 85% in the Snag Burn (control area). The interaction effect between time (before / after the onset of trapping) and area is significant (P = 0.008).
The number of mohua groups varies significantly between transects (P = 0.002), while no difference is detected between years (P = 0.81) or between treatment and control area (P = 0.87).
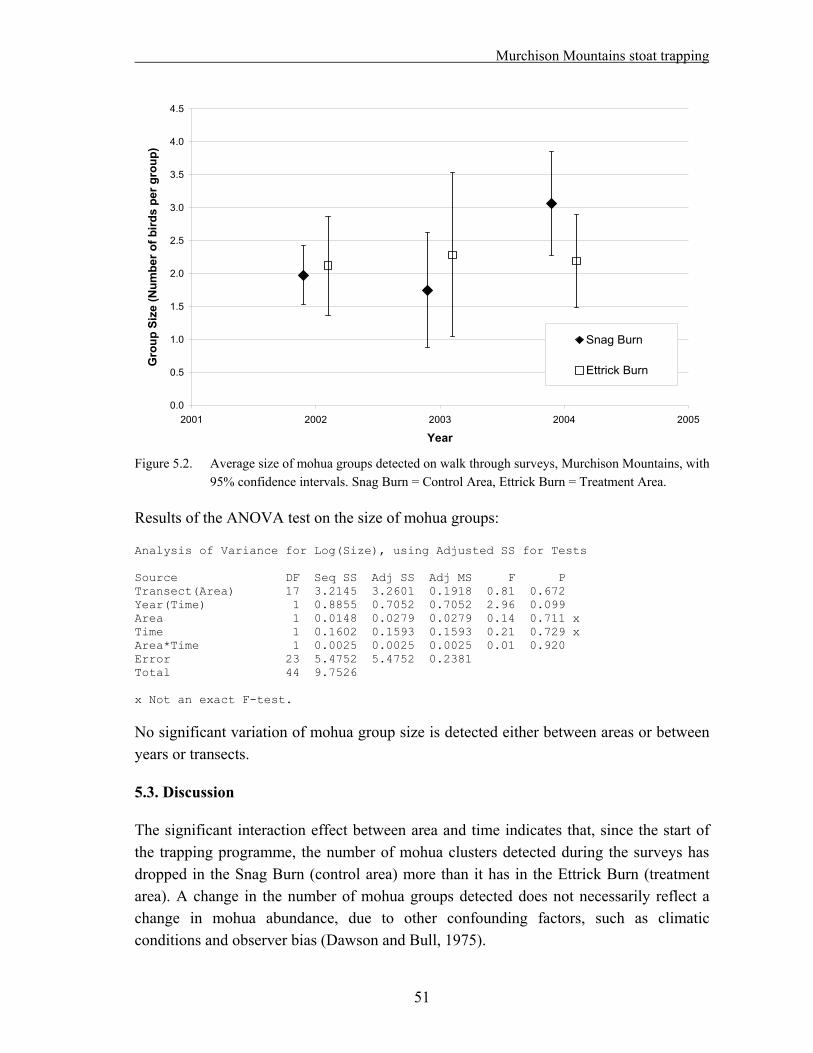
Murchison Mountains stoat trapping
51
0.0
0.5
1.0
1.5
2.0
2.5
3.0
3.5
4.0
4.5
2001 2002 2003 2004 2005
Year
Gro
up S
ize
(Num
ber o
f bird
s pe
r gro
up)
Snag Burn
Ettrick Burn
Figure 5.2. Average size of mohua groups detected on walk through surveys, Murchison Mountains, with
95% confidence intervals. Snag Burn = Control Area, Ettrick Burn = Treatment Area.
Results of the ANOVA test on the size of mohua groups: Analysis of Variance for Log(Size), using Adjusted SS for Tests Source DF Seq SS Adj SS Adj MS F P Transect(Area) 17 3.2145 3.2601 0.1918 0.81 0.672 Year(Time) 1 0.8855 0.7052 0.7052 2.96 0.099 Area 1 0.0148 0.0279 0.0279 0.14 0.711 x Time 1 0.1602 0.1593 0.1593 0.21 0.729 x Area*Time 1 0.0025 0.0025 0.0025 0.01 0.920 Error 23 5.4752 5.4752 0.2381 Total 44 9.7526 x Not an exact F-test.
No significant variation of mohua group size is detected either between areas or between years or transects.
5.3. Discussion
The significant interaction effect between area and time indicates that, since the start of the trapping programme, the number of mohua clusters detected during the surveys has dropped in the Snag Burn (control area) more than it has in the Ettrick Burn (treatment area). A change in the number of mohua groups detected does not necessarily reflect a change in mohua abundance, due to other confounding factors, such as climatic conditions and observer bias (Dawson and Bull, 1975).
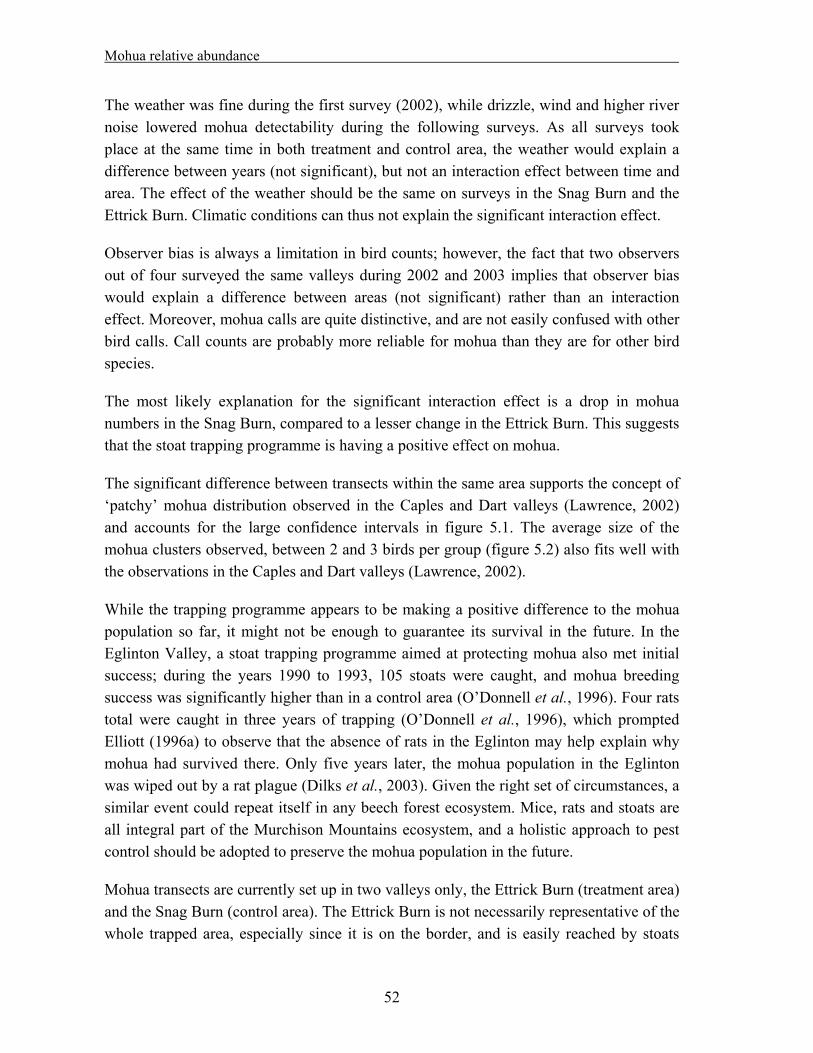
Mohua relative abundance
The weather was fine during the first survey (2002), while drizzle, wind and higher river noise lowered mohua detectability during the following surveys. As all surveys took place at the same time in both treatment and control area, the weather would explain a difference between years (not significant), but not an interaction effect between time and area. The effect of the weather should be the same on surveys in the Snag Burn and the Ettrick Burn. Climatic conditions can thus not explain the significant interaction effect.
Observer bias is always a limitation in bird counts; however, the fact that two observers out of four surveyed the same valleys during 2002 and 2003 implies that observer bias would explain a difference between areas (not significant) rather than an interaction effect. Moreover, mohua calls are quite distinctive, and are not easily confused with other bird calls. Call counts are probably more reliable for mohua than they are for other bird species.
The most likely explanation for the significant interaction effect is a drop in mohua numbers in the Snag Burn, compared to a lesser change in the Ettrick Burn. This suggests that the stoat trapping programme is having a positive effect on mohua.
The significant difference between transects within the same area supports the concept of ‘patchy’ mohua distribution observed in the Caples and Dart valleys (Lawrence, 2002) and accounts for the large confidence intervals in figure 5.1. The average size of the mohua clusters observed, between 2 and 3 birds per group (figure 5.2) also fits well with the observations in the Caples and Dart valleys (Lawrence, 2002).
While the trapping programme appears to be making a positive difference to the mohua population so far, it might not be enough to guarantee its survival in the future. In the Eglinton Valley, a stoat trapping programme aimed at protecting mohua also met initial success; during the years 1990 to 1993, 105 stoats were caught, and mohua breeding success was significantly higher than in a control area (O’Donnell et al., 1996). Four rats total were caught in three years of trapping (O’Donnell et al., 1996), which prompted Elliott (1996a) to observe that the absence of rats in the Eglinton may help explain why mohua had survived there. Only five years later, the mohua population in the Eglinton was wiped out by a rat plague (Dilks et al., 2003). Given the right set of circumstances, a similar event could repeat itself in any beech forest ecosystem. Mice, rats and stoats are all integral part of the Murchison Mountains ecosystem, and a holistic approach to pest control should be adopted to preserve the mohua population in the future.
Mohua transects are currently set up in two valleys only, the Ettrick Burn (treatment area) and the Snag Burn (control area). The Ettrick Burn is not necessarily representative of the whole trapped area, especially since it is on the border, and is easily reached by stoats
52

Murchison Mountains stoat trapping
dispersing from the un-trapped area. The results in section 2 of this report suggest that the stoat trapping programme is being most effective in the centre of the trapped area. The addition of ten mohua transect lines in the Point Burn (treatment area) and ten lines in the Chester Burn or Woodrow Burn (control area) would improve the design of the experiment. The addition of some transect lines near the river mouth or lake shore should also be considered, as this is where both stoats and rats are found in higher numbers, and mohua population trends might be different than in the valleys.
It is unfortunate that no survey took place in October 2005; mohua surveys should be continued until the end of the trapping programme. The next two years especially might yield important data, as a heavy beech seeding event is expected during autumn 2006.
53

Mohua relative abundance
54

Murchison Mountains stoat trapping
6. Kiwi monitoring programme
Kiwi populations throughout the country are severely affected by mammalian predators; juvenile mortality is as high as 94%, with stoats accounting for half of the losses (McLennan et al., 1996). Trapping programmes to protect kiwi have not always been successful – in the Clinton Valley for instance, a four-year study of kiwi productivity showed that less than 10% of chicks survived to the end of summer, with stoats being responsible for most fatalities in spite of trapping (Edmonds, 2005). The recent decision to interrupt predator control at Okarito in favour of Operation Nest Egg (where eggs or newly hatched chicks are transferred to a crèche island) was also motivated by the trapping programme there not achieving satisfactory results (DoC, 2005b).
The vulnerability of kiwi to stoat predation makes it a good “end-of-scale” indicator species for assessing the effectiveness of a trapping programme – if kiwi suffer low predation losses, then most other bird species are also expected to be safe (but not the other way around!). Kiwi monitoring was started in the Murchison Mountains in 2003, with ten adult males radio-tagged in the Mystery Burn (treatment area), and another ten males added to the study in the Snag Burn (control area) in 2004. During the breeding season, regular nest checks followed by monitoring of chicks (also fitted with transmitters) are carried out weekly, with the purpose of comparing kiwi productivity, chick survival and the level of stoat predation in the treatment and control area (Willans, 2004; Tansell and Willans, 2005). The results of the monitoring programme from 2003/04 to 2005/06 are summarized in table 6.1.
Table 6.1. Summarized results of kiwi nest and chick monitoring in the Mystery Burn (treatment area) and Snag Burn (control area), Murchison Mountains, 2003/04 to 2005/06.
1 Source of data: Willans (2004) 2 Source of data: Tansell and Willans (2005) 3 As to March 20th, 2006. See Tansell and Kirkman (2006) for final results for the season.
Eggs Dead Monitored adults total
laid fertile
chicks alive Stoat
predation Cause unknown
Died other cause
2003/04 Mystery 1 9 5 2 1 0 0 1 2004/05 Mystery 2 10 4 4 2 0 0 2 2004/05 Snag 2 9 7 5 1 2 2 0 2005/06 Mystery 3 10 9 8 3 2 2 1 2005/06 Snag 3 10 8 8 2 3 3 0
Sample size is currently too small to detect any effect of stoat trapping on kiwi chick survival, or otherwise. In this section of the report, the experimental design of the kiwi monitoring programme is analyzed. The data collected so far are used as a pilot study to
55

Kiwi monitoring programme
determine the sample size required (in terms of number of birds and duration of the study) to detect a significant effect of the trapping programme on the kiwi population, provided such an effect exists.
6.1. Methods
A measure of kiwi reproductive success and a measure of the level of stoat predation were selected for this analysis:
Breeding success = % eggs laid that produced offspring > 1200gm
Stoat predation = % eggs laid that failed (during egg stage or chick stage) because of stoat predation
The level of predation on the species of interest is the most direct measure of the success of a trapping programme. However, the measure is affected by a certain degree of uncertainty, as the cause of death cannot be established for all failed eggs/chicks. Breeding success was selected as an overall measure of reproductive success, as it accounts for hatching success and fledging success, both of which are affected by stoat predation. Juvenile kiwi are considered to be safe from stoat predation once they reach a weight of 1200gm. Comparing breeding success has some advantages over comparing the level of predation, as there is less uncertainty in the measure, and potential secondary effects of the stoat trapping programmes are accounted for (e.g. increase in number of meso-predators).
The level of stoat predation was modeled as follows: Predation confirmed
Predated by stoat
Nested Predation undetected
Adults monitored No stoat predation
Did not nest
pc
pp
pn
pn is the probability of a monitored adult laying an egg, pp is the probability of an egg being predated by a stoat, and pc is the probability of a predation event being detected by the monitoring programme. The level of stoat predation (as measured by the monitoring programme) follows a binomial distribution, with a mean value of pp•pc.
56
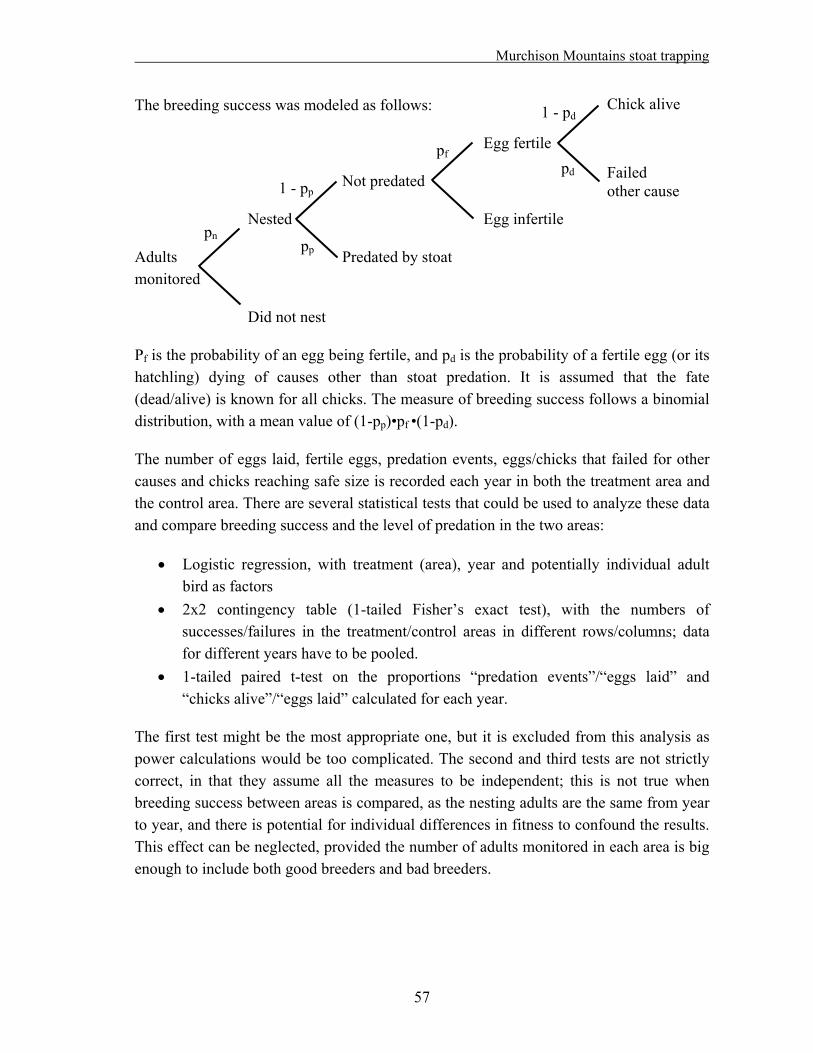
Murchison Mountains stoat trapping
The breeding success was modeled as follows: Chick alive
Egg fertile
Failed other causeNot predated
Nested Egg infertile
Adults Predated by stoat monitored
Did not nest
1 - pd
pd
pf
1 - pp
pppn
Pf is the probability of an egg being fertile, and pd is the probability of a fertile egg (or its hatchling) dying of causes other than stoat predation. It is assumed that the fate (dead/alive) is known for all chicks. The measure of breeding success follows a binomial distribution, with a mean value of (1-pp)•pf •(1-pd).
The number of eggs laid, fertile eggs, predation events, eggs/chicks that failed for other causes and chicks reaching safe size is recorded each year in both the treatment area and the control area. There are several statistical tests that could be used to analyze these data and compare breeding success and the level of predation in the two areas:
Logistic regression, with treatment (area), year and potentially individual adult bird as factors
2x2 contingency table (1-tailed Fisher’s exact test), with the numbers of successes/failures in the treatment/control areas in different rows/columns; data for different years have to be pooled.
1-tailed paired t-test on the proportions “predation events”/“eggs laid” and “chicks alive”/“eggs laid” calculated for each year.
The first test might be the most appropriate one, but it is excluded from this analysis as power calculations would be too complicated. The second and third tests are not strictly correct, in that they assume all the measures to be independent; this is not true when breeding success between areas is compared, as the nesting adults are the same from year to year, and there is potential for individual differences in fitness to confound the results. This effect can be neglected, provided the number of adults monitored in each area is big enough to include both good breeders and bad breeders.
57

Kiwi monitoring programme
58
The contingency table (1-tailed Fisher’s exact test) was selected, as it is more appropriate than a t-test for binomial data. The sample size required to achieve a specified statistical power was estimated with the following formulas (Zar, 1999):
2
21n )p(pn411
4n
p1N2
21
2
2211(1)(1)
pp
qpqpZqp2Zn
where N is the sample size (number of adult kiwi monitored in each area * number of years); notice that N is assumed to be the same in both treatment and control area.
is the significance level of the test, fixed at 5%. is the power of the test (i.e., the probability of detecting a significant difference,
provided one exists). Z is the inverse of a Z-distribution. pi is the probability of success (or predation) in area i. pn is the probability of a monitored adult laying an egg. qi = 1 – pi; /2ppp 21 ; /2qqq 21
Microsoft EXCEL was used for all calculations.
6.2. Results
The following parameter estimates were derived from table 6.1 and were used in the calculations:
Probability of a monitored adult nesting: pn = 65%. This is in good agreement with a value of 62% obtained in a similar study in the Clinton Valley (Edmonds, 2005).
Average egg fertility: pf = 82%. Mortality not caused by predation: pd = 30% (value estimated at 20% to 35%,
with uncertainty due to deaths for causes not identified).
The required sample size N (number of monitored birds * number of years) depends on the level of predation in the treatment area p1 and on the level of predation in the control area p2, not on the difference p2 – p1 alone. A graphic representation of N as a function of p2 and = p2 – p1 is preferred, as it makes interpretation of the results easier. Figures 6.1 to 6.3 show the sample size required to achieve a specified power , for different statistics (breeding success, level of stoat predation) compared in the two areas.
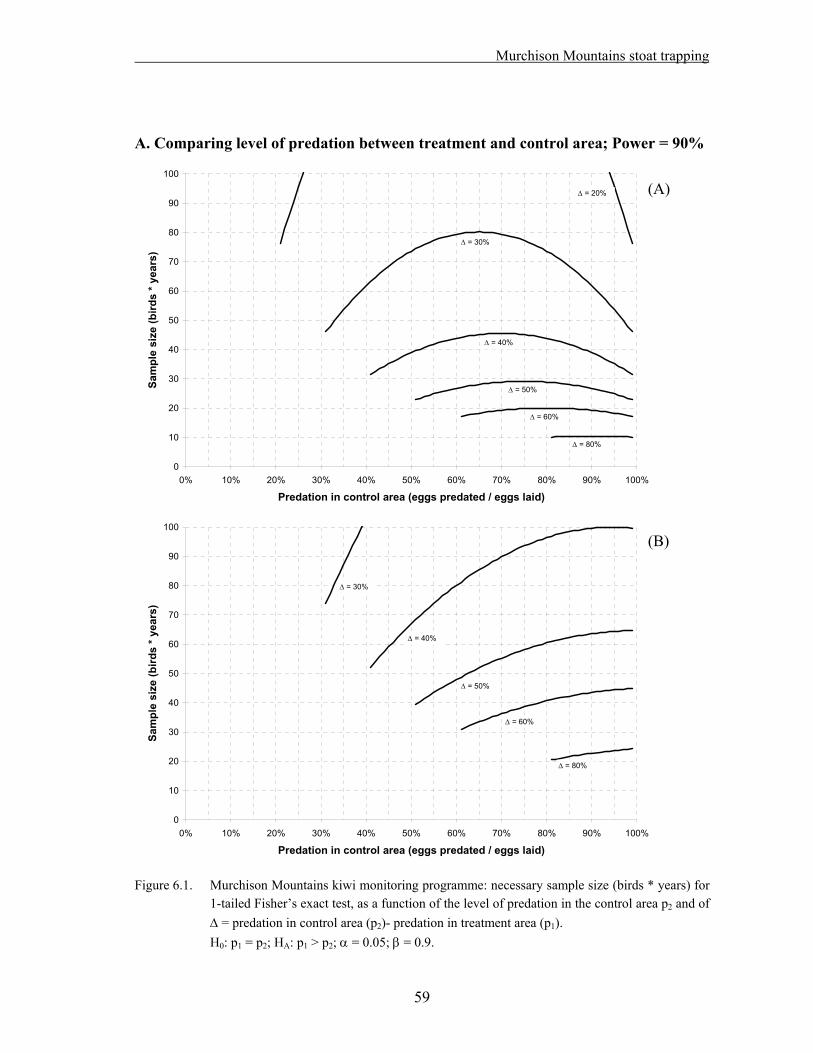
Murchison Mountains stoat trapping
59
A. Comparing level of predation between treatment and control area; Power = 90%
0
10
20
30
40
50
60
70
80
90
100
0% 10% 20% 30% 40% 50% 60% 70% 80% 90% 100%
Predation in control area (eggs predated / eggs laid)
Sam
ple
size
(bird
s * y
ears
)
= 30%
= 40%
= 50%
= 60%
= 80%
= 20% (A)
0
10
20
30
40
50
60
70
80
90
100
0% 10% 20% 30% 40% 50% 60% 70% 80% 90% 100%
Predation in control area (eggs predated / eggs laid)
Sam
ple
size
(bird
s * y
ears
)
= 30%
= 40%
= 50%
= 60%
= 80%
(B)
Figure 6.1. Murchison Mountains kiwi monitoring programme: necessary sample size (birds * years) for
1-tailed Fisher’s exact test, as a function of the level of predation in the control area p2 and of = predation in control area (p2)- predation in treatment area (p1).
H0: p1 = p2; HA: p1 > p2; = 0.05; = 0.9.
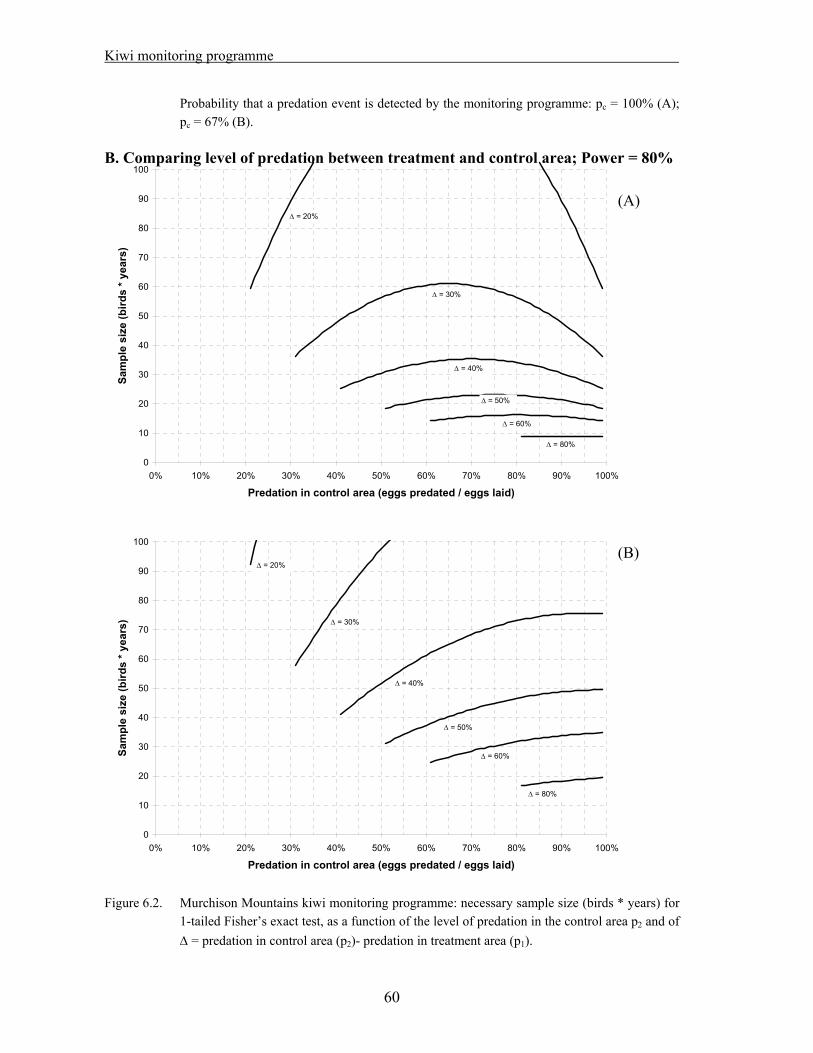
Kiwi monitoring programme
60
Probability that a predation event is detected by the monitoring programme: pc = 100% (A); pc = 67% (B).
0
10
20
30
40
50
60
70
80
90
100B. Comparing level of predation between treatment and control area; Power = 80%
0% 10% 20% 30% 40% 50% 60% 70% 80% 90% 100%
Predation in control area (eggs predated / eggs laid)
Sam
ple
size
(bird
s * y
ears
)
= 30%
= 40%
= 50%
= 60%
= 80%
= 20%
(A)
0
10
20
30
40
50
60
70
80
90
100
0% 10% 20% 30% 40% 50% 60% 70% 80% 90% 100%
Predation in control area (eggs predated / eggs laid)
Sam
ple
size
(bird
s * y
ears
) = 30%
= 40%
= 50%
= 60%
= 80%
= 20%(B)
Figure 6.2. Murchison Mountains kiwi monitoring programme: necessary sample size (birds * years) for
1-tailed Fisher’s exact test, as a function of the level of predation in the control area p2 and of = predation in control area (p2)- predation in treatment area (p1).

Murchison Mountains stoat trapping
H0: p1 = p2; HA: p1 > p2; = 0.05; = 0.8. Probability that a predation event is detected by the monitoring programme: pc = 100% (A);
pc = 67% (B). C. Comparing breeding success between treatment and control area
0
10
20
30
40
50
60
70
80
90
100
50% 55% 60% 65% 70% 75% 80% 85% 90% 95% 100%
Predation in control area (eggs predated / eggs laid)
Sam
ple
size
(bird
s * y
ears
)
= 90%
= 80%
= 70%
= 60%
= 50%
= 40% = 30% (A)
0
10
20
30
40
50
60
70
80
90
100
50% 55% 60% 65% 70% 75% 80% 85% 90% 95% 100%
Predation in control area (eggs predated / eggs laid)
Sam
ple
size
(bird
s * y
ears
)
= 90%
= 80%
= 70%
= 60%
= 50%
= 40%
= 30%
(B) Figure 6.3. Murchison Mountains kiwi monitoring programme: necessary sample size (birds * years) for
1-tailed Fisher’s exact test, as a function of the level of predation in the control area p2 and of = predation in control area (p2) - predation in treatment area (p1).
61
Kiwi monitoring programme
H0: Breeding success in treatment area = Breeding success in control area; HA: Breeding success in treatment area > Breeding success in control area; = 0.05.
Power of test: = 0.9 (A); = 0.8 (B). 6.3. Discussion
Sample size
Three main observations are derived from the graphs in figures 6.1 to 6.3:
Provided the fate and cause of death of all eggs/chicks can be identified, comparing the level of predation between treatment and control area gives a much more powerful test than comparing breeding success (see figures 6.1A and 6.3A). This is because breeding success is affected not only by stoat predation, but also by egg fertility and any other cause of egg failure or chick mortality.
A comparison of the level of predation between treatment and control area is severely affected by any unknowns in the causes of mortality for eggs or chicks. Assuming that the true level of predation is 50% in the control area and 10% in the treatment area, we would need a sample size of 39 birds*years to have a 90% probability of detecting this difference, provided the cause for all nest failures is known (see figure 6.1A). The sample size required increases to 68 birds*years if we are only able to establish the cause for two thirds off egg/chick failures (see figure 6.1B).
The effort (in terms of sample size) increases exponentially with the gain in difference that we are able to detect. For instance, assuming that the level of predation in the control area is 50%, we would need 23 birds*years to detect a difference if there is no predation in the treatment area, 39 birds*years if the level of predation in the treatment area is 10%, almost 74 birds*years at 20% predation in the treatment area (see figure 6.1A). This means that there is really a limit beyond which it makes no sense to increase sample size.
Considering that figure 6.1B represents a more realistic situation than figure 6.1A – it is not possible to determine the cause of death for all eggs or chicks – a sample size of 70 birds*years appears reasonable. This gives a 90% probability of detecting a difference, in the event that the level of predation is 50% in the control area and less than 10% in the treatment area.
70 birds*years are equivalent to 14 adults monitored over a five year period. As a few birds are likely to be lost each season because of transmitter failure or death, at least 16 birds should be fitted with transmitters in each area. Current efforts to catch more birds
62

Murchison Mountains stoat trapping
have probably already achieved this target (see Tansell and Kirkman, 2006). Sample size will need to be maintained throughout the study by replacing any failed transmitters or dead birds at the end of each season.
Other possible improvements to the experimental design
The kiwi monitoring programme could be improved by expanding the sample in valleys other than the Mystery Burn and the Snag Burn. There is a chance in fact that these valleys are not representative of the whole treatment and control area. Six birds were recently caught in the Point Burn, in the treatment area (Tansell and Kirkman, 2006); it is recommended that the sample for the control area be increased by catching additional birds in the Chester Burn or Woodrow Burn rather than in the Snag Burn.
It is also important that the cause of egg failure / chick death be identified with certainty for as many nests as possible. Two stages appear to be critical in this regard:
egg incubation phase – three events where egg predation is suspected (but not confirmed) in the 2005/06 season
chick just after hatch, before being fitted with a transmitter – two chicks disappearing during the 2004/05 season, one during the 2005/06 season.
Little can be done in the second stage, except making sure that a chick is captured and fitted with a transmitter as soon as possible after hatching. The use of infrared cameras to monitor the entrance to a nest could help identify the causes of egg failures during incubation, at least by confirming visits by predators. The use of video cameras in such a remote location poses its challenges, mainly because of the high battery consumption of the video recorder and the necessity of recharging batteries daily; solar panels are unsuitable for the purpose because of the low light level in a forest setting. Photoelectric sensors positioned across the nest entrance can be used to trigger a still camera, thus eliminating the need for a video recorder and heavy batteries, and reducing the amount of time spent analyzing images.
63

Kiwi monitoring programme
64

Murchison Mountains stoat trapping
7. Conclusions and recommendations
This report looked at the effectiveness of the stoat trapping programme in the Murchison Mountains, three years into the experiment, by analyzing the following aspects:
Stoat and rat trap capture data Tracking tunnels for monitoring stoats and rodents in treatment and control area Breeding success and adult survival of takahe in treatment and control area Relative abundance of mohua in treatment and control area Kiwi monitoring programme
Trap capture and tracking tunnel data
Trap capture data suggest that the effectiveness of the stoat control programme is not uniform across the whole trapped area. Stoat numbers have decreased substantially in the central section of the trapped area, while they seem to remain more or less constant near the lakeshore and at the lower elevations generally. Of concern is the fact that rat captures have increased five-fold since the start of trapping. A strong spatial correlation between stoat and rat captures also suggests a predator-prey relationship between the two species; the abundance of rodents at low altitudes might explain the persistence of stoats in spite of trapping efforts.
Tracking tunnels have failed to provide any useful information as to the relative density of stoats in the treatment and control area. It appears that tracking tunnels are not sensitive enough for the purpose; it is not clear if this is just because of the relatively low numbers of stoats in the Murchison Mountains, or because of specific problems with the Murchisons tracking tunnel set-up, especially in terms of lures used.
The following actions are recommended:
That a field trial be set up near Te Anau, to test whether the tracking tunnel set-up in the Murchison Mountains (peanut butter baits + brackets at either entrance of the tunnels) is responsible for the low mustelid tracking rates. See section 3.3 for more detail.
The tracking tunnel lines should be still run in the 2006/07 summer, as high stoat numbers are expected after a beech mast event. If a field trial indicates that the tracking tunnel set-up in the Murchison Mountains is not responsible for the low mustelid tracking rates obtained so far, the use of tracking tunnels for monitoring stoats should be discontinued after the 2006/07 season. Alternative stoat monitoring methods should be trialed, especially walk-through transects to detect stoat prints in snow.
65

Conclusions and recommendations
The rodent monitoring system should be modified to cover all altitudes in forest habitat, from the lakeshore to the bush-line, in both treatment and control area. Some of the current tracking tunnel lines might be used for the purpose, but there is a need for more lines at lower altitudes, where rats are most abundant. The tracking rates of both mice and rats are of interest.
Rat control should be implemented at the lower altitudes in addition to stoat control, possibly with poisoning operations triggered by a rodent monitoring system, or by beech seed-fall monitoring. Rat poisoning might enhance the performance of stoat control by secondary poisoning.
Takahe, mohua and kiwi monitoring
Three years into the stoat control programme, it is generally too soon to fully evaluate the effect of trapping on the native fauna. The following results were obtained from an analysis of the data collected so far:
No positive effect of stoat trapping is detected on takahe breeding success. A positive effect on takahe adult survival is near significance level (0.05 < p < 0.1), but more data are required to draw any conclusions.
Mohua seem to benefit from stoat trapping. The increase of rat numbers in the trapped area however is of concern, as we know that one rat plague can outweigh the benefits of several years of stoat trapping.
Sample size is currently too small to detect any effect on kiwi breeding success.
The following actions are recommended:
That the stoat trapping programme and associated bird monitoring be continued for the initially planned duration of the experiment (8 years). If possible, at least two plague years should be included in the experiment.
That yearly mohua monitoring transects be re-established, starting October 2006.
If resources allow, both the kiwi and mohua monitoring programmes should be expanded to the Point Burn (treatment area) and the Chester Burn or Woodrow Burn (control area).
The kiwi monitoring programme should aim at expanding the number of adults with transmitters to 16 birds in each area. The use of cameras triggered by photoelectric sensors could be investigated to reduce the number of unconfirmed predation events on kiwi nests.
66

Murchison Mountains stoat trapping
Acknowledgements
I am thankful to the following people, who have contributed in some measure to the project:
Nik Joyce, for his continuous support, especially with logistics and organizing field-work.
Dave Crouchely, for getting me started on the project, and Kerri-Anne Edge, for her continued support after taking over the management of the Takahe Programme.
Des Smith and Jane Tansell, for many constructive discussions, suggestions and ideas. Des, thanks for all the bibliographic material, and Jane, kiwi field-work was great!
Glen Greaves, for his assistance getting information out of the takahe database. Man, without your help I would have been lost!
Darryl McKenzie, for providing statistical advice regarding the use of the program MARK.
Pete Kirkman and Hohepa Potini, for their company and for sharing good times while in the field.
Most of the data analyzed in this report were not collected by the author; they are the result of many years of field-work, and the invaluable contribution of so many people I’ve never met. I’m particularly indebted to Jane Maxwell, for setting up the takahe database and collecting many years of takahe data, and Megan Willans, for collecting mohua data and starting the tracking tunnel monitoring programme.
Thanks to all the staff of DoC Te Anau for providing a great working environment, and to Phil Seddon and Yolanda van Heezik for the outstanding level of teaching during the last year.
67
References
References
Alterio, N.; Moller, H.; Brown, K. 1999. Trappability and densities of stoats (Mustela erminea) and ship rats (Rattus rattus) in a South Island Nothofagus forest, New Zealand. New Zealand Journal of Ecology 23(1): 95-100.
Ballance, A. 2001. Takahe: the bird that twice came back from the grave. Chapter 2 in Jamieson, I.G. and Lee, W.G., Editors: The takahe – fifty years of conservation. University of Otago Press, Dunedin, New Zealand.
Barker, R.J. 1997. Joint modelling of live-recapture, tag-resight and tag-recovery data. Biometrics 53: 666-677.
Barlow, N.; Choquenot, D. 2002. Predicting the impact and control of stoats: a review of modelling approaches. Science for Conservation 191, Department of Conservation, Wellington, New Zealalnd.
Beauchamp, A.J.; Butler, D.J.; King, D. 1999. Weka (Gallirallus australis) Recovery Plan 1999-2009. Threatened Species Recovery Plan 29, Department of Conservation, Wellington, New Zealand.
Bramley, G.N. 1996. A small predator removal experiment to protect North Island weka (Gallirallus australis greyi) and the case for single-subject approaches in detecting agents of decline. New Zealand Journal of Ecology 20(1): 37-43.
Brown, J.A.; Miller, C.J. 1998. Monitoring stoat Mustela erminea control operations: power analysis and design. Science for Conservation 96. Department of Conservation, Wellington, New Zealand.
Bunin, J.S.; Jamieson, I.G. 1996. Responses to a model predator of New Zealand’s endangered takahe and its closest relative, the pukeko. Conservation Biology 10(5): 1463-1466.
Cameron, B.G.; van Heezik, Y.; Maloney, R.F.; Seddon, P.J.; Harraway, J.A. 2005. Improving predator capture rates: analysis of river margin trap site data in the Waitaki Basin, New Zealand. New Zealand Journal of Ecology 29(1): 117-128.
Cooch, E.; White, G. 2005. Program MARK – A gentle introduction. 4th edition, available from < http://www.cnr.colostate.edu/~gwhite/software.html >
Cormack, R.M. 1964. Estimates of survival from the sightings of marked animals. Biometrika 51: 429-438.
Cross, M.; Smale, A.; Bettany, S.; Numata, M.; Nelson, D.; Keedwell, R.; Ragg, J. 1998. Trap catch as a relative index of ferret (Mustela furo) abundance in a New Zealand pastoral habitat. New Zealand Journal of Zoology 25(1): 65-71.
Crouchley, D. 2001. Murchison Mountain Stoat Control – Project Plan. Unpublished Report, Department of Conservation, Te Anau, New Zealand.
Dawson, D.G.; Bull, P.C. 1975. Counting birds in New Zealand forests. Notornis 22: 101-109.
68

Murchison Mountains stoat trapping
Dilks, P.; Willans, M.; Pryde, M.; Fraser, I. 2003. Large scale stoat control to protect mohua (Mohoua ochrocephala) and kaka (Nestor meridionalis) in the Eglinton Valley, Fiordland, New Zealand. New Zealand Journal of Ecology 27(1): 1-9.
Dilks, P. 2005. Predator and forest bird research in the Eglinton Valley. Unpublished Report, Department of Conservation, Christchurch, New Zealand.
DoC, 2001. What’s happening with stoat research? Third report on the five-year stoat research programme. Department of Conservation, Wellington, New Zealand.
DoC, 2002. Takahe Recovery Plan 2002 – 2007. Threatened Species Recovery Plan, Department of Conservation, Te Anau, New Zealand.
DoC, 2005a. Takahe Programme Annual Report – 1 June 2004 to 31 May 2005. Unpublished Report, Department of Conservation, Te Anau, New Zealand.
DoC, 2005b. Department of Conservation web-site <http://www.doc.govt.nz/Regional-Info/011~West-Coast/006~Whats-New/index.asp#Kiwi>
Edmonds, H. 2005. Fiordland tokoeka – Productivity and chick survival study, Clinton Valley, Fiordland National Park 2004/2005. Unpublished Report, Department of Conservation, Te Anau, New Zealand.
Elliott, G.P. 1996a. Productivity and mortality of mohua (Mohoua ochrocephala). New Zealand Journal of Zoology 23: 229-237.
Elliott, G.P. 1996b. Mohua and stoats: a population viability analysis. New Zealand Journal of Zoology 23: 239-247.
Erlinge, S.; Sandell, M. 1988. Coexistence of stoat, Mustela erminea, and weasel, M. nivalis: social dominance, scent communication and reciprocal distribution. Oikos 53: 242-246.
Fitzgerald, B.M.; Karl, B.J.; Moller, H. 1981. Spatial organization and ecology of a sparse population of house mice (Mus musculus) in a New Zealand forest. The Journal of Animal Ecology 50(2): 489-518.
Gillies, C.; Williams, D. 2000. A short guide for identifying footprints on tracking tunnel paper. Unpublished Report, Department of Conservation, Wellington, New Zealand.
Gillies, C.; Williams, D. 2002. Using tracking tunnels to monitor rodents and mustelids. DoC Tracking Tunnel Guide v2.4, Department of Conservation, Wellington, New Zealand.
Griffiths, K. 1999. Stoat control in New Zealand: a review. Wildlife Management Report 108, Otago University, Dunedin, New Zealand.
Hamilton, S. 2005. Takahe Demography Report, Murchison Mountains. Unpublished Report, Department of Conservation, Te Anau, New Zealand.
Hitchmough, R. (Compiler). 2002. New Zealand Threat Classification System lists. Threatened Species Occasional Publication 23, Department of Conservation, Wellington. 210pp.
Jolly, G.M. 1965. Explicit estimates from capture-recapture data with both death and immigration stochastic model. Biometrika 52: 225-247.
69

References
King, C.M.; Edgar, R.L. 1977. Techniques for trapping and tracking stoats (Mustela erminea); a review, and a new system. New Zealand Journal of Zoology 4: 193-212.
King, C.M. 1978. Methods of predicting and reducing potential stoat damage by stoats to takahe. Pp 234-247 in Proceedings of the seminar on the takahe and its habitat, Te Anau. Fiordland National Park Board, Invercargill, New Zealand.
King, C.M. 1994. Monitoring and control of mustelids on conservation lands, Part 1: planning and assessing an operation. Technical Series No.3, Department of Conservation, Wellington, New Zealand.
Lavers, R.B.; Mills, J.A. 1978. Stoat studies in the Murchison Mountains, Fiordland. Pp 222-233 in Proceedings of the seminar on the takahe and its habitat, Te Anau. Fiordland National Park Board, Invercargill, New Zealand.
Lawrence, B. 1997. A review of the relationship between beechmast (Nothofagus species), stoats (Mustela erminea) and mohua (Mohoua ochrocephala). Wildlife Management Report 91, University of Otago, Dunedin, New Zealand.
Lawrence, B.; O’Donnell, C.F.J. 1999. Trap spacing and layout: experiments in stoat control in the Dart Valley, 1992-95. Science for Conservation 118, Department of Conservation, Wellington, New Zealand.
Lawrence, B. 2002. Detecting critical changes in mohua (Mohoua ochrocephala) abundance: Inferences from a second year’s data. DOC Science Internal Series 36, Department of Conservation, Wellington, New Zealand.
Lee, W.G. 2001. Fifty years of takahe conservation, research and managemet: what have we learnt? Chapter 5 in Jamieson, I.G. and Lee, W.G., Editors: The takahe – fifty years of conservation. University of Otago Press, Dunedin, New Zealand.
Loe, E.; Willans, M. 2005. Murchison Mountains tracking tunnel monitoring: stoat control versus non-treatment area. Unpublished Report, Department of Conservation, Te Anau, New Zealand.
McLennan, J.A.; Potter M.A.; Robertson, H.A.; Wake, G.C.; Colbourne, R.; Dew, L.; Joyce, L.; McCann, A.J.; Miles, J.; Miller, P.J.; Reid, J. 1996. Role of predation in the decline of kiwi, Apteryx spp., in New Zealand. New Zealand Journal of Ecology 20(1): 27-35.
McMurtrie, P.; Edge, K.-A.; Golding, C. 2004. Blue duck (whio) productivity and survival study – Clinton, Arthur and Cleddau catchments, Fiordland 2003/2004. Unpublished Report, Department of Conservation, Te Anau, New Zealand.
Maxwell, J.M. 2001. Fiordland takahe: population trends, dynamics and problems. Chapter 6 in Jamieson, I.G. and Lee, W.G., Editors: The takahe – fifty years of conservation. University of Otago Press, Dunedin, New Zealand.
Maxwell, J.M. 2005. Effect of environmental variables on takahe population breeding performance, Murchison Mountains. Unpublished Report, Department of Conservation, Te Anau, New Zealand.
70

Murchison Mountains stoat trapping
Maxwell, J.M.; Christie, J. 2005. Takahe egg and chick mortality field study – Murchison Mountains, Fiordland 1997-2001. Unpublished Report, Department of Conservation, Te Anau, New Zealand.
Mills, J.A. 1990. Research involvement in the management of the takahe – A case study. Science and Research Internal Report 64. Department of Conservation, Wellington, New Zealand.
Murphy, E.C.; Dowding, J.E. 1995. Ecology of the stoat in Nothofagus forest: home range, habitat use and diet at different stages of the beech mast cycle. New Zealand Journal of Ecology 19(2): 97-109.
Murphy, E.C.; Robbins, L.; Clapperton, B.K. 1999. Monitoring mustelid populations by tracking tunnels: establishing an index protocol. Unpublished Report, Department of Conservation, Wellington, New Zealand.
Nelson, L.Jr.; Clark, F.C. 1973. Correction for sprung traps in catch/effort calculations of trapping results. Journal of Mammalogy 54(1): 295-298.
O’Donnell, C.F.J. 1996. Monitoring mohua (yellowhead) populations in the South Island, New Zealand, 1983-93. New Zealand Journal of Zoology 23: 221-228.
O’Donnell, C.F.J.; Dilks, P.J.; Elliott, G.P. 1996. Control of stoat (Mustela erminea) population irruption to enhance mohua (yellowhead) (Mohoua ochrocephala) breeding success in New Zealand. New Zealand Journal of Zoology 23: 279-286.
Pryde, M.; Dilks, P.; Fraser, I. 2005. The home range of ship rats (Rattus rattus) in beech forest in the Eglinton Valley, Fiordland, New Zealand: a pilot study. New Zealand Journal of Zoology 32: 139–142.
Reid, B. 1967. Some features of recent research on the takahe. Proceedings of the New Zealand Ecological Society 14: 79-87.
Ruscoe, W.A.; Wilson, D.; McElrea, L.; McElrea, G.; Richardson, S.J. 2004. A house mouse (Mus musculus) population eruption in response to rimu (Dacrydium cupressinum) seedfall in southern New Zealand. New Zealand Journal of Ecology 28(2): 259-265.
Seber, G.A.F. 1965. A note on the multiple-recapture census. Biomatrika 52: 249-259.
Smith, D.H.V.; Jamieson, I.G. 2003. Movement, diet, and relative abundance of stoats in an alpine habitat. DoC Science Internal Series 107, Department of Conservation, Wellington, New Zealand.
Smith, D.H.V.; Jamieson, I.G. 2005. Lack of movement of stoats (Mustela erminea) between Nothofagus valley floors and alpine grasslands, with implications for the conservation of New Zealand’s endangered fauna. New Zealand Journal of Ecology 29(1): 45-52.
Smith, D.H.V.; Jamieson, I.G.; Peach, R.M.E. 2005. Importance of ground weta (Hemiandrus spp.) in stoat (Mustela erminea) diet in small montane valleys and alpine grasslands. New Zealand Journal of Ecology 29(2): 207-214.
71
References
Tansell, J.; Willans, M. 2005. Tokoeka chick recruitment study – Mystery and Snag Burns, Murchison Mountains 2004/2005. Unpublished Report, Department of Conservation, Te Anau, New Zealand.
Tansell, J.; Kirkman, P. 2006. Tokoeka chick recruitment study – Mystery and Snag Burns, Murchison Mountains 2005/2006. Report in preparation.
Willans, M. 2002. Establishment of Murchison Mountain mohua survey to assess if the present level of stoat control will benefit the population. Unpublished Report, Department of Conservation, Te Anau, New Zealand.
Willans, M. 2003. Operational report for stoat control in the Murchison Mountains (takahe) Area, Fiordland National Park 2002/2003. Unpublished Report, Department of Conservation, Te Anau, New Zealand.
Willans, M. 2004. Murchison Mountains tokoeka chick recruitment study, Mystery Burn – 2003/2004. Unpublished Report, Department of Conservation, Te Anau, New Zealand.
Zar, J.H. 1999. Biostatistical Analysis, 4th Edition. Prentice Hall, NJ, USA. 663pp.
72
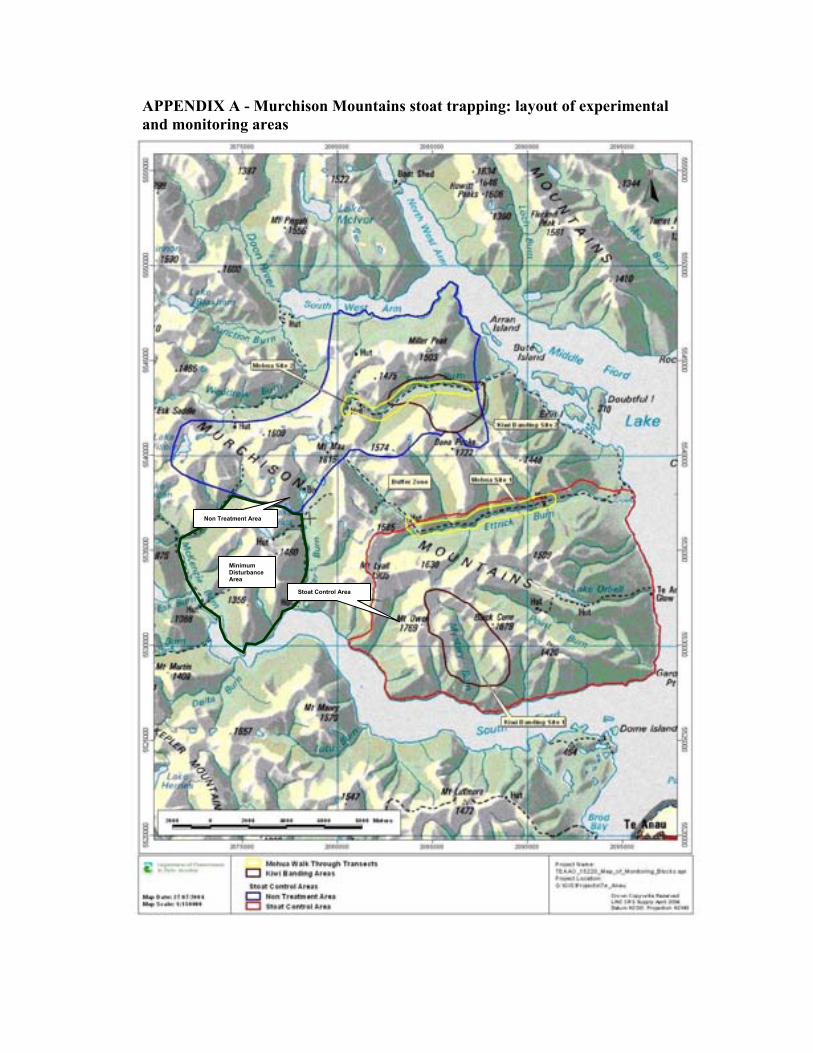
APPENDIX A - Murchison Mountains stoat trapping: layout of experimental and monitoring areas
Minimum Disturbance Area
Stoat Control Area
Non Treatment Area
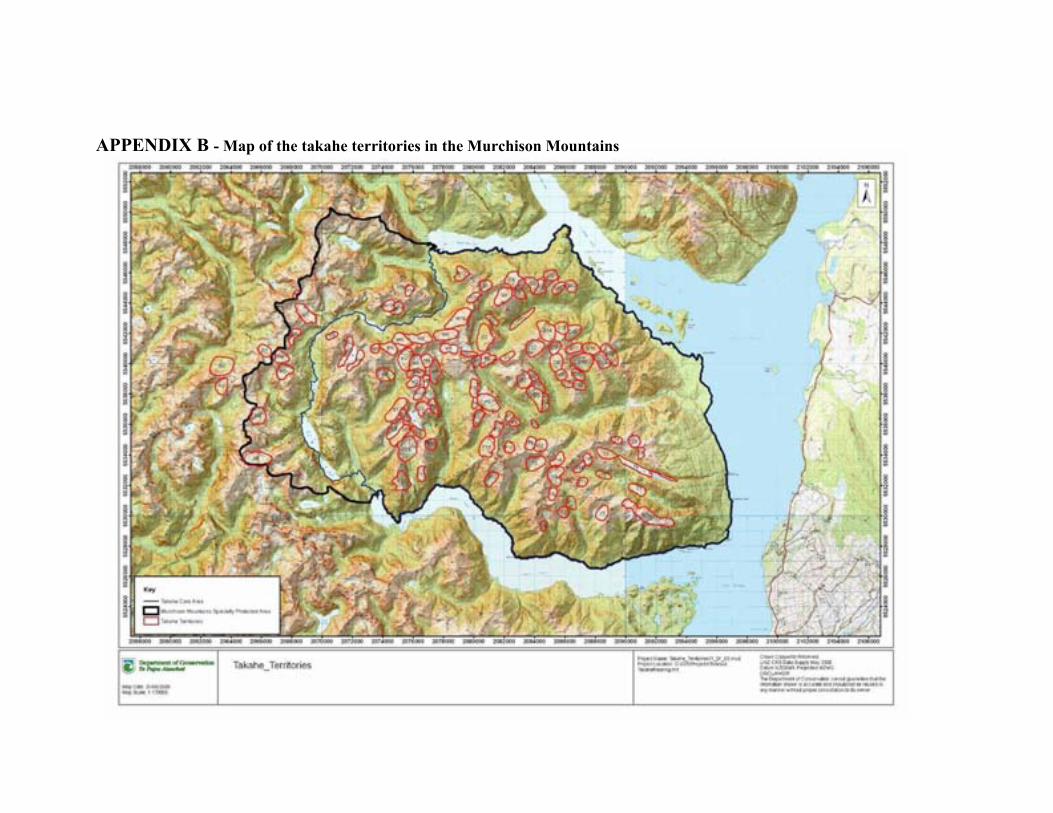
APPENDIX B - Map of the takahe territories in the Murchison Mountains
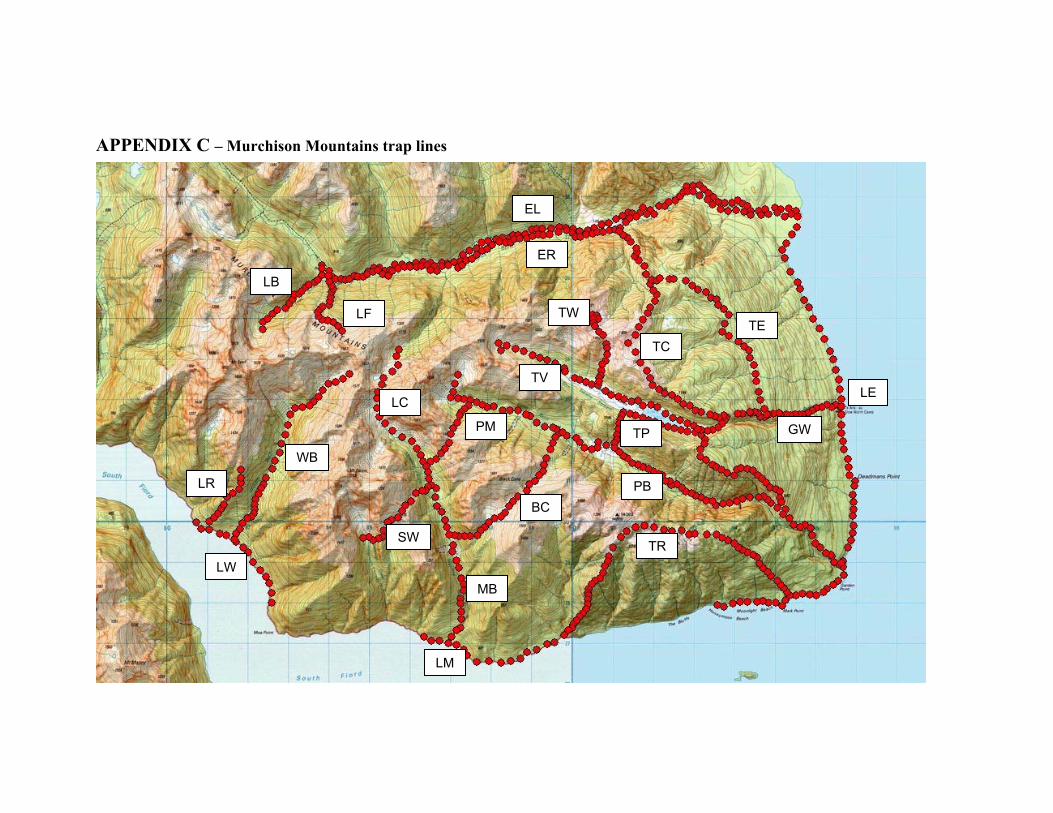
APPENDIX C – Murchison Mountains trap lines
TW
TP
BC
SW
TV
PM
PB
TCTE
LC
TR
GW
LF
LR
LB
WB
ER
EL
LM
LW MB
LE

APPENDIX C – Murchison Mountains trap lines BC Black Cone EL Ettrick Left ER Ettrick right GW Glowworm Caves LB Lyall Burn LC Lake Creek LE Lakeshore Ettrick LF Lyall Faces LM Lakeshore Mystery LR Lyall Ridge LW Lakeshore West MB Mystery Burn PB Point Burn PM Point Burn to Mystery SW Sheerwall Creek TC Takahe Centre TE Takahe East TP Takahe Valley to Point Burn TR Tor’s Ridge TV Takahe Valley TW Takahe West WB William Burn


