
Int. J. Electrochem. Sci., 15 (2020) 280 – 292, doi: 10.20964/2020.01.16
International Journal of
ELECTROCHEMICAL
SCIENCE www.electrochemsci.org
Effect of Laser Power on Corrosion Properties of Hybrid
Welded 2195 Al-Li Alloy
Mei Yang1, Honglang Yang1, Lie Yang2, Yang Liu1, Jian Tan3, Jin Chen4
1 School of materials Science and Engineering, Southwest Petroleum University, Chengdu610500,
China 2 Pangang Group Engineering Consulting Co., Ltd, Panzhihua 617000, China 3 Engineering Technology Research Institute, PetroChina Southwest Oil and Gas Field Company,
Deyang618300, China 4 Engineering and Technology Development Training Center of SPC, Chengdu 610213, China *E-mail: [email protected]
Received: 20 August 2019 / Accepted: 11 October 2019 / Published: 30 November 2019
In this work, the effect of laser power on corrosion properties of 2195 Al-Li alloy laser hybrid welded
joints was investigated. The results show that with the laser power increases, the microstructure of the
weld is coarsened, the amount of bright white and dark black precipitates decrease, the size of the
precipitates increases and the distribution is nonuniform. Electrochemical test shows that the corrosion
resistance of the base metal (BM) is lower than that of the heat-affected zone (HAZ), and the corrosion
resistance of the weld is the highest among the areas considered herein. The corrosion resistance of the
weld increases with increasing laser power. The result of inter-granular corrosion (IGC) testing shows
that the HAZ has the best IGC resistance among the areas considered herein. The IGC analysis of the
weld metals shows that the average and maximum depth of IGC decrease with increasing laser power.
When the laser power reaches 1300 W, the average and maximum depths of inter-granular corrosion
are 146 μm and 164 μm, respectively.
Keywords: Hybrid laser-arc welding, Laser power, 2195 Al-Li alloy, Inter-granular corrosion
1. INTRODUCTION
The 2195 Al-Li alloy has good application potential in the aerospace industry due to its low
density, high strength, good plasticity, good toughness and good corrosion resistance [1-4]. At present,
research concerning the welding methods for Al-Li alloys mainly includes arc welding, laser welding
and friction stir welding [5-7]. Compared with other welding methods, laser welding has the
advantages of a small heat-affected zone (HAZ) and small welding deformation [8]. However, the
microstructure and composition of the welded joints can be changed greatly during the laser welding

Int. J. Electrochem. Sci., Vol. 15, 2020
281
process, and the coating of aluminum on the joint surface can also be damaged, which deteriorates the
corrosion performance of the welded joint [9-10]. Therefore, studying the corrosion performance of
2195 Al-Li alloy welded joints has practical significance for the safety implications.
Many studies have been conducted to investigate the corrosion performance of aluminium alloy
welded joints. Work by Xu, et al [11] involved the microstructure and corrosion behaviour of nugget
zones during friction stir welding of a 2219-O aluminium alloy. The results showed that Al2Cu acted as
a cathode and formed a couple with the Al matrix, which lead to the first dissolution of the Al. The
corrosion behaviour of 2024-T3 aluminium alloy friction stir welded joints was studied by Bousquet,
et al [12], and the results indicated that coarse precipitates were the origin of pitting corrosion. Because
the S (Al2CuMg) phase particles precipitated along grain boundaries in the HAZ, the inter-granular
corrosion (ICG) sensitivity of HAZ was elevated. Proton, et al [13] studied the IGC sensitivity of a
2050-T3 aluminium alloy friction stir welded joint and observed that it was higher than that of the base
metal (BM); the electrochemical test showed that the galvanic corrosion that was formed in the
different regions of the joint may have affected the corrosion behaviour of the joint.
In this work, the corrosion resistance of a laser-arc hybrid welded 2195 Al-Li alloy was
investigated at different laser powers. Relatively little research has been conducted on the corrosion
resistance of this process. This work is of great significance for the safe use of 2195 Al-Li alloys in
aerospace applications .
2. EXPERIMENTAL MATERIALS AND METHODS
Sheets comprising the 2195 Al-Li alloy with a thickness of 3 mm were received in the T8
condition. An ER4047 Al-Si filler wire with a diameter of 1.2 mm was used for the welding. The
chemical composition of the filler wire and BM are given in Table 1 and Table 2.
Table 1. Chemical composition of the 2195 Al-Li alloy (wt.%)
Cu Li Mg Ag Zr Fe Al
4 1 0.44 0.4 0.11 0.05 Bal
Table 2. Chemical compositions of the Al-Si filler wire (wt.%)
Si Mg Fe Cu Zn Mn Al
12 ≤0.10 ≤0.80 ≤0.03 ≤0.20 ≤0.15 Bal
The welded joints were manufactured by a hybrid-arc welding system consisting of a fibre laser
(IPG YLS-4000-S2T-CL) and MAG welder (Kemp Arc Pulse 450). The 2195 Al-Li alloy plates were
placed horizontally, and the assembly gap was 0.5 mm, which was fixed by a clamping device. The
laser was perpendicular to the 2195 Al-Li alloy sheet and approximately 30° to the MAG arc. The two
welding heat sources were combined to act on the 2195 Al-Li alloy to be welded. The shielding gas
was dry pure argon gas. The welding parameters that were used are summarized in Table 3.
Int. J. Electrochem. Sci., Vol. 15, 2020
282
Table 3. The welding parameters of hybrid laser-arc welding
Laser power
(W)
Wire
feeding
rate
(mm/s)
Welding
velocity
(mm/s)
Welding current
(A)
Welding voltage
(V)
700
1000
1300
8
8
8
11.5
11.5
11.5
142
143
147
19
19
18.5
After welding, cross sections of the welds were cut with a wire-electrode from the joints that
were welded with different laser powers. The welded joints were ground, polished and etched with
Keller solution (HF: HCL: HNO3: H2O =2:3:5:190) for optical microscopy (OM, DME-300M). The
microstructure of the weld cross sections was observed by scanning electron microscopy (SEM, FEI
Quanta 650 FEG). Afterwards, the phase composition was determined by X-ray diffraction (XRD,
X’Pert PRO MPD)
The electrochemical tests were carried out in a comprehensive electrochemical test system
(PGSTAT 302N). The three-electrode cell consisted of a reference electrode (a saturated calomel
electrode), an auxiliary electrode (a platinum plate) and a working electrode (samples under test). The
test specimen was welded together with copper wire by tin welding, leaving an open area on the
sample for measurement, the rest of the area was sealed with silica gel. During the test, the specimen
was protected from oxidation due to exposure to the ambient air as much as possible. The solution used
in the experiment was a sodium chloride aqueous solution with a mass fraction of 3.5%. The
measurement time of the open circuit potential was 2000 s. The polarization was -0.3 V to 0.33 V and
the scanning rate was 0.02 V/min.
The IGC tests were performed according to the IGC GB7998-2005 test standard. The corrosion
solution was prepared with 57 g NaCl, 1 L H2O and 10 ml H2O2 (ρ 1.10 g/ml). The corrosion time and
temperature were 6 hours and 35℃±2℃, respectively. Before the corrosion test, the surface of the
sample was polished and cleaned with acetone. After 6 hours, the samples were removed and rinsed
gently with deionized water. The samples were dried with cold air. The surface corrosion of the
specimen was observed with a stereomicroscope. Then the cross section of the weld was ground with
sand-paper and polished, the corrosion depth was then measured with an optical microscope.
3. RESULTS AND DISCUSSION
3.1 Microstructure of the weld joints
Fig.1 shows the microstructures of the weld metals that were produced with different laser
powers. With an increase in the laser power from 700 W to 1300 W, the weld microstructures coarsen,
dendrite spacing increases, and secondary dendrites become increasingly developed. Shu, et al [14]
also found that the dendrite size increased simultaneously with increasing laser power. From the
backscattering image, it can be seen that with increasing laser power, the amount of bright white and
dark precipitates decreases, the size of the precipitates increases and the distribution is not uniform.

Int. J. Electrochem. Sci., Vol. 15, 2020
283
Figure 1. SEM micrographs of the microstructure of the weld metals produced with different laser
powers. 700 W: (a) and (b), 1000 W: (c) and (d), 1300 W: (e) and (f)
The analysis shows that an increase in laser power leads to an increase in the welding heat
input, and an increase in the residence time of the molten pool at high temperature, and an increase in
the growth and coarsening of the grains. The coarsening of the grain structure leads to a decrease in the
grain boundaries, and the second phase that precipitates along the the grain boundaries is large and
nonuniform. With an increase in the laser power, the laser keyhole penetrates deeply into the bottom of
the molten pool, the convection of the molten metal in the molten pool intensifies, and the segregation
of alloying elements decreases, which leads to a decrease in the driving force of the second phase
precipitation. Thus, the precipitated phase decreases, which is consistent with the second phase
distribution in the backscattering image.

Int. J. Electrochem. Sci., Vol. 15, 2020
284
Figure 2. XRD diffraction spectra of the weld metals
The phase composition of the weld metals was analysed by X-ray diffraction, as shown in
Fig.2. The main phases in the weld metals are α (Al), θ (Al2Cu) and T (AlLiSi). The composite T
(AlLiSi) and the θ (Al2Cu) phases are the main strengthening phases in the weld when the laser arc is
applied to the 2195 Al-Li alloy with an Al-Si welding wire. It is well known that the θ (Al2Cu) phase is
also the main strengthening phase in 2195 Al-Li alloys [15]. The presence of T (AlLiSi) is consistent
with the previous observation in other Al-Li alloys produced by LBW [16].
3.2 Electrochemistry measurements
Figure 3. Open-circuit potential (OCP) curves for the BM and HAZ in 3.5% NaCl solution
The open-circuit potential and polarization curves from the BM and HAZ are shown in Fig.3
and Fig.4, respectively. Table 4 lists the OCP, Ecorr and Icorr for the BM and HAZ. It can be seen that the
open-circuit potential curve of the HAZ is relatively stable, and above that of the BM. The stabilized
electrode potential of the HAZ is -0.707 V, which is higher than the BM stabilized electrode potential
value of -0.717 V. The fitting results of the polarization curves also show that the BM has a greater
corrosion tendency than the HAZ.

Int. J. Electrochem. Sci., Vol. 15, 2020
285
Figure 4. Polarization curves for the BM and HAZ in 3.5% NaCl solution
Table 4. Open circuit potential (OCP), corrosion potential Ecorr and corrosion current density Icorr for
the BM and HAZ
Position OCP (V) Ecorr (V) Icorr (A/cm2)
HAZ
BM
-0.707
-0.717
-0.710
-0.725 5.219×10⁻⁶
6.012×10⁻⁶
Figure 5. Open-circuit potentials of weld metal produced with different laser powers in 3.5% NaCl
solution
Relevant studies [17-18] show that the strengthening phase in the Al-Li alloy has high
electrochemical activity, and couples readily with the surrounding Al matrix. The strengthening phase
acts as a cathode, and the Al matrix acts as an anode, which leads to the dissolution of the Al matrix. In
a corrosive environment (NaCl solution), the closed circuit is composed of a precipitated phase and a
low potential aluminium matrix, which results in corrosion occurring first around the precipitated
Int. J. Electrochem. Sci., Vol. 15, 2020
286
phase. Therefore, the corrosion resistance of the weld is closely related to the amount of the
precipitated phase. Some of the precipitates dissolve in the HAZ after thermal cycling, so there are
fewer precipitates in the HAZ than in the BM. so the corrosion tendency of the HAZ is lower than that
of the BM and higher than that of the weld metal.
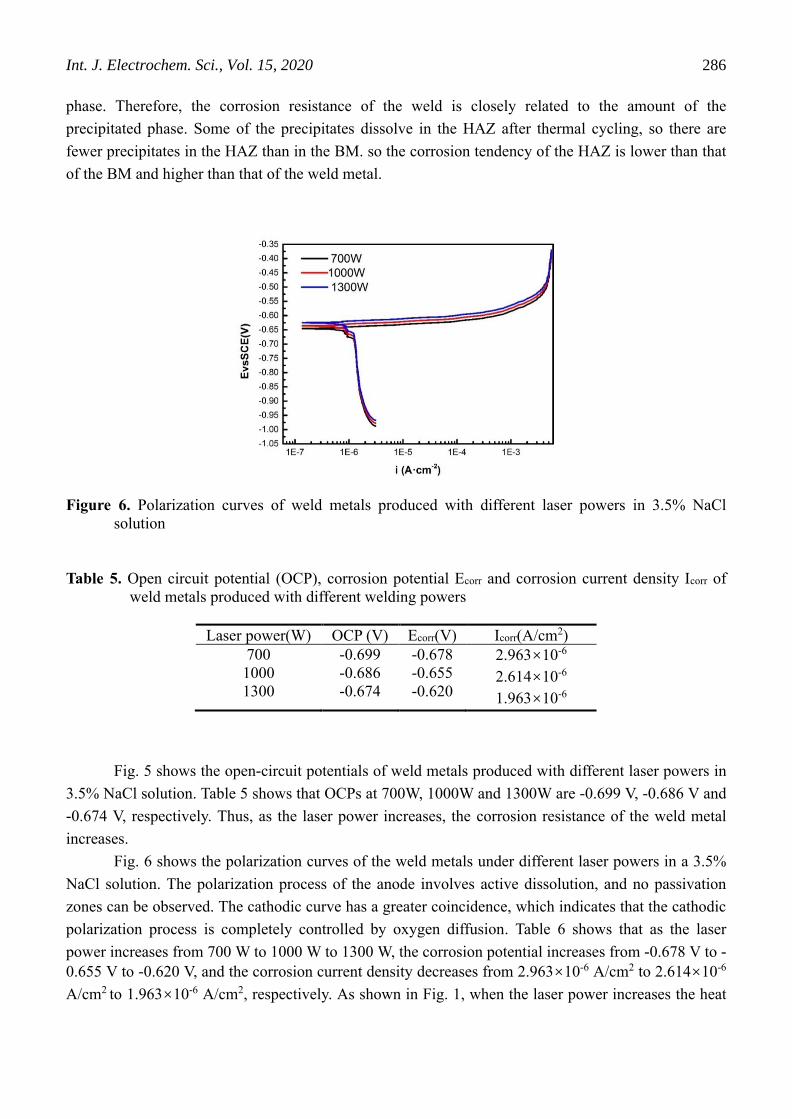
Figure 6. Polarization curves of weld metals produced with different laser powers in 3.5% NaCl
solution
Table 5. Open circuit potential (OCP), corrosion potential Ecorr and corrosion current density Icorr of
weld metals produced with different welding powers
Laser power(W) OCP (V) Ecorr(V) Icorr(A/cm2)
700
1000
1300
-0.699
-0.686
-0.674
-0.678
-0.655
-0.620
2.963×10⁻⁶
2.614×10⁻⁶
1.963×10⁻⁶
Fig. 5 shows the open-circuit potentials of weld metals produced with different laser powers in
3.5% NaCl solution. Table 5 shows that OCPs at 700W, 1000W and 1300W are -0.699 V, -0.686 V and
-0.674 V, respectively. Thus, as the laser power increases, the corrosion resistance of the weld metal
increases.
Fig. 6 shows the polarization curves of the weld metals under different laser powers in a 3.5%
NaCl solution. The polarization process of the anode involves active dissolution, and no passivation
zones can be observed. The cathodic curve has a greater coincidence, which indicates that the cathodic
polarization process is completely controlled by oxygen diffusion. Table 6 shows that as the laser
power increases from 700 W to 1000 W to 1300 W, the corrosion potential increases from -0.678 V to -
0.655 V to -0.620 V, and the corrosion current density decreases from 2.963×10⁻⁶ A/cm2 to 2.614×10⁻⁶
A/cm2 to 1.963×10⁻⁶ A/cm2, respectively. As shown in Fig. 1, when the laser power increases the heat

Int. J. Electrochem. Sci., Vol. 15, 2020
287
input and the cooling rate of the molten pool decreases, the driving force for precipitation decreases,
resulting in a decrease in the amount of precipitation. According to the description above, in a
corrosive environment (NaCl solution), a closed circuit is formed by a precipitated phase and a low
potential aluminium matrix, which leads to accelerated matrix corrosion. Therefore, as the laser power
increases, the corrosion resistance of the weld metal increases.
3.3 IGC behaviours
Different areas of the welded joint are presented in Fig. 7. Severe inter-granular corrosion
morphology is observed on the surface of the weld metal, in which the corrosion products delaminated
due to severe corrosion. The cross-sectional morphology of the weld area shows that the depth of the
inter-granular corrosion is not uniform. The corrosion that is generated and has expanded along the
grain boundaries is presented in the magnified images of the cross-sectional morphology in Fig. 7. The
severity of the corrosion in the HAZ is lower than that of the weld, and a small amount of corrosion
products can be seen on the upper surface, but no obvious corrosion product is has delaminated. The
cross-sectional morphology shows that the depth of the inter-granular corrosion in the HAZ is shallow.
The BM contains corrosion that is peeling away, and the upper surface of the BM is severely corroded,
and large corrosion pits are generated due to delamination of the corrosion products. The cross-
sectional morphology indicates that the corrosion depth of the BM is greater than that of the HAZ and
lower than that of the weld metal. Liu, et al [19] also found that the most severe corrosion occurred in
the weld metal when they studied the corrosion resistance of a 2060 laser welded joint.
Figure 7. Morphology of IGC in different regions of the welded joints
Al-Li alloys usually depend on the precipitation of a strengthening phase to improve their
performance. A large amount of T1 and θ phases are precipitated in the matrix, and distributed in
dislocations, grain boundaries and subgrain boundaries. The electrochemical activity of the

Int. J. Electrochem. Sci., Vol. 15, 2020
288
precipitated phase is high, and the electrochemical activity of the T1 phase is much higher than that of
the aluminum matrix [20]. The corrosion potential of the precipitated phase is high and a potential
difference is formed with the surrounding matrix, resulting in an increase in the corrosion rate of the
surrounding matrix [21]. Therefore, the amount and location of the strengthening phase may have a
direct impact on the occurrence of corrosion.
The Al-Li alloy is subjected to heat treatment to obtain the super-saturation necessary for solid
solution precipitation. Due to the severe distortion of the lattice and high energy at the dislocations,
grain boundaries and subgrain boundaries, the strengthening phase is preferentially precipitated in the
interior of the grains as much as possible to enhance the comprehensive mechanical properties of the
BM. The BM is pre-deformed to increase the number of dislocations and subgrain boundaries within
the grains. However, due to different Schmidt factors at different locations, the ability to plastically
deform is different, and the number of dislocations and sub-grain boundaries in different regions is also
different. In a region with an elevated Schmidt factor, the plastic deformation ability increases and the
number of dislocations and sub-grain boundaries increases, which leads to additional precipitation of
the strengthening phase. These location are preferentially corroded when exposed to an inter-granular
corrosion solution [22-23], which could be attributed to the severe inter-granular corrosion in part of
the BM.
A few corrosion products occur in HAZ and no obvious corrosion products delaminate from the
upper surface, the overall corrosion degree is relatively uniform. The depth of the inter-granular
corrosion is relatively shallow as seen in the cross section of the weld. Due to the thermal cycling
during the welding process, some of the strengthening phases of HAZ are dissolved and remelted into
the BM to form a supersaturated solid solution; some of the phases aggregate and grow, causing the
amount of the overall strengthening phase decrease [24]. At the same time, a considerable portion of
the precipitates in the HAZ are located at dislocations and sub-grain boundaries in the interior of the
grains, and the grain boundary corrosion cannot be accelerated during the inter-granular corrosion
process. Therefore, the corrosion severity in the HAZ is weak. In contrast to the precipitates in HAZ
dispersed in the dislocations, sub-grain boundaries and grain boundaries, the precipitates in the weld
zone are mainly located in the grain boundaries and a small amount are in the grain interiors[19]. A
large amount of copper-rich precipitates at the grain boundaries and in the surrounding BM are prone
to microscopic galvanic corrosion[25]. Therefore, the precipitates at the grain boundaries benefit the
propagation of IGC along the grain boundaries, which increases the severity and depth of the IGC of
the weld metal.

Int. J. Electrochem. Sci., Vol. 15, 2020
289
Figure 8. Morphology and depth of IGC of the weld metals produced with different laser powers. 700
W: (a) and (b), 1000 W: (c) and (d), 1300 W: (e) and (f)
Fig.8 shows the morphology of the IGC in the weld metal under different laser powers. The
depth of the IGC in the cross section of the weld is measured at a magnification of 200 times in the
optical microscope. The IGC samples are covered by a large amount of white corrosion products. The
IGC gradually expands from the surface to the inside of the weld metal, and the corrosion spreads
along the grain boundaries. The IGC depth of the weld metal under different laser powers was
measured. To reflect the corrosion situation as far as possible, the corrosion depth at three different
locations is determined as shown in Table 6.

Int. J. Electrochem. Sci., Vol. 15, 2020
290
Table 6. IGC depth of weld metal under different laser power
Laser power (W) 700 1000 1300
Corrosion depth (μm)
157 142 147
189 184 127
167 143 164
Average corrosion depth (μm) 171 156 146
Maximum corrosion depth (μm) 189 184 164
Figure 9. IGC depth in weld metals produced with different laser powers
Fig.9 is a line diagram of the IGC depth of the weld metals produced with different laser
powers. With increasing laser power, the average IGC depth decreases gradually, from 171 μm (at 700
W) to 156 μm (at 1000 W). When the laser power continues to increase to 1300 W, the average IGC
depth decreases to 146 μm. Similarly, the maximum IGC depth of the weld metal tends to decrease
with increasing laser power. At 700 W, the maximum corrosion depth is 189 μm while it is 164 μm at
1300 W, The maximum corrosion depth decreases by approximately 13%. The analysis shows that
with increasing laser power, the uniformity of the composition distribution increases and the driving
force for the nucleation of the second phase at the solid-liquid interface decreases, so the second phase
precipitated that precipitates at the grain boundaries decreases with increasing laser power. IGC mainly
occurs along the grain boundaries. A decrease in the second phase in the grain boundary leads to a
decrease in the corrosion rate. Xue, et al [26] also found that the depth of IGC was related to the
amount of precipitates. Therefore, the average and maximum depth of the inter-granular corrosion of
the welds decreases with increasing laser power.
4. CONCLUSIONS
(1) As the laser power increases, the microstructure of the weld coarsens, the amount of bright
white and dark black precipitates decreases, the size of the precipitated phase increases and the
distribution is nonuniform.

Int. J. Electrochem. Sci., Vol. 15, 2020
291
(2) Electrochemical tests show that among the weld metal, the corrosion resistance of the BM
is the lowest, while that of the weld metal is the highest, and that of the HAZ is between that of the
BM and the weld metals. As the laser power increases, the corrosion resistance of the weld metal
increases.
(3) The results of the IGC of the welded joints show that among the weld metals, the HAZ has
the best IGC resistance and the corrosion degree is low; The IGC of BM is more severe than that of
HAZ, where the local corrosion is obvious. The weld metal is the most severely corroded, because the
surface is covered with a large amount of white corrosion products.
(4) The IGC test in the weld metal shows that the average and maximum depth of IGC
decreases with increasing laser power. When the laser power reaches 1300 W, the average and
maximum depths are 146 μm and 164 μm, respectively.
References
1. R. J. Rioja, J. Liu, Metallurgical and Materials Transactions, 43 (2012) 3325.
2. N. Nayan, S. V. S. N. Murty, A. K. Jha, B. Pant, S. C. Sharma, K. M. George, Materials Science
and Engineering, 576 (2013) 21.
3. J. Zhang, X. S. Feng, J. S. Gao, H. Huang, Z. Q. Ma, L. J. Guo, Journal Of Materials Science &
Technology, 34 (2018) 219.
4. T. Dursun, C. Soutis, Materials & Design, 56 (2014) 862.
5. I. G. Solórzano, F. A. Darwish, M. C. de Macedo, S. O. de Menezes, Materials Science and
Engineering, 348 (2003) 251.
6. M.S. han, S. J. Lee, J. Cheul, Transactions of Nonferrous Metals Society of China, 19 (2009) S17.
7. P. Cavaliere, M. Cabibbo, F. Panella, A. Squillace, Materials & Design, 30 (2009) 3622.
8. Y. Mei, L. Yang, Z. Junlei, X. Dong, Z. Zhimin, W. Dan, Transactions of the Indian Institute of
Metals, 71 (2018) 2487.
9. P. Cavaliere, M. Cabibbo, F. Panella, A. Squillace, Materials & Design, 30 (2009) 3622.
10. A. Balbo, A. Frignani, V. Grassi, F. Zucchi, Corrosion Science, 73 (2013) 80.
11. W. Xu, J. Liu, Corrosion Science, 51 (2009) 2751.
12. E. Bousquet, M. Puiggali, O. Devos, M. Touzet, Corrosion Science, 53 (2011) 3034.
13. V. Proton, J. Alexis, E. Andrieu, Journal Of The Electrochemical Society, 158 (2011) C139.
14. F. Y. Shu, L. Wu, H. Y. Zhao, S. H. Sui, L. Zhou, J. Zhang, Materials Letters, 211 (2017) 235.
15. A. A. El-Aty, Y. Xu, X. Guo, S. Zhang, D. Chen, Journal of Advanced Research, 10 (2017) 49.
16. X. Zhang, T. Huang, W. Yang, R. Xiao, Z. Liu, L. Li, Journal of Materials Processing Technology,
237 (2016) 301.
17. X. J. Wang, T. Zhao, Chinese Journal of Aeronautics, 24(2011) 681.
18. L. I. Jin-Feng, W. J. Chen, X. S. Zhao, W. D. Ren, Z. Q. Zheng, Transactions Of Nonferrous
Metals Society of China, 16 (2006) 1177.
19. F. Liu, X. Wang, B. Zhou, C. Huang, F. Lyu, Materials, 11(2018).
20. Y. Ma, X. Chen, X. Zhou, Y. Yi, Y. Liao, W. Huang, Surface and Interface Analysis, 48 (2016)
739.
21. Y. Ma, X. Zhou, Y. Liao, Y. Yi, H. Wu, Z. Wang, Corrosion Science, 107 (2016) 41.
22. Q. Liu, R. H. Zhu, D. Y. Liu, Y. Xu, J. F. Li, Y. L. Chen, Materials & Corrosion, 68 (2017).
23. O. Noémie, Metallurgical and Materials Transactions, 48 (2017) 51.
24. B. Decreus, A. Deschamps, P. Donnadieu, Materials Science and Engineering, 586 (2013) 418.
25. L Dong, J Schneider, Journal of Materials Science, 43(2008) 7445.

Int. J. Electrochem. Sci., Vol. 15, 2020
292
26. X. U. Yue, X.Wang, Z. Yan, L. I. Jiaxue, Chinese Journal of Aeronautics, 24 (2011) 681.
© 2020 The Authors. Published by ESG (www.electrochemsci.org). This article is an open access
article distributed under the terms and conditions of the Creative Commons Attribution license
(http://creativecommons.org/licenses/by/4.0/).


