
Submitted 6 June 2014Accepted 10 September 2014Published 30 September 2014
Corresponding authorJonathan M. Peterson,[email protected]
Academic editorRanji Cui
Additional Information andDeclarations can be found onpage 12
DOI 10.7717/peerj.605
Copyright2014 Peterson et al.
Distributed underCreative Commons CC-BY 4.0
OPEN ACCESS
Effect of obesity and exercise on theexpression of the novel myokines,Myonectin and Fibronectin type IIIdomain containing 5Jonathan M. Peterson1,2, Ryan Mart2 and Cherie E. Bond3
1 Department of Health Sciences, College of Public Health, East Tennessee State University,Johnson City, TN, USA
2 Quillen College of Medicine, East Tennessee State University, Johnson City, TN, USA3 Ferrum College, Ferrum, VA, USA
ABSTRACTMetabolic dysfunction in skeletal muscle is a major contributor to the develop-ment of type 2 diabetes. Endurance exercise training has long been established asan effective means to directly restore skeletal muscle glucose and lipid uptake andmetabolism. However, in addition to the direct effects of skeletal muscle on glucoseand lipids, there is renewed interest in the ability of skeletal muscle to coordinatemetabolic activity of other tissues, such as adipose tissue and liver. The purpose ofthis study was to examine the effects of endurance exercise on the expression level oftwo novel muscle-derived secreted factors, or myokines, Myonectin and Fibronectintype III domain containing 5 (FNDC5), the precursor for Irisin.Methods. We performed immunoblot analysis and quantitative real-time PCR anal-ysis of Myonectin and FNDC5 in the diaphragm muscles of obese Zucker rat (OZR)and lean Zucker rat (LZR) with 9 weeks of aerobic training on a motorized treadmill.Results. We show that myonectin gene expression is increased in the OZR model ofobesity and decreases with exercise in both lean and obese Zucker rats. Conversely,myonectin protein concentration was elevated with exercise. Similarly, FNDC5mRNA levels are significantly higher in the OZR, however exercise training hadno effect on the expression level of FNDC5 in either the LZR or OZR. We did notobserve any difference in muscle protein content of Irisin with obesity or exercise.Conclusion. Our data shows that exercise training does not increase either FNDC5or myonectin gene expression, indicating that increased transcriptional regulationof these myokines is not induced by exercise. However, our data also indicates a yetto be explored disconnect between myonectin gene expression and protein content.Further, this report highlights the importance of verifying reference genes whencompleting gene expression analysis. We found that many commonly used referencegenes varied significantly by obesity and/or exercise and would have skewed theresults of this study if used to normalize gene expression data. The unstable referencegenes include: beta-Actin, beta-2-microglobulin, Non-POU domain containing,octamer-binding, Peptidylprolyl isomerase H, 18S ribosomal RNA, TATA box bind-ing protein and Transferrin receptor.
How to cite this article Peterson et al. (2014), Effect of obesity and exercise on the expression of the novel myokines, Myonectin andFibronectin type III domain containing 5. PeerJ 2:e605; DOI 10.7717/peerj.605

Subjects Molecular Biology, Diabetes and Endocrinology, Kinesiology, Metabolic SciencesKeywords Fatty acids, Aerobic training, Metabolic syndrome, Irisin, CTRP15
Obesity and diabetes are the top health problems in the developed world, and major
contributors to the development of cardiovascular disease (Ng et al., 2013). Skeletal
muscle metabolism is an important regulator in control of whole body glucose and
lipid homeostasis. Further, the reduction in insulin-mediated skeletal muscle glucose
uptake has long been recognized to be an important underlying mechanism of type 2
diabetes (Bogardus, 1989). Lifestyle modification, specifically increased physical activity,
has demonstrated enormous therapeutic potential to reverse skeletal muscle insulin
resistance.
While the direct role of skeletal muscle metabolism in regulating glucose and lipid
metabolism is well established, the potential endocrine-like functions of skeletal muscle
to influence glucose and lipid metabolism in other tissues have only recently begun to be
investigated. With the advent of proteomics, a number of muscle-derived secreted factors,
collectively called myokines, have been identified (Norheim et al., 2011; Henningsen et al.,
2010). Interleukin 6 (IL-6) is the first and most well studied myokine, and it is increased
with exercise (Northoff & Berg, 1991; Haahr et al., 1991; Ostrowski et al., 2001). IL-6 acts
to stimulate hepatic glucose production and enhances glucose uptake by insulin-sensitive
tissues (Stouthard et al., 1995; Stouthard, Oude Elferink & Sauerwein, 1996). These studies
have provided the first endocrine-like function of skeletal muscle and established a link
between exercise and systemic metabolic parameters (Sandler et al., 1990). In addition to
IL-6, a large number of other muscle-derived secretory proteins have been identified. The
purpose of this paper was to examine the impact of obesity and chronic exercise training
on two of these novel myokines: (1) fibronectin type III domain containing 5 (FNDC5),
and (2) C1q TNF related Protein 15/myonectin, hereafter referred to as myonectin. FNDC5
is a membrane protein that is cleaved and its proteolytic cleavage product is secreted as
the hormone, irisin (Bostrom et al., 2012). Myonectin is a newly discovered protein with
a characteristic C1q domain sequence shared by proteins within the novel CTRP protein
family (Seldin et al., 2012).
Both myonectin and irisin have shown promise as therapeutic targets for metabolic
diseases known to improve with exercise. Myonectin lowers circulating levels of free fatty
acids by increasing uptake in adipose and liver tissues, and is increased with exercise, but
lowered in a high fat diet model of obesity (Seldin et al., 2012). Irisin, on the other hand,
increases energy expenditure by inducing brown-fat-like conversion of white adipose
tissue (Bostrom et al., 2012). However, the regulation of circulating irisin levels and
FNDC5 gene expression by obesity and exercise are unclear and recently reviewed
by Polyzos et al. (2013). Briefly, exercise causes an increase circulating irisin protein
levels and/or FNDC5 mRNA expression in some (Bostrom et al., 2012; Huh et al., 2012;
Brenmoehl et al., 2014), but not all studies (Huh et al., 2012; Kurdiova et al., 2014; Timmons
et al., 2012; Timmons et al., 2005; Gallagher et al., 2010; Seo et al., 2014), whereas, obesity
Peterson et al. (2014), PeerJ, DOI 10.7717/peerj.605 2/16

has either a positive (Polyzos et al., 2013; Huh et al., 2012; Timmons et al., 2012) or a
negative (Seo et al., 2014; Peterson et al., 2008b) association with irisin/FNDC5.
It is the purpose of this study to examine the combined effects of exercise and obesity on
the regulation of myonectin and FNDC5 gene expression. This study may give clues to un-
derstanding the mechanism behind the endocrine benefits of regular exercise with obesity.
METHODSAnimalsThe diaphragm muscles were kindly provided by the lab of Stephen E. Alway, as
reported from a previous study (Peterson et al., 2008b; Peterson et al., 2008a). Briefly,
equal numbers of 6-wk-old male Obese Zucker rats (OZR) and lean zucker rats (LZR)
(Harlan, Indianapolis, IN) were randomly assigned to control (Control, n = 8) or training
(Exercised, n = 8) groups. The OZR is a genetic model of obesity due to the presence
of the recessive missense mutation (fa/fa) in the leptin receptor gene, whereas the LZR
has a functioning leptin receptor (Fa/fa or Fa/Fa) (Ogawa et al., 1995; Stern et al., 1972;
Godbole & York, 1978; Takaya et al., 1996). Compared to the LZR, the OZR exhibits severe
obesity, hyperphagia, hyperinsulinemia, hyperleptinemia, and hyperlipidemia (Ogawa
et al., 1995; Stern et al., 1972; Godbole & York, 1978; Takaya et al., 1996). Animals were
housed in pathogen-free conditions, two per cage, at 20–22 ◦C with a reversed 12:12-h
light–dark cycle, and fed rat chow and water ad libitum throughout the study period.
All animal procedures were conducted in accordance with institutional guidelines, and
ethical approval was obtained from the Animal Care and Use Committee at West Virginia
University (ACUC #07-0302).
Training protocolLZR and OZR were exercise trained by running on a level motorized rodent treadmill
(Columbus Instruments, Columbus, OH) 5 d/wk for 9 wk, as previously reported (Peterson
et al., 2008b; Peterson et al., 2008a). Briefly, during the first 4 wk, the speed of the treadmill
and duration of the training sessions was increased gradually from a speed of 10 m/min
for 10 min to a final running speed of 20 m/min for the OZR and 24 m/min for the LZR.
During the training sessions, mild electrical shock was applied, if necessary, to maintain
the animals’ running motivation. A slower final running speed was used in the OZR group
to compensate for the increased intensity of exercise for these animals that resulted from
their greater body weight as compared with LZR. As reported previously, the workload
was estimated based on the following formula: Work = 1/2 mass ∗ velocity squared
(W = 1/2 m ∗ V2). The average body weight of 500 g for the OZR and 350 g for the
LZR were used to calculate the treadmill speeds to produce an approximate work output
of 0.028 J. These speeds were also reliably maintained by the OZR and LZR, with minimal
requirements for external motivation by the investigators. This approach was successful
as determined by similar increases in mitochondrial protein content and activity in the
trained groups (Peterson et al., 2008b; Peterson et al., 2008a). Animals assigned to the
Peterson et al. (2014), PeerJ, DOI 10.7717/peerj.605 3/16
control group were handled daily and exposed to the noise of the running treadmill by
placing their cages next to the treadmill during the exercise session.
Tissue collectionForty-eight hours after the last training session and an overnight fast (∼16 h), the
animals were anesthetized with injections of pentobarbital sodium (50 mg/kg ip) and
euthanized via cardiac puncture. The diaphragm muscles were quickly removed, frozen
immediately in liquid nitrogen and stored at −80 ◦C until further analysis. It has been
previously documented that exercise training has similar effects on the diaphragm as leg
muscles (Moore & Gollnick, 1982). Further, we confirmed the expected increase in the
mitochondrial protein Cytochrome c Oxidase Subunit IV (COX IV) as a marker of total
mitochondrial content.
RNA isolation and reverse transcriptionTotal RNA was extracted according to standard procedures. Briefly, tissues were homog-
enized in Trizol reagent (Life Technologies) using a Kinematica polytron in three 30 s
bursts, separated by 10 min incubations on ice. After centrifugation at 13.2 rcf, 4 ◦C
for 5 min to remove residual particulates, phase separation was accomplished using
3-bromo-5-chloropentane, followed by centrifugation for 15 min at 13.2 rcf, 4 ◦C. RNA
was precipitated from the aqueous phase by mixing with an equal volume 70% ethanol,
and then was loaded onto a nucleotide binding column (RNeasy Mini-Kit; Qiagen).
On-column DNA digestion was performed using RNase-free DNase (Qiagen) to eliminate
residual genomic DNA contamination as per the manufacturer’s instructions. RNA was
eluted in 50 µl RNase-free water; purity (RIN ≥ 7.0) and concentration were confirmed by
microfluidic capillary electrophoresis using an Agilent BioAnalyzer. 1 µg total RNA of each
sample was reverse transcribed in a final volume of 20 µl, using GoScript® cDNA synthesis
reagents (Promega).
Analysis of reference genesTo screen for potential stable reference genes, an aliquot 1 µl of prepared cDNA from
each animal was pooled by group and treatment and the relative content of each reference
gene was determined by PCR array according to manufactures directions (RT2 Profiler
PCR Array; Rat Housekeeping Genes; Qiagen PARN-000ZA). Assuming a perfect efficient
reaction, the difference between 1 quantification cycle (Cq) equals a 2-fold difference in
starting RNA quantity. Variability of reference genes was deemed to be unacceptable if
the maximum difference among the four groups was greater than 0.5 Cq. Reference genes
examined are listed in Table 2.
Quantitative real time PCR analysisValidated PCR primers for Myonectin, FNDC5/irisin, Hprt1, Ldha, and RN18S were
purchased from SABiosciences (Table 3). A 10-fold dilution series of DNA amplicons
generated from an untrained LZR rat muscle was employed as a standard curve for each
gene of interest, and the qPCR efficiency was determined for each gene, using a Bio-Rad
Peterson et al. (2014), PeerJ, DOI 10.7717/peerj.605 4/16

Cfx thermocycler. Briefly, 0.5 µl of cDNA from the reverse transcription reaction was
incubated in appropriate mix (SABbiosciences) for an initial denaturation at 94 ◦C for
30 s, followed by 40 PCR cycles each consisting of 95 ◦C for 0 s, 61 ◦C for 7 s, and 72 ◦C
for 10 s. All qRT-PCR primers displayed a coefficient of correlation greater than 0.99
and efficiencies between 90% and 110%. Data is reported as copy number per amount
of starting RNA (0.25 ng per reaction). Specificity of amplification products was further
confirmed by analyzing melting curve profiles for primers and products and subjecting the
amplification products to agarose gel electrophoresis.
Immunoblot analysisDiaphragm muscles were prepared in lysis buffer (20 mM Tris pH 7.5, 150 mM NaCl, 1%
Nonidet P-40, 0.5% sodium deoxycholate, 1 mM EDTA, 0.1% SDS) with protease and
phosphatase inhibitor cocktails (Sigma). The protein concentration was determined using
a Coomassie Plus protein assay reagent (Thermo Scientific). For each sample, 10 µg of
protein were loaded and separated on a SDS-polyacrylamide gel, according manufactures
direction (BioRad). The proteins were then transferred to Nitrocelluloseous membranes
blocked with milk and incubated with Rabbit polyclonal anti-peptide antibody that can
recognize myonectin (epitope 77-KQSDKGI NSKRRSKARR-93). Myonectin antibody was
kindly provided by the lab of GW Wong and had been used previously (Seldin et al., 2012).
Glyceraldehyde 3-phosphate dehydrogenase (GAPDH) antibody was purchased from
Novus Biologicals (NB300-221), COX IV antibody was purchased from Cell Signaling
Technology (4844), and FNDC5 antibody was purchased from Abcam (ab131390). Anti-
body detection was performed with the appropriate horseradish perioxidase-conjugated
secondary antibodies. Visualizations were completed with MultiImage III FuorChem® M
(Alpha Innotech) and quantifications were performed by Alphaview Software (Alpha
Innotech).
Statistical analysis
Analyses were performed using GraphPad Prism® 5 software package. Student’s T-test
was used for comparisons between control and exercise trained animals within the same
genotype (Fig. 3). A one-way ANOVA, followed by Bonferroni multiple comparisons post
hoc analysis, were performed when comparisons were made among all groups (Fig. 2).
Statistical significance was accepted at P < 0.05. All data are given as means ± SE. No
statistical analysis was performed on the PCR array data of pooled samples (Fig. 1). A
reference gene was deemed acceptable for further analysis if the maximum Cq difference
among the pooled samples from the 4 groups was less than 0.5.
RESULTS AND DISCUSSIONThe purpose of this study was to examine the regulation of myonectin and FNDC5 in
skeletal muscles of a genetic model of obesity and then to determine the combined effects
of obesity and exercise on the gene expression of these two proteins. To our knowledge, this
is the first study to examine the effect of obesity combined with exercise training on skeletal
muscle gene expression of the novel myokines myonectin and FNDC5. Although a number
Peterson et al. (2014), PeerJ, DOI 10.7717/peerj.605 5/16
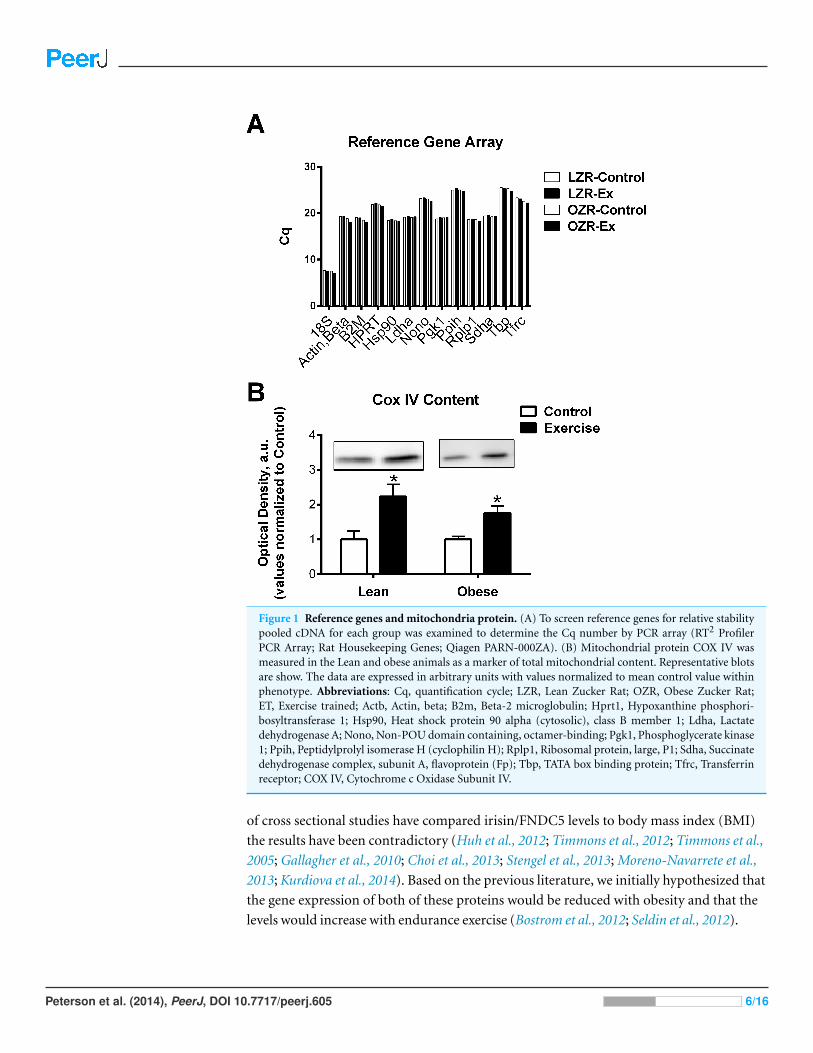
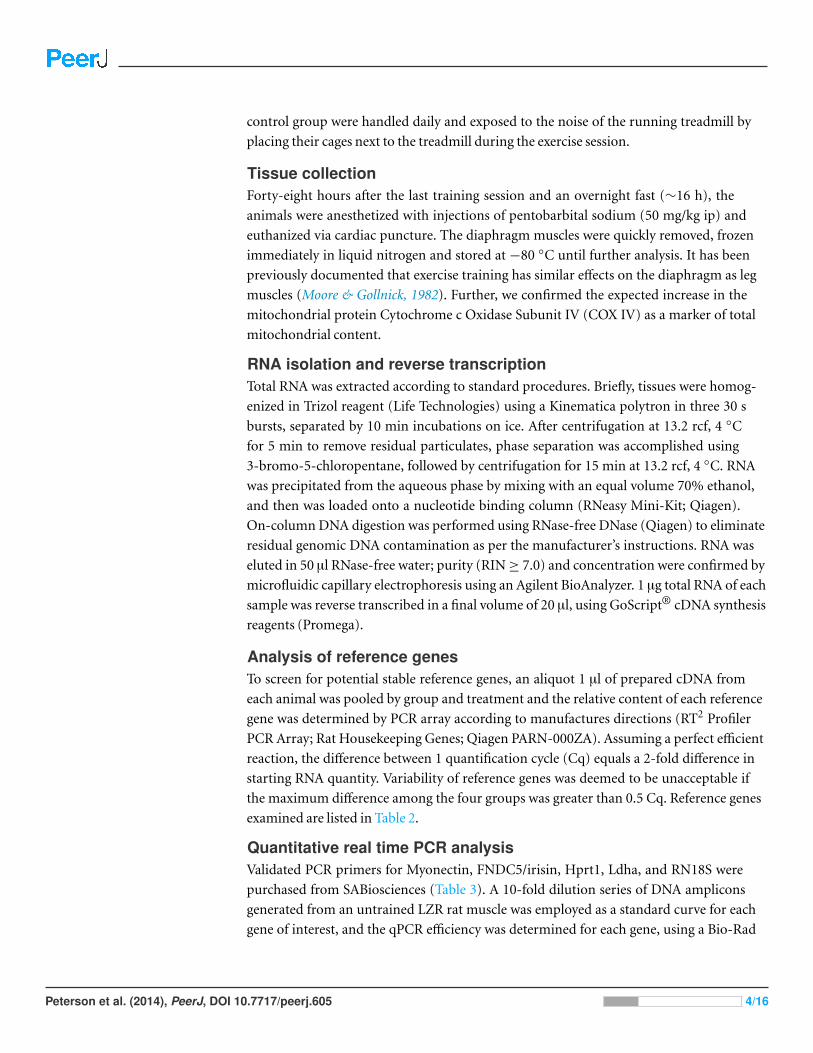
Figure 1 Reference genes and mitochondria protein. (A) To screen reference genes for relative stabilitypooled cDNA for each group was examined to determine the Cq number by PCR array (RT2 ProfilerPCR Array; Rat Housekeeping Genes; Qiagen PARN-000ZA). (B) Mitochondrial protein COX IV wasmeasured in the Lean and obese animals as a marker of total mitochondrial content. Representative blotsare show. The data are expressed in arbitrary units with values normalized to mean control value withinphenotype. Abbreviations: Cq, quantification cycle; LZR, Lean Zucker Rat; OZR, Obese Zucker Rat;ET, Exercise trained; Actb, Actin, beta; B2m, Beta-2 microglobulin; Hprt1, Hypoxanthine phosphori-bosyltransferase 1; Hsp90, Heat shock protein 90 alpha (cytosolic), class B member 1; Ldha, Lactatedehydrogenase A; Nono, Non-POU domain containing, octamer-binding; Pgk1, Phosphoglycerate kinase1; Ppih, Peptidylprolyl isomerase H (cyclophilin H); Rplp1, Ribosomal protein, large, P1; Sdha, Succinatedehydrogenase complex, subunit A, flavoprotein (Fp); Tbp, TATA box binding protein; Tfrc, Transferrinreceptor; COX IV, Cytochrome c Oxidase Subunit IV.
of cross sectional studies have compared irisin/FNDC5 levels to body mass index (BMI)
the results have been contradictory (Huh et al., 2012; Timmons et al., 2012; Timmons et al.,
2005; Gallagher et al., 2010; Choi et al., 2013; Stengel et al., 2013; Moreno-Navarrete et al.,
2013; Kurdiova et al., 2014). Based on the previous literature, we initially hypothesized that
the gene expression of both of these proteins would be reduced with obesity and that the
levels would increase with endurance exercise (Bostrom et al., 2012; Seldin et al., 2012).
Peterson et al. (2014), PeerJ, DOI 10.7717/peerj.605 6/16

Figure 2 Quantitative RNA analysis. Myonectin (A), FNDC5/irisin (B), RN18S (C), Ldha (D), andHprt1 (E). Validated PCR primers were purchased from SABiosciences (Table 3). A standard curve wasgenerated from 10-fold dilution series of DNA amplicons for each gene of interest. All qRT-PCR primersdisplayed a coefficient of correlation greater than 0.99 and efficiencies between 90% and 110%. Data isreported as copy number per amount of starting RNA. The main effects of obesity (OZR × LZR) andexercise interaction (obesity × exercise) in these animals were analyzed by a two-way ANOVA. Data arepresented as means ± SE. ∗p < 0.05, data significantly different between control and exercised groups.∗∗p < 0.05, data from OZR animals was significantly different from the LZR animals.
Characterization of animalsOur goal in the training regime was to attempt to match final workload between the
LZR and OZR. This approach was successful as determined by similar increases in
mitochondrial protein content and activity in the trained groups (Peterson et al., 2008b;
Peterson et al., 2008a) and Fig. 1B. Although this workload was sufficient to lower body
Peterson et al. (2014), PeerJ, DOI 10.7717/peerj.605 7/16

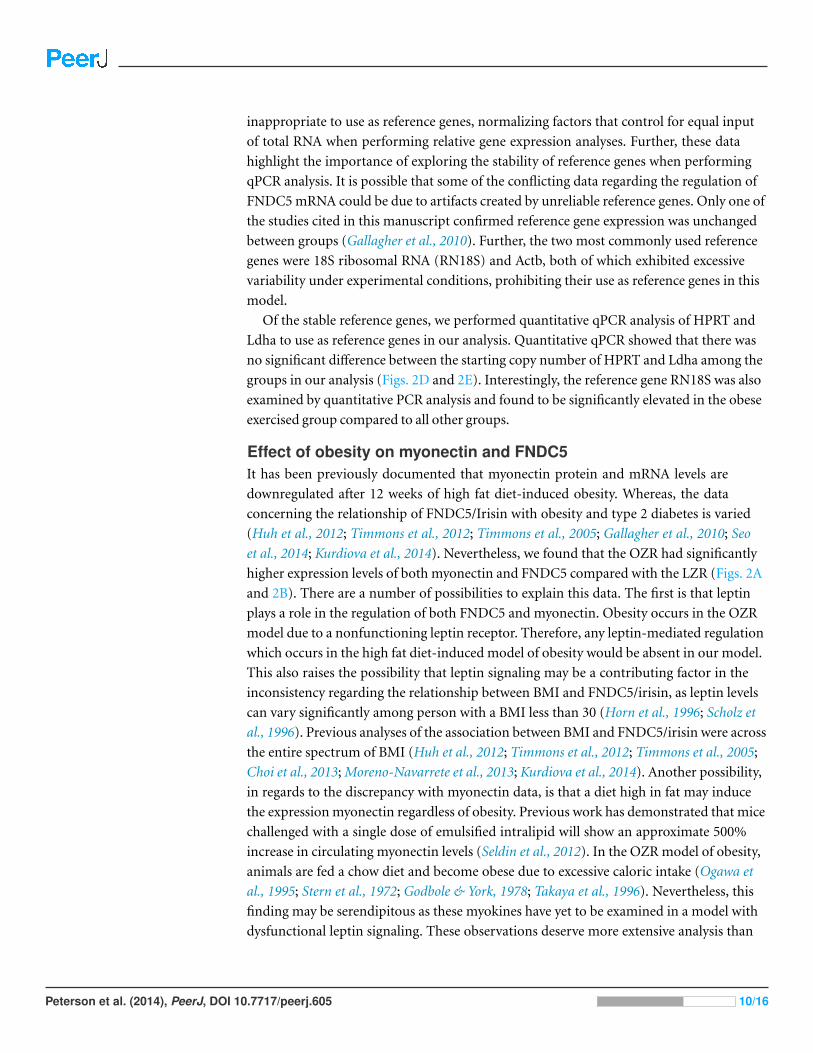
Figure 3 Relative Myonectin/CTRP15 content. Relative Myonectin/CTRP15 content was examined inthe rat diaphragm muscle of the male lean zucker (LZR) and obese zucker rats (OZR). Exercised animalswere trained on a motorized treadmill for 9 wk. Control animals were exposed to the similar environment(positioned next to the treadmill) but were not exercised. (A) Shows representative western blots forMyonectin and GAPDH. (B) The data are expressed in arbitrary units with values normalized to meancontrol value within phenotype.
weight and fasting insulin levels (Table 1) in the OZR, it was not sufficient to induced
significant changes in the LZR in these variables.
Identification of appropriate reference genesOur data was able to confirm that HPRT, HSP90, Ldha, Pgk1, Rplp1, and Sdha remained
relatively stable (Cq variability less than 0.5) regardless of obesity or exercise training
(Fig. 1A). However, we also observed that there was greater than 1 Cq difference, among
the groups examined, in gene expression of Actb, B2m, and Tfrc (Fig. 1A and Table 2).
Assuming an efficient reaction, 1 Cq difference represents an approximate 2-fold difference
in starting RNA content. This indicates that some commonly used reference genes
are effected by the specific set of conditions described in this study and therefore are
Peterson et al. (2014), PeerJ, DOI 10.7717/peerj.605 8/16

Table 1 Baseline characteristics of study animals. Values are means SE.
LZR-SED(n = 8)
LZR-EX(n = 8)
OZR-SED(n = 8)
OZR-EX(n = 8)
Mass, g 358 ± 18 360 ± 19 685 ± 24.5 502 ± 24*
Blood glucose, mg/dl 116 ± 9 108 ± 10 188 ± 24 179 ± 41*
Plasma insulin, ng/ml 1.5 ± 0.4 1.3 ± 0.5 10.7 ± 1.2 6.7 ± 1.6
Notes.n, no. of animals; LZR, lean Zucker rat; EX, exercise; SED, non-exercised; OZR, obese Zucker rat.
* P + 0.05 vs. Sed.
Table 2 Rat housekeeping genes. Variability of reference genes was deemed to be unacceptable if themaximum difference among the four groups was greater than 0.5 Cq. Reference genes examined arelisted in Table 1.
Gene name Abbreviation Maximum Cqdifference
Actin, beta Actb 1.4
Beta-2 microglobulin B2m 1.0
Hypoxanthine phosphoribosyltransferase 1 Hprt1 .5
Heat shock protein 90 alpha Hsp90 .49
Lactate dehydrogenase A Ldha .19
Non-POU domain containing Nono .78
Phosphoglycerate kinase 1 Pgk1 .36
Peptidylprolyl isomerase H Ppih .61
RPLP1 ribosomal protein, large, P1 Rplp1 .44
Succinate dehydrogenase complex, subunit A Sdha .33
TATA box binding protein Tbp .85
Transferrin receptor Tfrc 1.13
Notes.Cq, quantification cycle.
Table 3 Quantitative real time PCR analysis. Validated PCR primers for Myonectin, FNDC5/irisin, Hprt1, Ldha, and RN18S were purchased fromSABiosciences.
Gene name Abbreviation Accession # Catalognumber
Hypoxanthine phosphoribosyltransferase 1 Hprt1 NM 012583.2 PPR42247F
18S ribosomal RNA RN18S NR 046237.1 PPR72042A
Lactate dehydrogenase A Ldha NM 017025 PPR56603
Myonectin; C1q TNF Related Protein 15;Family with sequence similarity 132, member B
Myonectin XM 001060107.2 PPR68386A
Fibronectin type III domain-containing protein 5;also known as irisin
Irisin XM 001060505.2 PPR46702A
Peterson et al. (2014), PeerJ, DOI 10.7717/peerj.605 9/16
inappropriate to use as reference genes, normalizing factors that control for equal input
of total RNA when performing relative gene expression analyses. Further, these data
highlight the importance of exploring the stability of reference genes when performing
qPCR analysis. It is possible that some of the conflicting data regarding the regulation of
FNDC5 mRNA could be due to artifacts created by unreliable reference genes. Only one of
the studies cited in this manuscript confirmed reference gene expression was unchanged
between groups (Gallagher et al., 2010). Further, the two most commonly used reference
genes were 18S ribosomal RNA (RN18S) and Actb, both of which exhibited excessive
variability under experimental conditions, prohibiting their use as reference genes in this
model.
Of the stable reference genes, we performed quantitative qPCR analysis of HPRT and
Ldha to use as reference genes in our analysis. Quantitative qPCR showed that there was
no significant difference between the starting copy number of HPRT and Ldha among the
groups in our analysis (Figs. 2D and 2E). Interestingly, the reference gene RN18S was also
examined by quantitative PCR analysis and found to be significantly elevated in the obese
exercised group compared to all other groups.
Effect of obesity on myonectin and FNDC5It has been previously documented that myonectin protein and mRNA levels are
downregulated after 12 weeks of high fat diet-induced obesity. Whereas, the data
concerning the relationship of FNDC5/Irisin with obesity and type 2 diabetes is varied
(Huh et al., 2012; Timmons et al., 2012; Timmons et al., 2005; Gallagher et al., 2010; Seo
et al., 2014; Kurdiova et al., 2014). Nevertheless, we found that the OZR had significantly
higher expression levels of both myonectin and FNDC5 compared with the LZR (Figs. 2A
and 2B). There are a number of possibilities to explain this data. The first is that leptin
plays a role in the regulation of both FNDC5 and myonectin. Obesity occurs in the OZR
model due to a nonfunctioning leptin receptor. Therefore, any leptin-mediated regulation
which occurs in the high fat diet-induced model of obesity would be absent in our model.
This also raises the possibility that leptin signaling may be a contributing factor in the
inconsistency regarding the relationship between BMI and FNDC5/irisin, as leptin levels
can vary significantly among person with a BMI less than 30 (Horn et al., 1996; Scholz et
al., 1996). Previous analyses of the association between BMI and FNDC5/irisin were across
the entire spectrum of BMI (Huh et al., 2012; Timmons et al., 2012; Timmons et al., 2005;
Choi et al., 2013; Moreno-Navarrete et al., 2013; Kurdiova et al., 2014). Another possibility,
in regards to the discrepancy with myonectin data, is that a diet high in fat may induce
the expression myonectin regardless of obesity. Previous work has demonstrated that mice
challenged with a single dose of emulsified intralipid will show an approximate 500%
increase in circulating myonectin levels (Seldin et al., 2012). In the OZR model of obesity,
animals are fed a chow diet and become obese due to excessive caloric intake (Ogawa et
al., 1995; Stern et al., 1972; Godbole & York, 1978; Takaya et al., 1996). Nevertheless, this
finding may be serendipitous as these myokines have yet to be examined in a model with
dysfunctional leptin signaling. These observations deserve more extensive analysis than
Peterson et al. (2014), PeerJ, DOI 10.7717/peerj.605 10/16

was possible within the scope of the current study. A third and unfortunate possibility is
that the reference genes by which previous studies normalized the gene expression were
affected by the study parameters and erroneously skewed the gene expression data.
Additionally, we attempted to measure irisin levels in the muscles samples using a
commercially available antibody (Anti-FNDC5 antibody; ab131390). However, according
to the manufacturers there should be a band at 22 kDa and an unidentified band at
∼45 kDa (which corresponds to the size of FNDC5, but was unable to be confirmed
within the constraints of this study). Although we successfully detected the band at 45 kDa,
we only detected a faint band at 22 kDa in some of the samples. Regardless there were no
differences observed among the groups examined of either the 45 kDa or 22 kDa band
(data not shown). It is highly likely that differences may still be detected in circulating irisin
levels, however as this study was a re-examination of previously acquired muscle samples
the serum is no longer available from the animals studied.
The combined effects of Obesity and exercise training onMyonectin expressionIt has been previously documented that short-term exercise exposure (3-weeks free wheel
running) increases the gene expression of myonectin (Seldin et al., 2012). Although
myonectin expression had not been examined after long-term exercise exposure, we were
surprised to find that chronic exercise (9-weeks) reduced myonectin expression regardless
of obesity status (Fig. 2A). Because our findings were contrary to what we anticipated, we
also examined the muscle protein content of myonectin (Fig. 3). These results were even
more confounding since, although myonectin gene expression was reduced with exercise,
myonectin protein content was elevated with exercise, regardless of obesity. Unfortunately,
serum samples were no longer available from these animals to determine the changes
to circulating myonectin levels. However, these data suggest that myonectin may act in
an autocrine fashion to regulated it’s own expression, as has been reported recently for
irisin (Vaughan et al., 2014) and for other myokines such as IL-6 (Bustamante et al., 2014).
This potential autocrine regulation warrants further analysis but was beyond the confines
of the current study.
The combined effects of Obesity and exercise training on FNDC5gene expressionAccording to the literature neither short-term nor chronic exercise alters FNDC5 gene
expression (Bostrom et al., 2012; Brenmoehl et al., 2014). FNDC5 is the precursor for
Irisin, and it has been suggested that exercise causes cleavage of FNDC5, releasing irisin
and driving the exercise-induced ‘browning’ of white adipose tissue (Bostrom et al., 2012;
Castillo-Quan, 2012). This indicates that FNDC5 levels may not be directly regulated by
exercise. However, because FNDC5 levels are reduced with obesity and insulin resistance
we expected to see a restoration of FNDC5 levels with exercise training in the insulin
resistant obese OZR. Although we confirmed that exercise did not effect FNDC5 gene
expression, contrary to our initial hypothesis we found that FNDC5 mRNA levels were
Peterson et al. (2014), PeerJ, DOI 10.7717/peerj.605 11/16

elevated in the OZR (Fig. 3B). As stated earlier, this finding indicates that FNDC5 may be
regulated by leptin, or by dietary fat content.
ConclusionBoth myonectin and irisin have been linked to improved metabolic health outcomes.
Myonectin coordinates lipid homeostasis in liver and adipose tissue with the metabolic
demands of skeletal muscles (Seldin et al., 2012), whereas, irisin increases energy
expenditure in mice through the browning of white adipose tissue (Bostrom et al., 2012).
To date, the combined effects of exercise and obesity on the regulation of myonectin and
irisin have not been examined. This study shows that in the OZR both myonectin and
FNDC5 gene expression are elevated. Further, contrary to previous findings, myonectin
gene expression was negatively regulated by exercise, regardless of obesity. The findings of
this study implicate leptin signaling and high fat diet as a potential novel mechanism in the
regulation of these proteins, and these possibilities warrant future study. Unfortunately,
serum samples were no longer available to analyze the combined effect of exercise and
obesity on the circulating levels of these novel myokines. Future studies should consider
examining the circulating levels of these myokines in a leptin deficient model with and
without exercise or treatment with recombinant leptin.
ACKNOWLEDGEMENTSWe would like to thank the East Tennessee State University Molecular Biology Core Facility
for support in completing quantitative Real-time PCR experiments. We would like to
thank the Lab of Stephen E. Alway for providing the diaphragm muscles used in this study.
ADDITIONAL INFORMATION AND DECLARATIONS
FundingThis work was funded by a grant from the East Tennessee State University Research
Development Committee Major Grants Program (E83044). The funders had no role
in study design, data collection and analysis, decision to publish, or preparation of the
manuscript.
Grant DisclosuresThe following grant information was disclosed by the authors:
East Tennessee State University Research Development Committee Major Grants Program:
E83044.
Competing InterestsThe authors declare there are no competing interests.
Author Contributions• Jonathan M. Peterson conceived and designed the experiments, performed the
experiments, analyzed the data, contributed reagents/materials/analysis tools, wrote
the paper, prepared figures and/or tables, reviewed drafts of the paper.
Peterson et al. (2014), PeerJ, DOI 10.7717/peerj.605 12/16
• Ryan Mart performed the experiments, reviewed drafts of the paper.
• Cherie E. Bond performed the experiments, analyzed the data, contributed
reagents/materials/analysis tools, reviewed drafts of the paper.
Animal EthicsThe following information was supplied relating to ethical approvals (i.e., approving body
and any reference numbers):
All animal procedures were conducted in accordance with institutional guidelines, and
ethical approval was obtained from the Animal Care and Use Committee at West Virginia
University (ACUC# 07-0302).
Supplemental InformationSupplemental information for this article can be found online at http://dx.doi.org/
10.7717/peerj.605#supplemental-information.
REFERENCESBogardus C. 1989. Does insulin resistance primarily affect skeletal muscle? Diabetes/Metabolism
Reviews 5:527–528 DOI 10.1002/dmr.5610050605.
Bostrom P, Wu J, Jedrychowski MP, Korde A, Ye L, Lo JC, Rasbach KA, Bostrom EA,Choi JH, Long JZ, Kajimura S, Zingaretti MC, Vind BF, Tu H, Cinti S, Hojlund K, Gygi SP,Spiegelman BM. 2012. A PGC1-alpha-dependent myokine that drives brown-fat-likedevelopment of white fat and thermogenesis. Nature 481:463–468 DOI 10.1038/nature10777.
Brenmoehl J, Albrecht E, Komolka K, Schering L, Langhammer M, Hoeflich A, Maak S. 2014.Irisin is elevated in skeletal muscle and serum of mice immediately after acute exercise.International Journal of Biological Sciences 10:338–349 DOI 10.7150/ijbs.7972.
Bustamante M, Fernandez-Verdejo R, Jaimovich E, Buvinic S. 2014. Electrical stimulationinduces IL-6 in skeletal muscle through extracellular ATP by activating ca(2+) signalsand an IL-6 autocrine loop. American Journal of Physiology, Endocrinology and Metabolism306:E869–E882 DOI 10.1152/ajpendo.00450.2013.
Castillo-Quan JI. 2012. From white to brown fat through the PGC-1alpha-dependent myokineirisin: implications for diabetes and obesity. Disease Models and Mechanisms 5:293–295DOI 10.1242/dmm.009894.
Choi YK, Kim MK, Bae KH, Seo HA, Jeong JY, Lee WK, Kim JG, Lee IK, Park KG. 2013. Serumirisin levels in new-onset type 2 diabetes. Diabetes Research and Clinical Practice 100:96–101DOI 10.1016/j.diabres.2013.01.007.
Gallagher IJ, Scheele C, Keller P, Nielsen AR, Remenyi J, Fischer CP, Roder K, Babraj J,Wahlestedt C, Hutvagner G, Pedersen BK, Timmons JA. 2010. Integration of microRNAchanges in vivo identifies novel molecular features of muscle insulin resistance in type 2 diabetes.Genome Medicine 2:9 DOI 10.1186/gm130.
Godbole V, York DA. 1978. Lipogenesis in situ in the genetically obese zucker fatty rat (fa/fa): roleof hyperphagia and hyperinsulinaemia. Diabetologia 14:191–197 DOI 10.1007/BF00429780.
Haahr PM, Pedersen BK, Fomsgaard A, Tvede N, Diamant M, Klarlund K, Halkjaer-Kristensen J, Bendtzen K. 1991. Effect of physical exercise on in vitro production ofinterleukin 1, interleukin 6, tumour necrosis factor-alpha, interleukin 2 and interferon-gamma.International Journal of Sports Medicine 12:223–227 DOI 10.1055/s-2007-1024672.
Peterson et al. (2014), PeerJ, DOI 10.7717/peerj.605 13/16

Henningsen J, Rigbolt KT, Blagoev B, Pedersen BK, Kratchmarova I. 2010. Dynamics of theskeletal muscle secretome during myoblast differentiation. Molecular and Cellular Proteomics9:2482–2496 DOI 10.1074/mcp.M110.002113.
Horn R, Geldszus R, Potter E, Von zur Muhlen A, Brabant G. 1996. Radioimmunoassay forthe detection of leptin in human serum. Experimental and Clinical Endocrinology & Diabetes104:454–458 DOI 10.1055/s-0029-1211484.
Huh JY, Panagiotou G, Mougios V, Brinkoetter M, Vamvini MT, Schneider BE, Mantzoros CS.2012. FNDC5 and irisin in humans: I. Predictors of circulating concentrations inserum and plasma and II. mRNA expression and circulating concentrations in responseto weight loss and exercise. Metabolism: Clinical and Experimental 61:1725–1738DOI 10.1016/j.metabol.2012.09.002.
Kurdiova T, Balaz M, Vician M, Maderova D, Vlcek M, Valkovic L, Srbecky M, Imrich R,Kyselovicova O, Belan V, Jelok I, Wolfrum C, Klimes I, Krssak M, Zemkova E,Gasperikova D, Ukropec J, Ukropcova B. 2014. Effects of obesity, diabetes and exercise onFNDC5 gene expression and irisin release in human skeletal muscle and adipose tissue: in vivoand in vitro studies. Journal of Physiology 592:1091–1107 DOI 10.1113/jphysiol.2013.264655.
Moore RL, Gollnick PD. 1982. Response of ventilatory muscles of the rat to endurance training.Pflugers Archiv 392:268–271 DOI 10.1007/BF00584308.
Moreno-Navarrete JM, Ortega F, Serrano M, Guerra E, Pardo G, Tinahones F, Ricart W,Fernandez-Real JM. 2013. Irisin is expressed and produced by human muscle and adiposetissue in association with obesity and insulin resistance. Journal of Clinical Endocrinology andMetabolism 98:E769–E778 DOI 10.1210/jc.2012-2749.
Ng M, Fleming T, Robinson M, Thomson B, Graetz N, Margono C, Mullany EC, Biryukov S,Abbafati C, Abera SF, Abraham JP, Abu-Rmeileh NM, Achoki T, AlBuhairan FS, Alemu ZA,Alfonso R, Ali MK, Ali R, Guzman NA, Ammar W, Anwari P, Banerjee A, Barquera S, Basu S,Bennett DA, Bhutta Z, Blore J, Cabral N, Nonato IC, Chang JC, Chowdhury R, Courville KJ,Criqui MH, Cundiff DK, Dabhadkar KC, Dandona L, Davis A, Dayama A, Dharmaratne SD,Ding EL, Durrani AM, Esteghamati A, Farzadfar F, Fay DF, Feigin VL, Flaxman A,Forouzanfar MH, Goto A, Green MA, Gupta R, Hafezi-Nejad N, Hankey GJ, Harewood HC,Havmoeller R, Hay S, Hernandez L, Husseini A, Idrisov BT, Ikeda N, Islami F, Jahangir E,Jassal SK, Jee SH, Jeffreys M, Jonas JB, Kabagambe EK, Khalifa SE, Kengne AP, Khader YS,Khang YH, Kim D, Kimokoti RW, Kinge JM, Kokubo Y, Kosen S, Kwan G, Lai T, Leinsalu M,Li Y, Liang X, Liu S, Logroscino G, Lotufo PA, Lu Y, Ma J, Mainoo NK, Mensah GA,Merriman TR, Mokdad AH, Moschandreas J, Naghavi M, Naheed A, Nand D, Narayan KM,Nelson EL, Neuhouser ML, Nisar MI, Ohkubo T, Oti SO, Pedroza A, Prabhakaran D,Roy N, Sampson U, Seo H, Sepanlou SG, Shibuya K, Shiri R, Shiue I, Singh GM, Singh JA,Skirbekk V, Stapelberg NJ, Sturua L, Sykes BL, Tobias M, Tran BX, Trasande L, Toyoshima H,Van de Vijver S, Vasankari TJ, Veerman JL, Velasquez-Melendez G, Vlassov VV, Vollset SE,Vos T, Wang C, Wang SX, Weiderpass E, Werdecker A, Wright JL, Yang YC, Yatsuya H, Yoon J,Yoon SJ, Zhao Y, Zhou M, Zhu S, Lopez AD, Murray CJ, Gakidou E. 2014. Global, regional,and national prevalence of overweight and obesity in children and adults during 1980–2013:a systematic analysis for the global burden of disease study 2013. Lancet 384(9945):766–781DOI 10.1016/S0140-6736(14)60460-8.
Norheim F, Raastad T, Thiede B, Rustan AC, Drevon CA, Haugen F. 2011. Proteomicidentification of secreted proteins from human skeletal muscle cells and expression inresponse to strength training. American Journal of Physiology, Endocrinology and Metabolism301:E1013–E1021 DOI 10.1152/ajpendo.00326.2011.
Peterson et al. (2014), PeerJ, DOI 10.7717/peerj.605 14/16

Northoff H, Berg A. 1991. Immunologic mediators as parameters of the reactionto strenuous exercise. International Journal of Sports Medicine 12(Suppl 1):S9–15DOI 10.1055/s-2007-1024743.
Ogawa Y, Masuzaki H, Isse N, Okazaki T, Mori K, Shigemoto M, Satoh N, Tamura N, Hosoda K,Yoshimasa Y. 1995. Molecular cloning of rat obese cDNA and augmented gene expressionin genetically obese zucker fatty (fa/fa) rats. Journal of Clinical Investigation 96:1647–1652DOI 10.1172/JCI118204.
Ostrowski K, Rohde T, Asp S, Schjerling P, Pedersen BK. 2001. Chemokines are elevated inplasma after strenuous exercise in humans. European Journal of Applied Physiology andOccupational Physiology 84:244–245 DOI 10.1007/s004210170012.
Peterson JM, Bryner RW, Frisbee JC, Alway SE. 2008a. Effects of exercise and obesity on UCP3content in rat hindlimb muscles. Medicine and Science in Sports and Exercise 40:1616–1622DOI 10.1249/MSS.0b013e31817702a4.
Peterson JM, Bryner RW, Sindler A, Frisbee JC, Alway SE. 2008b. Mitochondrial apoptoticsignaling is elevated in cardiac but not skeletal muscle in the obese zucker ratand is reduced with aerobic exercise. Journal of Applied Physiology 105:1934–1943DOI 10.1152/japplphysiol.00037.2008.
Polyzos SA, Kountouras J, Shields K, Mantzoros CS. 2013. Irisin: a renais-sance in metabolism? Metabolism: Clinical and Experimental 62:1037–1044DOI 10.1016/j.metabol.2013.04.008.
Sandler S, Bendtzen K, Eizirik DL, Welsh M. 1990. Interleukin-6 affects insulin secretionand glucose metabolism of rat pancreatic islets in vitro. Endocrinology 126:1288–1294DOI 10.1210/endo-126-2-1288.
Scholz GH, Englaro P, Thiele I, Scholz M, Klusmann T, Kellner K, Rascher W, Blum WF.1996. Dissociation of serum leptin concentration and body fat content during long termdietary intervention in obese individuals. Hormone and Metabolic Research 28:718–723DOI 10.1055/s-2007-979886.
Seldin MM, Peterson JM, Byerly MS, Wei Z, Wong GW. 2012. Myonectin (CTRP15), a novelmyokine that links skeletal muscle to systemic lipid homeostasis. Journal of Biological Chemistry287:11968–11980 DOI 10.1074/jbc.M111.336834.
Seo DY, Kwak HB, Lee SR, Cho YS, Song IS, Kim N, Bang HS, Rhee BD, Ko KS, Park BJ, Han J.2014. Effects of aged garlic extract and endurance exercise on skeletal muscle FNDC-5and circulating irisin in high-fat-diet rat models. Nutrition Research and Practice 8:177–182DOI 10.4162/nrp.2014.8.2.177.
Stengel A, Hofmann T, Goebel-Stengel M, Elbelt U, Kobelt P, Klapp BF. 2013. Circulating levelsof irisin in patients with anorexia nervosa and different stages of obesity–correlation with bodymass index. Peptides 39:125–130 DOI 10.1016/j.peptides.2012.11.014.
Stern J, Johnson PR, Greenwood MR, Zucker LM, Hirsch J. 1972. Insulin resistance andpancreatic insulin release in the genetically obese zucker rat. Proceedings of the Society forExperimental Biology and Medicine 139:66–69 DOI 10.3181/00379727-139-36078.
Stouthard JM, Oude Elferink RP, Sauerwein HP. 1996. Interleukin-6 enhances glucose transportin 3T3-L1 adipocytes. Biochemical and Biophysical Research Communications 220:241–245DOI 10.1006/bbrc.1996.0389.
Stouthard JM, Romijn JA, Van der Poll T, Endert E, Klein S, Bakker PJ, Veenhof CH,Sauerwein HP. 1995. Endocrinologic and metabolic effects of interleukin-6 in humans.American Journal of Physiology 268:E813–E819.
Peterson et al. (2014), PeerJ, DOI 10.7717/peerj.605 15/16
Takaya K, Ogawa Y, Isse N, Okazaki T, Satoh N, Masuzaki H, Mori K, Tamura N, Hosoda K,Nakao K. 1996. Molecular cloning of rat leptin receptor isoform complementaryDNAs–identification of a missense mutation in zucker fatty (fa/fa) rats. Biochemical andBiophysical Research Communications 225:75–83 DOI 10.1006/bbrc.1996.1133.
Timmons JA, Baar K, Davidsen PK, Atherton PJ. 2012. Is irisin a human exercise gene? Nature488:E9–E10 DOI 10.1038/nature11364.
Timmons JA, Larsson O, Jansson E, Fischer H, Gustafsson T, Greenhaff PL, Ridden J,Rachman J, Peyrard-Janvid M, Wahlestedt C, Sundberg CJ. 2005. Human muscle geneexpression responses to endurance training provide a novel perspective on duchenne musculardystrophy. FASEB Journal 19:750–760 DOI 10.1096/fj.04-1980com.
Vaughan RA, Gannon NP, Barberena MA, Garcia-Smith R, Bisoffi M, Mermier CM, Conn CA,Trujillo KA. 2014. Characterization of the metabolic effects of irisin on skeletal muscle in vitro.Diabetes, Obesity & Metabolism 16(8):711–718 DOI 10.1111/dom.12268.
Peterson et al. (2014), PeerJ, DOI 10.7717/peerj.605 16/16


