
No. 15 | 2012
Effects of changing banks' risk weights Henrik Andersen, Rønnaug Johansen and Knut Kolvig, Financial Stability
Staff Memo

Staff Memos present reports and documentation written by staff members and affiliates of Norges Bank, the central bank of Norway. Views and conclusions expressed in Staff Memos should not be taken to represent the views of Norges Bank. © 2012 Norges Bank The text may be quoted or referred to, provided that due acknowledgement is given to source. Staff Memo inneholder utredninger og dokumentasjon skrevet av Norges Banks ansatte og andre forfattere tilknyttet Norges Bank. Synspunkter og konklusjoner i arbeidene er ikke nødvendigvis representative for Norges Banks. © 2012 Norges Bank Det kan siteres fra eller henvises til dette arbeid, gitt at forfatter og Norges Bank oppgis som kilde. ISSN 1504-2596 (online only) ISBN 978-82-7553-674-5 (online only)
1
Effects of changing banks’ risk weights
Henrik Andersen, Rønnaug Johansen and Knut Kolvig1
1. Introduction
In recent years, public authorities and academics have paid increased attention to inconsistencies
between the risk weights different banks employ when calculating capital adequacy. Moreover, the use
of variable risk weights have been mentioned as a potential macro prudential tool to curb emerging risks
in particular exposure classes, see for example Andersson et al. (2011) and Bank of England (2011). A
build-up of systemic risk that is related to only parts of the economy can be mitigated to a certain extent
by increasing the level of capital banks are required to hold against exposures to or investments in these
markets. The authorities may increase capital requirements for a particular exposure class in several
ways. Banks may be instructed to increase the risk weights by a fixed add-on or a multiplier. A minimum
limit may be set for the risk weights estimated by banks applying the Internal Ratings-Based (IRB)2
approach. The authorities may also lay down stricter guidelines for how the IRB models or risk
parameters used by IRB-banks to assign risk weights are estimated.
One of the aims of increasing risk weights will be to curb credit growth in those market segments where
there is a build-up of systemic risk. This may reduce future bank losses. Similarly, higher risk weights on
banks’ securitisation exposures may dampen systemic risk that arises when risk is priced too low.3
Reducing risk weights in bad times may at the same time contribute to holding up credit growth and
investment, which may prevent deleveraging and investment drought when systemic risk materialises.
1 Thanks to Sigbjørn Atle Berg, Thea B. Kloster, Jermund Molland, Ingvild Svendsen and Birger Vikøren for useful comments and suggestions. 2 Under the current capital adequacy framework (Basel II), the largest banks in Norway calculate their capital ratios using internal risk models based on data about their own borrowers (Internal Ratings-Based (IRB) approach), while smaller banks use the simpler, more standardised approach (the Standardised Approach). The proposed capital adequacy framework (Basel III) will be based on the same framework for calculating risk as Basel II, but capital requirements will be more stringent. 3 Systemic risk may build up if several large banks invest in a securities market where risk is priced too low. Systemic risk may also build up if banks rely too heavily on obtaining funding in the interbank market and thereby become too closely interwoven.
2
Another aim of higher risk weights will be to increase banks’ resilience to future losses. To the extent
banks set aside more capital for every krone lent or invested as a result, higher risk weights will improve
banks’ capacity to bear losses directly. This will ensure a more stable supply of loans over time by
maintaining banks’ lending capacity in bad times.
This paper is organized as follows. Section 2 details the conditions for changes in risk weights to have
effect. Section 3 assesses the potential effects on the credit volume of changing the risk weights in
Norway. In section 4 possible undesired effects are discussed. Section 5 presents historical experience of
changing risk weights. Section 6 outlines the limitations for changing risk weights under the capital
adequacy framework, and section 7 provides conclusions.
2. Conditions for changes in risk weights to have effect
For changes in risk weights to affect bank behaviour, either the relative return on equity from banks’
assets must be affected or the changes must result in a capital adequacy that is lower than internal4 or
external requirements5.
2.1. Effects on banks’ relative return on equity in the short-term
Higher risk weights in one asset class may reduce the expected return on equity behind these assets
relative to equity behind the bank’s other assets. The return on equity falls when banks have to hold
more equity against a specific asset class, but also if the authorities’ decision to increase risk weights
leads to a more conservative subjective assessment of risk and expected return for this asset class.
Profit-maximizing banks will normally reduce their investments in an asset class if the expected return
on equity becomes lower. If investments in other markets become relatively more profitable, banks may
increase their investment in these markets. Changes in risk weights may thus alter a bank’s optimal
asset allocation. Adaption to a new optimal asset allocation will probably be a gradual process covering
several years.
In order to assess how changes in risk weights affect a bank’s optimal asset mix, it is necessary to
estimate banks’ return on equity for the various asset classes. It is difficult to do this based on publicly 4 Internal capital requirements can be calculated based on banks’ internal risk models, but can also be based on capital requirements from rating agencies, investors and other market participants. 5 Disregarding the transitional rules, under which total capital requirements as calculated according to Basel II cannot be lower than 80 percent of capital requirements according to Basel I.
3
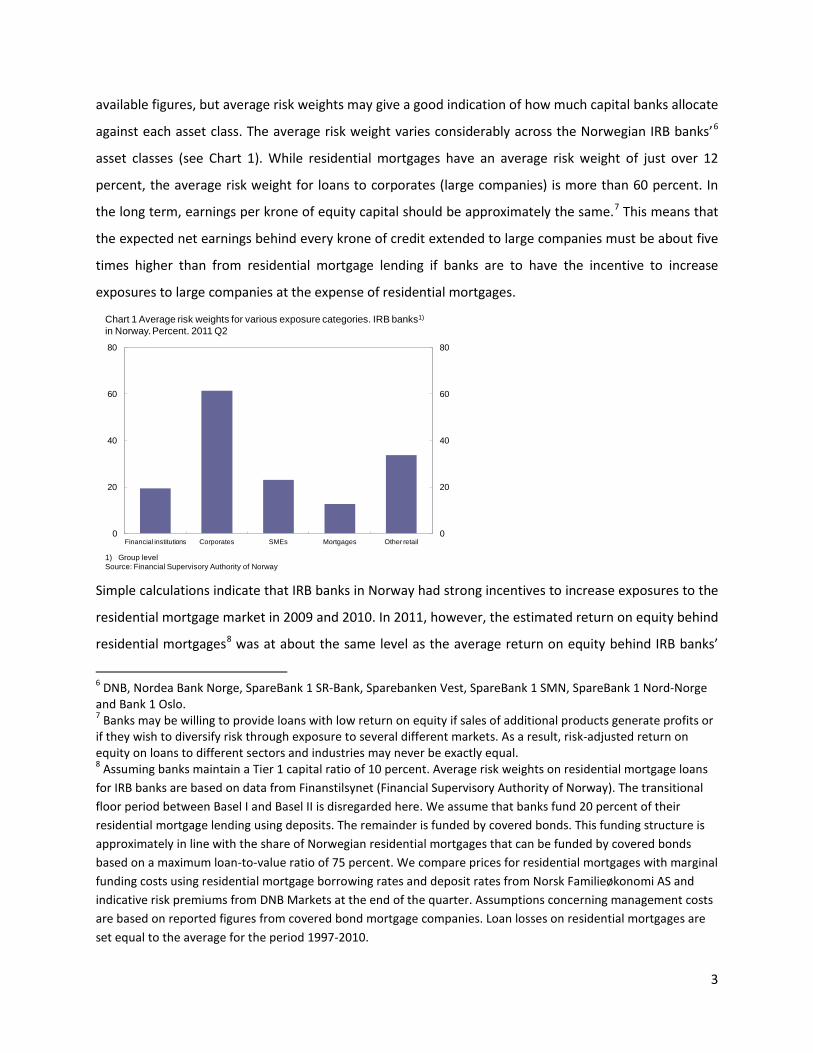
available figures, but average risk weights may give a good indication of how much capital banks allocate
against each asset class. The average risk weight varies considerably across the Norwegian IRB banks’6
asset classes (see Chart 1). While residential mortgages have an average risk weight of just over 12
percent, the average risk weight for loans to corporates (large companies) is more than 60 percent. In
the long term, earnings per krone of equity capital should be approximately the same.7 This means that
the expected net earnings behind every krone of credit extended to large companies must be about five
times higher than from residential mortgage lending if banks are to have the incentive to increase
exposures to large companies at the expense of residential mortgages.
Simple calculations indicate that IRB banks in Norway had strong incentives to increase exposures to the
residential mortgage market in 2009 and 2010. In 2011, however, the estimated return on equity behind
residential mortgages8 was at about the same level as the average return on equity behind IRB banks’
6 DNB, Nordea Bank Norge, SpareBank 1 SR-Bank, Sparebanken Vest, SpareBank 1 SMN, SpareBank 1 Nord-Norge and Bank 1 Oslo. 7 Banks may be willing to provide loans with low return on equity if sales of additional products generate profits or if they wish to diversify risk through exposure to several different markets. As a result, risk-adjusted return on equity on loans to different sectors and industries may never be exactly equal. 8 Assuming banks maintain a Tier 1 capital ratio of 10 percent. Average risk weights on residential mortgage loans for IRB banks are based on data from Finanstilsynet (Financial Supervisory Authority of Norway). The transitional floor period between Basel I and Basel II is disregarded here. We assume that banks fund 20 percent of their residential mortgage lending using deposits. The remainder is funded by covered bonds. This funding structure is approximately in line with the share of Norwegian residential mortgages that can be funded by covered bonds based on a maximum loan-to-value ratio of 75 percent. We compare prices for residential mortgages with marginal funding costs using residential mortgage borrowing rates and deposit rates from Norsk Familieøkonomi AS and indicative risk premiums from DNB Markets at the end of the quarter. Assumptions concerning management costs are based on reported figures from covered bond mortgage companies. Loan losses on residential mortgages are set equal to the average for the period 1997-2010.
0
20
40
60
80
0
20
40
60
80
Financial institutions Corporates SMEs Mortgages Other retail
Chart 1 Average risk weights for various exposure categories. IRB banks1)
in Norway.Percent. 2011 Q2
1) Group levelSource: Financial Supervisory Authority of Norway
4
other assets (see Table 1). The fall in the estimated return on equity behind mortgages is due to the
sharp increase in risk premiums on covered bonds since 2009.
Table 1 Estimated post-tax return on equity for IRB banks’ residential mortgage loans and total assets
Our calculations indicate that a doubling of risk weights on residential mortgages would have reduced
the return on equity on new residential mortgages to below 8 percent at the end of the second quarter
of 2011 if IRB banks had not changed the mortgage rate. The return on equity on residential mortgages
would then have been considerably lower than the average return on equity on the IRB banks’ assets. A
doubling of risk weights on residential mortgages in 2011 could thereby have created incentives for the
IRB banks to reduce their exposure to the housing market. At the same time, return on equity for a
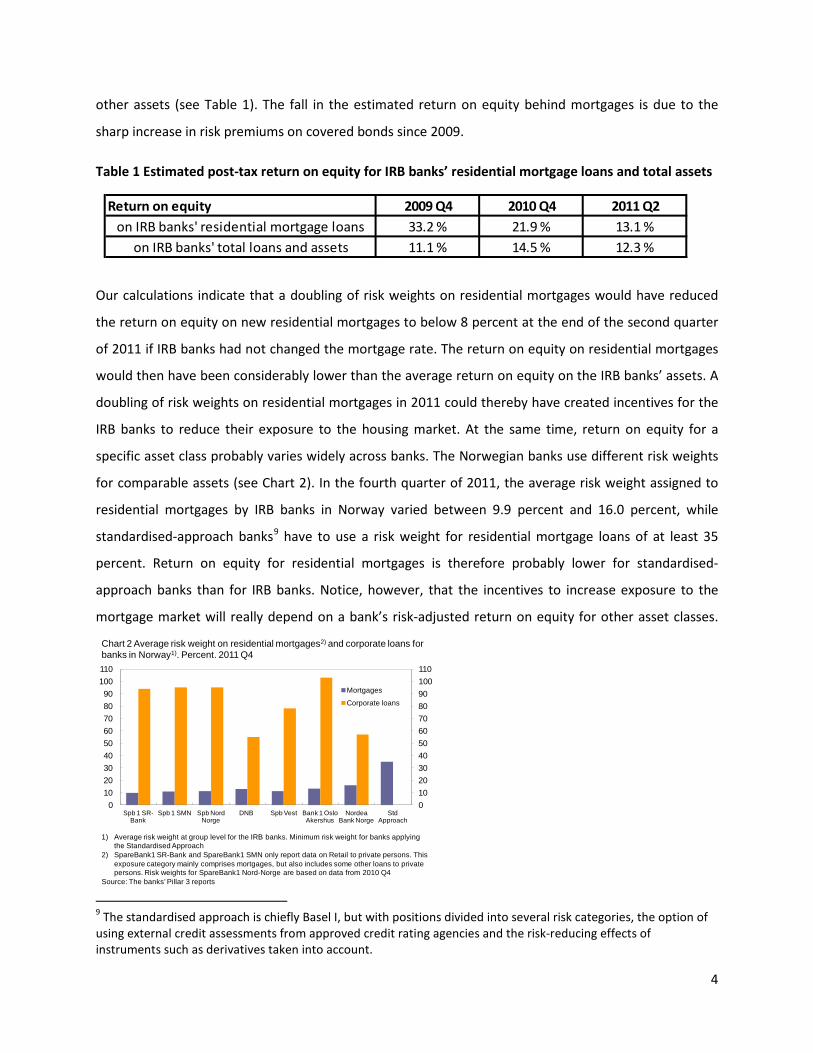
specific asset class probably varies widely across banks. The Norwegian banks use different risk weights
for comparable assets (see Chart 2). In the fourth quarter of 2011, the average risk weight assigned to
residential mortgages by IRB banks in Norway varied between 9.9 percent and 16.0 percent, while
standardised-approach banks9 have to use a risk weight for residential mortgage loans of at least 35
percent. Return on equity for residential mortgages is therefore probably lower for standardised-
approach banks than for IRB banks. Notice, however, that the incentives to increase exposure to the
mortgage market will really depend on a bank’s risk-adjusted return on equity for other asset classes.
9 The standardised approach is chiefly Basel I, but with positions divided into several risk categories, the option of using external credit assessments from approved credit rating agencies and the risk-reducing effects of instruments such as derivatives taken into account.
Return on equity 2009 Q4 2010 Q4 2011 Q2on IRB banks' residential mortgage loans 33.2 % 21.9 % 13.1 %
on IRB banks' total loans and assets 11.1 % 14.5 % 12.3 %
0102030405060708090100110
0102030405060708090
100110
Spb 1 SR-Bank
Spb 1 SMN Spb Nord Norge
DNB Spb Vest Bank 1 Oslo Akershus
Nordea Bank Norge
Std Approach
Mortgages
Corporate loans
Chart 2 Average risk weight on residential mortgages2) and corporate loans for banks in Norway1). Percent. 2011 Q4
1) Average risk weight at group level for the IRB banks. Minimum risk weight for banks applyingthe Standardised Approach
2) SpareBank1 SR-Bank and SpareBank1 SMN only report data on Retail to private persons. This exposure category mainly comprises mortgages, but also includes some other loans to private persons. Risk weights for SpareBank1 Nord-Norge are based on data from 2010 Q4
Source: The banks’ Pillar 3 reports

5
2.2. Effects on banks’ relative return on equity in the long term
Banks may have limited opportunities to pass higher costs on to borrowers in the short-term.
Contractual conditions and strong competition may make it difficult for banks to change their lending
rates quickly (see Section 3.1). In the long term, banks are assumed to adjust their lending rates so that
risk-adjusted return on equity for new loans to different sectors and industries is approximately the
same. If return on equity for loans to one market is higher than for loans to other markets, profit-
maximising banks will normally wish to increase their exposure to that market. This will increase
competition in this market and depress margins, bringing the risk-adjusted return on equity down to the
same level as on other loans. Similarly, competition to provide loans to a market will decline if the return
on equity for these loans is lower than for other loans. Moreover, the authorities’ decision to increase
risk weights may produce a more conservative subjective assessment of risk and expected return which,
in turn, can reduce competition in a market. With lower competition, it will be easier for banks to
increase margins and thus raise return on equity to the same level as for other loans. However, banks
may be willing to provide loans with low return on equity if sales of additional products generate profits
or if they wish to diversify risk through exposure to several different markets. As a result, risk-adjusted
return on equity on loans to different sectors and industries may never be exactly equal.
2.3. Effects on banks’ capital adequacy in the short term
In the short term, an increase in risk weights will reduce banks’ measured capital adequacy. Higher risk
weights will raise a bank’s regulatory minimum capital requirement. In addition, the bank’s adjustment
to a new optimum may entail an increase in capital requirements. For example, an increase in risk
weights on residential mortgages may lead to an increase in loans to large companies, which have
higher risk weights, as a share of total bank lending if these loans become relatively more profitable. An
increase in the regulatory minimum capital requirement will cet. par. reduce banks’ capital buffer over
the minimum.
Banks’ capital adequacy ratios relative to internal and regulatory requirements and banks’ access to new
capital will determine how persistent the decline in capital adequacy will be (see Table 2). Risk weights
would normally be raised in periods when there is easy access to capital, profits are high and banks are
expanding. Consequently, if the increase in risk weights reduces the capital adequacy ratio below
internal or regulatory requirements, banks can relatively quickly obtain more capital. Banks with capital
adequacy ratios considerably above internal and regulatory requirements will probably allow capital
adequacy to decline, but this will not affect banks’ adjustment to a new optimal asset allocation. Banks

6
with capital adequacy ratios close to internal or regulatory requirements will probably seek to increase
these ratios as quickly as possible. As long as there is easy access to new capital, banks will be able to
increase capital adequacy ratios relatively quickly to the desired level.
Table 2 Effect on banks’ capital adequacy under different conditions involving access to capital and level of banks’ capital adequacy relative to internal and regulatory requirements
Even though risk weights will normally be raised in periods when most banks are well capitalised and
there is easy access to capital, some banks may have weak capital adequacy and inadequate access to
new capital. They may be forced to shrink risk-weighted balance sheets to comply with internal or
regulatory requirements. In such a situation, an increase in risk weights for residential mortgages may
lead to a substantial tightening for other loans with higher risk weights, even if expected return on
equity were higher on these loans. Banks can also increase capital adequacy ratios by selling loans or
other assets. Reducing the stock of assets with high risk weights will have the greatest effect. Shrinking
risk-weighted balance sheets can, however, be time-consuming, especially if the share of interest-only
loans is high, i.e. the rate of debt repayments is low, or if several banks seek to sell assets at the same
time.
Some banks in Norway probably have limited capacity to adjust capital quickly in the event of a
substantial increase in the risk weights. As capital issues dilute existing shareholders not participating in
the offering banks may prefer to increase their capital adequacy ratios by retaining earnings. This may
be a gradual process. Estimates indicate that an increase in the risk weight for residential mortgages by
10 percentage points may reduce capital adequacy ratios of IRB banks in Norway by between 0.6 and 2
Ample access to capital Poor access to capitalInternal or regulatory capital requirements are not binding
Banks allow capital adequacy ratio to fall
Banks allow capital adequacy ratio to fall
Internal or regulatory capital requirements become binding when risk weights are raised
Banks dampen the fall in capital adequacy ratio by raising capital or retaining earnings
Banks dampen the fall in capital adequacy ratio gradually by reducing risk-weighted assets
Internal or regulatory capital requirements are initially binding
Banks restore capital adequacy ratio to its original level by raising capital or retaining earnings
Banks increase capital adequacy ratio gradually by reducing risk-weighted assets
7
percentage points. But even if the risk weight for residential mortgage loans increased to the minimum
level for banks applying the Standardised Approach, i.e. 35 percent, all IRB banks would have been in
compliance with the proposed 6 percent minimum Tier 1 capital requirement and capital conservation
buffer requirement of 2.5 percent in Basel III at end-2010. It would have been more difficult, however,
to comply with Finanstilsynet’s10 objective of a 9 percent Core Tier 1 capital ratio.11 An increase in risk
weights for residential mortgages in 2011 could have forced the IRB banks to reduce their stocks of risk-
weighted assets or to raise more capital in the transition period. On average Norwegian banks raised
their Core Tier 1 capital ratios from 10.7 to 11.0 percent in 2011, and all Norwegian banks are expected
to meet the requirement of a 9 percent Core Tier 1 capital ratio by end-2012 Q2.
2.4. Effects on banks’ capital adequacy in the long term
In the long term, banks will adjust to maximise risk-adjusted equity return while complying with internal
and regulatory requirements. Viable banks will over time have ready access to capital, particularly in
periods when an increase in risk weights is necessary to prevent systemic risk. Banks can then increase
capital adequacy ratios by issuing equity or retaining earnings to comply with internal and external
requirements by the desired margin. In the long term, higher risk weights will thus not necessarily affect
banks’ measured capital adequacy, although higher risk weights may push up equity ratios.
3. Effects on credit volume
One of the objectives of higher risk weights will be to reduce banks’ supply of credit to markets where
systemic risk is high or mounting. Banks can reduce lending growth by ceasing to offer loan products.
Banks can also reduce lending growth by raising lending rates or by tightening credit standards to
reduce the number of borrowers that qualify for loans. The effects on credit volume will be most
pronounced if banks stop offering loans, but this is not a likely scenario. Banks plan for the long term
and normally seek to position themselves to maintain their market shares. It is therefore assumed that
any credit tightening will take the form of higher lending rates, i.e. we assume that the degree of credit
rationing is not affected by changes in risk weights.12
10 Financial Supervisory Authority of Norway 11 See press release from Finanstilsynet: http://www.finanstilsynet.no/en/Document-repository/Press-releases/2011/Q4/Finanstilsynet-supports-the-EBAs-plan-for-recapitalisation-of-European-banks/ 12 According to the theory of credit rationing banks limit their supply of loans to less than the amount demanded at the lending rate quoted by the banks, see for example Jaffee and Modigliani (1969) and Jaffee and Russell (1976). Modern credit rationing theory assumes that lenders cannot distinguish ex ante between high- and low-quality borrowers and that high-quality borrowers prefer a contract that entails a lower interest rate. Moreover, Stiglitz
8
Effects on credit will also depend on how the authorities increase risk weights or the underlying risk
parameters. While a fixed add-on will increase the capital requirement per krone in lending equally for
all banks, a minimum limit on risk weights or risk parameters will affect banks differently (see Chart 2). It
may be appropriate to increase risk weights by an add-on if overall credit growth in a market is too high
or if banks in general are contributing to an increase in systemic risk. A minimum limit will be a more
appropriate choice if systemic risk is primarily generated by the banks with the lowest risk weights, i.e.
the risk weights do not reflect actual risk correctly. A minimum limit will have a greater impact on banks
with the lowest risk weights than on banks with high risk weights and may thereby change the
competitive situation in the market by strengthening the position of banks with the highest risk weights.
The opposite will be the case if risk weights are increased using a multiplier. Banks with the highest risk
weights will then be hardest hit. For example, a multiplier of 1.1 will raise risk weights for banks applying
a risk weight of 10 percent by 1 percentage point, while risk weights for banks applying a risk weight of
20 percent will increase by 2 percentage points. Because of these characteristics, the use of multipliers
is of limited interest as long as banks use different risk weights on comparable assets. However, if risk
weights reflect actual risk correctly and high-risk lending is the main generator of systemic risk,
multipliers will have a far stronger impact on the banks that primarily generate systemic risk than on
other banks. In such a situation, it may thus be appropriate for the authorities to increase risk weights or
the underlying risk parameters using a multiplier to curb the build-up of systemic risk.
The effect on credit volume will also depend on the market shares of those banks that will be hardest hit
by a change in risk weights. If relative returns on equity or capital adequacy ratios are affected most in
the largest banks, the effect on credit volume will be greater than if the smallest banks were hardest hit.
In Norway, IRB banks, which have the lowest risk weights, will be the first hit by a minimum limit on risk
weights. At the end of the second quarter of 2011, IRB banks’ market share in the mortgage market was
59 percent, while the corresponding share in the corporate lending market was 61 percent. Higher risk
weights cannot be imposed on branches of foreign banks under current rules. At the end of the second
quarter of 2011, branches of foreign banks had a market share of around 14 percent in the Norwegian
mortgage market and 18 percent in the corporate lending market.
and Weiss (1981) assumed that lender's expected return is not monotonically increasing in the interest rate. Adverse selection or moral hazard problems eventually cause the lender's expected return to decline as the interest rate rises. As a result, the pooling outcome entails credit rationing.
9
3.1. Effects on credit volume in the short term
In the short term, frictions in the banking sector will curb the effect on credit volume of changes in risk
weights. Reducing the existing stock of loans can be time-consuming, especially if the share of interest-
only loans is high or if several banks seek to sell loans at the same time. Contractual conditions may also
make it difficult for banks to increase lending rates, except on new loans. Furthermore, other factors
such as competition or access to funding may be more critical for the banks’ supply of credit than
regulatory capital requirements. A number of banks may pursue a long term strategy of gaining market
shares or diversifying risk through exposure to several different markets. Higher risk weights may reduce
return on equity somewhat, but not necessarily enough to induce banks to change their strategy.
The competitive situation in the different markets has a considerable influence on the extent to which
higher costs are passed on to customers. Residential mortgage loans are relatively homogeneous
products, and banks’ profits on sales of additional products to residential mortgage borrowers are high.
This generates considerable competition for these borrowers and makes it difficult for individual banks
to pass costs on to these customers. In the short term, a minimum limit that only affects the banks with
the lowest risk weights may therefore reduce return on equity on residential mortgage loans in these
banks without a rise in mortgage rates. A substantial fall in return on equity may, however, induce these
banks to deliberately price themselves out of the mortgage market or stop offering residential mortgage
loans. But if the banks that are affected by the minimum limit are price-leaders in the residential
mortgage market, introducing a minimum limit may result in a general rise in mortgage rates in the
short term.13 Mortgage rates will likely also be increased if an add-on is introduced that increases risk
weights for all banks. This may then have a dampening effect on growth in residential mortgage lending.
Products in the corporate market are more heterogeneous. This generates more imperfect competition
in corporate lending markets, and banks can more easily raise lending rates. The effect of higher risk
weights on lending rates may therefore be more pronounced on corporate loans. But since large
companies can also obtain funding in bond and money markets, it may be difficult for banks to raise
interest rates sharply without losing these customers. Although higher risk weights will then improve
13 Stackelberg price leadership assumes that one firm has knowledge or foresight of its competitor's reaction to its price policies, see Stackelberg (1934). As a result, the firm may maximize profit by credibly announce a price in anticipation of the competitor’s reaction. A higher rate from the price leader will lead to higher rates of its competitors.
10
banks’ resilience and reduce their exposure to high-risk markets, parts of the systemic risk may persist if
these companies simply replace banks loans with market loans. This presupposes, however, that the
authorities’ decision to increase risk weights does not result in a more conservative assessment in the
markets. Moreover, the exposure to markets where there is a build-up of systemic will probably be
spread on more counterparties if companies replace banks loans with market loans, even though the
banking sector is a large holder of corporate bonds.
Contractual conditions will have considerable influence on the extent to which costs are passed on to
customers. Higher risk weights would primarily increase lending margins on new loans and loans that
can be repriced. While variable rate loans can normally be repriced at short notice, other loans can only
be repriced gradually due to contractual conditions. The great majority of banks’ loans to households
are variable rate loans. At the same time, the lending rate on a large share of corporate loans has a fixed
contractual premium above the money market rate. However, banks can include terms in the loan
contract that enable them to raise lending rates immediately if risk weights are increased by the
authorities. In addition, banks can anticipate changes in risk weights and adjust the pricing of loans in
advance. This may reduce credit growth that generates systemic risk and the need for large increases in
risk weights.
Effects on credit volume will also depend on when risk weights are increased. Increasing risk weights
early in the business cycle will send a stronger signal and probably influence participants’ behaviour to a
greater extent than if risk weights are increased late in the cycle. The impact will depend in particular on
how far credit and price spirals have progressed. If there are already expectations of a high rise in prices
for property or other assets, price elasticity of demand for short-term credit may decline. The short-
term effect on credit of an increase in risk weights will then probably be smaller.
3.2. Effects on credit volume in the long term
In the long term, it is assumed that banks have a sound level of capital adequacy and access to capital.
Cost increases are assumed to be passed on to borrowers in their entirety, ie that banks adjust lending
rates to achieve the long-term equilibrium with equal risk-adjusted equity return on all their assets.
Simple calculations show then that the effect on residential mortgage rates of higher risk weights on
residential mortgage loans is largely dependent on banks’ equity return on residential mortgage loans
(see Chart 3). If risk weights on residential mortgage loans are doubled and banks’ required equity

11
return on residential mortgage loans is 30 percent, banks will have to raise residential mortgage rates by
almost half a percentage point in order to maintain returns on equity. But if the required equity return
on residential mortgage loans is 10 percent, banks only need to increase residential mortgage rates by
0.13 percentage point to maintain returns on equity.
The increase in mortgage rates will be even smaller if banks do not pass on all costs to residential
mortgage borrowers. The higher the initial equity returns on residential mortgage loans, the less need
there will be to pass on higher funding costs to borrowers. At the same time, the largest banks with the
lowest equity return on residential mortgage loans may be price-leaders in the mortgage market. The
increase in mortgage rates may then be smaller.
For illustration we assume that a doubling in risk weights from the current level will result in a maximum
rise in mortgage rates of half a percentage point. Simple calculations assuming stable credit standards
indicate that household debt could have been about 3 percent lower and house prices about 4 percent
lower in 2008 if mortgage rates had been half a percentage point higher as from 2003.14 The impact on
house prices and credit may be stronger if the authorities’ decision to increase risk weights leads to a
more conservative assessment of risk and expected return.
The effects on credit volume will also depend on whether risk weights are increased permanently or
only temporarily. A temporary increase will probably have less impact on banks’ behaviour than an
increase that is perceived as more permanent. Banks are forward-looking in their behaviour and may in
14 See Norges Bank (2010).
0.0
0.2
0.4
0.6
0.8
1.0
1.2
0.0
0.2
0.4
0.6
0.8
1.0
1.2
0 10 20 30 40 50 60 70
Chart 3 Increase in the average mortgage rate required to maintain the returnon equity on residential mortgages when the risk weight is doubled.1) Percent
1) The calculation is based on the same assumptions as in footnote 9
Return on equity for residential mortgages
12
periods be willing to operate with low profitability in a market if their presence in this market is
expected to be more profitable in the longer term.
Other factors than regulatory capital requirements, such as competition and strategy, may also be more
of a constraint on the supply of credit by banks in the long term. The effect on credit volume from
higher capital requirements may then be smaller. Higher risk weights will, however, reduce equity
returns. This may reduce competition and push up lending rates in the long term, particularly if the
increase in risk weights is perceived as permanent. Higher risk weights will then result in somewhat
lower credit growth in the long term.15
4. Possible undesirable effects
If banks have weak capital adequacy and inadequate access to new capital, higher risk weights for a low-
weighted asset class may in the short term lead to relatively pronounced tightening on other loans with
higher risk weights. Banks may also be forced to sell loans or other assets. Large volumes of assets made
available for sale on the market at the same time can trigger a downward price spiral, and banks may
incur substantial losses as a result. If banks have time to adjust to higher risk weights over a transition
period, however, such undesirable effects can to a certain extent be avoided. Moreover, risk weights
would normally be raised in periods when there is easy access to capital, profits are high and banks are
expanding.
If risk weights for one asset class are increased sharply, investments in other markets may be relatively
more profitable, inducing banks to increase investment in or lending to these markets. At worst, this
may result in a gradual build-up of systemic risk in new market segments. It is therefore important that
the authorities assess banks’ profitability for different asset classes before any substantial change is
made to risk weights.
Banks’ incentives to improve risk management may also be impaired if internal risk models are
overridden. If risk weights are set by the authorities according to a fixed rule, there will be cases where
banks do not achieve lower capital requirements by reducing risk. With mechanically set risk weights,
banks may also rely on the authorities’ risk assessments to a greater extent. In addition, fixed risk
15 See Jacobsen et al. (2011) and BIS (2010).
13
0
10
20
30
40
50
60
70
0
10
20
30
40
50
60
70
1994 1996 1998 2000 2002 2004 2006 2008
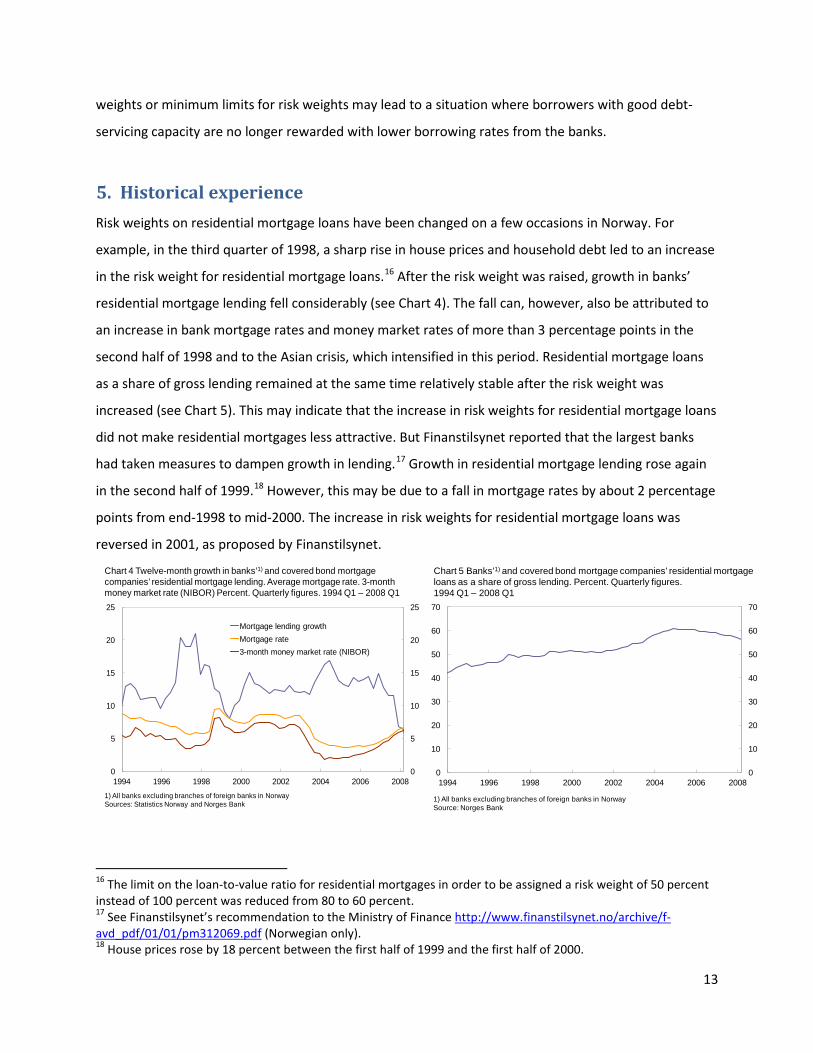
Chart 5 Banks’1) and covered bond mortgage companies’ residential mortgage loans as a share of gross lending. Percent. Quarterly figures. 1994 Q1 – 2008 Q1
1) All banks excluding branches of foreign banks in NorwaySource: Norges Bank
weights or minimum limits for risk weights may lead to a situation where borrowers with good debt-
servicing capacity are no longer rewarded with lower borrowing rates from the banks.
5. Historical experience
Risk weights on residential mortgage loans have been changed on a few occasions in Norway. For
example, in the third quarter of 1998, a sharp rise in house prices and household debt led to an increase
in the risk weight for residential mortgage loans.16 After the risk weight was raised, growth in banks’
residential mortgage lending fell considerably (see Chart 4). The fall can, however, also be attributed to
an increase in bank mortgage rates and money market rates of more than 3 percentage points in the
second half of 1998 and to the Asian crisis, which intensified in this period. Residential mortgage loans
as a share of gross lending remained at the same time relatively stable after the risk weight was
increased (see Chart 5). This may indicate that the increase in risk weights for residential mortgage loans
did not make residential mortgages less attractive. But Finanstilsynet reported that the largest banks
had taken measures to dampen growth in lending.17 Growth in residential mortgage lending rose again
in the second half of 1999.18 However, this may be due to a fall in mortgage rates by about 2 percentage
points from end-1998 to mid-2000. The increase in risk weights for residential mortgage loans was
reversed in 2001, as proposed by Finanstilsynet.
16 The limit on the loan-to-value ratio for residential mortgages in order to be assigned a risk weight of 50 percent instead of 100 percent was reduced from 80 to 60 percent. 17 See Finanstilsynet’s recommendation to the Ministry of Finance http://www.finanstilsynet.no/archive/f-avd_pdf/01/01/pm312069.pdf (Norwegian only). 18 House prices rose by 18 percent between the first half of 1999 and the first half of 2000.
0
5
10
15
20
25
0
5
10
15
20
25
1994 1996 1998 2000 2002 2004 2006 2008
Mortgage lending growthMortgage rate3-month money market rate (NIBOR)
Chart 4 Twelve-month growth in banks’1) and covered bond mortgage companies’ residential mortgage lending. Average mortgage rate. 3-month money market rate (NIBOR) Percent. Quarterly figures. 1994 Q1 – 2008 Q1
1) All banks excluding branches of foreign banks in NorwaySources: Statistics Norway and Norges Bank
14
The introduction of Basel II in 2007 represented a sharp reduction in risk weights on residential
mortgage loans, particularly for IRB banks.19 It is likely that banks adjusted to the reduction in residential
mortgage risk weights several years before Basel II was introduced. Norwegian banks had already taken
part in a Basel II quantitative impact study in 2003 that showed a sharp reduction in capital
requirements for residential mortgage loans.20 However, it is difficult to establish whether the
announced reduction in residential mortgage risk weights led to higher growth in residential mortgage
lending. Banks’ residential mortgage lending rose towards the end of 2003, and residential mortgage
loans as a share of gross lending increased in 2003 and 2004. Mortgage rates remained at the same time
relatively stable. This may indicate that the announced reduction in residential mortgage weights had
some impact before Basel II was introduced. Growth in residential mortgage lending fell in 2007.
However, the fall can be explained by an increase in mortgage lending rates of close to 2 percentage
points in the same period. Financial market turbulence also intensified in summer 2007.
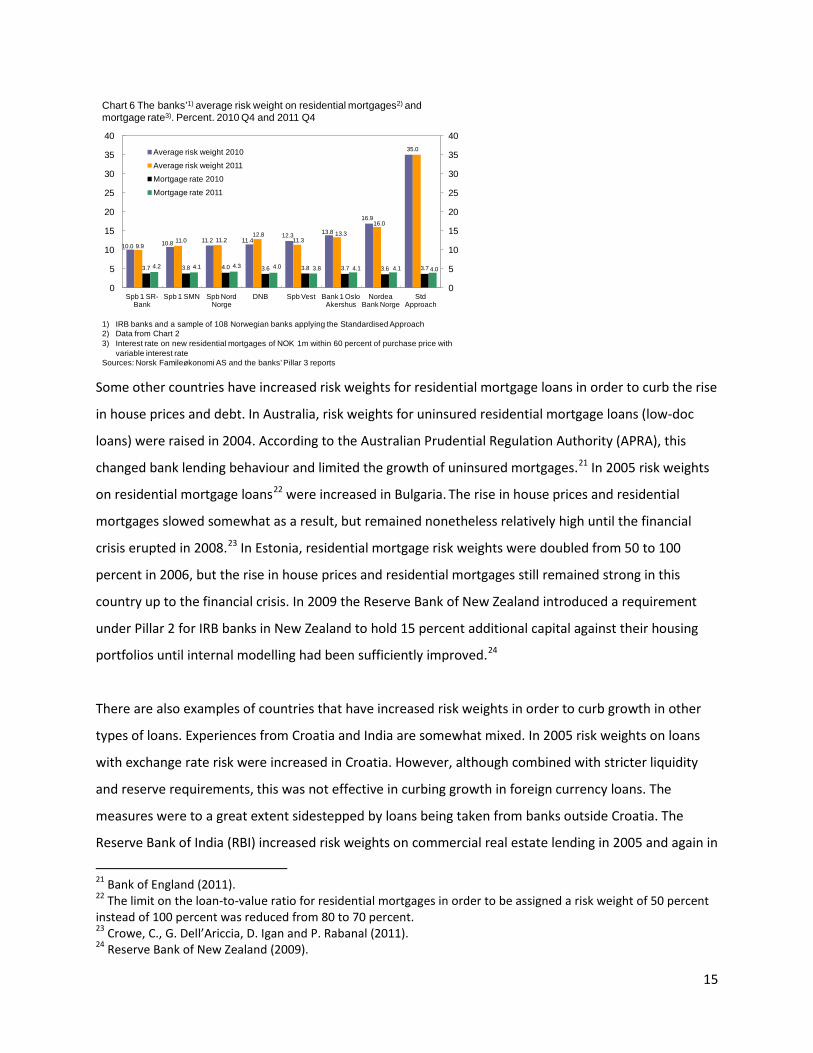
There is no clear relationship between the risk weights used for residential mortgage loans by banks in
Norway and the mortgage rates offered by these banks (see Chart 6). Several of the banks with the
highest risk weights on residential mortgage loans offer lower mortgage rates than the banks with the
lowest residential mortgage risk weights.
19 Under Basel I the risk weights for residential mortgages with loan-to-value (LTV) ratios below 80% and above 80% were 50% and 100%, respectively, for all banks. Under Basel II, residential mortgage risk weights for Norwegian IRB banks fell to around 10 percent. Banks using the standardised approach can apply a risk weight of 35 percent if the LTV is below 80 percent and a risk weight of 75 percent if the LTV is above 80 percent, subject to requirements with regard to retail exposures. If retail exposure requirements are not met, banks must use a risk weight of 100 percent. 20 In the period before Basel II was introduced, no adjustments were made to the Basel II framework that resulted in appreciably stricter requirements for residential mortgages.
15
Some other countries have increased risk weights for residential mortgage loans in order to curb the rise
in house prices and debt. In Australia, risk weights for uninsured residential mortgage loans (low-doc
loans) were raised in 2004. According to the Australian Prudential Regulation Authority (APRA), this
changed bank lending behaviour and limited the growth of uninsured mortgages.21 In 2005 risk weights
on residential mortgage loans22 were increased in Bulgaria. The rise in house prices and residential
mortgages slowed somewhat as a result, but remained nonetheless relatively high until the financial
crisis erupted in 2008.23 In Estonia, residential mortgage risk weights were doubled from 50 to 100
percent in 2006, but the rise in house prices and residential mortgages still remained strong in this
country up to the financial crisis. In 2009 the Reserve Bank of New Zealand introduced a requirement
under Pillar 2 for IRB banks in New Zealand to hold 15 percent additional capital against their housing
portfolios until internal modelling had been sufficiently improved.24
There are also examples of countries that have increased risk weights in order to curb growth in other
types of loans. Experiences from Croatia and India are somewhat mixed. In 2005 risk weights on loans
with exchange rate risk were increased in Croatia. However, although combined with stricter liquidity
and reserve requirements, this was not effective in curbing growth in foreign currency loans. The
measures were to a great extent sidestepped by loans being taken from banks outside Croatia. The
Reserve Bank of India (RBI) increased risk weights on commercial real estate lending in 2005 and again in
21 Bank of England (2011). 22 The limit on the loan-to-value ratio for residential mortgages in order to be assigned a risk weight of 50 percent instead of 100 percent was reduced from 80 to 70 percent. 23 Crowe, C., G. Dell’Ariccia, D. Igan and P. Rabanal (2011). 24 Reserve Bank of New Zealand (2009).
10.0 10.8 11.2 11.412.3 13.8
16.9
35.0
9.911.0 11.2
12.811.3
13.3
16.0
3.7 3.8 4.0 3.6 3.8 3.7 3.6 3.74.2 4.1 4.3 4.0 3.8 4.1 4.1 4.0
0
5
10
15
20
25
30
35
40
0
5
10
15
20
25
30
35
40
Spb 1 SR-Bank
Spb 1 SMN Spb Nord Norge
DNB Spb Vest Bank 1 Oslo Akershus
Nordea Bank Norge
Std Approach
Average risk weight 2010
Average risk weight 2011
Mortgage rate 2010
Mortgage rate 2011
Chart 6 The banks’1) average risk weight on residential mortgages2) and mortgage rate3). Percent. 2010 Q4 and 2011 Q4
1) IRB banks and a sample of 108 Norwegian banks applying the Standardised Approach2) Data from Chart 23) Interest rate on new residential mortgages of NOK 1m within 60 percent of purchase price with
variable interest rateSources: Norsk Famileøkonomi AS and the banks’ Pillar 3 reports
16
2006. Growth in credit to this sector slowed sharply as a result. But the RBI also required Indian banks to
increase their provisioning against loans to the commercial real estate sector and this may also have
contributed to the slowdown in credit growth. In 2007 the RBI also increased risk weights on lending to
non-bank financial corporations in 2007, although without any substantial effect on growth in lending to
this sector.
6. Limitations under the capital adequacy framework
The current EEA capital adequacy directive is formulated as minimum requirements, and the authorities
may choose to impose stricter rules. The authorities may lay down stricter guidelines for estimating risk
parameters, including which data series and methods that should be used. For the authorities it may be
necessary to withdraw the approval for a bank to use the IRB approach. This withdrawal must apply on a
general basis to all the IRB models used by the bank. The IRB bank then revert to being a standardised-
approach bank.
The authorities can set minimum limits for the estimated parameters for probability of default and loss
given default. Another possibility is to change parameter values that are not estimated by banks, ie the
correlation coefficient. The authorities are also entitled under the current directive to adjust estimated
risk weights using minimum limits, add-ons or multipliers. However, the current directive does not
permit set values to be introduced for risk weights or for risk parameters that banks are estimating.
The authorities may impose higher capital requirements for banks under Pillar 2. The Pillar 2
requirement may be based on calculations of how much higher the total capital requirement should be
when risk weights are too low.
The proposed new EU capital adequacy rules (CRD IV), that are approved by EcoFin (Economic and
Financial Affairs Council) and to be negotiated in the European Parliament by June 2012, provides the
opportunity for authorities to introduce a systemic risk buffer for the financial sector or one or more
subsets of it.25 Moreover, it will still be possible to impose additional capital requirements under Pillar 2.
25 Member states would be able to apply systemic risk buffers of up to 3% for all exposures and up to 5% for domestic and third country exposures, without having to seek prior the European Commission approval, while they could impose even higher buffers with prior Commission authorisation in the form of a delegated act. A decision to raise risk weights for targeting asset bubbles in residential and commercial property could only be overruled if,
17
Under the draft regulation the authorities can raise risk weights for residential and commercial property
and intra financial sector exposures beyond those provided in the regulation and up to 25 percent.26
Finally, the draft regulation allows the authorities to set minimum limits for the IRB-banks’ estimated
loss given default parameter for exposures secured by property.27
7. Conclusion
Higher risk weights can to a certain extent mitigate systemic risk, as banks might both set aside more
capital and reduce lending and investment that generate systemic risk. As long as regulatory capital
requirements are binding, higher risk weights will unambiguously push up equity ratios and improve
banks’ capacity to absorb losses.
In order to achieve the desired impact on banks’ actions, it is important for the authorities to assess a
number of factors before changing risk weights, including which banks will be affected and banks’
earnings from different asset classes. If risk weights for one asset class are increased sharply,
investments in other markets may be relatively more profitable, inducing banks to increase investment
in these markets. It is also important for the authorities to assess banks’ capital adequacy and access to
new capital before risk weights are changed. Even though risk weights would normally be raised in
periods when banks are well capitalised with easy access to new capital, some banks may have
positioned themselves in such a way that they do not have the capacity in the short term to adjust as
required by the authorities. For these banks, higher risk weights for a low-weighted asset class may lead
to a tightening on other loans with higher risk weights.
In the short term, the impact of higher risk weights on credit volume will probably be moderate due to
frictions in the banking sector. Reducing the existing stock of loans may be time-consuming. Moreover,
contractual conditions may make it difficult for banks to raise lending rates. Other factors such as
competition or strategies of gaining market shares or diversifying risk may be more critical for the banks’
supply of credit than regulatory capital requirements.
following a negative opinion by The European Banking Authority (EBA), the European Systemic Risk Board (ESRB) or the Commission, the Council votes by qualified majority against the measures. For more information, see http://consilium.europa.eu/uedocs/cms_data/docs/pressdata/en/ecofin/130264.pdf 26 See article 443, paragraph 3x in http://register.consilium.europa.eu/pdf/en/12/st10/st10099.en12.pdf 27 See article 160, paragraph 4-6 in http://register.consilium.europa.eu/pdf/en/12/st09/st09715.en12.pdf

18
In the residential mortgage market where the products are homogeneous and banks’ profits on sales of
additional products are high, risk weights on residential mortgages would probably have to be raised by
a considerable amount to trigger a rise in mortgage rates in the short term. In the long term, a doubling
of average risk weights from the current level will probably result in a maximum rise in mortgage rates
of about half a percentage point. This may curb the rise in residential mortgage lending somewhat.
Increasing risk weights on loans to the corporate sector will probably have a greater impact than
increasing risk weights on residential mortgage loans. As products in the corporate market are more
heterogeneous, banks can more easily raise lending rates. Finally, the impact on credit may be
somewhat stronger if the authorities’ decision to increase risk weights leads to a more conservative
assessment of risk and expected return.
8. References
Andersson, T., C. A. Claussen, B. Lagerwall and P. Torstensson (2011), “Tools and institutions for
influencing house prices and household debt”, The Riksbank’s inquiry into the risks in the Swedish
housing market, pp. 297-351
Bank of England (2011), “Instruments of macroprudential policy”, Discussion Paper, December
BIS (2010), “Assessing the macroeconomic impact of the transition to stronger capital and liquidity
requirements”, Macroeconomic Assessment Group – Interim Report
Crowe, C., G. Dell’Ariccia, D. Igan and P. Rabanal (2011), “Policies for macrofinancial stability: Options to
deal with real estate booms”, IMF staff discussion note, February
Jacobsen, D. H., T. Birkeland Kloster, A. Bakke Kvinlog and U. Larsen (2011), “Makroøkonomiske
virkninger av høyere kapitalkrav” [Macroeconomic effects of higher capital requirements for banks],
Norges Bank Staff Memo 14/2011, Norwegian only
Jaffee, D.M. and F. Modigliani (1969), “A theory and test of credit rationing”, The American Economic
Review, Vol. 59, No. 5, December 1969
19
Jaffee, D.M. and T. Russell (1976), “Imperfect information, uncertainty, and credit rationing”, Quarterly
Journal of Economics, No. 90, 651–66
Norges Bank (2010), “The effects of new capital regulation on banks’ lending growth”, Financial Stability
1/10, May 2010
Norges Bank (2011), “National options and discretions for capital requirements in the European
Commission’s proposed new banking regulation in the EU – CRD IV”, Financial Stability 2/11, November
2011
Reserve Bank of New Zealand (2009), Financial Stability Report, November 2009
Stackelberg, H. (1934), “Market Structure and Equilibrium”, Springer, Vienna
Stiglitz, J.E. and A. Weiss (1981), “Credit rationing in markets with imperfect information”, American
Economic Review, No. 71, 393–410


