
atmosphere
Article
Effects of Plastic Mulch on Soil Heat Flux and EnergyBalance in a Cotton Field in Northwest ChinaNana Li 1, Fuqiang Tian 1,*, Hongchang Hu 1, Hui Lu 2 and Guanghui Ming 1
1 Department of Hydraulic Engineering, State Key Laboratory of Hydroscience and Engineering,Tsinghua University, Beijing 100084, China; [email protected] (N.L.);[email protected] (H.H.); [email protected] (G.M.)
2 Ministry of Education Key Laboratory for Earth System Modeling, Center for Earth System Science,Tsinghua University, Beijing 100084, China; [email protected]
* Correspondence: [email protected]; Tel.: +86-10-6277-3396
Academic Editor: Robert W. TalbotReceived: 5 July 2016; Accepted: 11 August 2016; Published: 19 August 2016
Abstract: Surface energy balance (SEB) is a basic principle for all of the atmospheric circulationmodels, and surface soil heat flux (G0) is an important component of energy balance. Plastic mulchis widely used in arid regions and alters land surface processes. In this study, hourly/daily G0 andSEB over a mulched cotton field were analyzed in Northwest China. The net radiation beneath themulch was simulated using transmitted down short-wave and down long-wave radiation throughthe mulch and up short-wave and up long-wave radiation from the soil beneath mulch. The resultsshow that: (1) on the hourly time scale, G0 in mulched soil is much smaller than that in non-mulchedsoil, day and night. This implies that mulch prevents energy going into the soil during the daytimeand reduces soil heat loss at night. On the daily time scale, G0 is similar in mulched and non-mulchedsoil. (2) During the seedling emergence period when the cotton is small, the energy balance closureover mulched soil (0.79) is slightly smaller than that over non-mulched soil (0.81). (3) Comparing tosoil temperature in non-mulched soil, there’s a time offset on soil temperature in mulched soil at thesame depth, which will bring a hysteresis on G0 and SEB.
Keywords: plastic mulch; surface soil heat flux; energy balance; arid area
1. Introduction
Energy exchange between the surface and the atmosphere is one of the most crucial ecologicalprocesses in terrestrial ecosystems [1,2]. Surface energy balance is the basic principle for atmosphericcirculation models [3] and is also essential for surface evapotranspiration estimation [4–7]. Surface soilheat flux (G0) represents the energy absorbed or released by surface soil during a given time period [2].It is an important component of the surface energy balance. Although G0 is relatively small on dailyand longer timescales, the instantaneous G0 can contribute as much as 50% of the net radiation fordry and bare soil [8–11]. G0 is also a significant component of the energy balance for vegetatedsurfaces [12,13] and plays an important role in estimating surface evapotranspiration [14]. IncorrectG0 is supposed to be an important reason for energy imbalance [15]. Land surface change will affectG0 and energy balance and impact atmospheric properties [16]. The land surface characteristics, suchas soil moisture, surface albedo, leaf area index and roughness, are related to land surface fluxesand are important for the simulation of local and regional weather and climate variables, includingair temperature, wind, humidity and precipitation [17–21]. The land cover change can influence theatmospheric circulation not only at meteorological timescales, but also at climatological timescales [22].
The plastic film mulching technique and drip irrigation method have been widely applied inXinjiang in Northwest China [23]. The mulched area amounted to more than 1.2 million hectares
Atmosphere 2016, 7, 107; doi:10.3390/atmos7080107 www.mdpi.com/journal/atmosphere

Atmosphere 2016, 7, 107 2 of 16
in 2009 in Xinjiang [24]. The film mulch reduces heat convection and evaporation from the soil tothe atmosphere. The mulch also changes surface albedo and soil moisture, which will impact themeteorological parameters. Moreover, the droplets on the film mulch and the water vapor in the airbeneath the film mulch can absorb long-wave radiation, resulting in more soil heating due to thegreenhouse effect [25]. The soil thermal and moisture conditions are improved by mulch to ensurecrop germination and small plant growth [24,26–28]. The mulch promotes crop development andyield [29]. Polythene mulch increased soil temperature by approximately 6 ◦C at a 5-cm depth innorthern Vietnam [29] and by 1.6 ◦C at a 15-cm depth in Xinjiang, China [30]. Mulch greatly retardsthe loss of moisture from soil, which reduces the irrigation frequency and amount [29]. The mulch isalso beneficial for disease control [25].
The mulch alters matter and energy exchanges and affects land surface processes, which hasattracted substantial research. Previous studies mainly focused on the effect of mulch on soiltemperature, crop growth and yield, while few research studies address its effect on the soil heat fluxand energy balance. The present study will explore how the plastic mulch affects the soil heat flux andenergy balance with 3-year (2013–2015) continuous observations at the Korla cotton site in Xinjiang,Northwest China. The surface soil heat flux was calculated by the thermal conduction equation usingthe observed soil temperature and moisture profile. The air heat storage and atmospheric moisturechange were taken into account for energy balance, together with the observed sensible and latentheat flux by an eddy covariance system (EC). The net radiation beneath the mulch is essential for thesurface energy balance beneath the mulch. It was calculated using transmitted down short-wave anddown long-wave radiation through the mulch and up short-wave and up long-wave radiation of soilbeneath mulch.
2. Methods and Materials
2.1. Experimental Site and Data Records
The Korla site (86◦12′E, 41◦36′N, 886 m a.s.l.) is located in the northeast Tarim River Basinin the Xinjiang Uygur Autonomous Region (Figure 1). It is characterized by a typical inland aridclimate with scarce precipitation and strong diurnal temperature fluctuation [24]. The mean annualprecipitation is approximately 60 mm, and the mean temperature is 11.48 ◦C [24]. The mean annualpotential evaporation measured by a Φ20 evaporation pan (20 cm in diameter) is approximately2788 mm [31]. The Korla site is covered by cotton planted in late April and harvested in September.The major soil type is silt loam. The cotton yield contributes to nearly 50% of the total lint yield ofChina, with approximately 3.2 million tons in 2012 [24]. The distribution of cotton planting, plasticmulch and drip pipe, shown in Figure 2, is referred to as a “one pipe, one film and four rows of cottonarrangement” [32]. The width of the mulch is approximately 110 cm, and the inter-mulch zone isapproximately 40 cm.
The hourly datasets in 2013–2015 were used in the present study and included EC and automaticweather station (AWS) measurements (Figure 3). Table 1 shows detailed information on the datasets.The EC consists of an EC150 open-path CO2/H2O gas analyzer (Campbell Scientific Inc., Logan, UT,USA), a CSAT3 three-dimensional sonic anemometer (Campbell Scientific Inc., Logan, UT, USA) andan air temperature/humidity sensor (HMP155A, Vaisala Inc., Woburn, MA, USA) installed at a 2.25-mheight. The EC data were recorded by a data logger (CR3000, Campbell Scientific Inc., Logan, UT, USA)at 30-min time intervals. The energy and water vapor fluxes (latent heat flux LE and sensible heatflux H) and carbon dioxide flux were measured by EC. The AWS measurements contained wind speedand direction, air temperature and pressure, precipitation, net radiation, soil temperature and soilmoisture profiles. The net radiation was measured at a height of 2.25 m by a net radiometer (CNR 4,Kipp&Zonen, Delft, The Netherlands). The soil temperature and moisture were measured by a HydraProbe®sensor (Stevens Water Monitoring System, Inc., Beaverton, OR, USA) in mulched soil andnon-mulched soil, respectively (Figure 3b).

Atmosphere 2016, 7, 107 3 of 16
Atmosphere 2016, 7, 107 2 of 16
The plastic film mulching technique and drip irrigation method have been widely applied in
Xinjiang in Northwest China [23]. The mulched area amounted to more than 1.2 million hectares in
2009 in Xinjiang [24]. The film mulch reduces heat convection and evaporation from the soil to the
atmosphere. The mulch also changes surface albedo and soil moisture, which will impact the
meteorological parameters. Moreover, the droplets on the film mulch and the water vapor in the air
beneath the film mulch can absorb long-wave radiation, resulting in more soil heating due to the
greenhouse effect [25]. The soil thermal and moisture conditions are improved by mulch to ensure
crop germination and small plant growth [24,26–28]. The mulch promotes crop development and
yield [29]. Polythene mulch increased soil temperature by approximately 6 °C at a 5-cm depth in
northern Vietnam [29] and by 1.6 °C at a 15-cm depth in Xinjiang, China [30]. Mulch greatly retards
the loss of moisture from soil, which reduces the irrigation frequency and amount [29]. The mulch is
also beneficial for disease control [25].
The mulch alters matter and energy exchanges and affects land surface processes, which has
attracted substantial research. Previous studies mainly focused on the effect of mulch on soil
temperature, crop growth and yield, while few research studies address its effect on the soil heat flux
and energy balance. The present study will explore how the plastic mulch affects the soil heat flux
and energy balance with 3-year (2013–2015) continuous observations at the Korla cotton site in
Xinjiang, Northwest China. The surface soil heat flux was calculated by the thermal conduction
equation using the observed soil temperature and moisture profile. The air heat storage and
atmospheric moisture change were taken into account for energy balance, together with the observed
sensible and latent heat flux by an eddy covariance system (EC). The net radiation beneath the mulch
is essential for the surface energy balance beneath the mulch. It was calculated using transmitted
down short-wave and down long-wave radiation through the mulch and up short-wave and up long-
wave radiation of soil beneath mulch.
2. Methods and Materials
2.1. Experimental Site and Data Records
The Korla site (8612E, 4136N, 886 m a.s.l.) is located in the northeast Tarim River Basin in the
Xinjiang Uygur Autonomous Region (Figure 1). It is characterized by a typical inland arid climate
with scarce precipitation and strong diurnal temperature fluctuation [24]. The mean annual
precipitation is approximately 60 mm, and the mean temperature is 11.48 °C [24]. The mean annual
potential evaporation measured by a Φ20 evaporation pan (20 cm in diameter) is approximately
2788 mm [31]. The Korla site is covered by cotton planted in late April and harvested in September.
The major soil type is silt loam. The cotton yield contributes to nearly 50% of the total lint yield of
China, with approximately 3.2 million tons in 2012 [24]. The distribution of cotton planting, plastic
mulch and drip pipe, shown in Figure 2, is referred to as a “one pipe, one film and four rows of cotton
arrangement” [32]. The width of the mulch is approximately 110 cm, and the inter-mulch zone is
approximately 40 cm.
Figure 1. The location of the Korla site in the Tarim River Basin in Northwest China. Figure 1. The location of the Korla site in the Tarim River Basin in Northwest China.Atmosphere 2016, 7, 107 3 of 16
Figure 2. The plastic mulch and drip pipe in a cotton field at the Korla site. The locations marked 1
and 2 represent mulched soil and non-mulched soil, respectively.
The hourly datasets in 2013–2015 were used in the present study and included EC and automatic
weather station (AWS) measurements (Figure 3). Table 1 shows detailed information on the datasets.
The EC consists of an EC150 open-path CO2/H2O gas analyzer (Campbell Scientific Inc., Logan, UT,
USA), a CSAT3 three-dimensional sonic anemometer (Campbell Scientific Inc., Logan, UT, USA) and
an air temperature/humidity sensor (HMP155A, Vaisala Inc., Woburn, MA, USA) installed at a 2.25-m
height. The EC data were recorded by a data logger (CR3000, Campbell Scientific Inc., Logan, UT, USA)
at 30-min time intervals. The energy and water vapor fluxes (latent heat flux LE and sensible heat
flux H) and carbon dioxide flux were measured by EC. The AWS measurements contained wind
speed and direction, air temperature and pressure, precipitation, net radiation, soil temperature and
soil moisture profiles. The net radiation was measured at a height of 2.25 m by a net radiometer (CNR 4,
Kipp&Zonen, Delft, Netherlands). The soil temperature and moisture were measured by a Hydra
Probe® sensor (Stevens Water Monitoring System, Inc., Beaverton, OR, USA) in mulched soil and
non-mulched soil, respectively (Figure 3b).
The following post-processing procedures were implemented to control the quality of the EC
data: linear de-trending, tilt correction through the yaw and pitch rotation, density fluctuation
correction and sonic temperature correction [24]. The datasets from 2013–2015 with a 30-min time
scale were converted to hourly values in this study. Furthermore, the missing data accounted for less
than 1%, and the data collected on a few rainy days were also included.
Figure 3. (a) The plastic mulch when the cotton is just planted; (b) the soil temperature and moisture
sensors; (c) the net radiation sensor and eddy covariance system at the Korla site.
Table 1. The parameters and depths/heights of sensors at the Korla site during 2013–2015.
Instrument Parameters 2013 (m) 2014 (m) 2015 (m)
Eddy
covariance
system (EC)
Latent heat flux and sensible
heat flux 2.25 2.25 2.25
Atmospheric moisture
density 2.25 2.25 2.25
Automatic
weather
station (AWS)
Soil temperature
0.05, 0.1,
0.2, 0.3, 0.4,
0.5, 0.6, 0.8
0.1, 0.2,
0.3, 0.5,
0.6
0.05, 0.1, 0.2,
0.3, 0.4, 0.6,
0.8, 1.0, 1.2
(a) (b) (c)
Figure 2. The plastic mulch and drip pipe in a cotton field at the Korla site. The locations marked 1and 2 represent mulched soil and non-mulched soil, respectively.
Atmosphere 2016, 7, 107 3 of 16
Figure 2. The plastic mulch and drip pipe in a cotton field at the Korla site. The locations marked 1
and 2 represent mulched soil and non-mulched soil, respectively.
The hourly datasets in 2013–2015 were used in the present study and included EC and automatic
weather station (AWS) measurements (Figure 3). Table 1 shows detailed information on the datasets.
The EC consists of an EC150 open-path CO2/H2O gas analyzer (Campbell Scientific Inc., Logan, UT,
USA), a CSAT3 three-dimensional sonic anemometer (Campbell Scientific Inc., Logan, UT, USA) and
an air temperature/humidity sensor (HMP155A, Vaisala Inc., Woburn, MA, USA) installed at a 2.25-m
height. The EC data were recorded by a data logger (CR3000, Campbell Scientific Inc., Logan, UT, USA)
at 30-min time intervals. The energy and water vapor fluxes (latent heat flux LE and sensible heat
flux H) and carbon dioxide flux were measured by EC. The AWS measurements contained wind
speed and direction, air temperature and pressure, precipitation, net radiation, soil temperature and
soil moisture profiles. The net radiation was measured at a height of 2.25 m by a net radiometer (CNR 4,
Kipp&Zonen, Delft, Netherlands). The soil temperature and moisture were measured by a Hydra
Probe® sensor (Stevens Water Monitoring System, Inc., Beaverton, OR, USA) in mulched soil and
non-mulched soil, respectively (Figure 3b).
The following post-processing procedures were implemented to control the quality of the EC
data: linear de-trending, tilt correction through the yaw and pitch rotation, density fluctuation
correction and sonic temperature correction [24]. The datasets from 2013–2015 with a 30-min time
scale were converted to hourly values in this study. Furthermore, the missing data accounted for less
than 1%, and the data collected on a few rainy days were also included.
Figure 3. (a) The plastic mulch when the cotton is just planted; (b) the soil temperature and moisture
sensors; (c) the net radiation sensor and eddy covariance system at the Korla site.
Table 1. The parameters and depths/heights of sensors at the Korla site during 2013–2015.
Instrument Parameters 2013 (m) 2014 (m) 2015 (m)
Eddy
covariance
system (EC)
Latent heat flux and sensible
heat flux 2.25 2.25 2.25
Atmospheric moisture
density 2.25 2.25 2.25
Automatic
weather
station (AWS)
Soil temperature
0.05, 0.1,
0.2, 0.3, 0.4,
0.5, 0.6, 0.8
0.1, 0.2,
0.3, 0.5,
0.6
0.05, 0.1, 0.2,
0.3, 0.4, 0.6,
0.8, 1.0, 1.2
(a) (b) (c)
Figure 3. (a) The plastic mulch when the cotton is just planted; (b) the soil temperature and moisturesensors; (c) the net radiation sensor and eddy covariance system at the Korla site.
Table 1. The parameters and depths/heights of sensors at the Korla site during 2013–2015.
Instrument Parameters 2013 (m) 2014 (m) 2015 (m)
Eddy covariancesystem (EC)
Latent heat flux andsensible heat flux 2.25 2.25 2.25
Atmosphericmoisture density 2.25 2.25 2.25
Automatic weatherstation (AWS) Soil temperature 0.05, 0.1, 0.2, 0.3, 0.4,
0.5, 0.6, 0.8 0.1, 0.2, 0.3, 0.5, 0.6 0.05, 0.1, 0.2, 0.3, 0.4,0.6, 0.8, 1.0, 1.2
Soil water content 0.05, 0.1, 0.2, 0.3, 0.4,0.5, 0.6, 0.8 0.1, 0.2, 0.3, 0.5, 0.6 0.05, 0.1, 0.2, 0.3, 0.4,
0.6, 0.8, 1.0, 1.2
Net radiation 2.25 2.25 2.25Air temperature 2.8 2.8 2.8

Atmosphere 2016, 7, 107 4 of 16
The following post-processing procedures were implemented to control the quality of the EC data:linear de-trending, tilt correction through the yaw and pitch rotation, density fluctuation correctionand sonic temperature correction [24]. The datasets from 2013–2015 with a 30-min time scale wereconverted to hourly values in this study. Furthermore, the missing data accounted for less than 1%,and the data collected on a few rainy days were also included.
2.2. Methods
The full surface energy balance equation can be expressed as follows [33–35]:
Rn = LE + H + G0 + Sc + Sp + Sa + Sq + Sd (1)
where Rn is the net radiation, L (J·kg−1) is the latent heat of vaporization and E (kg·m−2·s−1) is theevaporation, the product of which is the latent heat flux. H is the sensible heat flux; G0 is the surfacesoil heat flux; Sc is the canopy heat storage in the biomass and water; Sp is the photosynthesis flux; Sa
is the air storage between the eddy covariance system and the ground surface; Sq is the atmosphericmoisture change; and Sd is the canopy dew enthalpy change (all fluxes are in W·m−2). Sc, Sp andSd were not included in this study, as cotton plants are very small during the period for the study ofenergy balance.
2.2.1. Surface Soil Heat Flux
The surface soil heat flux was calculated by a “TDEC” method (thermal diffusion equation andcorrection) proposed by [36], using soil temperature and moisture observations that do not requireaccurate thermal conductivity. The equation is as follows:
G(0, t) = G(zre f , t) +0∫
zre f
∂ρscsT(z, t)∂t
dz (2)
where G (0, t) (W·m−2) is the surface soil heat flux at time t (s) and G (zref,t) (W·m−2) is the soil heatflux at a reference depth zref at time t, assumed to be zero if zref is deep enough. ρs (kg·m−3) is the soilbulk density, and cs (J·kg−1·K−1) is the heat capacity; the product of ρs and cs is the soil volumetricheat capacity (J·m−3·K−1). T (z,t) (K) is the soil temperature at depth z and time t.
The soil volumetric heat capacity can be obtained from the following equation:
ρscs = ρsolidcsolid(1− θsat) + ρwcwθ (3)
where ρsolidcsolid is the volumetric heat capacity of the soil solids, with a value of 2.1 × 10⁶ J·m−3·K−1.The uncertainty of the ρsolidcsolid value brings little uncertainty of G0. ρwcw is the volumetric heatcapacity of liquid water, with a value of 4.2× 10⁶ J·m–3·K−1. θsat (%) and θ (cm3·cm−3) are soil porosityand observed soil water content, respectively. θsat is 42% observed at the Korla site.
The key issue in calculating G0 is obtaining a reliable soil temperature profile from limitedobserved temperatures. Yang and Wang (2008) [36] proposed a new method for obtaining a preliminarysoil temperature profile (80 layers in the present study) by the tridiagonal matrix algorithm with theT (z0) and T (zbot) as the upper and lower boundary conditions, respectively, and then adjusting theprofile with the observed soil temperature. T (z0) (denoted as “Ts”) for bare soil was calculated fromthe upward and downward long-wave radiation fluxes:
T(z0) = (R↑L − (1− εs)R↓L
εsσ)
1/4
(4)
where R↑L and R↓L are the observed upward and downward long-wave radiation fluxes (W·m−2); εs isthe land surface emissivity, which is 0.96 for silt loam soils [37]; and the Stefan–Boltzmann constant is

Atmosphere 2016, 7, 107 5 of 16
σ = 5.67 × 10⁻⁸ W·m−2·K−4 T (z0) for soil beneath mulch will be given in next section. T (zbot) is thebottom soil temperature measurement. The soil heat fluxes at different soil depths can be calculated byintegrating the adjusted soil temperature profile with the bottom soil heat flux (e.g., 1.6 m) as zero.The observed soil temperature is assimilated in the process of simulating the soil temperature profile,which leads to the TDEC method’s lack of sensitivity to soil thermal conductivity that is difficultto obtain. In addition, TDEC is also not sensitive to T (z0), as it depends on multiple layers of soiltemperature [38].
2.2.2. Net Radiation
The net radiation for bare soil (non-mulched) is as follows:
Rn = (1− ρs)S + R↓L − εsσT4s (5)
where Rn (W·m−2) is the surface soil net radiation, S (W·m–2) is solar radiation and rs is the surfacesoil reflectivity, 0.15 for silt loam soils [37]. εs is the surface soil emissivity, given as 0.96 [37].
The net radiation in the surface soil beneath mulch is as follows [39]:
R′n = (1− rs)τm1S + τm2R↓L + εmσT4m − εsσT′4s (6)
where R′n (W·m−2) is the net radiation over the soil beneath the mulch; τm1 = 0.84 and τm2 = 0.82are the transmittances of mulch for solar radiation and thermal radiation, respectively [37]; εm isthe mulch emissivity, given as 0.05 [37]; Tm (K) is the mulch temperature, and Ts
′ (K) is the surfacesoil temperature beneath the mulch. According to the experiment, Tm was taken as the same asTs′ in the present study. The observed R↑L above the mulch contains three parts: reflective R↓L by
mulch, transmitted thermal radiation of soil beneath the mulch through the mulch (τm2εsσT′4s ), andtransmitted R↓L to soil beneath the mulch reflected by the soil and then transmitted to the air throughthe mulch. Thus, Ts
′ can be calculated by the following equation:
εsσT′4s =R↑L − (1− τm2 − εm)× R↓L − (1− εs)× τ2
m2 × R↓Lτm2
(7)
2.2.3. Air Heat Storage
The air heat storage between the ground surface and the eddy covariance system is:
Sa = ρaca
hw
0
∂Ta
∂tdz (8)
where ρa (kg·m−3) is the air density; ca (J·kg−1·K−1) is the specific heat capacity of moist air; Ta (K) isthe air temperature at 2.8 m in the present study; and h = 2.25 m is the height of the EC.
2.2.4. Atmospheric Moisture Change
The atmospheric moisture change is:
Sq = Lhw
0
∂q∂t
dz (9)
where q (kg·m−3) is the moist air density and the latent heat of vaporization L = 2.5 × 10⁶ J·kg−1.
Atmosphere 2016, 7, 107 6 of 16
3. Results and Discussions
3.1. The Effect of Mulch on Soil Temperature and Energy Fluxes
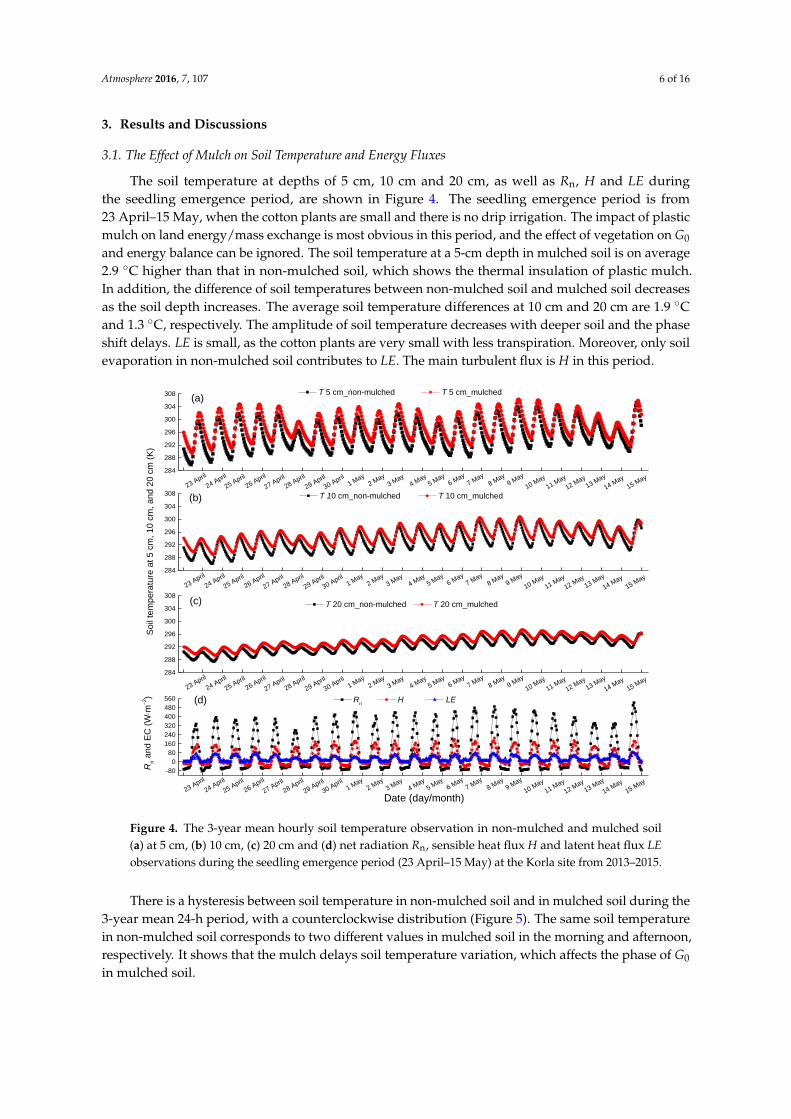
The soil temperature at depths of 5 cm, 10 cm and 20 cm, as well as Rn, H and LE duringthe seedling emergence period, are shown in Figure 4. The seedling emergence period is from23 April–15 May, when the cotton plants are small and there is no drip irrigation. The impact of plasticmulch on land energy/mass exchange is most obvious in this period, and the effect of vegetation on G0
and energy balance can be ignored. The soil temperature at a 5-cm depth in mulched soil is on average2.9 ◦C higher than that in non-mulched soil, which shows the thermal insulation of plastic mulch.In addition, the difference of soil temperatures between non-mulched soil and mulched soil decreasesas the soil depth increases. The average soil temperature differences at 10 cm and 20 cm are 1.9 ◦Cand 1.3 ◦C, respectively. The amplitude of soil temperature decreases with deeper soil and the phaseshift delays. LE is small, as the cotton plants are very small with less transpiration. Moreover, only soilevaporation in non-mulched soil contributes to LE. The main turbulent flux is H in this period.
Atmosphere 2016, 7, 107 6 of 16
soil is on average 2.9 °C higher than that in non-mulched soil, which shows the thermal insulation of
plastic mulch. In addition, the difference of soil temperatures between non-mulched soil and
mulched soil decreases as the soil depth increases. The average soil temperature differences at 10 cm
and 20 cm are 1.9 °C and 1.3 °C, respectively. The amplitude of soil temperature decreases with
deeper soil and the phase shift delays. LE is small, as the cotton plants are very small with less
transpiration. Moreover, only soil evaporation in non-mulched soil contributes to LE. The main
turbulent flux is H in this period.
There is a hysteresis between soil temperature in non-mulched soil and in mulched soil during
the 3-year mean 24-h period, with a counterclockwise distribution (Figure 5). The same soil
temperature in non-mulched soil corresponds to two different values in mulched soil in the morning
and afternoon, respectively. It shows that the mulch delays soil temperature variation, which affects
the phase of G0 in mulched soil.
Figure 4. The 3-year mean hourly soil temperature observation in non-mulched and mulched soil (a)
at 5 cm, (b) 10 cm, (c) 20 cm and (d) net radiation Rn, sensible heat flux H and latent heat flux LE
observations during the seedling emergence period (23 April–15 May) at the Korla site from 2013–2015.
Figure 5. Scatter plot of soil temperature at (a) 5 cm, (b) 10 cm and (c) 20 cm in non-mulched soil
284
288
292
296
300
304
308
284
288
292
296
300
304
308
284
288
292
296
300
304
308
-80
0
80
160
240
320
400
480
560
15 May
14 May
13 May
12 May
11 May
10 May
9 May
8 May
7 May
6 May
5 May
4 May
3 May
2 May
1 May
30 April
29 April
28 April
27 April
26 April
25 April
24 April
(a)
So
il te
mp
era
ture
at
5 c
m, 1
0 c
m, a
nd
20
cm
(K
)
23 April
T 10 cm_non-mulched T 10 cm_mulched(b)
15 May
14 May
13 May
12 May
11 May
10 May
9 May
8 May
7 May
6 May
5 May
4 May
3 May
2 May
1 May
30 April
29 April
28 April
27 April
26 April
25 April
24 April
23 April
(d)
(c) T 20 cm_non-mulched T 20 cm_mulched
Date (day/month)
15 May
14 May
13 May
12 May
11 May
10 May
9 May
8 May
7 May
6 May
5 May
4 May
3 May
2 May
1 May
30 April
29 April
28 April
27 April
26 April
25 April
24 April
23 April
T 5 cm_non-mulched T 5 cm_mulched
Rn a
nd
EC
(Wm
2)
A
Rn H LE
15 May
14 May
13 May
12 May
11 May
10 May
9 May
8 May
7 May
6 May
5 May
4 May
3 May
2 May
1 May
30 April
29 April
28 April
27 April
26 April
25 April
24 April
23 April
290 292 294 296 298 300 302292
294
296
298
300
302
304
290 292 294 296 298
292
293
294
295
296
297
298
290 291 292 293 294 295292
293
294
295
296
00:00-9:00
10:00-23:00
T_
mu
lche
d (
K)
T_non-mulched (K)
5 cm(a)
n = 24
00:00-9:00
10:00-23:00
T_non-mulched (K)
(b)
n = 24
10 cm
00:00-9:00
10:00-23:00
T_non-mulched (K)
(c)
n = 24
20 cm
Figure 4. The 3-year mean hourly soil temperature observation in non-mulched and mulched soil(a) at 5 cm, (b) 10 cm, (c) 20 cm and (d) net radiation Rn, sensible heat flux H and latent heat flux LEobservations during the seedling emergence period (23 April–15 May) at the Korla site from 2013–2015.
There is a hysteresis between soil temperature in non-mulched soil and in mulched soil during the3-year mean 24-h period, with a counterclockwise distribution (Figure 5). The same soil temperaturein non-mulched soil corresponds to two different values in mulched soil in the morning and afternoon,respectively. It shows that the mulch delays soil temperature variation, which affects the phase of G0
in mulched soil.

Atmosphere 2016, 7, 107 7 of 16
Atmosphere 2016, 7, 107 6 of 16
soil is on average 2.9 °C higher than that in non-mulched soil, which shows the thermal insulation of
plastic mulch. In addition, the difference of soil temperatures between non-mulched soil and
mulched soil decreases as the soil depth increases. The average soil temperature differences at 10 cm
and 20 cm are 1.9 °C and 1.3 °C, respectively. The amplitude of soil temperature decreases with
deeper soil and the phase shift delays. LE is small, as the cotton plants are very small with less
transpiration. Moreover, only soil evaporation in non-mulched soil contributes to LE. The main
turbulent flux is H in this period.
There is a hysteresis between soil temperature in non-mulched soil and in mulched soil during
the 3-year mean 24-h period, with a counterclockwise distribution (Figure 5). The same soil
temperature in non-mulched soil corresponds to two different values in mulched soil in the morning
and afternoon, respectively. It shows that the mulch delays soil temperature variation, which affects
the phase of G0 in mulched soil.
Figure 4. The 3-year mean hourly soil temperature observation in non-mulched and mulched soil (a)
at 5 cm, (b) 10 cm, (c) 20 cm and (d) net radiation Rn, sensible heat flux H and latent heat flux LE
observations during the seedling emergence period (23 April–15 May) at the Korla site from 2013–2015.
Figure 5. Scatter plot of soil temperature at (a) 5 cm, (b) 10 cm and (c) 20 cm in non-mulched soil
284
288
292
296
300
304
308
284
288
292
296
300
304
308
284
288
292
296
300
304
308
-80
0
80
160
240
320
400
480
560
15 May
14 May
13 May
12 May
11 May
10 May
9 May
8 May
7 May
6 May
5 May
4 May
3 May
2 May
1 May
30 April
29 April
28 April
27 April
26 April
25 April
24 April
(a)
So
il te
mp
era
ture
at
5 c
m, 1
0 c
m, a
nd
20
cm
(K
)
23 April
T 10 cm_non-mulched T 10 cm_mulched(b)
15 May
14 May
13 May
12 May
11 May
10 May
9 May
8 May
7 May
6 May
5 May
4 May
3 May
2 May
1 May
30 April
29 April
28 April
27 April
26 April
25 April
24 April
23 April
(d)
(c) T 20 cm_non-mulched T 20 cm_mulched
Date (day/month)
15 May
14 May
13 May
12 May
11 May
10 May
9 May
8 May
7 May
6 May
5 May
4 May
3 May
2 May
1 May
30 April
29 April
28 April
27 April
26 April
25 April
24 April
23 April
T 5 cm_non-mulched T 5 cm_mulched
Rn a
nd
EC
(Wm
2)
A
Rn H LE
15 May
14 May
13 May
12 May
11 May
10 May
9 May
8 May
7 May
6 May
5 May
4 May
3 May
2 May
1 May
30 April
29 April
28 April
27 April
26 April
25 April
24 April
23 April
290 292 294 296 298 300 302292
294
296
298
300
302
304
290 292 294 296 298
292
293
294
295
296
297
298
290 291 292 293 294 295292
293
294
295
296
00:00-9:00
10:00-23:00
T_
mu
lche
d (
K)
T_non-mulched (K)
5 cm(a)
n = 24
00:00-9:00
10:00-23:00
T_non-mulched (K)
(b)
n = 24
10 cm
00:00-9:00
10:00-23:00
T_non-mulched (K)
(c)
n = 24
20 cm
Figure 5. Scatter plot of soil temperature at (a) 5 cm, (b) 10 cm and (c) 20 cm in non-mulched soil versusin mulched soil during the 3-year mean 24-hour period at the Korla site from 2013–2015. The numberof data points is 24.
3.2. The Effect of Mulch on Surface Soil Heat Flux
3.2.1. Damped Diurnal Variation of Surface Soil Heat Flux beneath Mulch
The hourly surface soil heat fluxes over non-mulched and mulched soil were calculated by theTDEC method during the growth periods (23 April–18 September) in 2013–2015. To show the evolutionof G0 over the growing season, variations of the 3-year average of hourly G0 from April–September areshown in Figure 6. Not only the positive G0 (daytime), but also the negative G0 (nighttime) in mulchedsoil are smaller than in non-mulched soil. The sign represents the heat flux direction; the positive G0
represents heat flows from the surface to deeper soil; and the negative is opposite. The G0 values inmulched soil decrease obviously in late June. The slope of regression between G0 in non-mulchedsoil and mulched soil during the growing season (from 16 May–18 September) is 0.52, smaller thanthe value of 0.72 in the seedling emergence period (Figure 7), because the cotton grows, and thedense canopy attenuates solar radiation entering into the soil. Furthermore, drip irrigation createshigher soil moisture, and the soil temperature beneath the mulch varies slowly, bringing about lowG0. However, G0 in non-mulched soil increases about on 21 June, 4 July and 14 July. That is becausethe soil temperature varies largely in these days, which determines the G0 value. There is no dripirrigation in these days, and soil moisture is small. Furthermore, Rn usually reaches the maximum inJuly, later than the solar radiation.
Atmosphere 2016, 7, 107 7 of 16
versus in mulched soil during the 3-year mean 24-hour period at the Korla site from 2013–2015. The
number of data points is 24.
3.2. The Effect of Mulch on Surface Soil Heat Flux
3.2.1. Damped Diurnal Variation of Surface Soil Heat Flux beneath Mulch
The hourly surface soil heat fluxes over non-mulched and mulched soil were calculated by the
TDEC method during the growth periods (23 April–18 September) in 2013–2015. To show the
evolution of G0 over the growing season, variations of the 3-year average of hourly G0 from
April–September are shown in Figure 6. Not only the positive G0 (daytime), but also the negative G0
(nighttime) in mulched soil are smaller than in non-mulched soil. The sign represents the heat flux
direction; the positive G0 represents heat flows from the surface to deeper soil; and the negative is
opposite. The G0 values in mulched soil decrease obviously in late June. The slope of regression
between G0 in non-mulched soil and mulched soil during the growing season (from
16 May–18 September) is 0.52, smaller than the value of 0.72 in the seedling emergence period
(Figure 7), because the cotton grows, and the dense canopy attenuates solar radiation entering into
the soil. Furthermore, drip irrigation creates higher soil moisture, and the soil temperature beneath
the mulch varies slowly, bringing about low G0. However, G0 in non-mulched soil increases about on
21 June, 4 July and 14 July. That is because the soil temperature varies largely in these days, which
determines the G0 value. There is no drip irrigation in these days, and soil moisture is small.
Furthermore, Rn usually reaches the maximum in July, later than the solar radiation.
Figure 6. The variations of the 3-year mean hourly G0 over mulched and non-mulched soil from
23 April 2013–18 September 2015; the vertical dashed line is at 15 May.
Figure 7. Scatter plot of the 3-year mean hourly G0 in non-mulched soil versus in mulched soil during
(a) 23 April–15 May and (b) 16 May–18 September at the Korla site in 2013–2015. The number of data
points is 552 and 3024, respectively.
The 3-year mean diurnal variation of G0 in the seedling emergence period (23 April–15 May), the
blooming and bolling period (1 July–31 August) and the growing season (April–September) were
-150
-100
-50
0
50
100
150
200
250
18 September
11 September
3 September
25 August
17 August
9 August
31 July23 July
15 July6 July
28 June
20 June
11 June3 June
26 May
17 May
9 May
1 May
Su
rface
so
il he
at
flux (
Wm
2)
Date (day/month)
G0_non-mulched
G0_mulched
23 April
-100 -50 0 50 100 150 200
-100
-50
0
50
100
150
200
-150 -100 -50 0 50 100 150 200 250
-150
-100
-50
0
50
100
150
200
250
hourly G0
regression line
------- 1:1 line
G0_
mulc
he
d (
Wm
2)
G0_non-mulched (Wm
2)
y = 0.72x + 4.21
R2 = 0.94
23 April 15 May(a)
n = 552
hourly G0
regression line
------- 1:1 line
(b)
G0_
mu
lche
d (
W m
-2)
G0_non-mulched (Wm
2)
y = 0.52x + 1.47
R2 = 0.82
16 May 18 September
n = 3024
Figure 6. The variations of the 3-year mean hourly G0 over mulched and non-mulched soil from23 April 2013–18 September 2015; the vertical dashed line is at 15 May.

Atmosphere 2016, 7, 107 8 of 16
Atmosphere 2016, 7, 107 7 of 16
versus in mulched soil during the 3-year mean 24-hour period at the Korla site from 2013–2015. The
number of data points is 24.
3.2. The Effect of Mulch on Surface Soil Heat Flux
3.2.1. Damped Diurnal Variation of Surface Soil Heat Flux beneath Mulch
The hourly surface soil heat fluxes over non-mulched and mulched soil were calculated by the
TDEC method during the growth periods (23 April–18 September) in 2013–2015. To show the
evolution of G0 over the growing season, variations of the 3-year average of hourly G0 from
April–September are shown in Figure 6. Not only the positive G0 (daytime), but also the negative G0
(nighttime) in mulched soil are smaller than in non-mulched soil. The sign represents the heat flux
direction; the positive G0 represents heat flows from the surface to deeper soil; and the negative is
opposite. The G0 values in mulched soil decrease obviously in late June. The slope of regression
between G0 in non-mulched soil and mulched soil during the growing season (from
16 May–18 September) is 0.52, smaller than the value of 0.72 in the seedling emergence period
(Figure 7), because the cotton grows, and the dense canopy attenuates solar radiation entering into
the soil. Furthermore, drip irrigation creates higher soil moisture, and the soil temperature beneath
the mulch varies slowly, bringing about low G0. However, G0 in non-mulched soil increases about on
21 June, 4 July and 14 July. That is because the soil temperature varies largely in these days, which
determines the G0 value. There is no drip irrigation in these days, and soil moisture is small.
Furthermore, Rn usually reaches the maximum in July, later than the solar radiation.
Figure 6. The variations of the 3-year mean hourly G0 over mulched and non-mulched soil from
23 April 2013–18 September 2015; the vertical dashed line is at 15 May.
Figure 7. Scatter plot of the 3-year mean hourly G0 in non-mulched soil versus in mulched soil during
(a) 23 April–15 May and (b) 16 May–18 September at the Korla site in 2013–2015. The number of data
points is 552 and 3024, respectively.
The 3-year mean diurnal variation of G0 in the seedling emergence period (23 April–15 May), the
blooming and bolling period (1 July–31 August) and the growing season (April–September) were
-150
-100
-50
0
50
100
150
200
250
18 September
11 September
3 September
25 August
17 August
9 August
31 July23 July
15 July6 July
28 June
20 June
11 June3 June
26 May
17 May
9 May
1 May
Su
rface
so
il he
at
flux (
Wm
2)
Date (day/month)
G0_non-mulched
G0_mulched
23 April
-100 -50 0 50 100 150 200
-100
-50
0
50
100
150
200
-150 -100 -50 0 50 100 150 200 250
-150
-100
-50
0
50
100
150
200
250
hourly G0
regression line
------- 1:1 line
G0_m
ulc
hed (
Wm
2)
G0_non-mulched (Wm
2)
y = 0.72x + 4.21
R2 = 0.94
23 April 15 May(a)
n = 552
hourly G0
regression line
------- 1:1 line
(b)
G0_
mu
lche
d (
W m
-2)
G0_non-mulched (Wm
2)
y = 0.52x + 1.47
R2 = 0.82
16 May 18 September
n = 3024
Figure 7. Scatter plot of the 3-year mean hourly G0 in non-mulched soil versus in mulched soil during(a) 23 April–15 May and (b) 16 May–18 September at the Korla site in 2013–2015. The number of datapoints is 552 and 3024, respectively.
The 3-year mean diurnal variation of G0 in the seedling emergence period (23 April–15 May),the blooming and bolling period (1 July–31 August) and the growing season (April–September) werestudied separately. The G0 in mulched and non-mulched soil shows significant differences during a24-h period. Moreover, the absolute value of G0 in mulched soil is smaller than that in non-mulchedsoil in both day and night, with slopes of regression between G0 in non-mulched soil and mulchedsoil of 0.72, 0.40 and 0.55 in these three growing periods (Figure 8d,e,f). The plastic mulch not onlyweakens solar radiation into the soil during the day, but also hinders soil heat into the air duringthe night. In addition, the difference becomes large in the blooming and bolling periods (Figure 8b),owing to the aforementioned dense vegetation and drip irrigation in addition to the plastic mulcheffect. The daily maximum G0 in mulched soil is 106 W·m−2 in the seedling emergence period and47 W·m−2 in the blooming and bolling period. In addition, the time when heat transmission changesdirection (from negative to positive) in the morning in non-mulched and mulched soil is the same,approximately 9:00 a.m. (Figure 8a). However, the heat transmission in non-mulched soil changesearlier in the afternoon than that in mulched soil, around 18:30 and 19:30, respectively (Figure 8b).The plastic mulch delays the change of direction in heat flow in the afternoon.
Atmosphere 2016, 7, 107 8 of 16
studied separately. The G0 in mulched and non-mulched soil shows significant differences during a
24-hour period. Moreover, the absolute value of G0 in mulched soil is smaller than that in non-
mulched soil in both day and night, with slopes of regression between G0 in non-mulched soil and
mulched soil of 0.72, 0.40 and 0.55 in these three growing periods (Figure 8d,e,f). The plastic mulch
not only weakens solar radiation into the soil during the day, but also hinders soil heat into the air
during the night. In addition, the difference becomes large in the blooming and bolling periods
(Figure 8b), owing to the aforementioned dense vegetation and drip irrigation in addition to the
plastic mulch effect. The daily maximum G0 in mulched soil is 106 Wm−2 in the seedling emergence
period and 47 Wm−2 in the blooming and bolling period. In addition, the time when heat transmission
changes direction (from negative to positive) in the morning in non-mulched and mulched soil is the
same, approximately 9:00 a.m. (Figure 8a). However, the heat transmission in non-mulched soil
changes earlier in the afternoon than that in mulched soil, around 18:30 and 19:30, respectively
(Figure 8b). The plastic mulch delays the change of direction in heat flow in the afternoon.
Figure 8. The 3-year mean diurnal variations of G0 in mulched and non-mulched soil from
(a) 23 April–15 May, (b) 1 July–31 August and (c) 23 April–18 September; (d–f) scatterplots of the
mean diurnal G0 in non-mulched soil versus G0 in mulched soil in the three periods in 2013–2015.
According to the thermal conduction equation, G0 values are related to the variation of
temperature in the topsoil at adjacent hours. In the present study, the daily maximum soil
temperature observed in the topsoil minus the daily minimum value (5 cm in 2013 and 2015, 10 cm
in 2014) represents the time variation of soil temperature, which controls G0 values. The 3-year
averages of the daily amplitude (maximum minus minimum) of the observed soil temperature in
mulched and non-mulched zones during April–September are shown in Figure 9. The variations of
the amplitudes of soil temperature are consistent with G0 variations. The amplitude of temperature in non-
mulched soil is larger than that in mulched soil from April–September. The biggest difference between
the amplitudes of temperature in non-mulched and mulched soil appears at the beginning of July, in
agreement with G0 variation, which is caused by solar energy, dense vegetation and drip irrigation.
Although the plastic mulch increases soil temperature, the amplitude of soil temperature
beneath the mulch is smaller than that in non-mulched soil in the seedling emergence period
(Figure 9), which leads to smaller G0. It follows that the plastic mulch keeps soil temperature stable.
00:0003:00
06:0009:00
12:0015:00
18:0021:00
24:00
-100
-50
0
50
100
150
00:0003:00
06:0009:00
12:0015:00
18:0021:00
24:00
-100
-50
0
50
100
150
00:0003:00
06:0009:00
12:0015:00
18:0021:00
24:00
-100
-50
0
50
100
150
-100 -50 0 50 100 150-100
-50
0
50
100
150
-100 -50 0 50 100 150-100
-50
0
50
100
150
-100 -50 0 50 100 150-100
-50
0
50
100
150
Diu
rnal surf
ace s
oil
heat flux (
Wm
2)
23 April 15 May
(a)
1 July 31 August
1 July 31 August
(b)
23 April 18 September
23 April 18 September
G0_non-mulched
G0_mulched
(c)
regression line
------- 1:1 line
(d)
G0_
mu
lch
ed
(Wm
2)
G0_non-mulched (Wm
2)
y = 0.72x + 4.2
R2 = 0.95
23 April 15 May
n = 24
(e)
G0_non-mulched (Wm
2)
y = 0.40x + 0.78
R2 = 0.95
regression line
------- 1:1 line
n = 24
G0_non-mulched (Wm
2)
y = 0.55x + 2.09
R2 = 0.97
(f)
regression line
------- 1:1 line
n = 24
Figure 8. The 3-year mean diurnal variations of G0 in mulched and non-mulched soil from(a) 23 April–15 May; (b) 1 July–31 August and (c) 23 April–18 September; (d–f) scatterplots of the meandiurnal G0 in non-mulched soil versus G0 in mulched soil in the three periods in 2013–2015.

Atmosphere 2016, 7, 107 9 of 16
According to the thermal conduction equation, G0 values are related to the variation oftemperature in the topsoil at adjacent hours. In the present study, the daily maximum soil temperatureobserved in the topsoil minus the daily minimum value (5 cm in 2013 and 2015, 10 cm in 2014)represents the time variation of soil temperature, which controls G0 values. The 3-year averages ofthe daily amplitude (maximum minus minimum) of the observed soil temperature in mulched andnon-mulched zones during April–September are shown in Figure 9. The variations of the amplitudesof soil temperature are consistent with G0 variations. The amplitude of temperature in non-mulchedsoil is larger than that in mulched soil from April–September. The biggest difference between theamplitudes of temperature in non-mulched and mulched soil appears at the beginning of July, inagreement with G0 variation, which is caused by solar energy, dense vegetation and drip irrigation.Atmosphere 2016, 7, 107 9 of 16
Figure 9. Variations of the 3-year mean daily amplitude of observed soil temperature
(5 cm in 2013 and 2015, 10 cm in 2014) over mulched and non-mulched zone from April–September;
the vertical dashed line is 15 May.
3.2.2. Similar Daily Variation of G0
The solar energy absorbed by the soil is not always equal to the released energy, which depends
on the underlying surface and seasons. Thus, the daily G0 (net energy entering the soil) is not always
equal to zero [2]. Since the hourly G0 beneath the mulch is much smaller than that in non-mulched
soil both in day and night, what about the daily values? The daily G0 in mulched and non-mulched
soil are similar, and both monotonically decrease from April–September (Figure 10), changing from
positive to negative values. It shows that the soil absorbs energy in the spring and releases energy in
the autumn. The G0 values are positive before July, alternately positive and negative from July to
early August and almost negative starting from early August. The energy absorbed by the soil
beneath the mulch and by bare soil between two mulch zones is larger than the released energy from
April–June, which makes for positive G0, and is opposite from early August–September. The
maximum G0 beneath the mulch was 20.5 Wm−2 on 7 May, and the minimum is −14 Wm−2 over bare
soil on 8 July.
Figure 10. The 3-year mean daily G0 over mulched and non-mulched soil from 23 April–18 September
at the Korla site in 2013–2015.
Compared to the hourly G0 in non-mulched soil and that of mulched soil with a slope of 0.72
(Figure 7a), the daily G0 are nearly same, with a slope of 1.07 in the seeding and germination period
(Figure 11a). Although n = 23 in Figure 11a and the p-value is 5.88 10−12 < 0.05, they are significantly
correlated at a confidence level of 0.05. It shows that the effect of mulch on G0 is diminished with
increasing time scale and that mulch has a great impact on diurnal G0. However, the daily G0 in non-
2
4
6
8
10
12
14
16
30 August
20 August
10 August31 July
21 July11 July
1 July21 June
11 June1 June
22 May12 May
2 May
9 September
18 September
Tm
axT
min (
K)
Date (day/month)
non-mulched
mulched
23 April
-20
-15
-10
-5
0
5
10
15
20
25
20 September
4 September
20 August
4 August
20 July4 July
19 June
3 June
19 May
3 May
Daily
surf
ace s
oil
heat flux (
Wm
2)
Date (day/month)
non-mulched mulched
linear fit of daily G0_mulched
linear fit of daily G0_non-mulched
y = -0.11x + 11.63
R2 = 0.47
y = -0.1x + 9.7
R2 = 0.37
18 April
Figure 9. Variations of the 3-year mean daily amplitude of observed soil temperature (5 cm in 2013 and2015, 10 cm in 2014) over mulched and non-mulched zone from April–September; the vertical dashedline is 15 May.
Although the plastic mulch increases soil temperature, the amplitude of soil temperature beneaththe mulch is smaller than that in non-mulched soil in the seedling emergence period (Figure 9), whichleads to smaller G0. It follows that the plastic mulch keeps soil temperature stable.
3.2.2. Similar Daily Variation of G0
The solar energy absorbed by the soil is not always equal to the released energy, which dependson the underlying surface and seasons. Thus, the daily G0 (net energy entering the soil) is not alwaysequal to zero [2]. Since the hourly G0 beneath the mulch is much smaller than that in non-mulched soilboth in day and night, what about the daily values? The daily G0 in mulched and non-mulched soil aresimilar, and both monotonically decrease from April–September (Figure 10), changing from positive tonegative values. It shows that the soil absorbs energy in the spring and releases energy in the autumn.The G0 values are positive before July, alternately positive and negative from July to early August andalmost negative starting from early August. The energy absorbed by the soil beneath the mulch and bybare soil between two mulch zones is larger than the released energy from April–June, which makesfor positive G0, and is opposite from early August–September. The maximum G0 beneath the mulchwas 20.5 W·m−2 on 7 May, and the minimum is −14 W·m−2 over bare soil on 8 July.
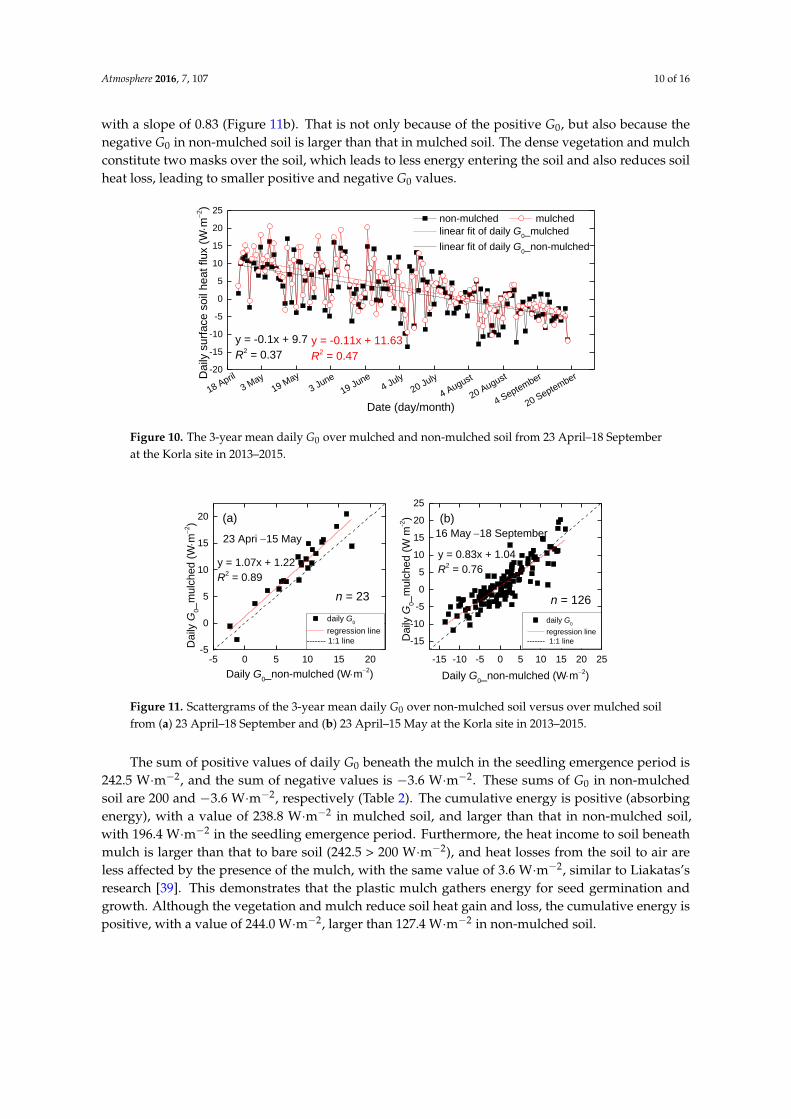
Compared to the hourly G0 in non-mulched soil and that of mulched soil with a slope of 0.72(Figure 7a), the daily G0 are nearly same, with a slope of 1.07 in the seeding and germination period(Figure 11a). Although n = 23 in Figure 11a and the p-value is 5.88 × 10⁻¹² < 0.05, they are significantlycorrelated at a confidence level of 0.05. It shows that the effect of mulch on G0 is diminished withincreasing time scale and that mulch has a great impact on diurnal G0. However, the daily G0 innon-mulched soil is larger than that in mulched soil from May–September when the cotton grows,
Atmosphere 2016, 7, 107 10 of 16
with a slope of 0.83 (Figure 11b). That is not only because of the positive G0, but also because thenegative G0 in non-mulched soil is larger than that in mulched soil. The dense vegetation and mulchconstitute two masks over the soil, which leads to less energy entering the soil and also reduces soilheat loss, leading to smaller positive and negative G0 values.
Atmosphere 2016, 7, 107 9 of 16
Figure 9. Variations of the 3-year mean daily amplitude of observed soil temperature
(5 cm in 2013 and 2015, 10 cm in 2014) over mulched and non-mulched zone from April–September;
the vertical dashed line is 15 May.
3.2.2. Similar Daily Variation of G0
The solar energy absorbed by the soil is not always equal to the released energy, which depends
on the underlying surface and seasons. Thus, the daily G0 (net energy entering the soil) is not always
equal to zero [2]. Since the hourly G0 beneath the mulch is much smaller than that in non-mulched
soil both in day and night, what about the daily values? The daily G0 in mulched and non-mulched
soil are similar, and both monotonically decrease from April–September (Figure 10), changing from
positive to negative values. It shows that the soil absorbs energy in the spring and releases energy in
the autumn. The G0 values are positive before July, alternately positive and negative from July to
early August and almost negative starting from early August. The energy absorbed by the soil
beneath the mulch and by bare soil between two mulch zones is larger than the released energy from
April–June, which makes for positive G0, and is opposite from early August–September. The
maximum G0 beneath the mulch was 20.5 Wm−2 on 7 May, and the minimum is −14 Wm−2 over bare
soil on 8 July.
Figure 10. The 3-year mean daily G0 over mulched and non-mulched soil from 23 April–18 September
at the Korla site in 2013–2015.
Compared to the hourly G0 in non-mulched soil and that of mulched soil with a slope of 0.72
(Figure 7a), the daily G0 are nearly same, with a slope of 1.07 in the seeding and germination period
(Figure 11a). Although n = 23 in Figure 11a and the p-value is 5.88 10−12 < 0.05, they are significantly
correlated at a confidence level of 0.05. It shows that the effect of mulch on G0 is diminished with
increasing time scale and that mulch has a great impact on diurnal G0. However, the daily G0 in non-
2
4
6
8
10
12
14
16
30 August
20 August
10 August31 July
21 July11 July
1 July21 June
11 June1 June
22 May12 May
2 May
9 September
18 September
Tm
axT
min (
K)
Date (day/month)
non-mulched
mulched
23 April
-20
-15
-10
-5
0
5
10
15
20
25
20 September
4 September
20 August
4 August
20 July4 July
19 June
3 June
19 May
3 May
D
aily
surf
ace s
oil
heat flux (
Wm
2)
Date (day/month)
non-mulched mulched
linear fit of daily G0_mulched
linear fit of daily G0_non-mulched
y = -0.11x + 11.63
R2 = 0.47
y = -0.1x + 9.7
R2 = 0.37
18 April
Figure 10. The 3-year mean daily G0 over mulched and non-mulched soil from 23 April–18 Septemberat the Korla site in 2013–2015.
Atmosphere 2016, 7, 107 10 of 16
mulched soil is larger than that in mulched soil from May–September when the cotton grows, with a
slope of 0.83 (Figure 11b). That is not only because of the positive G0, but also because the negative
G0 in non-mulched soil is larger than that in mulched soil. The dense vegetation and mulch constitute
two masks over the soil, which leads to less energy entering the soil and also reduces soil heat loss,
leading to smaller positive and negative G0 values.
Figure 11. Scattergrams of the 3-year mean daily G0 over non-mulched soil versus over mulched soil
from (a) 23 April–18 September and (b) 23 April–15 May at the Korla site in 2013–2015.
The sum of positive values of daily G0 beneath the mulch in the seedling emergence period is
242.5 Wm−2, and the sum of negative values is −3.6 Wm−2. These sums of G0 in non-mulched soil are
200 and −3.6 Wm−2, respectively (Table 2). The cumulative energy is positive (absorbing energy), with
a value of 238.8 Wm−2 in mulched soil, and larger than that in non-mulched soil, with
196.4 Wm−2 in the seedling emergence period. Furthermore, the heat income to soil beneath mulch is
larger than that to bare soil (242.5 > 200 Wm−2), and heat losses from the soil to air are less affected
by the presence of the mulch, with the same value of 3.6 Wm−2, similar to Liakatas’s research [39].
This demonstrates that the plastic mulch gathers energy for seed germination and growth. Although
the vegetation and mulch reduce soil heat gain and loss, the cumulative energy is positive, with a
value of 244.0 Wm−2, larger than 127.4 Wm−2 in non-mulched soil.
Table 2. The sum of positive, negative and all 3-year mean daily G0 values over non-mulched and
mulched soil from 23 April–15 May and from 16 May–18 September at the Korla site in 2013–2015.
Non-mulched Beneath mulch Non-mulched Beneath mulch
23 April–15 May (W m–2) 16 May–18 September (W m–2)
Sum of positive 200.0 242.5 409.0 446.5
Sum of negative −3.6 −3.6 −281.7 −202.5
Sum 196.4 238.8 127.4 244.0
3.3. The Effect of Mulch on Energy Balance
3.3.1. Smaller Net Radiation beneath Mulch
In addition to atmospheric long-wave radiation, the mulch also contributes downward long-
wave radiation to the net radiation of the soil beneath the mulch. The hourly mulch temperature and
surface soil temperature beneath the mulch (8:00–20:00) were measured using an infrared
thermometer (FLUKE Inc., USA) for seven days (27–30 April and 3–5 May) in 2016. Ten data points
per hour were measured for mulch and the soil beneath mulch. The average of the 10 data points was
adopted as the final hourly mulch and soil temperatures. The mulch temperature is nearly the same
as the soil temperature beneath mulch (Figure 12a) with a slope of regression between mulch
temperature and soil temperature of 0.96 (Figure 12b), which is consistent with Liakatas’s study [39].
-5 0 5 10 15 20-5
0
5
10
15
20
-15 -10 -5 0 5 10 15 20 25
-15
-10
-5
0
5
10
15
20
25
daily G0
regression line
------- 1:1 line
Daily
G0_m
ulc
hed (
Wm
2)
Daily G0_non-mulched (Wm
2)
y = 1.07x + 1.22
R2 = 0.89
(a)
23 Apri 15 May
n = 23
daily G0
regression line
------- 1:1 line
Daily
G0_m
ulc
hed (
W m
-2)
Daily G0_non-mulched (Wm
2)
y = 0.83x + 1.04
R2 = 0.76
(b)
16 May18 September
n = 126
Figure 11. Scattergrams of the 3-year mean daily G0 over non-mulched soil versus over mulched soilfrom (a) 23 April–18 September and (b) 23 April–15 May at the Korla site in 2013–2015.
The sum of positive values of daily G0 beneath the mulch in the seedling emergence period is242.5 W·m−2, and the sum of negative values is −3.6 W·m−2. These sums of G0 in non-mulchedsoil are 200 and −3.6 W·m−2, respectively (Table 2). The cumulative energy is positive (absorbingenergy), with a value of 238.8 W·m−2 in mulched soil, and larger than that in non-mulched soil,with 196.4 W·m−2 in the seedling emergence period. Furthermore, the heat income to soil beneathmulch is larger than that to bare soil (242.5 > 200 W·m−2), and heat losses from the soil to air areless affected by the presence of the mulch, with the same value of 3.6 W·m−2, similar to Liakatas’sresearch [39]. This demonstrates that the plastic mulch gathers energy for seed germination andgrowth. Although the vegetation and mulch reduce soil heat gain and loss, the cumulative energy ispositive, with a value of 244.0 W·m−2, larger than 127.4 W·m−2 in non-mulched soil.

Atmosphere 2016, 7, 107 11 of 16
Table 2. The sum of positive, negative and all 3-year mean daily G0 values over non-mulched andmulched soil from 23 April–15 May and from 16 May–18 September at the Korla site in 2013–2015.
Non-mulched Beneath Mulch Non-mulched Beneath Mulch
23 April–15 May (W·m–2) 16 May–18 September (W·m–2)
Sum of positive 200.0 242.5 409.0 446.5Sum of negative −3.6 −3.6 −281.7 −202.5
Sum 196.4 238.8 127.4 244.0
3.3. The Effect of Mulch on Energy Balance
3.3.1. Smaller Net Radiation beneath Mulch
In addition to atmospheric long-wave radiation, the mulch also contributes downward long-waveradiation to the net radiation of the soil beneath the mulch. The hourly mulch temperature andsurface soil temperature beneath the mulch (8:00–20:00) were measured using an infrared thermometer(FLUKE Inc., Everett, WA, USA) for seven days (27–30 April and 3–5 May) in 2016. Ten data pointsper hour were measured for mulch and the soil beneath mulch. The average of the 10 data pointswas adopted as the final hourly mulch and soil temperatures. The mulch temperature is nearly thesame as the soil temperature beneath mulch (Figure 12a) with a slope of regression between mulchtemperature and soil temperature of 0.96 (Figure 12b), which is consistent with Liakatas’s study [39].Atmosphere 2016, 7, 107 11 of 16
Figure 12. The seven-day mean hourly mulch and soil temperature beneath the mulch observed by
an infrared thermometer. (a) Variation of temperature from 8:00–20:00, (b) mulch temperature vs. soil
temperature beneath the mulch at the Korla site in 2016.
The 3-year mean hourly net radiation in mulched soil is smaller than that in non-mulched bare
soil (Figure 13a), in agreement with other results, such as those of [39–41]. The slope of regression
between Rn in non-mulched and mulched soil is 0.80, and the determination coefficient is 0.99
(Figure 14a). Primarily because the net solar radiation is reduced by 16% while the net long-wave
radiation is approximately equal (Figure 13b). The slopes of regression between net solar radiation in
non-mulched soil and that in mulched soil and between net long-wave radiation in non-mulched soil
and that in mulched soil are 0.84 and 1.03, respectively (Figure 14b,c). The humid air held below the
mulch, which can absorb the downward long-wave radiation penetrating through mulch and
upward long-wave radiation emitted by the soil beneath the mulch, will contribute to Rn and SEB.
Nevertheless, the humid air is not included in the present study, as the mulch is close to the ground
and the space is very small.
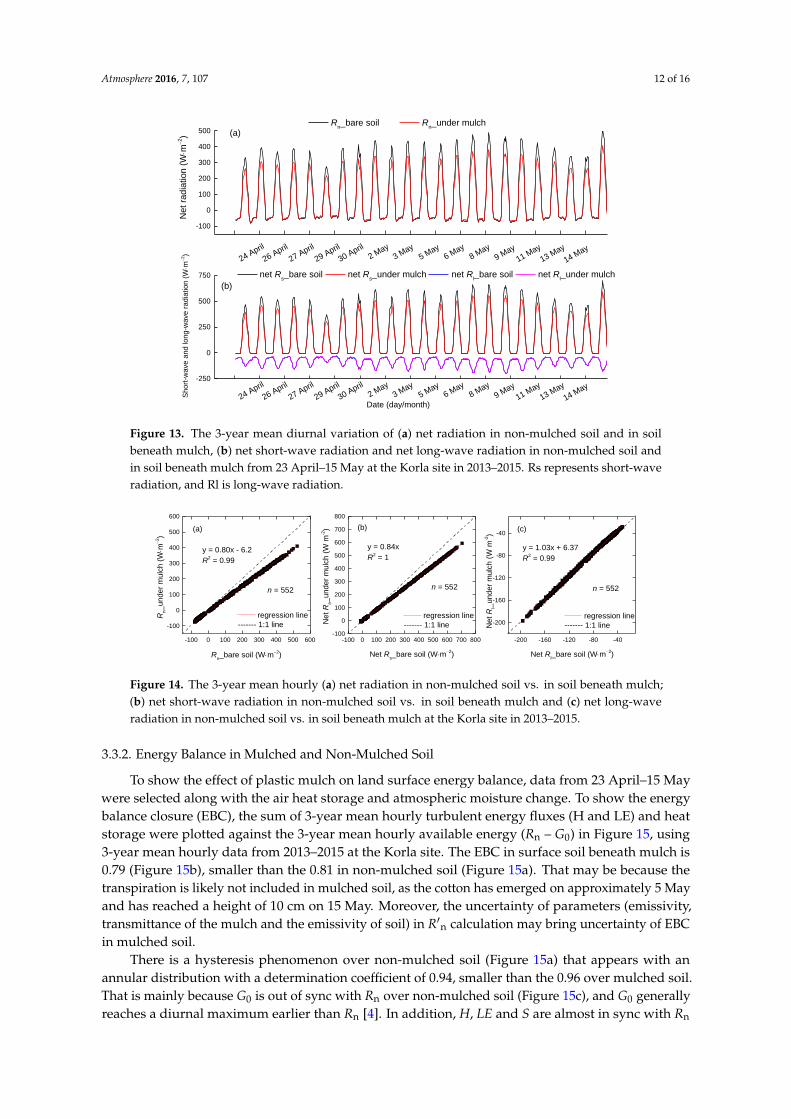
Figure 13. The 3-year mean diurnal variation of (a) net radiation in non-mulched soil and in soil
beneath mulch, (b) net short-wave radiation and net long-wave radiation in non-mulched soil and in
soil beneath mulch from 23 April–15 May at the Korla site in 2013–2015. Rs represents short-wave
radiation, and Rl is long-wave radiation.
08:00 10:00 12:00 14:00 16:00 18:00 20:0010
15
20
25
30
35
40
15 20 25 30 35 40
15
20
25
30
35
40
Tem
pe
ratu
re (℃
)
Time
Mulch temperature
Soil surface temperature under mulch
(a)
So
il su
rfa
ce t
em
pe
ratu
re u
nd
er
mu
lch (℃
)
Mulch temperature(℃)
y = 0.96x + 1.95
R2 = 0.99
(b)
n = 13
-100
0
100
200
300
400
500
-250
0
250
500
750
14 May
13 May
11 May
9 May
8 May
6 May
5 May
3 May
2 May
30 April
29 April
27 April
26 April
Ne
t ra
dia
tion
(Wm
2)
Rn_bare soil R
n_under mulch
(a)
(b)
24 April
Short
-wave a
nd long-w
ave r
adia
tion (
Wm
2)
Date (day/month)
net Rs_bare soil net R
s_under mulch net R
l_bare soil net R
l_under mulch
14 May
13 May
11 May
9 May
8 May
6 May
5 May
3 May
2 May
30 April
29 April
27 April
26 April
24 April
Figure 12. The seven-day mean hourly mulch and soil temperature beneath the mulch observed by aninfrared thermometer. (a) Variation of temperature from 8:00–20:00, (b) mulch temperature vs. soiltemperature beneath the mulch at the Korla site in 2016.
The 3-year mean hourly net radiation in mulched soil is smaller than that in non-mulched bare soil(Figure 13a), in agreement with other results, such as those of [39–41]. The slope of regression betweenRn in non-mulched and mulched soil is 0.80, and the determination coefficient is 0.99 (Figure 14a).Primarily because the net solar radiation is reduced by 16% while the net long-wave radiation isapproximately equal (Figure 13b). The slopes of regression between net solar radiation in non-mulchedsoil and that in mulched soil and between net long-wave radiation in non-mulched soil and that inmulched soil are 0.84 and 1.03, respectively (Figure 14b,c). The humid air held below the mulch, whichcan absorb the downward long-wave radiation penetrating through mulch and upward long-waveradiation emitted by the soil beneath the mulch, will contribute to R′n and SEB. Nevertheless, thehumid air is not included in the present study, as the mulch is close to the ground and the space isvery small.
Atmosphere 2016, 7, 107 12 of 16
Atmosphere 2016, 7, 107 11 of 16
Figure 12. The seven-day mean hourly mulch and soil temperature beneath the mulch observed by
an infrared thermometer. (a) Variation of temperature from 8:00–20:00, (b) mulch temperature vs. soil
temperature beneath the mulch at the Korla site in 2016.
The 3-year mean hourly net radiation in mulched soil is smaller than that in non-mulched bare
soil (Figure 13a), in agreement with other results, such as those of [39–41]. The slope of regression
between Rn in non-mulched and mulched soil is 0.80, and the determination coefficient is 0.99
(Figure 14a). Primarily because the net solar radiation is reduced by 16% while the net long-wave
radiation is approximately equal (Figure 13b). The slopes of regression between net solar radiation in
non-mulched soil and that in mulched soil and between net long-wave radiation in non-mulched soil
and that in mulched soil are 0.84 and 1.03, respectively (Figure 14b,c). The humid air held below the
mulch, which can absorb the downward long-wave radiation penetrating through mulch and
upward long-wave radiation emitted by the soil beneath the mulch, will contribute to Rn and SEB.
Nevertheless, the humid air is not included in the present study, as the mulch is close to the ground
and the space is very small.
Figure 13. The 3-year mean diurnal variation of (a) net radiation in non-mulched soil and in soil
beneath mulch, (b) net short-wave radiation and net long-wave radiation in non-mulched soil and in
soil beneath mulch from 23 April–15 May at the Korla site in 2013–2015. Rs represents short-wave
radiation, and Rl is long-wave radiation.
08:00 10:00 12:00 14:00 16:00 18:00 20:0010
15
20
25
30
35
40
15 20 25 30 35 40
15
20
25
30
35
40
Tem
pe
ratu
re (℃
)
Time
Mulch temperature
Soil surface temperature under mulch
(a)
So
il su
rfa
ce t
em
pe
ratu
re u
nd
er
mu
lch (℃
)
Mulch temperature(℃)
y = 0.96x + 1.95
R2 = 0.99
(b)
n = 13
-100
0
100
200
300
400
500
-250
0
250
500
750
14 May
13 May
11 May
9 May
8 May
6 May
5 May
3 May
2 May
30 April
29 April
27 April
26 April
Ne
t ra
dia
tion
(Wm
2)
Rn_bare soil R
n_under mulch
(a)
(b)
24 April
Short
-wave a
nd long-w
ave r
adia
tion (
Wm
2)
Date (day/month)
net Rs_bare soil net R
s_under mulch net R
l_bare soil net R
l_under mulch
14 May
13 May
11 May
9 May
8 May
6 May
5 May
3 May
2 May
30 April
29 April
27 April
26 April
24 April
Figure 13. The 3-year mean diurnal variation of (a) net radiation in non-mulched soil and in soilbeneath mulch, (b) net short-wave radiation and net long-wave radiation in non-mulched soil andin soil beneath mulch from 23 April–15 May at the Korla site in 2013–2015. Rs represents short-waveradiation, and Rl is long-wave radiation.Atmosphere 2016, 7, 107 12 of 16
Figure 14. The 3-year mean hourly (a) net radiation in non-mulched soil vs. in soil beneath mulch, (b)
net short-wave radiation in non-mulched soil vs. in soil beneath mulch and (c) net long-wave
radiation in non-mulched soil vs. in soil beneath mulch at the Korla site in 2013–2015.
3.3.2. Energy Balance in Mulched and Non-Mulched Soil
To show the effect of plastic mulch on land surface energy balance, data from 23 April–15 May
were selected along with the air heat storage and atmospheric moisture change. To show the energy
balance closure (EBC), the sum of 3-year mean hourly turbulent energy fluxes (H and LE) and heat
storage were plotted against the 3-year mean hourly available energy (Rn – G0) in Figure 15, using 3-
year mean hourly data from 2013–2015 at the Korla site. The EBC in surface soil beneath mulch is 0.79
(Figure 15b), smaller than the 0.81 in non-mulched soil (Figure 15a). That may be because the
transpiration is likely not included in mulched soil, as the cotton has emerged on approximately
5 May and has reached a height of 10 cm on 15 May. Moreover, the uncertainty of parameters
(emissivity, transmittance of the mulch and the emissivity of soil) in R’n calculation may bring
uncertainty of EBC in mulched soil.
Figure 15. Scatterplot of the 3-year mean hourly (a) available energy (Rn – G0) vs. (H + LE + S) in non-
mulched soil and (b) (R’n – G0) vs. (H + S) in mulched soil at the Korla site from April–May in 2013–
2015. The 3-year mean 24-hour Rn vs. G0 (c) in non-mulched and (d) in mulched soil. H and LE are the
sensible and latent heat flux measured by EC, and S is the sum of air heat storage and atmospheric
moisture change calculated by Equation (8) and Equation (9). R’n is net radiation in mulched soil.
There is a hysteresis phenomenon over non-mulched soil (Figure 15a) that appears with an
annular distribution with a determination coefficient of 0.94, smaller than the 0.96 over mulched soil.
-100 0 100 200 300 400 500 600
-100
0
100
200
300
400
500
600
-100 0 100 200 300 400 500 600 700 800-100
0
100
200
300
400
500
600
700
800
-200 -160 -120 -80 -40
-200
-160
-120
-80
-40
regression line
------- 1:1 line
Rn_
un
de
r m
ulc
h (
Wm
2)
Rn_bare soil (Wm
2)
y = 0.80x - 6.2
R2 = 0.99
(a)
n = 552
regression line
------- 1:1 line
n = 552
Ne
t R
s_
un
de
r m
ulc
h (
W m
-2)
Net Rs_bare soil (Wm
2)
y = 0.84x
R2 = 1
(b)
regression line
------- 1:1 line
n = 552
Ne
t R
l_un
de
r m
ulc
h (
W m
-2)
Net Rl_bare soil (Wm
2)
y = 1.03x + 6.37
R2 = 0.99
(c)
-50 0 50 100 150 200 250 300 350 400
-50
0
50
100
150
200
250
300
350
400
-50 0 50 100 150 200 250 300
-50
0
50
100
150
200
250
300
H +
LE
+ S
(Wm
2)
RnG
0 (Wm
2)
y = 0.81x - 7.84
R2 = 0.94
(a) non-mulched
n = 552n = 552
H +
S (
W m
-2)
R'nG
0 (Wm
2)
y = 0.79x - 11.14
R2 = 0.96
(b) mulched
-100 0 100 200 300 400-100
-50
0
50
100
150
-50 0 50 100 150 200 250 300 350-60
-30
0
30
60
90
120
00:00 — 12:00
13:00 — 23:00
G0 (
Wm
2)
Rn (Wm
2)
non-mulched(c)
n = 24
00:00 — 12:00
13:00 — 23:00
G0 (
Wm
2)
R'n (Wm
2)
mulched(d)
n = 24
Figure 14. The 3-year mean hourly (a) net radiation in non-mulched soil vs. in soil beneath mulch;(b) net short-wave radiation in non-mulched soil vs. in soil beneath mulch and (c) net long-waveradiation in non-mulched soil vs. in soil beneath mulch at the Korla site in 2013–2015.
3.3.2. Energy Balance in Mulched and Non-Mulched Soil
To show the effect of plastic mulch on land surface energy balance, data from 23 April–15 Maywere selected along with the air heat storage and atmospheric moisture change. To show the energybalance closure (EBC), the sum of 3-year mean hourly turbulent energy fluxes (H and LE) and heatstorage were plotted against the 3-year mean hourly available energy (Rn – G0) in Figure 15, using3-year mean hourly data from 2013–2015 at the Korla site. The EBC in surface soil beneath mulch is0.79 (Figure 15b), smaller than the 0.81 in non-mulched soil (Figure 15a). That may be because thetranspiration is likely not included in mulched soil, as the cotton has emerged on approximately 5 Mayand has reached a height of 10 cm on 15 May. Moreover, the uncertainty of parameters (emissivity,transmittance of the mulch and the emissivity of soil) in R′n calculation may bring uncertainty of EBCin mulched soil.
There is a hysteresis phenomenon over non-mulched soil (Figure 15a) that appears with anannular distribution with a determination coefficient of 0.94, smaller than the 0.96 over mulched soil.That is mainly because G0 is out of sync with Rn over non-mulched soil (Figure 15c), and G0 generallyreaches a diurnal maximum earlier than Rn [4]. In addition, H, LE and S are almost in sync with Rn

Atmosphere 2016, 7, 107 13 of 16
during the 24-hour period. The available energy is out of sync with turbulent fluxes over non-mulchedsoil. However, G0 is more in sync with R′n in mulched soil (Figure 15d), as the soil temperature inmulched soil delays, which leads to the hysteresis over G0. That leads to the available energy being insync with the sum of turbulent energy fluxes and heat storage over mulched soil.
Atmosphere 2016, 7, 107 12 of 16
Figure 14. The 3-year mean hourly (a) net radiation in non-mulched soil vs. in soil beneath mulch, (b)
net short-wave radiation in non-mulched soil vs. in soil beneath mulch and (c) net long-wave
radiation in non-mulched soil vs. in soil beneath mulch at the Korla site in 2013–2015.
3.3.2. Energy Balance in Mulched and Non-Mulched Soil
To show the effect of plastic mulch on land surface energy balance, data from 23 April–15 May
were selected along with the air heat storage and atmospheric moisture change. To show the energy
balance closure (EBC), the sum of 3-year mean hourly turbulent energy fluxes (H and LE) and heat
storage were plotted against the 3-year mean hourly available energy (Rn – G0) in Figure 15, using 3-
year mean hourly data from 2013–2015 at the Korla site. The EBC in surface soil beneath mulch is 0.79
(Figure 15b), smaller than the 0.81 in non-mulched soil (Figure 15a). That may be because the
transpiration is likely not included in mulched soil, as the cotton has emerged on approximately
5 May and has reached a height of 10 cm on 15 May. Moreover, the uncertainty of parameters
(emissivity, transmittance of the mulch and the emissivity of soil) in R’n calculation may bring
uncertainty of EBC in mulched soil.
Figure 15. Scatterplot of the 3-year mean hourly (a) available energy (Rn – G0) vs. (H + LE + S) in non-
mulched soil and (b) (R’n – G0) vs. (H + S) in mulched soil at the Korla site from April–May in 2013–
2015. The 3-year mean 24-hour Rn vs. G0 (c) in non-mulched and (d) in mulched soil. H and LE are the
sensible and latent heat flux measured by EC, and S is the sum of air heat storage and atmospheric
moisture change calculated by Equation (8) and Equation (9). R’n is net radiation in mulched soil.
There is a hysteresis phenomenon over non-mulched soil (Figure 15a) that appears with an
annular distribution with a determination coefficient of 0.94, smaller than the 0.96 over mulched soil.
-100 0 100 200 300 400 500 600
-100
0
100
200
300
400
500
600
-100 0 100 200 300 400 500 600 700 800-100
0
100
200
300
400
500
600
700
800
-200 -160 -120 -80 -40
-200
-160
-120
-80
-40
regression line
------- 1:1 line
Rn_
un
de
r m
ulc
h (
Wm
2)
Rn_bare soil (Wm
2)
y = 0.80x - 6.2
R2 = 0.99
(a)
n = 552
regression line
------- 1:1 line
n = 552
Ne
t R
s_
un
de
r m
ulc
h (
W m
-2)
Net Rs_bare soil (Wm
2)
y = 0.84x
R2 = 1
(b)
regression line
------- 1:1 line
n = 552
Ne
t R
l_un
de
r m
ulc
h (
W m
-2)
Net Rl_bare soil (Wm
2)
y = 1.03x + 6.37
R2 = 0.99
(c)
-50 0 50 100 150 200 250 300 350 400
-50
0
50
100
150
200
250
300
350
400
-50 0 50 100 150 200 250 300
-50
0
50
100
150
200
250
300
H +
LE
+ S
(Wm
2)
RnG
0 (Wm
2)
y = 0.81x - 7.84
R2 = 0.94
(a) non-mulched
n = 552n = 552
H +
S (
W m
-2)
R'nG
0 (Wm
2)
y = 0.79x - 11.14
R2 = 0.96
(b) mulched
-100 0 100 200 300 400-100
-50
0
50
100
150
-50 0 50 100 150 200 250 300 350-60
-30
0
30
60
90
120
00:00 — 12:00
13:00 — 23:00
G0 (
Wm
2)
Rn (Wm
2)
non-mulched(c)
n = 24
00:00 — 12:00
13:00 — 23:00
G0 (
Wm
2)
R'n (Wm
2)
mulched(d)
n = 24
Figure 15. Scatterplot of the 3-year mean hourly (a) available energy (Rn – G0) vs. (H + LE + S) innon-mulched soil and (b) (R′n – G0) vs. (H + S) in mulched soil at the Korla site from April–May in2013–2015. The 3-year mean 24-hour Rn vs. G0 (c) in non-mulched and (d) in mulched soil. H andLE are the sensible and latent heat flux measured by EC, and S is the sum of air heat storage andatmospheric moisture change calculated by Equation (8) and Equation (9). R′n is net radiation inmulched soil.
4. Conclusions
Plastic mulch has been widely used in agriculture in Northwest China because it can not onlypromote soil temperature, but can also reduce water loss from the soil surface, which is beneficialto seed germination. In addition, the mulch also modifies the thermal microclimate of the soil.Nevertheless, few studies address its effect on the soil microclimate and energy balance. This studyfocused on how the mulch affects G0 and SEB. However, the climate parameters’ change (e.g., airtemperature, wind, precipitation, convection cloud, etc.) caused by changed G0 and SEB in mulchedsoil is not included in the present study. In this study, the hourly surface soil heat flux was calculatedfrom April–September in 2013–2015 using a heat conduction equation based on soil temperature andmoisture measurements in mulched and non-mulched soil at the Korla experimental site planted withcotton in the Xinjiang Uygur Autonomous Region. The variations of G0 at different time scales wereanalyzed. In addition to the surface net radiation beneath mulch, the energy balance in mulched andnon-mulched soil were also discussed. The main conclusions obtained from the investigation aresummarized as follows:
The 3-year mean hourly G0 in mulched soil is smaller than that in non-mulched soil both day andnight from April–September. The plastic mulch not only prevents solar radiation into the soil in thedaytime, but also reduces soil heat loss at night. The hourly G0 over mulched soil decreases obviouslyin late June, as solar energy is blocked by the grown cotton and because the drip irrigation increasessoil moisture, making soil temperature vary slowly and bringing about low G0. Moreover, the mulchdelays the moment when heat flow changes direction in the afternoon.

Atmosphere 2016, 7, 107 14 of 16
Although the hourly G0 are largely different, the 3-year mean daily G0 in non-mulched andmulched soil are similar, with a slope of regression of 1.07 in the seeding and germination period.This shows that mulch has a great impact on instantaneous G0 and less impact on G0 at a daily timescale. During the whole growing season, the daily G0 decreases monotonically. G0 values are positivebefore July and almost negative starting from early August, which indicates that soil absorbs energyin spring and releases energy in autumn. The sum of positive values of daily G0 in mulched soil is242.5 W·m−2, larger than 200 W·m−2 in non-mulched soil in the seeding and germination period.The sum of negative G0 over mulched and non-mulched soil is the same, −3.6 W·m−2. Thus, themulch cumulates more energy into the soil than bare soil.
The surface net radiation beneath the mulch is 0.88 times that over non-mulched soil as less solarradiation enters into the soil through the mulch, while the net long-wave radiation is almost the sameas that over non-mulched soil.
The EBC in mulched soil is smaller than that over non-mulched soil, 0.79 versus 0.81, basedon 3-year mean hourly Rn, G0, H, LE, air heat storage and atmospheric moisture changes. LE is notincluded in mulched soil, which may lead to smaller EBC. The uncertainty of R’n coming from theuncertainty of parameters may also affect EBC in mulched soil. A hysteresis phenomenon appearsin non-mulched soil between H + LE + S and Rn – G0, as G0 is out of sync with Rn. However, thereis no hysteresis in mulched soil. That is mainly because the soil temperature delays in mulched soiland leads to G0 delays, which makes G0 is sync with R′n. The average EBC is approximately 0.8 in thepresent study, which is reasonable and consistent with the study of Wilson et al. (2002) [42]. The 20%imbalance may be due to the accuracies of Rn, G0, the mismatch between the turbulent flux footprintand other components of the energy balance, or the absence of advection.
Acknowledgments: This study was supported by NSFC (Natural Science Foundation of China) (51190092) andKey Lab (2016-KY-03).
Author Contributions: The study was carried out in collaboration between all authors. Nana Li and Fuqiang Tiandesigned the experiment. Nana Li performed the experiment and wrote the manuscript. Hongchang Hu andHui Lu revised the manuscript. Guanghui Ming checked the experimental data. All authors agreed to thesubmission of the manuscript.
Conflicts of Interest: The authors declare no conflict of interest.
Abbreviations
The following abbreviations are used in this manuscript:
Rn net radiation for bare soil (non-mulched)R′n net radiation for soil beneath mulchG0 surface soil heat fluxLE latent heat fluxL latent heat of vaporizationH sensible heat fluxρscs soil volumetric heat capacityρsolidcsolid volumetric heat capacity of the soil solidsρwcw volumetric heat capacity of liquid waterρaca air volumetric heat capacityθsat soil porosityθ soil water contentT (z,t) soil temperature at depth z and time tT (z0) soil temperature at surfaceTs soil temperature at surface, same as T (z0)T′s surface soil temperature beneath the mulchTm mulch temperatureTa air temperatureS solar radiationR↑L upward long-wave radiation flux
R↓L downward long-wave radiation flux

Atmosphere 2016, 7, 107 15 of 16
εs land surface emissivityεm mulch emissivityσ Stefan–Boltzmann constantrs surface soil reflectivityτm1 transmittance of mulch for solar radiationτm2 transmittance of mulch for thermal radiationq moist air densityh the height of the ECSc canopy heat storage in the biomassSp photosynthesis fluxSa air storageSq atmospheric moisture changeSd canopy dew enthalpy change
References
1. Baldocchi, D.D.; Vogel, C.A.; Hall, B. Seasonal variation of carbon dioxide exchange rates above and below aboreal jack pine forest. Agric. For. Meteorol. 1997, 83, 147–170. [CrossRef]
2. Li, N.; Jiang, L. Temporal variations in the surface soil heat flux over maize and grass surfaces in NorthwestChina. Soil Sci. Soc. Am. J. 2015, 79, 1084–1093. [CrossRef]
3. Zuo, J.; Wang, J.; Huang, J.; Li, W.; Wang, G.; Ren, H. Estimation of ground heat flux and its impact on thesurface energy budget for a semi-arid grassland. Sci. Cold Arid. Reg. 2011, 3, 41–50.
4. Li, N.; Jia, L.; Lu, J. An improved algorithm to estimate the surface soil heat flux over a heterogeneoussurface: A case study in the heihe river basin. Sci. China Earth Sci. 2015, 58, 1169–1181. [CrossRef]
5. Katul, G.G.; Oren, R.; Manzoni, S.; Higgins, C.; Parlange, M.B. Evapotranspiration: A process drivingmass transport and energy exchange in the soil-plant-atmosphere-climate system. Rev. Geophys. 2012, 50.[CrossRef]
6. Allen, R.G.; Tasumi, M.; Trezza, R. Satellite-based energy balance for mapping evapotranspiration withinternalized calibration (metric)—model. J. Irrig. Drain. Eng. 2007, 133, 380–394. [CrossRef]
7. Bastiaanssen, W.; Menenti, M.; Feddes, R.; Holtslag, A. A remote sensing surface energy balance algorithmfor land (Sebal). 1. Formulation. J. Hydrol. 1998, 212, 198–212. [CrossRef]
8. Idso, S.B.; Aase, J.K.; Jackson, R.D. Net radiation—Soil heat flux relations as influenced by soil water contentvariations. Bound.-Layer Meteorol. 1975, 9, 113–122. [CrossRef]
9. Clothier, B.E.; Clawson, K.L.; Pinter, P.J., Jr.; Moran, M.S.; Reginato, R.J.; Jackson, R.D. Estimation of soil heatflux from net radiation during the growth of alfalfa. Agric. For. Meteorol. 1986, 37, 319–329. [CrossRef]
10. Kustas, W.P.; Daughtry, C.S.T. Estimation of the soil heat flux/net radiation ratio from spectral data.Agric. For. Meteorol. 1990, 49, 205–223. [CrossRef]
11. Kustas, W.P.; Daughtry, C.S.T.; Van Oevelen, P.J. Analytical treatment of the relationships between soil heatflux/net radiation ratio and vegetation indices. Remote Sens. Environ. 1993, 46, 319–330. [CrossRef]
12. Gao, Z.Q. Determination of soil heat flux in a tibetan short-grass prairie. Bound.-Layer Meteorol. 2005, 114,165–178. [CrossRef]
13. Gentine, P.; Entekhabi, D.; Heusinkveld, B. Systematic errors in ground heat flux estimation and theircorrection. Water Resour. Res. 2012, 48. [CrossRef]
14. Cammalleri, C.; La Loggia, G.; Maltese, A. Critical analysis of empirical ground heat flux equations on acereal field using micrometeorological data. Proc. SPIE 7472 2009. [CrossRef]
15. Liebethal, C.; Huwe, B.; Foken, T. Sensitivity analysis for two ground heat flux calculation approaches.Agric. For. Meteorol. 2005, 132, 253–262. [CrossRef]
16. Stull, R.B. Boundary layer clouds. In An Introduction to Boundary Layer Meteorology; Stull, R.B., Ed.; SpringerNetherlands: Dordrecht, The Netherlands, 1988; pp. 545–585.
17. Sridhar, V. Tracking the influence of irrigation on land surface fluxes and boundary layer climatology.J. Contemp. Water Res. Educ. 2013, 152, 79–93. [CrossRef]
18. Case, J.L.; Crosson, W.L.; Kumar, S.V.; Lapenta, W.M.; Peters-Lidard, C.D. Impacts of high-resolution landsurface initialization on regional sensible weather forecasts from the WRF model. J. Hydrometeorol. 2008, 9,1249–1266. [CrossRef]

Atmosphere 2016, 7, 107 16 of 16
19. Dirmeyer, P.A.; Koster, R.D.; Guo, Z. Do global models properly represent the feedback between land andatmosphere? J. Hydrometeorol. 2006, 7, 1177–1198. [CrossRef]
20. Kala, J.; Lyons, T.; Nair, U. Numerical simulations of the impacts of land-cover change on cold fronts inSouth-West Western Australia. Bound.-Layer Meteorol. 2011, 138, 121–138. [CrossRef]
21. Fu, C. Potential impacts of human-induced land cover change on east Asia monsoon. Glob. Planet. Chang.2003, 37, 219–229. [CrossRef]
22. Pielke, R.A. Land use and climate change. Science 2005, 310, 1625–1626. [CrossRef] [PubMed]23. Wang, R.; Kang, Y.; Wan, S.; Hu, W.; Liu, S.; Liu, S. Salt distribution and the growth of cotton under different
drip irrigation regimes in a saline area. Agric. Water Manag. 2011, 100, 58–69. [CrossRef]24. Zhang, Z.; Tian, F.; Hu, H.; Yang, P. A comparison of methods for determining field evapotranspiration:
Photosynthesis system, sap flow, and eddy covariance. Hydrol. Earth Syst. Sci. 2014, 18, 1053–1072. [CrossRef]25. Katan, J. Solar heating (solarization) of soil for control of soilborne pests. Annu. Rev. Phytopathol. 1981, 19,
211–236. [CrossRef]26. Bonachela, S.; Orgaz, F.; Villalobos, F.J.; Fereres, E. Soil evaporation from drip-irrigated olive orchards.
Irrig. Sci. 2001, 20, 65–71. [CrossRef]27. Hou, X.-Y.; Wang, F.-X.; Han, J.-J.; Kang, S.-Z.; Feng, S.-Y. Duration of plastic mulch for potato growth under
drip irrigation in an arid region of Northwest china. Agric. For. Meteorol. 2010, 150, 115–121. [CrossRef]28. Li, S.; Kang, S.; Li, F.; Zhang, L. Evapotranspiration and crop coefficient of spring maize with plastic mulch
using eddy covariance in Northwest china. Agric. Water Manag. 2008, 95, 1214–1222. [CrossRef]29. Ramakrishna, A.; Tam, H.M.; Wani, S.P.; Long, T.D. Effect of mulch on soil temperature, moisture, weed
infestation and yield of groundnut in Northern Vietnam. Field Crops Res. 2006, 95, 115–125. [CrossRef]30. Zhang, Z.; Tian, F.; Zhong, R.; Hu, H. Spatial and temporal pattern of soil temperature in cotton field under
mulched drip irrigation condition in Xinjiang. Trans. CSAE 2011, 27, 44–51.31. Zhang, Z.; Hu, H.; Tian, F.; Hu, H.; Yao, X.; Zhong, R. Soil salt distribution under mulched drip irrigation in
an arid area of Northwestern China. J. Arid Environ. 2014, 104, 23–33. [CrossRef]32. Hu, H.; Tian, F.; Hu, H. Soil particle size distribution and its relationship with soil water and salt under
mulched drip irrigation in Xinjiang of China. Sci. China: Technol. Sci. 2011, 54, 1568–1574. [CrossRef]33. Heusinkveld, B.G.; Jacobs, A.F.G.; Holtslag, A.A.M.; Berkowicz, S.M. Surface energy balance closure in an
arid region: Role of soil heat flux. Agric. For. Meteorol. 2004, 122, 21–37. [CrossRef]34. Meyers, T.P.; Hollinger, S.E. An assessment of storage terms in the surface energy balance of maize and
soybean. Agric. For. Meteorol. 2004, 125, 105–115. [CrossRef]35. Jacobs, A.G.; Heusinkveld, B.; Holtslag, A.M. Towards closing the surface energy budget of a mid-latitude
grassland. Bound.-Layer Meteorol. 2008, 126, 125–136. [CrossRef]36. Yang, K.; Wang, J. A temperature prediction-correction method for estimating surface soil heat flux from soil
temperature and moisture data. Sci. China Ser. D-Earth Sci. 2008, 51, 721–729. [CrossRef]37. Tarara, J.M. Microclimate modification with plastic mulch. HortScience 2000, 35, 169–180.38. Xu, Z.; Liu, S.; Xu, T.; Ding, C. The observation and calculation method of soil heat flux and its impact on the
energy balance closure. Adv. Earth Sci. 2013, 28, 875–889.39. Liakatas, A.; Clark, J.; Monteith, J. Measurements of the heat balance under plastic mulches. Part I. Radiation
balance and soil heat flux. Agric. For. Meteorol. 1986, 36, 227–239. [CrossRef]40. Chung, S.O.; Horton, R. Soil heat and water flow with a partial surface mulch. Water Resour. Res. 1987, 23,
2175–2186. [CrossRef]41. Hares, M.A.; Novak, M.D. Simulation of surface energy balance and soil temperature under strip tillage: II.
Field test. Soil Sci. Soc. Am. J. 1992, 56, 29–36. [CrossRef]42. Wilson, K.; Goldstein, A.; Falge, E.; Aubinet, M.; Baldocchi, D.; Berbigier, P.; Bernhofer, C.; Ceulemans, R.;
Dolman, H.; Field, C.; et al. Energy balance closure at fluxnet sites. Agric. For. Meteorol. 2002, 113, 223–243.[CrossRef]
© 2016 by the authors; licensee MDPI, Basel, Switzerland. This article is an open accessarticle distributed under the terms and conditions of the Creative Commons Attribution(CC-BY) license (http://creativecommons.org/licenses/by/4.0/).


