
Int J Advanced Design and Manufacturing Technology, Vol. 7/ No. 3/ September - 2014 19
© 2014 IAU, Majlesi Branch
Effects of Scan Direction and
Orientation on Mechanical
Properties of Laser Sintered
Polyamide-12 J.A. Nelson, G. Galloway, A. E. W. Rennie* & T. N. Abram Department of Mechanical Engineering,
Lancaster University, Lancaster, UK
E-mail: [email protected]
*Corresponding author
G. R. Bennett CRDM Ltd, 3D Systems Europe,
High Wycombe, UK
E-mail: [email protected]
Received: 5 June 2014, Revised: 12 August 2014, Accepted: 20 August 2014
Abstract: In order to understand the impact of layer-wise scanning direction in the Selective Laser Sintering process, test coupons were manufactured for mechanical testing from DuraForm™ Polyamide powder. The effects of laser energy density, varying between 0.003 and 0.024 J/mm2 were examined in test specimens rotated 90º through the Z axis. SLS machines do not always facilitate „cross-hatching‟ of layers and therefore orientation has a major influence on part quality. When employed, the cross-hatching technique scans successive layers perpendicularly to the previous. Studying how parts perform with scan lines in a common direction, will assist in the understanding of how SLS parts behave in practice. Results showed that physical density, tensile strength and elongation rose with energy density up to 0.012 J/mm². This initial rise was due to a continued improvement in particle fusion with increasing energy density. Above 0.012 J/mm², these properties started to decline at different rates depending on their orientation (scan direction) on the part bed. Specimen‟s oriented perpendicularly to the X axis exhibited a greater elongation at the expense of tensile strength, when compared to parallel specimens.
Keywords: Energy Density, Selective Laser Sintering, Orientation, Scan Direction
Reference: Nelson, J. A., Galloway, G., Rennie, A. E. W., Abram, T. N. and Bennett, G. R., “Effects of Scan Direction and Orientation on Mechanical Properties of Laser Sintered Polyamide-12”, Int J of Advanced Design and Manufacturing Technology, Vol. 7/ No. 3, 2014, pp. 19-25.
Biography: J. A. Nelson and G. Galloway are graduates of Lancaster University
with MEng in Mechanical Engineering, sharing interest in additive manufacturing.
Since graduating, Nelson and Galloway have commenced employment at Jaguar
Land Rover Ltd and BAE Systems Maritime Ltd, respectively. A. E. W. Rennie is
Head of the Lancaster Product Development Unit (LPDU) and has been an active
researcher in the field of additive manufacture since 1995, with a grant portfolio of
nearly £10M since 2002. T. Abram is a Senior Project Engineer and part-time
PhD researcher, having research in additive manufacturing in the automotive and
special purpose vehicles sector. G. Bennett has been a great enthusiast of additive
manufacturing technology since 1995, when he established the Centre for Rapid
Design and Manufacture (CRDM Ltd), now part of 3D Systems, and has worked
on collaborative projects across many industrial sectors using a variety of additive
manufacturing techniques.

20 Int J Advanced Design and Manufacturing Technology, Vol. 7/ No. 3/ September– 2014
© 2014 IAU, Majlesi Branch
1 INTRODUCTION
Selective Laser Sintering (SLS) is an additive
manufacturing (AM) process which is growing to be
one of the most advanced and promising manufacturing
methods. The premise of building a complex part with
relative ease from powdered material is an attractive
idea, and one which has the potential to revolutionise
the manufacturing industry. Currently, SLS is more
commonly associated with the production of prototype
components and parts. Together with computer aided
design/computer aided manufacture, AM permits the
creation of shaped 3D parts via layer-wise manufacture.
There are drawbacks that are preventing SLS elevating
from a prototyping tool to mainstream manufacture.
Currently, the process struggles to produce repeatable
dimensional and mechanical properties across the X, Y
and Z axes of the build volume. With a reduction in
deviation, forecasts could be made about the likely
properties of subsequent parts and assurances made in
regards to conformity to specified tolerances.
This paper considers an analysis of Polyamide 12 test
coupons produced on a DTM Sinterstation 2000 SLS
machine. This machine encompasses a circular build
envelope with a usable build diameter of 235mm. The
sintered parts vary due to sintering energy density and
orientation, with results summarised below in tabular
and graphical form to highlight an optimum energy
density and orientation. When altering part orientation,
a change in scan direction is also experienced; an
exaggerated representation of the laser scan path is
given in Fig. 1.
Fig. 1 Perpendicular (left) and parallel (right) scan lines
The material properties of a sintered part are not
exclusively related to the particular powdered material
used. Other influences arise during the manufacture of
the solid part. Bed temperature, laser power and fill
spacing also affect the part properties. Previous studies
have correlated physical properties of parts produced
through the SLS process and energy density. Ho et al.,
conclude that a higher energy density results in better
fusion of the polymer particles [3]. Caulfield et al., also
agree that the energy density has a significant effect on
the resulting material properties whilst commenting
that part orientation similarly has an influence [1]. Prior
research in the literature does not consider the effect
that scan direction has on the cross section or layers of
a part; the specimens built have scan lines that alternate
by 90º each layer, a technique known as cross-hatching.
Cross hatching removes linearity through part layers,
offsetting any porosity caused by the laser as well as
removing cumulative heat build-up. Fig. 2 shows how
the laser scan line direction alternates between layers.
Fig. 2 Exaggerated illustration of layered cross-hatching
Energy density is a measure of the amount of energy
supplied to the powder particles per unit area of the
powder bed surface [6], defined by Eq. (1).
(1)
Where laser power is measured in [W], scan speed in
[mm/s] and fill spacing in [mm]. The pre-set scan speed
used in this research is 7620 mm/s, as defined in the
DTM software configuration file. Others have
developed a revised method known as the energy melt
ratio (EMR), which also takes into account key
machine parameters [9].
2 PRECEDING ANALYSIS
Gibson and Shi showed substantial disparity for
different part orientation and part bed location within
the Sinterstation 2000 [2]. To isolate variation in part
properties, a modified BS-EN-ISO 527 test specimen
was produced. Fig. 3 shows the revised tensile test
specimen geometry which is shortened to limit the
deviation in production parameters across the part. This
amended geometry also permits placement closer to the
circumference of the circular extremities of the build
platform.
Int J Advanced Design and Manufacturing Technology, Vol. 7/ No. 3/ September - 2014 21
© 2014 IAU, Majlesi Branch
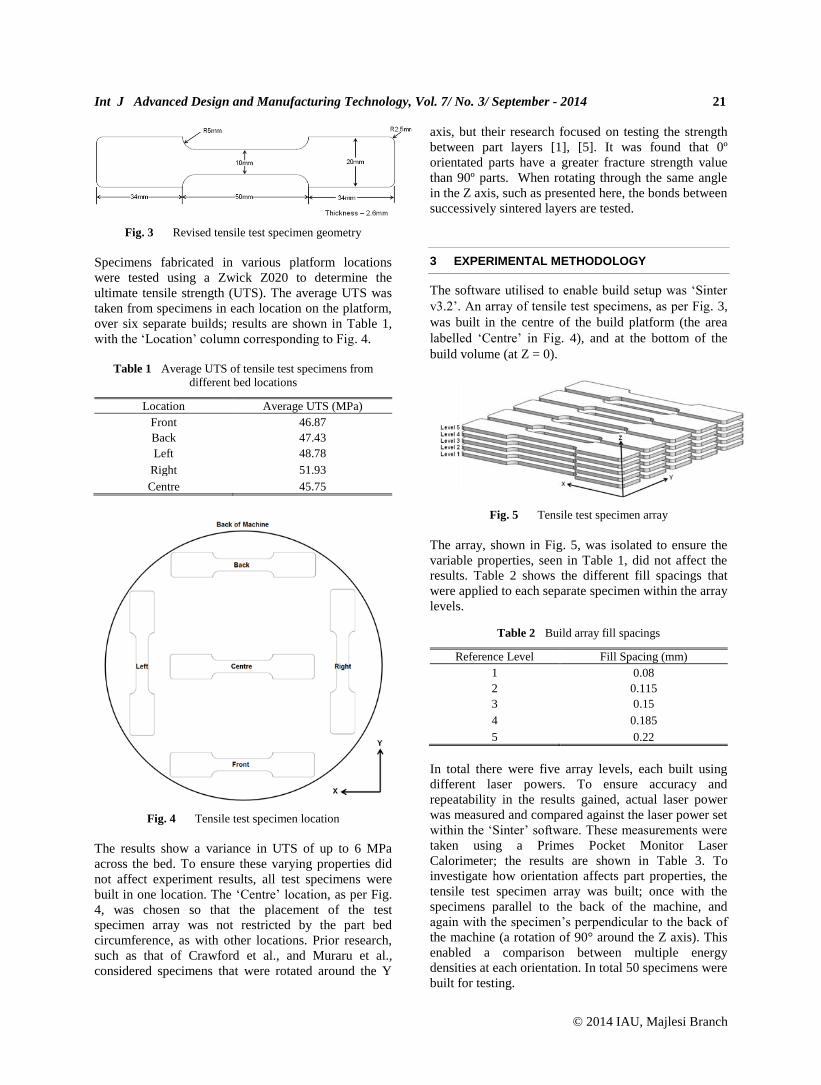
Fig. 3 Revised tensile test specimen geometry
Specimens fabricated in various platform locations
were tested using a Zwick Z020 to determine the
ultimate tensile strength (UTS). The average UTS was
taken from specimens in each location on the platform,
over six separate builds; results are shown in Table 1,
with the „Location‟ column corresponding to Fig. 4.
Table 1 Average UTS of tensile test specimens from
different bed locations
Location Average UTS (MPa)
Front 46.87
Back 47.43
Left 48.78
Right 51.93
Centre 45.75
Fig. 4 Tensile test specimen location
The results show a variance in UTS of up to 6 MPa
across the bed. To ensure these varying properties did
not affect experiment results, all test specimens were
built in one location. The „Centre‟ location, as per Fig.
4, was chosen so that the placement of the test
specimen array was not restricted by the part bed
circumference, as with other locations. Prior research,
such as that of Crawford et al., and Muraru et al.,
considered specimens that were rotated around the Y
axis, but their research focused on testing the strength
between part layers [1], [5]. It was found that 0º
orientated parts have a greater fracture strength value
than 90º parts. When rotating through the same angle
in the Z axis, such as presented here, the bonds between
successively sintered layers are tested.
3 EXPERIMENTAL METHODOLOGY
The software utilised to enable build setup was „Sinter
v3.2‟. An array of tensile test specimens, as per Fig. 3,
was built in the centre of the build platform (the area
labelled „Centre‟ in Fig. 4), and at the bottom of the
build volume (at Z = 0).
Fig. 5 Tensile test specimen array
The array, shown in Fig. 5, was isolated to ensure the
variable properties, seen in Table 1, did not affect the
results. Table 2 shows the different fill spacings that
were applied to each separate specimen within the array
levels.
Table 2 Build array fill spacings
Reference Level Fill Spacing (mm)
1 0.08
2 0.115
3 0.15
4 0.185
5 0.22
In total there were five array levels, each built using
different laser powers. To ensure accuracy and
repeatability in the results gained, actual laser power
was measured and compared against the laser power set
within the „Sinter‟ software. These measurements were
taken using a Primes Pocket Monitor Laser
Calorimeter; the results are shown in Table 3. To
investigate how orientation affects part properties, the
tensile test specimen array was built; once with the
specimens parallel to the back of the machine, and
again with the specimen‟s perpendicular to the back of
the machine (a rotation of 90° around the Z axis). This
enabled a comparison between multiple energy
densities at each orientation. In total 50 specimens were
built for testing.

22 Int J Advanced Design and Manufacturing Technology, Vol. 7/ No. 3/ September– 2014
© 2014 IAU, Majlesi Branch
Table 3 Array level laser power
Array
Level
Pre-set Laser
Power (W)
Measured Laser
Power (W)
1 5 4.8
2 7.5 6.93
3 10 9.39
4 12.5 11.36
5 15 13.67
4 RESULTS AND DISCUSSION
4.1. Density
To determine the density of each part, the volume and
mass must be known. The mass was measured using a
Precisa XT220A digital scale, accurate to four decimal
places. A suspension method was used to ensure
accurate measurement of volume. A 100mL measuring
cylinder containing water was weighed and then the
specimen suspended and fully submerged from the top.
The change of mass was recorded and then divided by
the density of water (1,000 kg/m3) to give the specimen
volume. Fig. 6 shows that part mass and volume
increase with laser power (energy density).
Fig. 6 Energy Density vs Volume and Mass
Fig. 7 Energy Density vs Density
The part mass increase could be caused by a larger melt
area associated with larger energy densities; larger
energy densities exhibit greater „sinking‟ during
sintering and therefore more powder is consequently
deposited during re-coating to fill in the void left. The
increase in part volume with energy density may be
explained by larger conduction through the powder,
fusing excess powder particles, resulting in additional
width and thickness (overgrowth). Perpendicular
specimens showed larger mass and volume properties
than those from the parallel setup; this is most likely
initiated by the short time between scan lines in the
narrow specimen‟s width. Part mass does not increase
at the same rate as the volume; therefore, when the
energy density exceeds 0.012 J/mm², the density (a
product of mass and volume) begins to decrease, as
shown in Fig. 7.
A potential cause is suggested by Ho et al., who
conducted a similar experiment using Laserite
Polycarbonate Compound LPC-3000 [3]. Once the
energy density reached a critical level, a decrease in
density was observed; it is believed that this was a
result of deterioration of the polymer chain within the
Polyamide-12 powder. This deterioration at higher
energy densities was also shown by Crawford et al.,
[1]. As the specimens from both Ho et al., and
Crawford et al., were orientated differently to the
specimens in this research, it is assumed that the
reduction in density is ultimately dependent on energy
density, not orientation [3], [1].
Fig. 8 Energy Density vs Ultimate Tensile Strength
4.2. Ultimate Tensile Strength
Specimen UTS and elongation tests were performed
using the Zwick Z020 mechanical testing apparatus.
The software provided by Zwick–TestXpert, was used
for the calculation of the tensile strength and elongation
at break for each part. At lower energy densities, the
tensile strength of parts was seen to increase with
energy density. Fig. 8 shows the tensile strength of
specimens against the energy density. Similarly to

Int J Advanced Design and Manufacturing Technology, Vol. 7/ No. 3/ September - 2014 23
© 2014 IAU, Majlesi Branch
density, the properties begin to decline after the energy
density reaches 0.012 J/mm².
The decrease in tensile strength is due to material
deterioration as a result of excessive energy supplied to
part during fabrication. This excessive energy not only
affects the surface that is in direct contact with the
laser, but also penetration to deeper sections within the
part. Caulfield et al., studied the surface morphology of
these „damaged‟ parts and found evidence of burnt
particles, which supports the assumption that increasing
the energy density past the critical point of 0.012 J/mm²
can have a detrimental effect on material properties [1].
Research undertaken by Vasquez et al., who developed
a stable sintering region using Thermogravimetric
analysis (TGA) showed that, with excessive amounts of
energy supplied to the powder bed, temperatures can
reach levels where mass loss is experienced, thus
weakening parts [11].
Fig. 9 Fill Spacing vs UTS for 5W and 15W Laser Power
Fig. 10 Energy Density vs Elongation
This decrease in material properties was more
prominent in perpendicularly orientated specimens.
This, once again, is caused by the short time between
scan lines leading to longer exposure to the higher
intensity laser compared to the parallel specimen. The
early increase in tensile strength is more directly linked
to fill spacing. Fig. 9 isolates the 5W and 15W laser
power results and plots the tensile strength against fill
spacing.
Fig. 9 shows a decrease in strength with a widening fill
spacing when the laser power is set to 5 Watts. This is
caused by insufficient power reaching parts of the
specimen during scanning. As the spacing narrows, the
part becomes stronger as the area affected by the laser
is increased. A contrasting pattern is found with the 15
Watt laser power. The higher laser power at narrow fill
spacings damage the neighboring Polyamide-12
particles. As the fill spacing increases, the damage
caused by the laser is reduced as the gap between scan
lines is widened and this in turn increases the tensile
strength.
4.3. Elongation
The average elongation at break was found to be
greater in perpendicular specimens, as shown in Fig.
10. This could be caused by the faster fusing of scan
lines. Referring back to Fig. 1, which shows an
exaggerated representation of the laser scan path, on
the parallel sample the laser must travel the full length
of the specimen before scanning the next line. This
allows the previously scanned line time to cool and
solidify. In contrast with the perpendicular specimen,
the laser is only traveling the width of the specimen;
this limits the cooling time between lines, resulting in
stronger scan line fusion. A stronger fusion increases
ductility as particle bonds are more difficult to break.
4.4. Other Influences
The research presented here did not consider other
potential influences on the specimens‟ mechanical
properties, such as powder lifecycle as discussed by
Pham et al., [7]. Pham et al. found that temperature and
time that the unsintered powder had previously been
exposed, influenced the sintered parts properties. As
parts were manufactured from the same powder
mixture, any variation caused by powder degradation
will be common across all samples. Part bed
temperature variation could also affect results. The
research presented attempted to isolate this, however
this cannot be completely achieved and therefore the
results could still be affected. A FLIR E40 thermal
imaging camera was used to determine the temperature
distribution across the part bed.
Fig. 11 indicates that there is a 7°C temperature
variation across the complete bed. As the specimens
were isolated to the centre of bed, this variation is
reduced to 4°C, as shown in Fig. 12. Tontowi et al.,
conclude that the effect of temperature variation is
negligible below approximately 4°C and therefore
should have little influence on results, but this cannot
be entirely guaranteed [10].

24 Int J Advanced Design and Manufacturing Technology, Vol. 7/ No. 3/ September– 2014
© 2014 IAU, Majlesi Branch
Fig. 11 Thermal image of part bed showing overall
temperature distribution
Fig. 12 Thermal image of part bed, showing temperature
distribution in area that tensile specimens were build
5 CONCLUSION
This study has revealed that energy density has an
effect on the mechanical properties of laser sintered
PA12 parts. Up until 0.012 J/mm2, an increase in
energy density has a positive effect on material density,
ultimate tensile strength and elongation. Once past this
critical point, mass and volume continue to increase
whilst density, ultimate tensile strength and elongation
begin to decrease. The early increase in mechanical
properties is due to the improving fusion of polymer
particles enabling a more compact structure to be built.
The decrease in properties is initiated by particle
damage not only to the current laser position, but due to
neighboring scan lines and layers.
It is shown that a change in scan direction brought
about by a 90° rotation affects the mechanical
properties of the laser sintered parts. Perpendicularly
orientated specimens had shorter time periods between
scan lines; this subjected the specimen to prolonged
laser power compared to the parallel specimens, due to
the part geometry. This resulted in perpendicular
specimens exhibiting greater ductility at higher energy
densities but at the expense of tensile strength. The
greater decrease in tensile strength in perpendicularly
oriented parts was likely caused by the short time
between scan lines leading to longer exposure to the
laser beam, which leads to material deterioration.
The optimum laser energy density range for the DTM
Sinterstation 2000 utilised in this research is between
0.008 J/mm2 and 0.012 J/mm
2. Below this range, there
is a greater likelihood of building weaker parts due to
improper fusion, and exceeding this range will
deteriorate polymer chains within the Polyamide-12
resulting in poorer mechanical properties.
REFERENCES
[1] Caulfield, B., McHugh, P. E. and Lohfeld, S., “Dependence of mechanical properties of polyamide components on build parameters in the SLS process”, Journal of Materials Processing Technology, Vol. 182, 2007, pp. 477-488.
[2] Gibson, I. Shi, D., “Material properties and fabrication parameters in selective laser sintering process”, Rapid Prototyping Journal, Vol. 3, No. 4, 1997, pp. 129-136.
[3] Ho, H. C., Gibson, I. and Cheung, W. L., “Effects of energy density on morphology and properties of selective laser sintered polycabonate”, Journal of Materials Processing Technology, Vol. 89-90, 1999, pp. 204-210.
[4] Leong, K. F. Chua, C. K., “Rapid Prototyping: Principles and Applications”, Volume 1. 3 ed. s.l.:World Scientific Publishing Company, 2010.
[5] Muraru, L., Pallari, J., Creylman, V., Vander Sloten, J. and Peeraer, L., “SLS nylon 12 characterization through tensile testing and digital image correlation for finite element modelling of foot and ankle-foot orthoses”, 21st Solid Freeform Fabrication Symposium, 2010, pp. 828-833, Austin, Texas, USA.
[6] Nelson, J. C., “Selective laser sintering: a definition of the process and an empirical sintering model”, PhD. Dissertation: University of Texas at Austin, Austin, Texas, USA, 1993.
[7] Pham, D. T., Dotchev, K. D. and Yusoff, W. A., “Deterioration of polyamide powder properties in the laser sintering process”, Proc. IMechE Part C: Journal of Mechanical Engineering Science. Vol. 222, 2008, pp.2163-2176.
[8] Singh, S., Sachdeva, A. and Sharma, V., “Investigation of dimensional accuracy/mechanical properties of part produced by SLS”, International Journal of Applied Science and Engineering, Vol. 10, No. 1, 2012, pp. 59-68.
[9] Starr, T., Gornet, T., Usher, J. and Schwerzer, C., “Laser sintering of PA-11 and PA-12 for direct digital

Int J Advanced Design and Manufacturing Technology, Vol. 7/ No. 3/ September - 2014 25
© 2014 IAU, Majlesi Branch
manufacture”, 20th Solid Freeform Symposium Symposium, Austin, Texas, USA, 2009.
[10] Tontowi, A. E. Childs, T. H. C., “Density predication of crystalline polymer sintered parts at various powder bed temperatures”, Rapid Prototyping Journal, Vol. 7, No. 3, 2001, pp. 180-184.
[11] Vasquez, M., Haworth, B. and Hopkinson, N., “Optimum sintering region for laser sintered nylon-12”, Journal of Engineering Manufacture, Vol. 225, 2011, pp. 2240-2248.


