
EFFECTS OF VESSEL EFFECTS OF VESSEL LENGTH AND DESIGN LENGTH AND DESIGN ON MOTIONS, SAFETY ON MOTIONS, SAFETY AND DOWNTIME.AND DOWNTIME.
DON BASS (MUN)DON BASS (MUN)
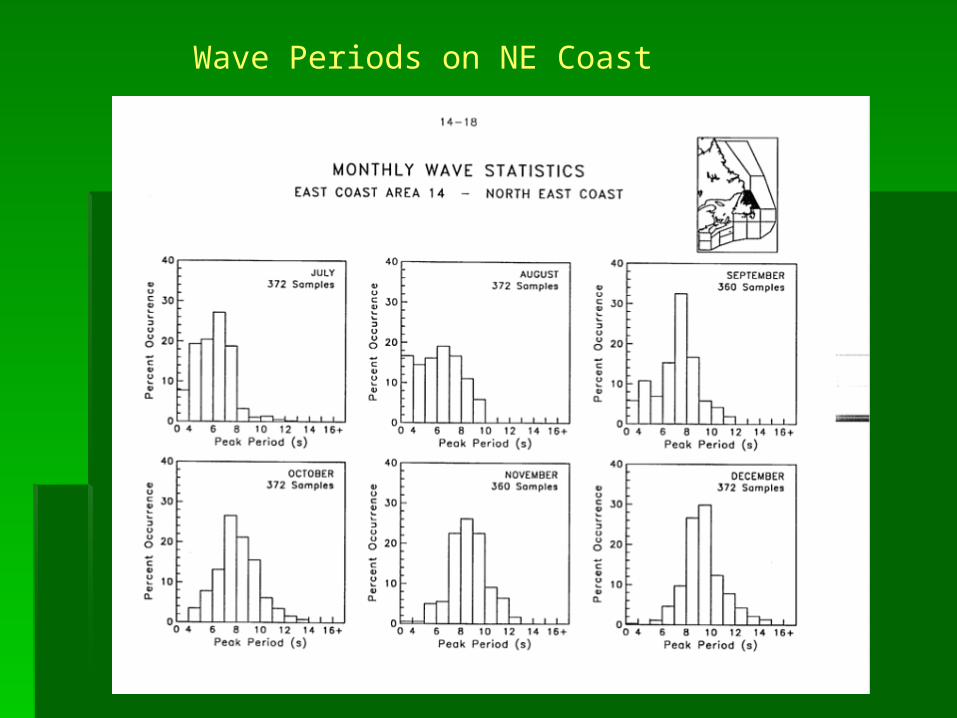
Wave Periods on NE Coast

Wave Heights on NE Coast

Percentage 0ccurrence of Percentage 0ccurrence of Waves over 3 m. by Waves over 3 m. by MonthMonth
Percentage of Waves over 3 m in Height by Month
0
10
20
30
40
50
60
70
80
90
july august september october november december
Month (integer)
per
cen
tag
e ex
ceed
ance
lev
el
Simulations using Simulations using MOTSIMMOTSIM
3 m significant wave height for various wave 3 m significant wave height for various wave periods. Typical to severe Fall weather periods. Typical to severe Fall weather conditions. Speed 5 knots in head seas.conditions. Speed 5 knots in head seas.
Boats used in the simulationsBoats used in the simulations 65 foot fiberglass boat with 26 foot beam65 foot fiberglass boat with 26 foot beam 90 foot fiberglass boat with 19 foot beam (scaled 90 foot fiberglass boat with 19 foot beam (scaled
version of the above 65 foot vessel)version of the above 65 foot vessel) 75 foot steel boat 22 foot beam (extended 65 footer)75 foot steel boat 22 foot beam (extended 65 footer) 100 foot steel with 24 foot beam (extended 65 100 foot steel with 24 foot beam (extended 65
footer)footer) 65 foot aluminum catamaran fishing boat65 foot aluminum catamaran fishing boat

65 Foot Fibre Glass Boat

90 foot Fibre Glass Boat

75 foot Steel Boat

100 Foot Steel Boat

Predictions of Pitch Motions Predictions of Pitch Motions of the Lauzier at 10 Knotsof the Lauzier at 10 Knots
Pitch for November Trials at 10 kt, Comparisons for Different Spectra Observed
during Sea Trial
0
0.5
1
1.5
2
2.5
3
3.5
4
4.5
5
-50 0 50 100 150 200Heading (degrees)
Pit
ch (
deg
rees
)
Sea Trial
motsim,measured directional
experiment

Pitch Motion Predictions Pitch Motion Predictions of the Lauzier at 6 knotsof the Lauzier at 6 knots
Pitch for November Trials at 6 kts, Comparisons for Different Spectra Observed during Sea Trial
0
0.5
1
1.5
2
2.5
3
3.5
4
4.5
5
-50 0 50 100 150 200Heading (degrees)
Pit
ch
(d
eg
ree
s)
SeaTrial
motsim, measured directional
experiment

Pitch Comparisons in 3m Head Waves
0
2
4
6
8
10
12
14
16
18
0.6 0.7 0.8 0.9 1 1.1 1.2 1.3 1.4 1.5
Wave Frequency
Pit
ch
(d
eg
ree
s)
65 ft FG
90 ft FG
100 ft steel
65 ft Cat
75 ft steel
Pitch Motions In 3 M Head Seas

Heave Comparisons in 3m Head Waves
0
0.5
1
1.5
2
2.5
0.6 0.7 0.8 0.9 1 1.1 1.2 1.3 1.4 1.5
Wave Frequency
Hea
ve (m
)
65 ft FG
90 ft FG
100 ft steel
65 ft Cat
75 ft steel
Heave Motions In 3 M Head Seas

Motion Induced Motion Induced InterruptsInterrupts
Measure of the ability of someone at Measure of the ability of someone at some location on a moving platform to some location on a moving platform to complete certain tasks.complete certain tasks.
Measure of the likelihood of an accident Measure of the likelihood of an accident occurring due to slipping or tipping.occurring due to slipping or tipping.
Number of “Loss-of-Balance Incidents” Number of “Loss-of-Balance Incidents” per minuteper minute

Formulae for Motion- Induced Interrupts

MII RISK LEVELS
Risk Level MII's per Minute
1 = Possible 0.1
2 = Probable 0.5
3 = Serious 1.5
4 = Severe 3.0
5 = Extreme 5.0

MII for 65 ft, 75 ft ,90 ft and 100ft Vessels in 3 m Head Seas averaged over points in middle third of the Main Deck
Motion Induced Interrupts Comparisons in 3m Head Waves
-0.5
0
0.5
1
1.5
2
2.5
3
3.5
0.6 0.7 0.8 0.9 1 1.1 1.2 1.3 1.4 1.5
Wave Frequency
MII
/min
ute
65 ft FG
90 ft FG
100 ft steel
65 ft Cat
75 ft steel

Loss of Fishing Days Due Loss of Fishing Days Due to Weatherto Weather
Based on the assumption that fishing activity Based on the assumption that fishing activity becomes difficult or dangerous if MII per becomes difficult or dangerous if MII per minute exceeds 1.5, the 65-footer would need minute exceeds 1.5, the 65-footer would need to avoid 3 m seas and the 100 foot vessel, 4 m to avoid 3 m seas and the 100 foot vessel, 4 m seas.seas.
Taking the average wave height over a 5-day Taking the average wave height over a 5-day period we can determine how many 5-day trips period we can determine how many 5-day trips could be completed with an average wave could be completed with an average wave height below either 3 m or 4 m.height below either 3 m or 4 m.
Based on wave statistics off the NE coast over Based on wave statistics off the NE coast over the past 10 years.the past 10 years.
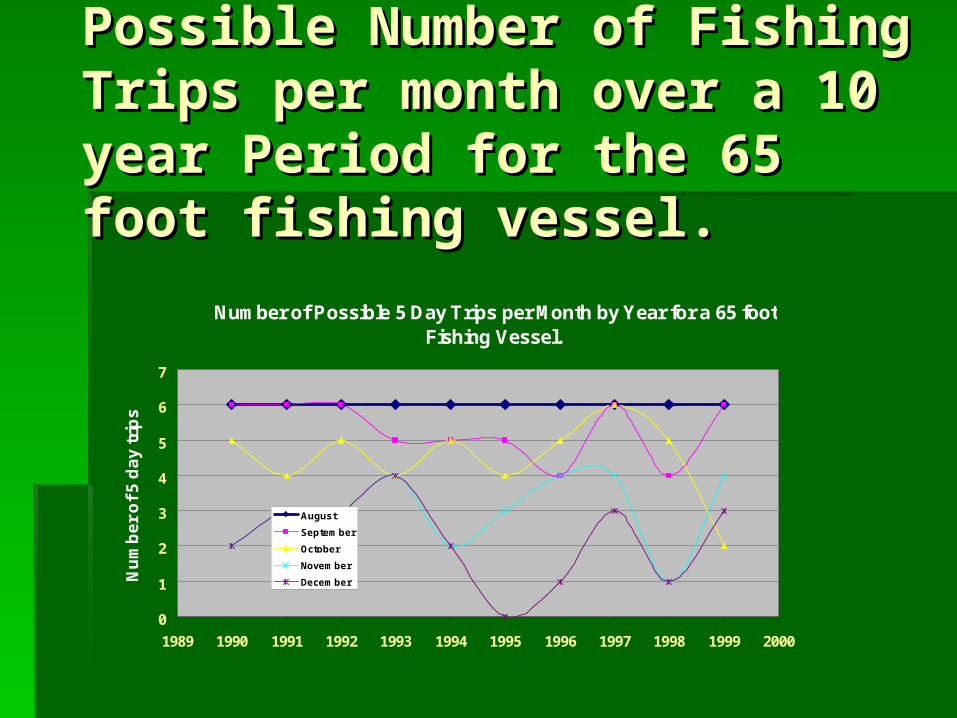
Possible Number of Fishing Possible Number of Fishing Trips per month over a 10 Trips per month over a 10 year Period for the 65 foot year Period for the 65 foot fishing vessel.fishing vessel.
Number of Possible 5 Day Trips per Month by Year for a 65 foot Fishing Vessel.
0
1
2
3
4
5
6
7
1989 1990 1991 1992 1993 1994 1995 1996 1997 1998 1999 2000
Nu
mb
er
of
5 d
ay
tri
ps
August
September
October
November
December

Number of Possible Trips for Number of Possible Trips for 65 and 100 footers (10 year 65 and 100 footers (10 year averages)averages)
Number of Possible 5 Day Trips per Month Based on 10 Year Averages of Wave Data for 65 foot and 100 foot
Fishing Vessels
0
1
2
3
4
5
6
7
august September October November December
Nu
mb
er
fo T
rip
s
65 footer
100 footer

CONCLUSIONSCONCLUSIONS
Difficult to come up with precise quantitative Difficult to come up with precise quantitative data on the number of fishing days lost due to data on the number of fishing days lost due to weather related factors.weather related factors.
Rough estimate based on MII approach shows Rough estimate based on MII approach shows considerable down time in the Fall for vessels considerable down time in the Fall for vessels 65 foot and under.65 foot and under.
It is clear that vessel length and design play It is clear that vessel length and design play important roles in determining that number.important roles in determining that number.


