Electrocardiography-ECG/EKG
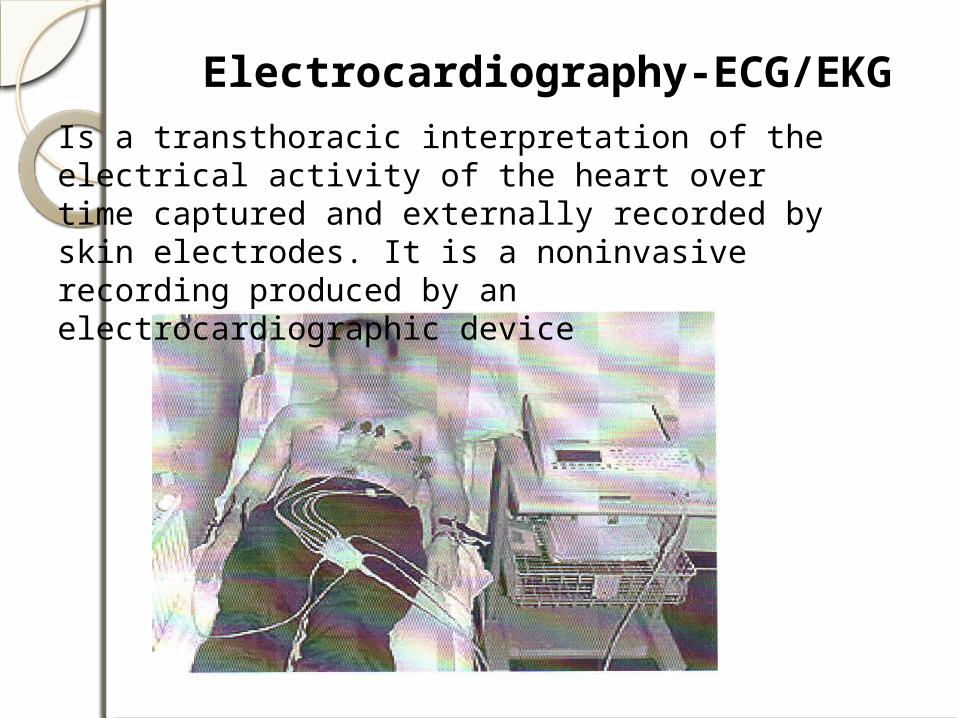
Is a transthoracic interpretation of the electrical activity of the heart over time captured and externally recorded by skin electrodes. It is a noninvasive recording produced by an electrocardiographic device

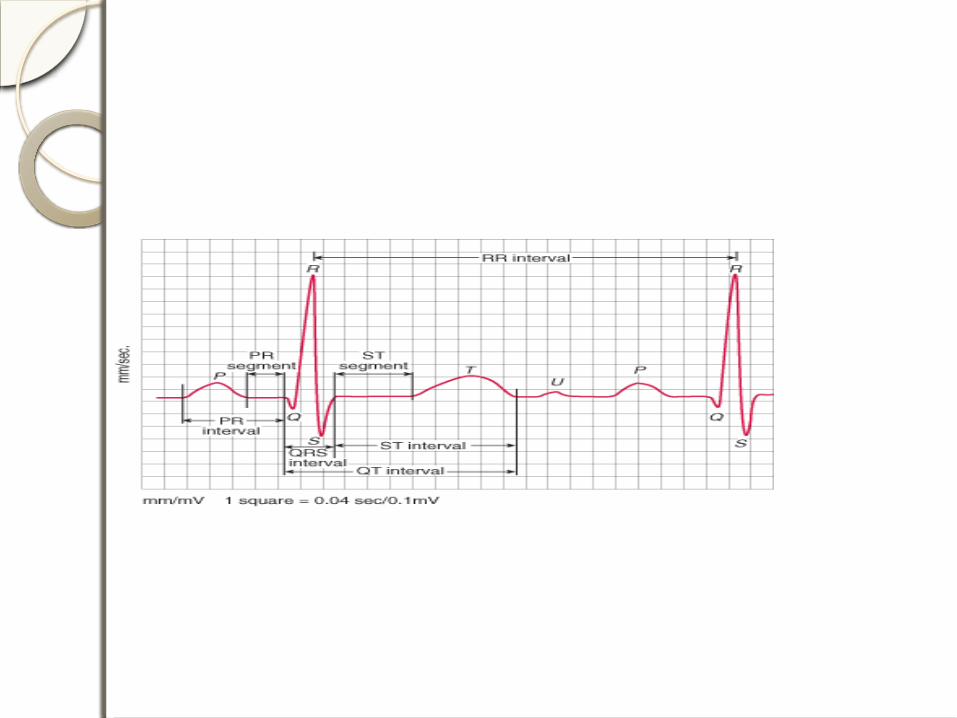
ECG graph paper Paper moves at a speed of 25mm/second At this speed Each horizontal small cube represents 0.04 seconds Each vertical small- 0.1 mv Large cube- horizontal- 0.2 seconds Large cube- vertically- 0.5 mv

•Important features of the ECG are the P wave, the QRS complex and T wave.•Relevant intervals and segments are the PR interval, the RR interval, the QT segment and the ST segment.

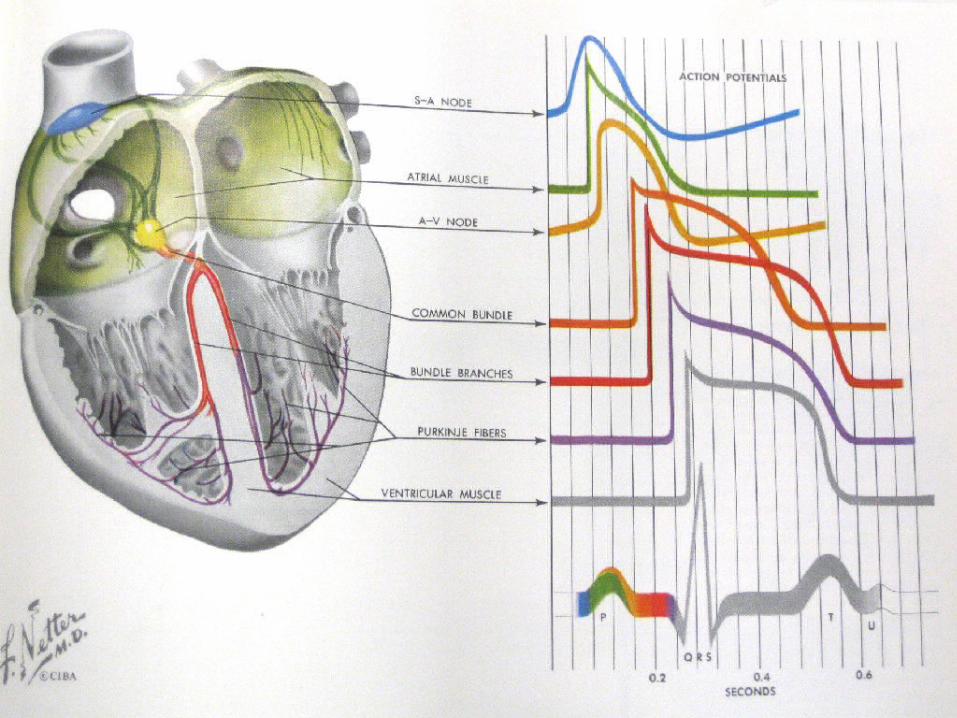
P wave: Atrial depolarization as recorded from the surface of thebodyP – R interval: Time taken for the wave of depolarization to move throughthe atria, AV node, bundle of His, Purkinje fibres to theventricular myocardium.QRS complex: Depolarization of the ventricles.ST segment: Marks the end of the QRS complex and the beginning ofthe T wave. It occurs when the ventricular cells are in theplateau phase of the action potential (i.e. there is no changein potential occurring and so the ECG baseline is at zeropotential)T wave: Repolarization of the ventricles (due to potential changesoccurring during phase 3 of the cardiac action potential)Q – T interval: Period during which ventricular systole occursR – R interval: This time is usually used to calculate the heart rate.

Waves and normal values P wave- Atrial depolarization 0.1 seconds 0.25 milli volts PR interval- AV nodal delay 0.12 seconds- 0.2
seconds QRS complex- ventricular
depolarization 0.1-0.11 seconds
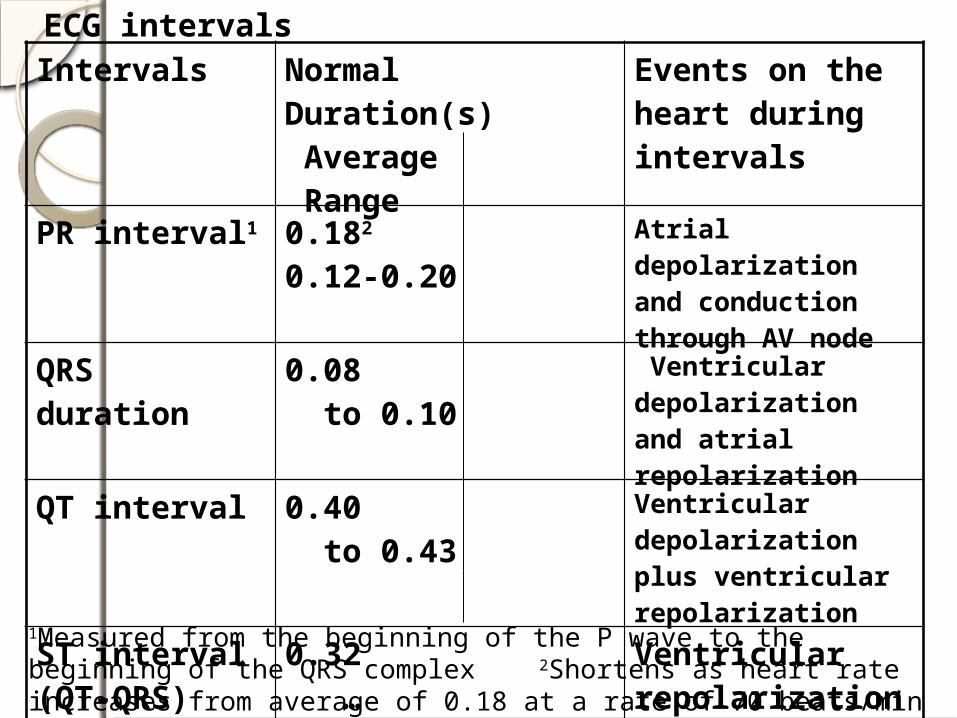
ECG intervalsIntervals Normal Duration(s)
Average RangeEvents on the heart during intervals
PR interval1 0.182 0.12-0.20 Atrial depolarization and conduction through AV node
QRS duration 0.08 to 0.10 Ventricular depolarization and atrial repolarization
QT interval 0.40 to 0.43 Ventricular depolarization plus ventricular repolarization
ST interval (QT-QRS)
0.32 … Ventricular repolarization
1Measured from the beginning of the P wave to the beginning of the QRS complex 2Shortens as heart rate increases from average of 0.18 at a rate of 70 beats/min to 0.14 at a rate of 130 beats/min

EKG RULES:
1) A wave of depolarization traveling toward a positive electrode results in a positive deflection in the ECG trace.
2) A wave of depolarization traveling away from a positive electrode results in a negative deflection.
3) A wave of repolarization traveling toward a positive electrode results in a negative deflection.
4) A wave of repolarization traveling away from a positive electrode results in a positive deflection.

EKG RULES: continued
5)A wave of depolarization or repolarization traveling perpendicular to an electrode axis results in a biphasic deflection of equal positive and negative voltages (i.e., no net deflection).
6) The instantaneous amplitude of the measured potentials depends upon the orientation of the positive electrode relative to the Mean QRS vector.
7)The voltage amplitude is directly related to the mass of tissue undergoing depolarization or repolarization.
EKG Leads
Leads are electrodes which measure the difference in electrical potential between either:
1. Two different points on the body (bipolar leads)
2. One point on the body and a virtual reference point with zero electrical potential, located in the center of the heart (unipolar leads)
EKG Leads
The standard EKG has 12 leads:
3 Standard Bipolar Limb Leads
3 Augmented Unipolar Limb Leads
6 Precordial Leads
The axis of a particular lead represents the viewpoint from which it looks at the heart.

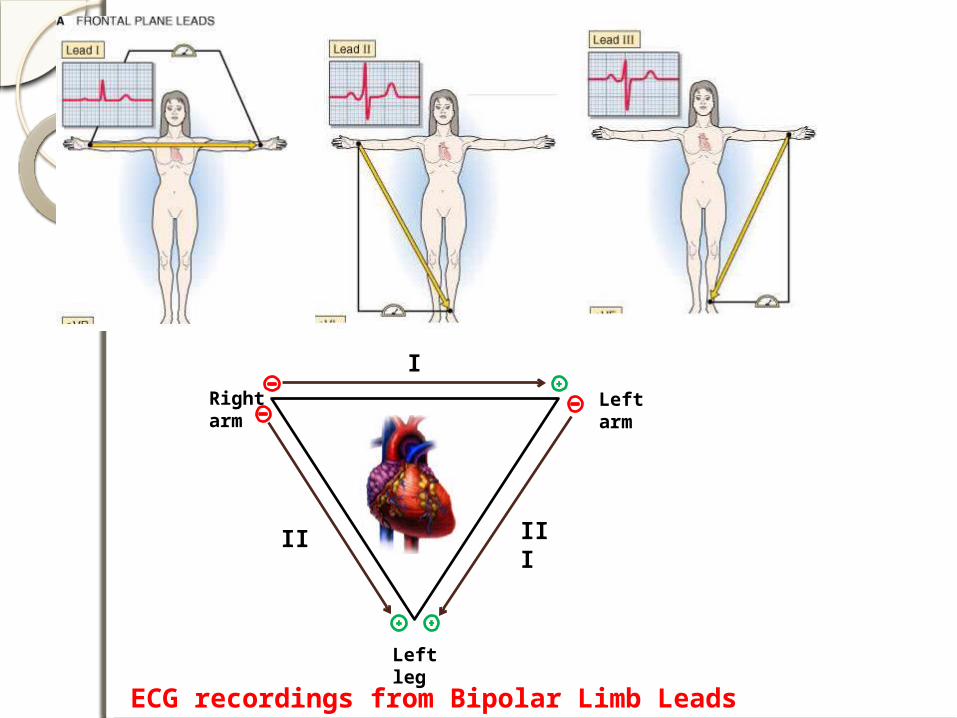
ECG recordings from Bipolar Limb Leads

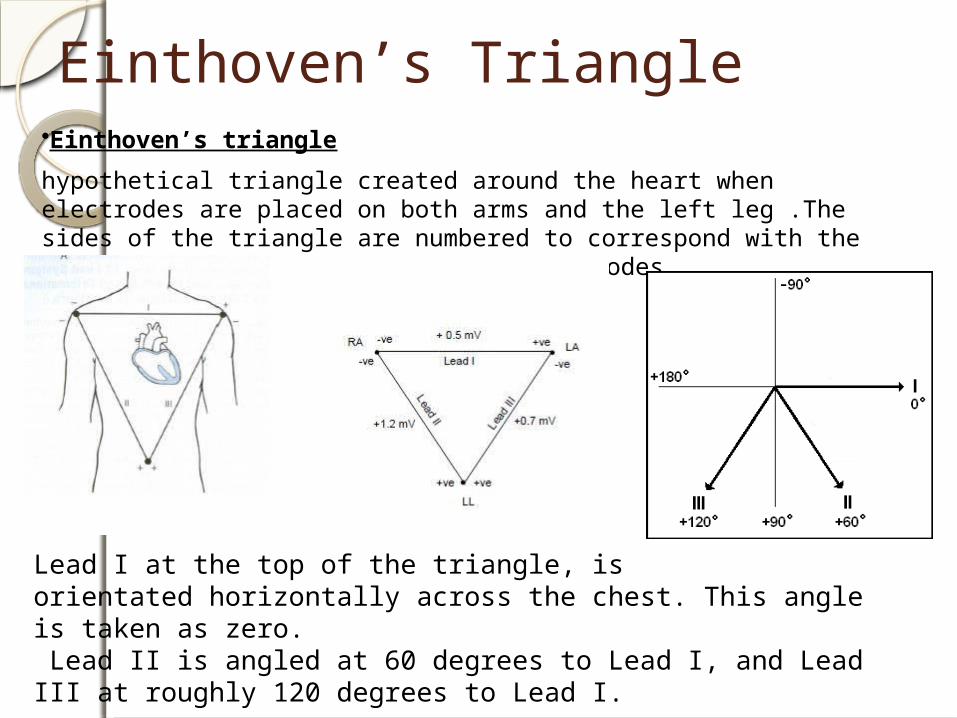
Einthoven’s Triangle•Einthoven’s triangle
hypothetical triangle created around the heart when electrodes are placed on both arms and the left leg .The sides of the triangle are numbered to correspond with the three leads ("leeds"), or pairs of electrodes.
Lead I at the top of the triangle, isorientated horizontally across the chest. This angle is taken as zero. Lead II is angled at 60 degrees to Lead I, and Lead III at roughly 120 degrees to Lead I.

Augmented Unipolar Limb Leads (aVR, aVL and aVF)Three unipolar limb leads are also used for recording ECGs. Each lead measures the potential difference between an exploring electrode and an “indifferent” electrode (V) assumed to be at zero potential. This indifferent electrode is constructed by connecting the electrodes on the right arm (R), left arm (L) and left leg or foot (F) together. This indifferent electrode is called V and is assumed to be at zero potential (since the sum of the potentials in all the leads cancel out).

Augmented limb leadsRepresented by aVR, aVF, aVR. a- augmented V-unipolar Last letter represents the part of
bodyaVR- between right arm and left arm+
left legaVL- between left arm and rt arm+ left
legaVF- between left foot and rt arm+ lt
arm
ECG recordings from Bipolar Limb Leads
Right arm
Left arm
Left leg
I
II III

ECG recordings from Bipolar Limb Leads
Right arm
Left arm
Left leg
I
Einthoven’s Triangle
1200 600
00
III
II
+900
-900
+1800
aVL
-300
aVR-1500
+aVF
Precordial Leads
Adapted from: www.numed.co.uk/electrodepl.html
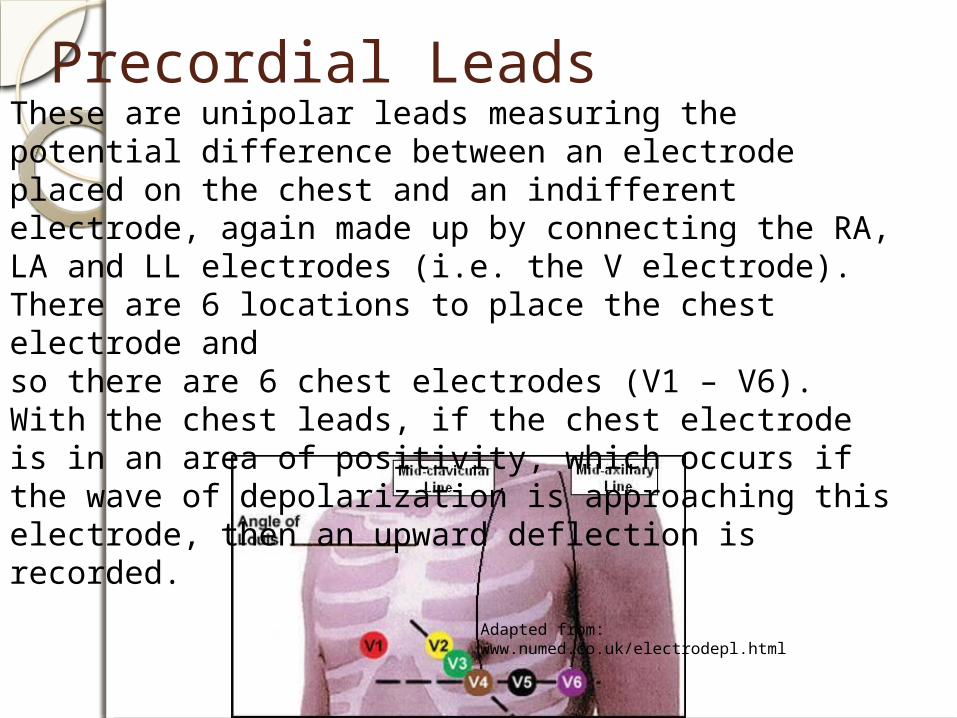
These are unipolar leads measuring the potential difference between an electrode placed on the chest and an indifferent electrode, again made up by connecting the RA, LA and LL electrodes (i.e. the V electrode). There are 6 locations to place the chest electrode andso there are 6 chest electrodes (V1 – V6).With the chest leads, if the chest electrode is in an area of positivity, which occurs if the wave of depolarization is approaching this electrode, then an upward deflection is recorded.

Precordial Leads

Pre cordial leadsV1- 4th intercoastal space, rt side sternal
boarderV2- 4th intercoastal space lt side of
sternal boarderV3- between V2 and V4V4- 5th intercoastal space in the mid
clavicular spaceV5- 5th intercoastal space in the anterior
axillary lineV6- 5th intercoastal space in the mid
axillary line.

Summary of Leads
Limb Leads Precordial Leads
Bipolar I, II, III(standard limb leads)
-
Unipolar aVR, aVL, aVF (augmented limb leads)
V1-V6


Anatomic Groups(Summary)
ILateral
aVRNone
V1
SeptalV4
AnteriorII
InferioraVL
LateralV2
SeptalV5
LateralIII
InferioraVF
InferiorV3
Anterior
V6Lateral

INTERPRETATION OF THE ELECTROCARDIOGRAM
What to inspect in an ECG1. Heart Rate2. Rhythm3. Duration, Segments and intervals. (P
wave duration, PR interval, QRS duration, QT interval)
4. Mean QRS Axis (mean electrical axis, mean QRS vector)
5. P wave abnormalitiesa. Inspect the P waves in leads II and
V1 for left atrial and right atrial enlargement.
b. Left atrial hypertrophy would result in a taller P wave in Lead II
c. RA hypertrophy – taller P wave in V1
6. QRS wave abnormalities7. ST segment/T wave abnormalities

Rule of 300Take the number of “big boxes” between neighboring QRS complexes( R – R interval), and divide this by 300. The result will be approximately equal to the rate
Although fast, this method only works for regular rhythms.
1 Heart Rate
(300 / 6) = 50 bpm
(1500/30) = 50 bpm

What is the heart rate?
(300 / ~ 4) = ~ 75 bpm
(1500/20 ) = 75 bpm
www.uptodate.com

What is the heart rate?
(300 / 1.5) = 200 bpm
Heart Rate < 60 beats / min Bradycardia
Heart Rate > 100 beats / min Tachycardia

The Rule of 300
It may be easiest to memorize the following table:
# of big boxes
Rate
1 300
2 150
3 100
4 75
5 60
6 50

2. RhythmIs the rhythm determined by the SA node pacemaker? i.e. is it a “sinus rhythm”?If normal, the following should be present:
· The P wave should be upright in leads I, II and III.· Each QRS complex should follow a P wave

WINDSOR UNIVERITY
P waveThe P wave represents atrial depolarization. In normal EKGs, the P-wave preceeds the QRS complex. It looks like a small bump upwards from the baseline. The amplitude is normally 0.05 to 0.25mV (0.5 to 2.5 small boxes). Normal duration is 0.06-0.11 seconds (1.5 to 2.75 small boxes). The shape of a P-wave is usually smooth and rounded.
P-wave questions:
Are they present?
Do they occur regularly?
Is there one P-wave for each QRS complex?
Are the P-Waves smooth, rounded, and upright?
Do all P-Waves have similar shapes?
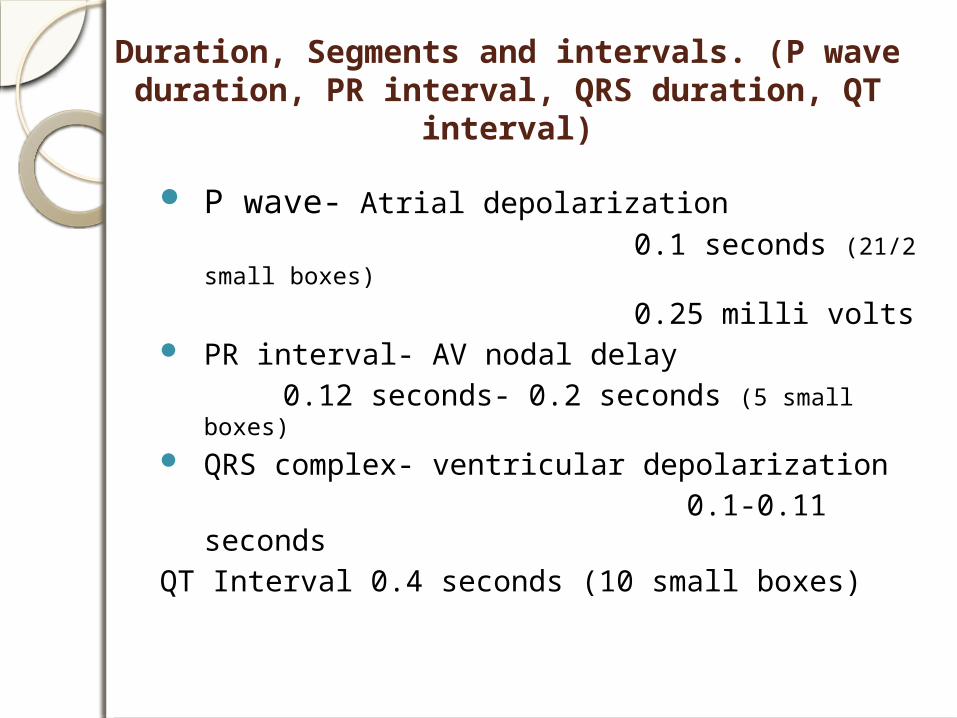
Duration, Segments and intervals. (P wave duration, PR interval, QRS duration, QT
interval)
P wave- Atrial depolarization 0.1 seconds (21/2 small
boxes)
0.25 milli volts PR interval- AV nodal delay 0.12 seconds- 0.2 seconds (5 small boxes) QRS complex- ventricular depolarization 0.1-0.11 seconds QT Interval 0.4 seconds (10 small boxes)
Einthoven’s Triangle•Einthoven’s triangle
hypothetical triangle created around the heart when electrodes are placed on both arms and the left leg .The sides of the triangle are numbered to correspond with the three leads ("leeds"), or pairs of electrodes.
Lead I at the top of the triangle, isorientated horizontally across the chest. This angle is taken as zero. Lead II is angled at 60 degrees to Lead I, and Lead III at roughly 120 degrees to Lead I.

All Limb Leads

The QRS Axis
The QRS axis represents the net overall direction of the heart’s electrical activity.
Abnormalities of axis can hint at:Ventricular enlargementConduction blocks (i.e.
hemiblocks)
The QRS Axis
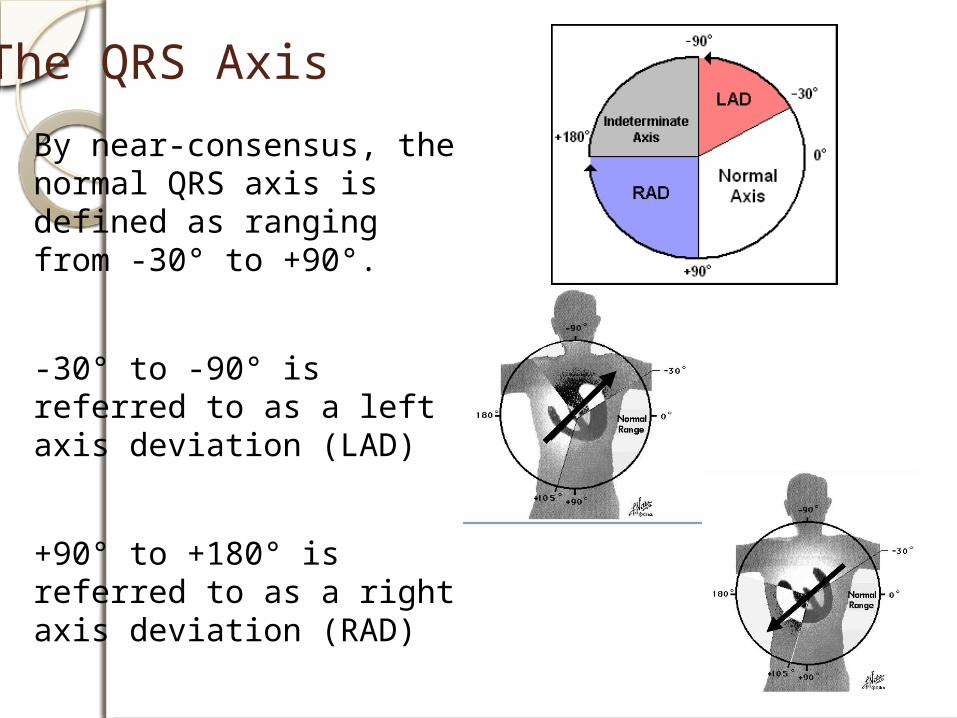
By near-consensus, the normal QRS axis is defined as ranging from -30° to +90°.
-30° to -90° is referred to as a left axis deviation (LAD)
+90° to +180° is referred to as a right axis deviation (RAD)

Determining the Axis
The Quadrant Approach
The Geometric method.
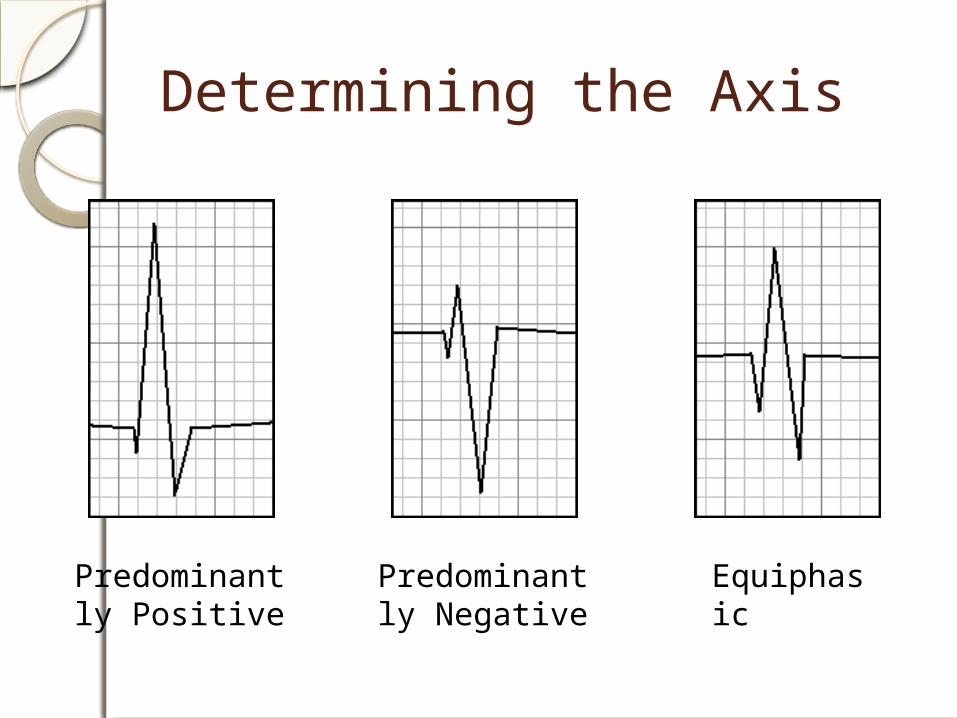
Determining the Axis
Predominantly Positive
Predominantly Negative
Equiphasic
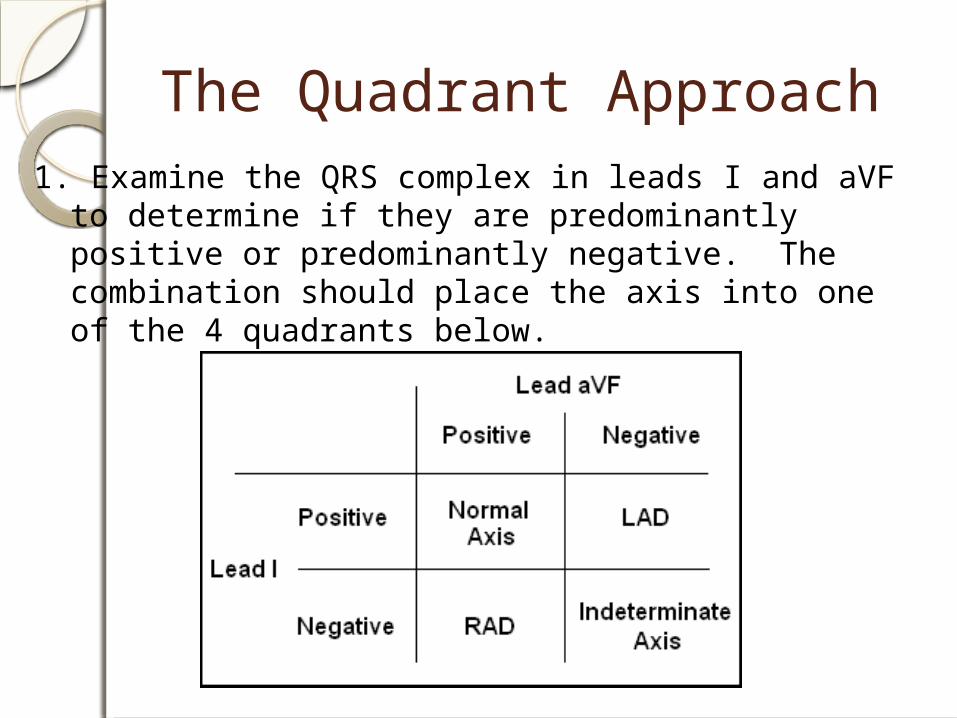
The Quadrant Approach1. Examine the QRS complex in leads I and aVF to
determine if they are predominantly positive or predominantly negative. The combination should place the axis into one of the 4 quadrants below.

The Quadrant Approach2. In the event that LAD is present, examine lead II to
determine if this deviation is pathologic. If the QRS in II is predominantly positive, the LAD is non-pathologic (in other words, the axis is normal). If it is predominantly negative, it is pathologic.

Quadrant Approach: Example 1
Negative in I, positive in aVF RAD
The Alan E. Lindsay ECG Learning Center http://medstat.med.utah.edu/kw/ecg/

Quadrant Approach: Example 2
Positive in I, negative in aVF Predominantly positive in II
Normal Axis (non-pathologic LAD)
The Alan E. Lindsay ECG Learning Center http://medstat.med.utah.edu/kw/ecg/

QRS Axis Determination- Using the Hexaxial Diagram First find the isoelectric lead if there is one; i.e., the lead with equal forces in the positive and negative direction. Often this is the lead with the smallest QRS.
The QRS axis is perpendicular to that lead's orientation.
Since there are two perpendiculars to each isoelectric lead, chose the perpendicular that best fits the direction of the other ECG leads.


Applied physiology
Myocardial infarction- Q wave
elevated ST segment Ischemia- ST depression
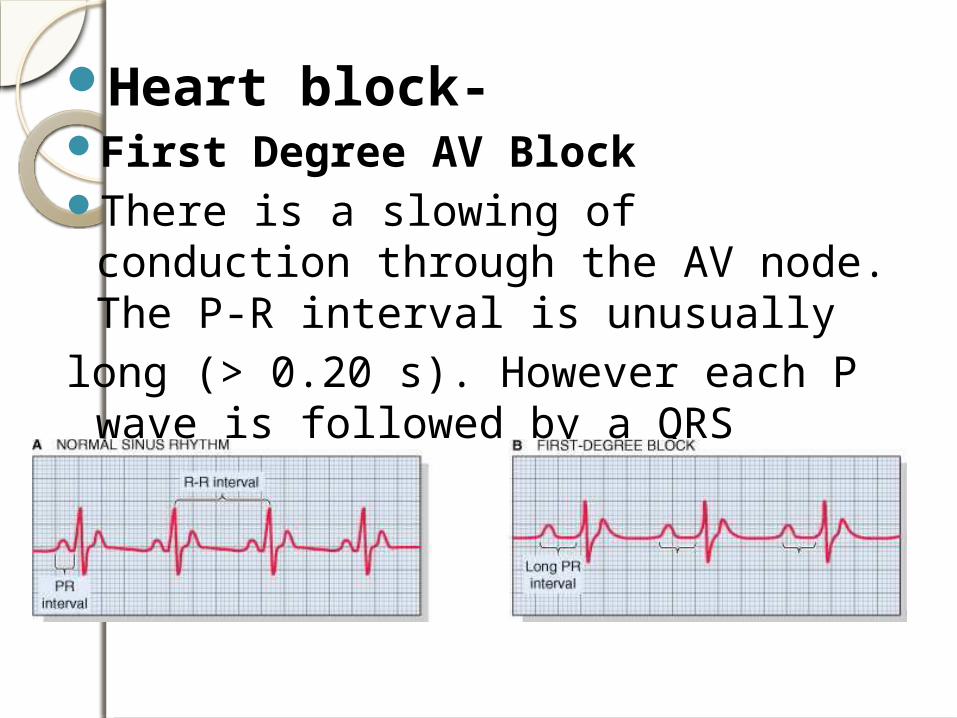
Heart block- First Degree AV BlockThere is a slowing of conduction
through the AV node. The P-R interval is unusually
long (> 0.20 s). However each P wave is followed by a QRS complex.

Second Degree BlockAs the PR interval increases to > 0.25s, sometimes conduction through the AV node fails and a P wave does not result in a QRS complex. This is intermittent conduction failure with a subsequent loss of ventricular contraction and is typical of a second degree block. There are 3 types of Second Degree Block: Mobitz type IMobitz type IIBundle Branch Block
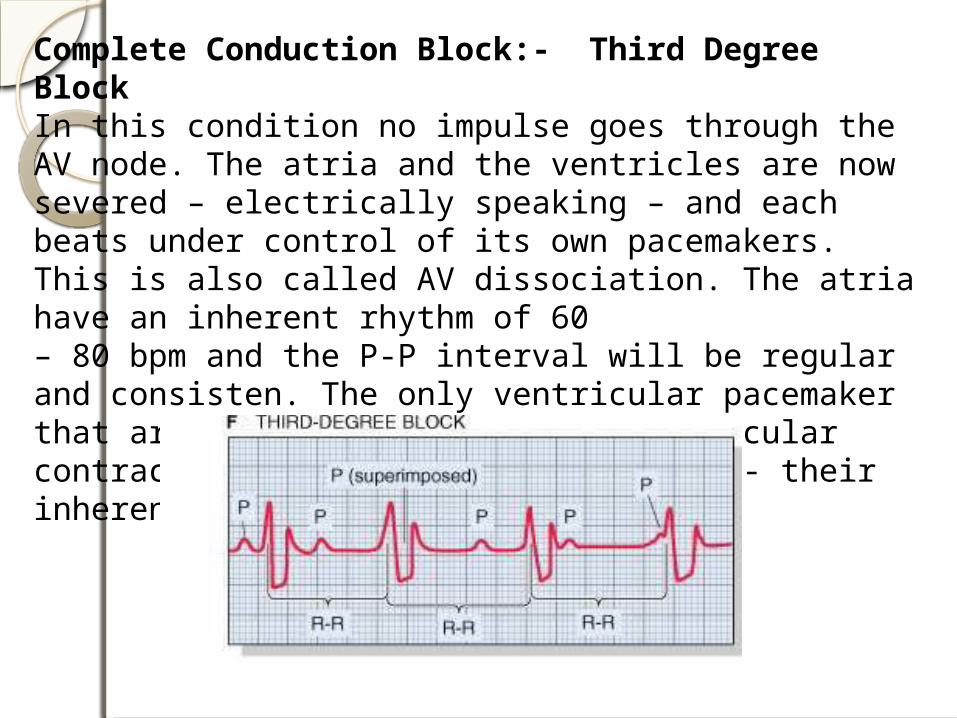
Complete Conduction Block:- Third Degree BlockIn this condition no impulse goes through the AV node. The atria and the ventricles are now severed – electrically speaking – and each beats under control of its own pacemakers. This is also called AV dissociation. The atria have an inherent rhythm of 60– 80 bpm and the P-P interval will be regular and consisten. The only ventricular pacemaker that are available to initiate ventricular contractions are the Purkinje fibres - their inherent rhythm is 20 – 40 bpm.

Arrhythmias caused by changes in Electrolyte CompositionBoth Hypokalemia and Hyperkalemia can cause serious cardiac arrhythmias. This is not surprising considering how dependent the membrane potential is on extracellular K+ levels. To treat arrhythmias due to hyperkalemia calcium gluconate is infused. Ca++ has the opposite effects to K+ on the action potential.
Hypokalemia: Flattened T waveST depressionMore prominent U wave
Hyperkalemia: Peaked T waveLoss of P waveWidened QRS


WINDSOR UNIVERITY
ECG 1
18-year-old pre-op ECG for knee surgery. What does this ECG show?
A. Limb lead reversal
B. Ectopic atrial rhythm (EAR)
C. Dextrocardia
D. Coronary sinus rhythm
E. Multifocal atrial rhythm (MAT)

WINDSOR UNIVERITY
ECG 2
The above ECG, from an elderly woman, is least consistent with which of the following? A. Severe mitral stenosisB. Severe aortic stenosisC. Embolic strokeD. Hypertensive heart diseaseE. Severe aortic regurgitation
ECG 3
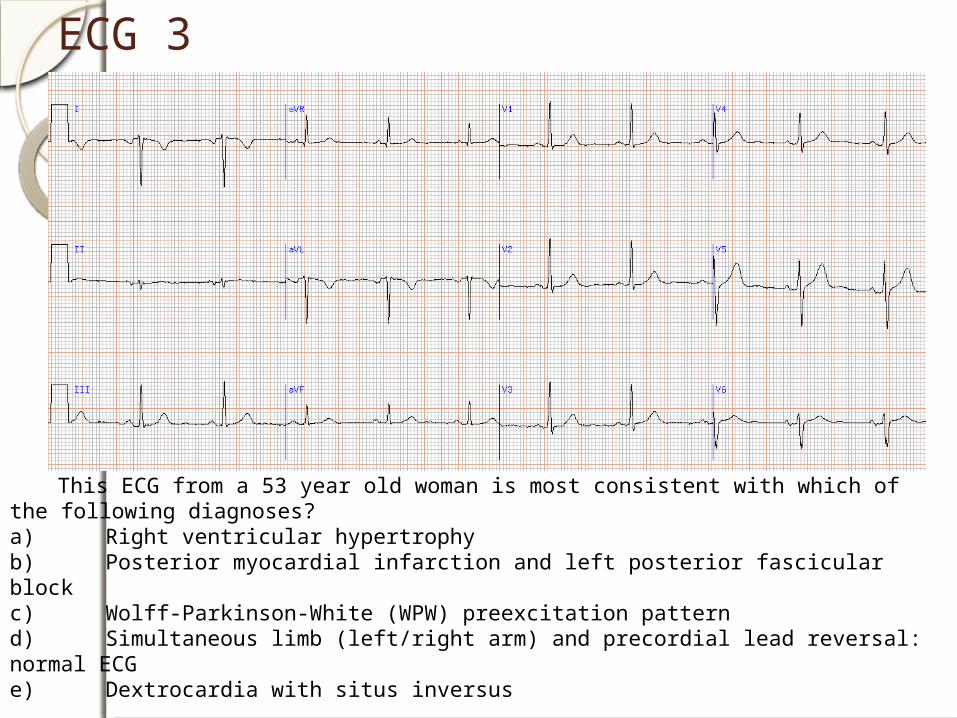
This ECG from a 53 year old woman is most consistent with which of the following diagnoses?
a) Right ventricular hypertrophyb) Posterior myocardial infarction and left posterior fascicular blockc) Wolff-Parkinson-White (WPW) preexcitation patternd) Simultaneous limb (left/right arm) and precordial lead reversal: normal ECGe) Dextrocardia with situs inversus
WINDSOR UNIVERITY
ECG 4
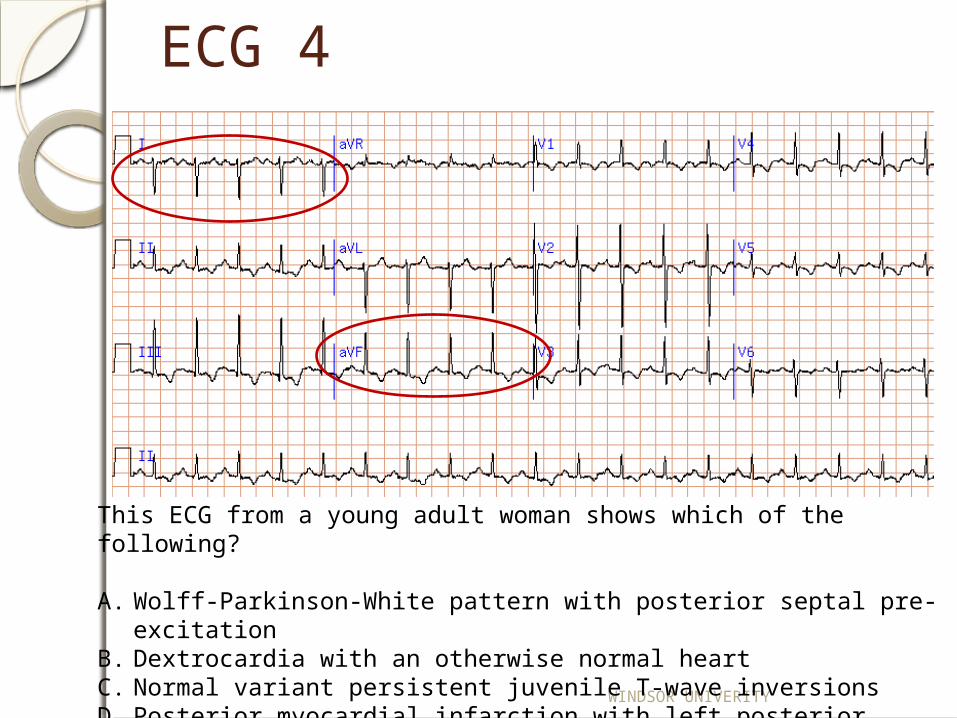
This ECG from a young adult woman shows which of the following?
A. Wolff-Parkinson-White pattern with posterior septal pre-excitationB. Dextrocardia with an otherwise normal heartC. Normal variant persistent juvenile T-wave inversionsD. Posterior myocardial infarction with left posterior hemiblockE. Severe right ventricular hypertrophy

WINDSOR UNIVERITY
ECG 5
This ECG shows evidence of which of the following?
A. Wolff-Parkinson-White pre-excitationB. Acute inferior myocardial infraction with intraventricular conduction delayC. Complete left bundle branch blockD. Left bundle branch block and acute anterolateral myocardial infarctionE. Right bundle branch block with left anterior fascicular block
WINDSOR UNIVERITY
ECG 6
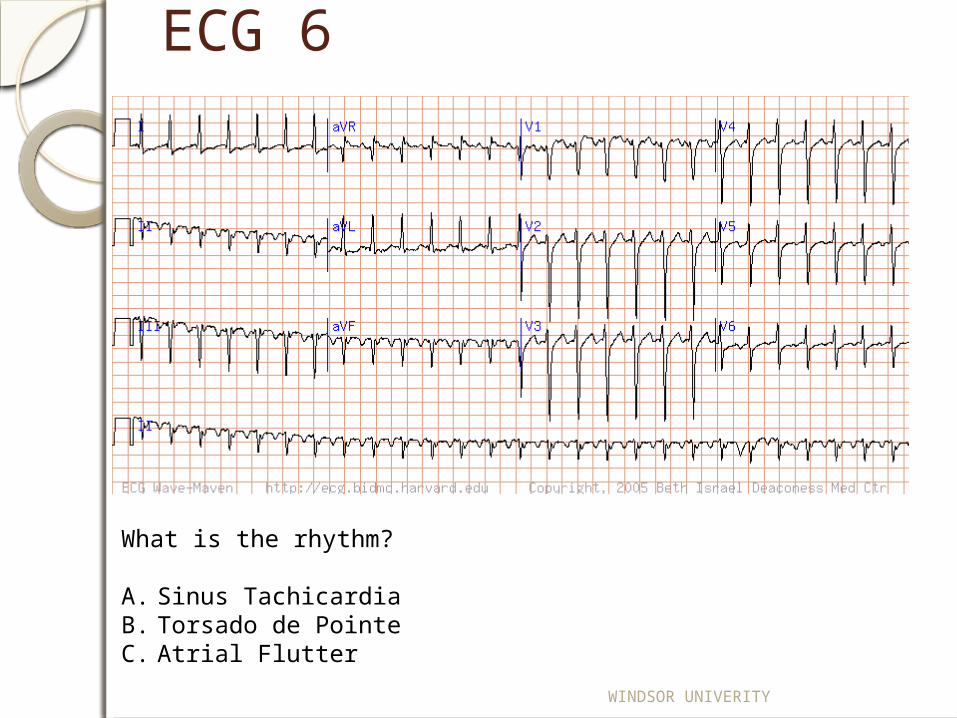
What is the rhythm?
A. Sinus TachicardiaB. Torsado de PointeC. Atrial Flutter
ECG 7
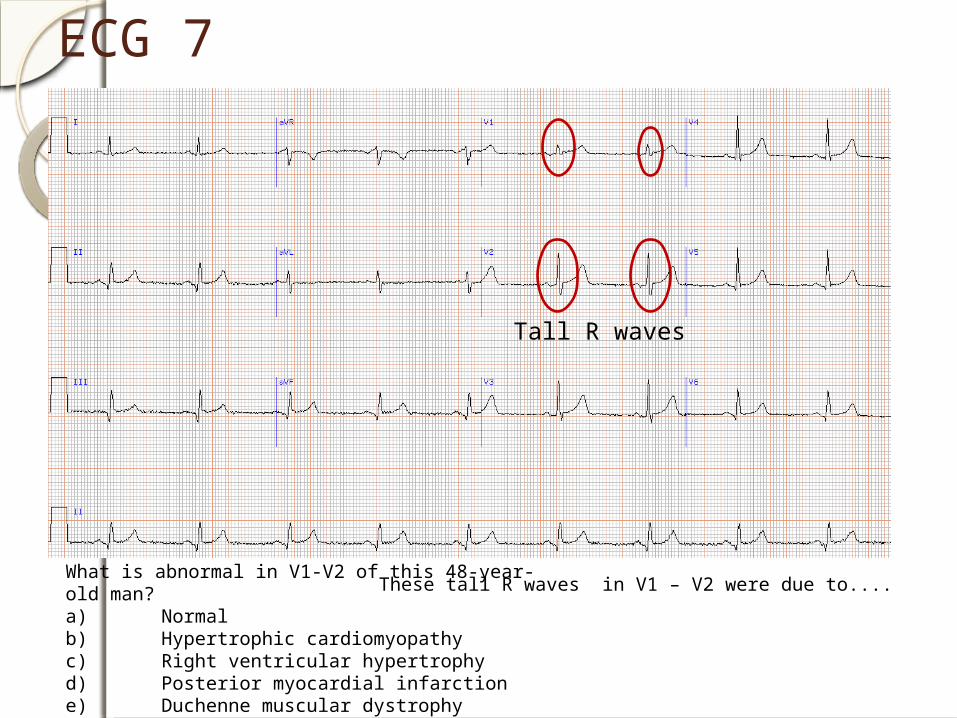
What is abnormal in V1-V2 of this 48-year-old man?a) Normalb) Hypertrophic cardiomyopathyc) Right ventricular hypertrophyd) Posterior myocardial infarctione) Duchenne muscular dystrophy
Tall R waves
These tall R waves in V1 – V2 were due to....

Posterior wall “leads”

WINDSOR UNIVERITY
The Leads (with the posterior leads)S (Septal)
A (Anterior)
L (lateral)
I (Inferior)
P (Posterior)
V1 and V2
V3 and V4
V5, V6, Lead I and aVLLead II, Lead III and aVF
V7, V8 and V9
WINDSOR UNIVERITY
ECG 8
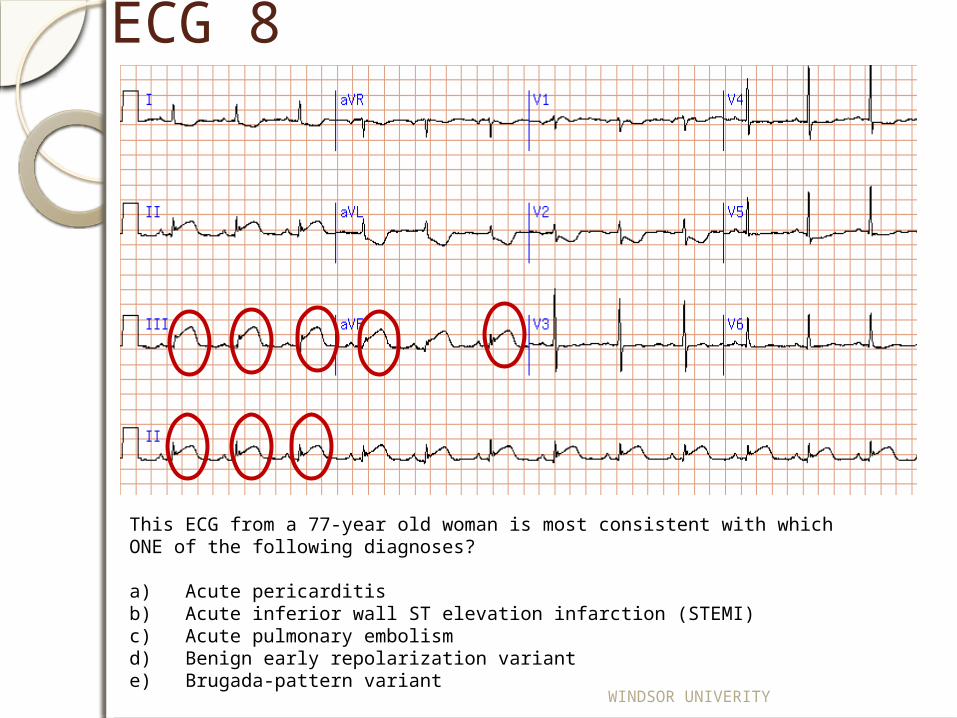
This ECG from a 77-year old woman is most consistent with which ONE of the following diagnoses?
a) Acute pericarditisb) Acute inferior wall ST elevation infarction (STEMI)c) Acute pulmonary embolismd) Benign early repolarization variante) Brugada-pattern variant
WINDSOR UNIVERITY
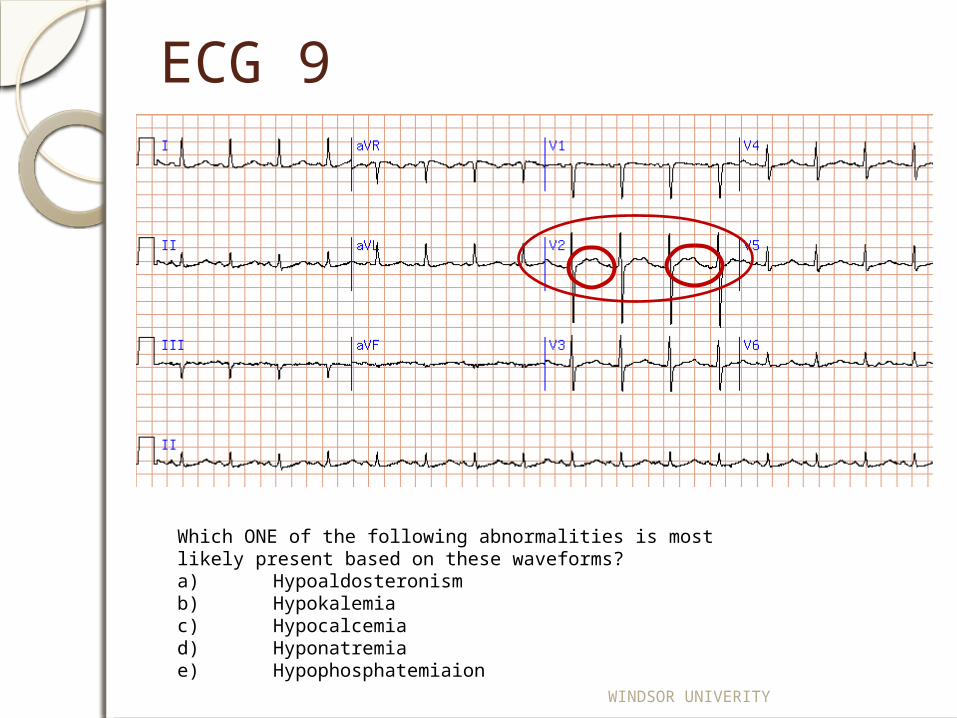
ECG 9
Which ONE of the following abnormalities is most likely present based on these waveforms?a) Hypoaldosteronismb) Hypokalemiac) Hypocalcemiad) Hyponatremiae) Hypophosphatemiaion
WINDSOR UNIVERITY
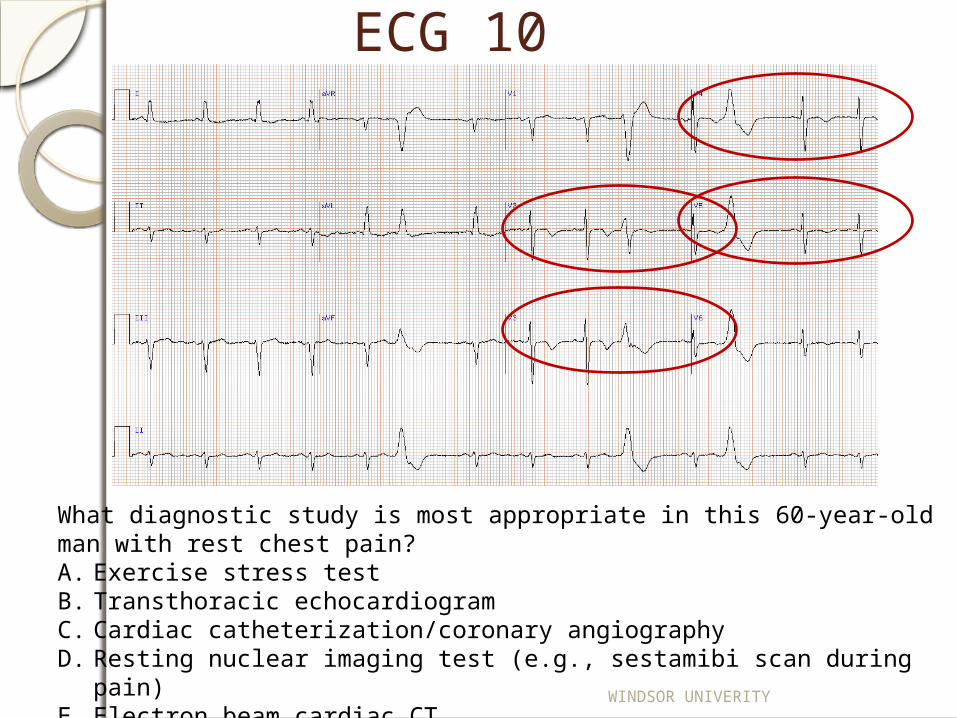
ECG 10
What diagnostic study is most appropriate in this 60-year-old man with rest chest pain? A. Exercise stress testB. Transthoracic echocardiogramC. Cardiac catheterization/coronary angiographyD. Resting nuclear imaging test (e.g., sestamibi scan during pain)E. Electron beam cardiac CT
WINDSOR UNIVERITY
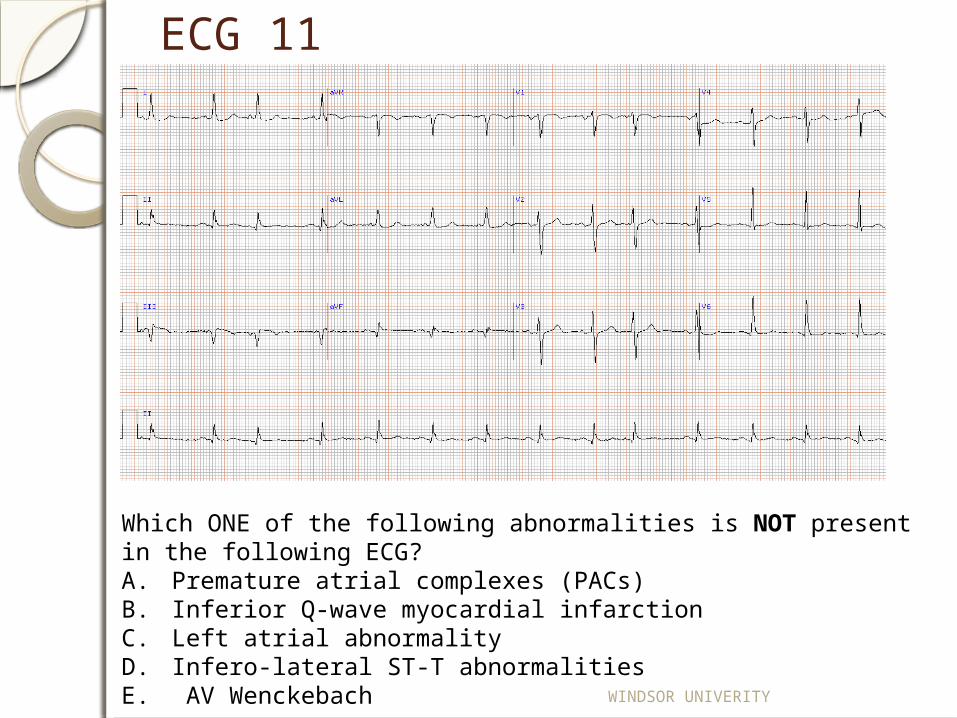
ECG 11
Which ONE of the following abnormalities is NOT present in the following ECG?A. Premature atrial complexes (PACs)B. Inferior Q-wave myocardial infarctionC. Left atrial abnormalityD. Infero-lateral ST-T abnormalitiesE. AV Wenckebach

WINDSOR UNIVERITY
ECG 12
This ECG is most consistent with which diagnosis? A. Acute anterior myocardial infarctionB. Accelerated idioventricular rhythmC. Marked hyperkalemiaD. Marked hypercalcemiaE. Systemic hypothermia
WINDSOR UNIVERITY
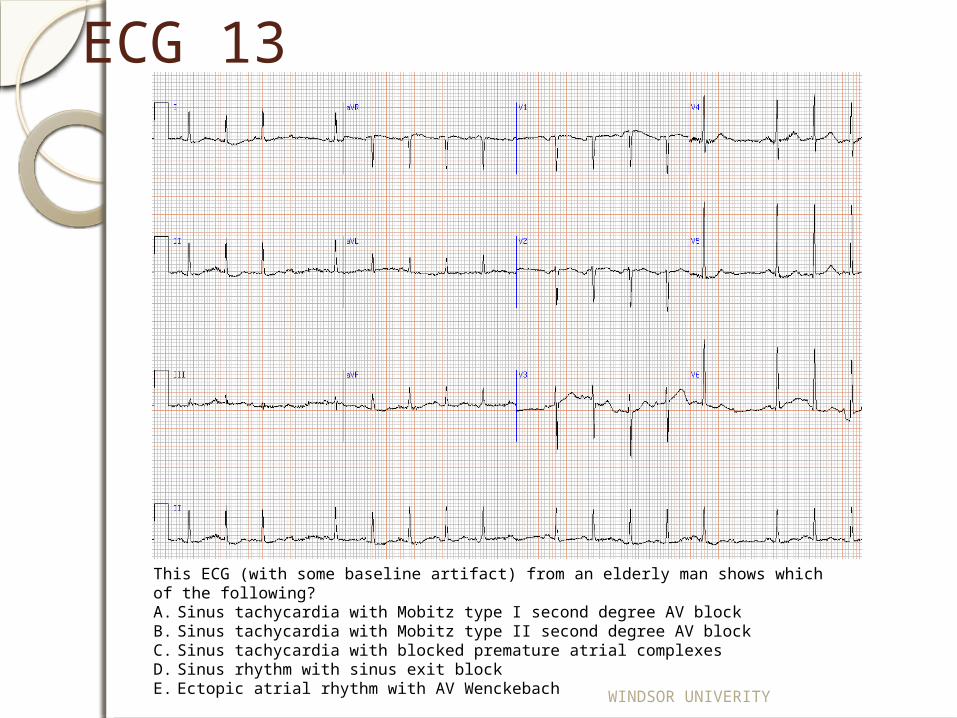
ECG 13
This ECG (with some baseline artifact) from an elderly man shows which of the following? A. Sinus tachycardia with Mobitz type I second degree AV blockB. Sinus tachycardia with Mobitz type II second degree AV blockC. Sinus tachycardia with blocked premature atrial complexesD. Sinus rhythm with sinus exit blockE. Ectopic atrial rhythm with AV Wenckebach

WINDSOR UNIVERITY
ECG 14
What AV conduction abnormality is present in this ECG showing sinus rhythm with right bundle branch block and left atrial abnormality?
A. Complete heart blockB. Isorhythmic AV dissociationC. Mobitz Type I AV block (AV Wenckebach)D. Mobitz Type II AV blockE. Sinus rhythm with blocked premature atrial beats
WINDSOR UNIVERITY
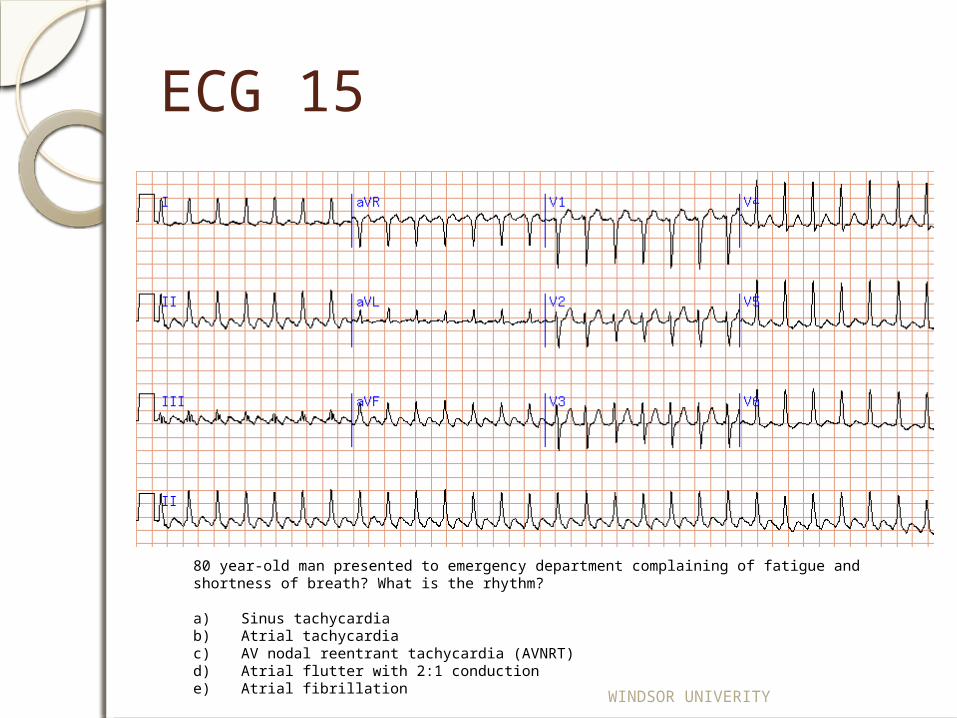
ECG 15
80 year-old man presented to emergency department complaining of fatigue and shortness of breath? What is the rhythm? a) Sinus tachycardiab) Atrial tachycardiac) AV nodal reentrant tachycardia (AVNRT)d) Atrial flutter with 2:1 conductione) Atrial fibrillation

WINDSOR UNIVERITY
ECG 16
Very elderly woman brought to the emergency department by her family for evaluation of a recent fall with complaints of fatigue and weakness. She was noted to have a very slow pulse. What is the rhythm?
A. Sinus rhythm with Mobitz II AV blockB. Sinus rhythm with isorhythmic AV dissociationC. Sinus rhythm with third degree (complete) AV blockD. Sinus bradycardia with right bundle branch block (RBBB) and blocked atrial premature beats in a bigeminal patternE. Atrial tachycardia with complete heart block


