Electrodeposition of copper: the nucleation mechanisms
Darko Grujicic, Batric Pesic *
Department of Materials, Mining and Metallurgical Engineering and Geology, University of Idaho, McClure Hall, Moscow, ID 83844-3024, USA
Received 30 November 2001
Abstract
The nucleation mechanisms of copper during electrodeposition of thin films from sulfate solutions were studied by utilizing the
electrochemical techniques (cyclic voltammetry and chronoamperometry) and atomic force microscopy (AFM). Near atomically
smooth glassy carbon was used as the deposition substrate (electrode). The copper nucleation mechanisms were examined as a
function of solution pH, copper concentration, deposition potential, temperature, and background electrolyte. It was found that
with pH and copper concentration increase, the nuclei size increased, while the nuclei population density decreased. An increase of
deposition potential produced smaller nuclei and higher nuclei population density. Temperature affected the morphology of
deposited copper. The presence of background electrolyte also influenced the morphology and population density of copper nuclei.
The nucleation mechanisms were examined by fitting the experimental data (chronoamperometry) into the Scharifker�/Hills
nucleation models. It was found that at pH 1, in the absence of background electrolyte, copper nucleation was instantaneous. At pH
2 and 3, the mechanism was inconclusive. In the presence of background electrolyte, the mechanism at pH 1 and 2 was mixed, while
at pH 3, the mechanism was progressive nucleation. # 2002 Elsevier Science Ltd. All rights reserved.
Keywords: Atomic force microscopy; Copper electrochemistry; Copper nucleation; Cottrell equation; Nucleation models
1. Introduction
In the recent years, copper has been replacing
aluminum as a metal for interconnects in the electronic
industry. Copper thin films are also used in the multi-
layer sandwiches of GMR hard disk read heads. Among
various methods of copper thin film deposition onto
substrates, such as PVD, CVD, and sputtering, the
electrochemical methods (electroless and electrolytic)
have proven to be least expensive, highly productive
and readily adoptable [1].
Copper electrodeposition mechanisms have been
studied in two chemical systems: the acidic without
complexation [1], and the basic, requiring the presence
of buffering [2,3] and complexing reagents, such as
amines [4�/6]. Copper surface morphology was modu-
lated by adding chelating [7�/9] and brightening reagents
[1].The advent of scanning probe microscopy (SPM),
such as atomic force microscopy (AFM), allows in-situ
monitoring of the reactions as they occur. The aim of
our investigations, therefore, was to re-examine copper
electrodeposition mechanisms by utilizing AFM to
provide the correlation between the morphological and
electrochemical information at the very beginning of
copper electroreduction, i.e. the nucleation stage. Elec-trochemical techniques, such as cyclic voltammetry (cv)
and chronoamperometry (ca) were used, and these had a
dual role. First, they served as the methods for copper
deposition, and second, they were utilized as diagnostic
tools for reaction mechanisms determination. Copper
electrodeposition was studied in three different chemical
systems: (1) pure acidic copper sulfate solutions, (2)
copper complexed by ammonia, and (3) solutions inwhich copper was chelated by EDTA. This paper
presents the study in acidic copper sulfate solutions.
The studies from other two systems will be published at
a later date [6,9].
* Corresponding author. Tel.: �/1-208-885-6569; fax: �/1-208-885-
2855
E-mail address: [email protected] (B. Pesic).
Electrochimica Acta 47 (2002) 2901�/2912
www.elsevier.com/locate/electacta
0013-4686/02/$ - see front matter # 2002 Elsevier Science Ltd. All rights reserved.
PII: S 0 0 1 3 - 4 6 8 6 ( 0 2 ) 0 0 1 6 1 - 5

2. Experimental
Electrolytes containing 0.01, 0.025 and 0.05 M of
CuSO4 were prepared using reagent grade, chloride free,
CuSO4. Solution was adjusted to pH 1, 2 and 3 by
adding diluted reagent grade sulfuric acid. All solutions
were prepared using Type I purity water (Barnstead
NANOpure II).
Electrochemical setup was a standard three-electrode
cell with glassy carbon as a working electrode, coiled
copper wire as a counter electrode, and copper-copper
sulfate as a reference electrode. The glassy carbon
working electrode (0.442 cm2) was a non-porous disk
(Sigri) of nearly atomic smoothness upon polishing. The
reference electrode, against which all potentials are
reported, was a copper wire immersed in copper sulfate
solution (Eh8�/0.300 V). A ceramic fritted junction was
used to establish contact between the electrolyte and the
reference electrode. Electrochemical experiments were
controlled with a potentiostat�/galvanostat (Perkin�/
Elmer, PAR EG&G 273A) under a computerized
control (PAR-EG&G, M270 Software). All experiments
were performed under constant temperature conditions
(T�/25 8C). All experiments were performed in the
absence of background electrolyte except when speci-
fied.
Surface morphology was characterized by AFM
(VEECO, Digital Instruments, Model Nanoscope IIIa)by using the tapping mode technique under fluid
conditions.
Thermodynamic calculations were performed by
computerized thermochemical software, STABCAL [10].
3. Results and discussion
3.1. Copper�/water chemistry
Possible species in the copper�/water system were first
examined by constructing the equilibrium ECu/Cu2��/pH
diagram of copper in water, as given in Fig. 1a for
25 8C. According to the ECu/Cu2��/pH diagram, the
cupric ion predominance area is confined to a narrowregion between pH 0 and 4.2 and above the solution
potential of �/20 mV. The solubility�/pH diagram, Fig.
1b, was constructed to determine the equilibrium con-
centration of cupric ions in the entire pH range.
Accordingly, soluble copper concentration rapidly de-
creases by two orders of magnitude for a unit increase of
pH, yielding to the copper hydroxy sulfate. Conse-
quently, the experiments in this investigation werelimited to pH region in which copper was soluble, i.e.
pH 1, 2 and 3.
3.2. Cyclic voltammetry
The chemistry of the copper-water system was further
studied using cyclic voltammetry. The effect of pH on
cyclic voltammetry of copper (0.01 M) is given in Fig. 2,where pH 1, 2 and 3 are represented by solid, dashed
and dotted lines, respectively. The cyclic voltammo-
grams corresponding to pH 2 and 3 were compensated
for solution resistance. Each cycle commenced at �/500
mV, reversed at �/500 mV and terminated at �/500 mV.
There was no current produced, initially, until potential
of �/150 mV was reached. At this voltage, the cathodic
current starts to increase and forms the peak Ic at apotential that depends on pH.
The reaction responsible for the peak Ic is reaction
(1):
Cu2��2e�Cu0: (1)
The decaying cathodic current past the peak Ic
represents the reaction (1) in diffusion controlled
regime. Current density at the vertex potential (�/500
mV) was �/1 mA cm�2 for pH 1 and 2 and �/2.5 mA
cm�2 for pH 3.Upon the sweep reversal, the cathodic current density
gradually decreases, until it crosses 0 and turns into
anodic current. Further sweep in the positive direction
Fig. 1. Equilibrium diagrams for CuSO4�/water system: (a) ECu/Cu2� �/
pH diagram, (b) distribution�/pH diagram. Conditions: 0.01 M Cu2�,
0.01 M S6�, T�/25 8C.
D. Grujicic, B. Pesic / Electrochimica Acta 47 (2002) 2901�/29122902

results in the anodic peak Ia, which corresponds to the
reaction (1) in the reverse direction. The current density
past the peak is 0, indicating the completion of oxidative
dissolution of metallic copper at the electrode surface.
Deposition potential of metallic ions on a foreign
substrate is usually higher than deposition potential on
the electrode made of the same metal due to crystal-
lographic substrate�/metal misfit. Therefore, deposition
of copper on glassy carbon commences at potentials that
are more negative compared with the redox potential of
Cu/Cu2�. In the anodic direction, however, the oxida-
tion of copper starts from the surface that already has
copper deposited, resulting in a potential close to the
Cu/Cu2� equilibrium potential. Due to the difference in
deposition and dissolution potentials, a crossover occurs
between the cathodic and anodic current traces [11] at
the crossover potential Ex . The presence of the crossover
is diagnostic for the nuclei formation on the electrode.
In this study, the crossover occurred for each pH
examined, Fig. 2.
Since reaction (1) is pH independent, the cyclic
voltammograms should also be indistinguishable with
respect to this parameter. Nevertheless, half-peak and
peak potentials of cyclic voltammograms differ for
different pH values. By examining the resistance of
solutions, it was determined that only solutions at pH 1
had negligible resistance. The 0.01 M Cu2� solution at
pH 2 had an uncompensated resistance of 104 V, while
the uncompensated resistance of the same solution at
pH 3 was 208 V. Such high uncompensated resistances
caused significant IR drops, so that the potential scan
was no longer linear [11]. In order to overcome this
problem we utilized two different methods for uncom-
pensated resistance elimination.
The first method was instrumental, i.e. the equipment
had the capability to determine the IR drop in the
electrochemical cell. The solution resistance was subse-
quently compensated prior to current-voltage curves
that were produced, as given in Fig. 2. The IR drop at
pH 3 could not be fully eliminated, however.
The second method used 1 M Na2SO4 as a back-
ground electrolyte in order to improve the conductivity
of the solution. Addition of sodium sulfate eliminated
the uncompensated resistance of the electrolytes at all
pH values. Cyclic voltammograms recorded with the
background electrolyte (not presented here) were iden-
tical for each solution studied. However, according to
the results that will be presented below, sodium sulfate
had such profound effects on the nucleation mechanisms
of copper that the results obtained with and without the
background electrolyte were fundamentally different.
The effect of copper concentration on cyclic voltam-
metry of copper (pH 1) is given in Fig. 3, where 0.01,
0.025 and 0.05 M Cu2�, are represented by solid,
dashed and dotted lines, respectively. The only effect
found was the increase of current density with an
increase of copper concentration.
Chronology of events on the surface during an entire
cyclic voltammetry scan is presented in Fig. 4. Fig. 4a
describes the glassy carbon surface at the beginning and
the end of cyclic voltammetry. The AFM image of the
glassy carbon surface past the Ic peak, �/300 mV, is
given in Fig. 4b. Accordingly, the glassy carbon surface
is sparsely populated with relatively large (2.5 mm)
copper nuclei. The next examination of the electrode
surface was performed on the sweep reversal at �/200
mV, Fig. 4c, immediately prior to the beginning of
copper oxidation. The large nuclei formed previously
were still present. However, it is also important to note
that many new copper nuclei were formed, a phenom-
enon caused by additional activation of nucleation sites
Fig. 2. Cyclic voltammetry of 0.01 M Cu2� solutions as a function of
pH. Ex denotes a crossover potential between cathodic and anodic
current traces.
Fig. 3. Effect of copper concentration on cyclic voltammetry of copper
at pH 1, 2 and 3.
D. Grujicic, B. Pesic / Electrochimica Acta 47 (2002) 2901�/2912 2903

on the glassy carbon surface as the electrode experienced
more negative potentials. Going further in the positive
direction, the next surface examination was performed
right after the cv passed the peak Ia, Fig. 4d. The almost
barren electrode surface clearly indicates that copper
dissolution was nearly completed. The electrode surface
at the end of the cv sweep had no copper present, andthe surface was indistinguishable from Fig. 4a.
3.3. Chronoamperometry for nucleation modeling
Chronoamperometry was used as an electrochemical
method for copper deposition, and simultaneously, as a
technique suitable for electrochemical nucleation me-
chanisms studies. In chronoamperometry experiments,
the potential was stepped from the open-circuit potentialto the potential at which the deposition of copper would
occur. Under these conditions, the system made a
transition from no reaction to the steady-state reaction,
controlled by the rate of mass transfer of cupric ions
toward the electrode surface. Such transition is always
followed by the current transient until the steady-state is
achieved, as described by the Cottrell equation [11],
equation (2)
i�nFD1=2C0
p1=2t1=2(2)
where, i , current density; n , number of electrons
involved; F , Faraday constant; D , diffusion coefficient;
C0, concentration of species in the bulk and t , time. In
the case of heterogeneous systems under diffusion
control, nuclei formed on the surface contribute to the
active surface area available for reaction. Initial current
increase for heterogeneous systems is due to the increase
of surface area whenever the nucleation is involved. Asnucleation progresses, the nuclei will begin overlapping.
Each nucleus will define its own diffusion zone through
which copper has to diffuse, representing the mass-
Fig. 4. (a�/d) AFM of glassy carbon surface at four different stages of cyclic voltammetry.
D. Grujicic, B. Pesic / Electrochimica Acta 47 (2002) 2901�/29122904

supplying mechanism for continuation of growth. Since
the diffusion zones are much larger than the underlying
nuclei, the overlapping zones would eventually include
the entire electrode area. Further reaction is strictlycontrolled by the rate of mass transfer through the
control area of the diffusion zone, i.e. the system is
under steady state conditions. Within the diffusion zone,
growth of already-established copper nuclei can con-
tinue, or additional nucleation can be initiated on
various sites, both governed by the steady state condi-
tions, as described by the Cottrell equation.
Chronoamperometry is an important diagnostic elec-trochemical technique because it provides the current
transients. These were effectively used by Scharifker and
Hills [12] to derive the mathematical models that
describe the nucleation mechanisms. According to the
models, there are two limiting nucleation mechanisms,
the instantaneous and the progressive. Instantaneous
nucleation corresponds to a slow growth of nuclei on a
small number of active sites, all activated at the sametime. Progressive nucleation corresponds to fast growth
of nuclei on many active sites, all activated during the
course of electroreduction [13].
The models for instantaneous and progressive nuclea-
tion are given by equations (3) and (4), respectively [12],
i2
i2m
�1:9542
t
tm
�1�exp
��1:2564
�t
tm
���2
(3)
i2
i2m
�1:2254
t
tm
�1�exp
��2:3367
�t
tm
�2��2
(4)
where im and tm are current and time coordinates of the
peak, respectively. In the following graphs, the instan-
taneous and the progressive mechanisms will be repre-
sented by solid and dashed lines, respectively.
3.4. Effect of deposition potential and pH
Cyclic voltammograms were consulted for selection of
deposition potentials for use in ca. The potential values
were selected from the more negative side of a cv peak,
Ic. The effect of deposition potential on chronoampero-metry was studied under three different pH conditions
(Fig. 5a�/c). At pH 1, the deposition potentials were in
the range �/300 to �/500 mV, while at pH 2 and 3 the
deposition potentials were in the range �/350 to �/550
mV. It should be noticed that the ca peaks are better
defined at pH 1 than at pH 2 and 3. The experimental
data from Fig. 5a�/c were used to fit Scharifker�/Hills
nucleation model (Fig. 5a?�/c?). According to data inFig. 5a?, copper at pH 1 is formed according to the
instantaneous nucleation mechanism for all studied
deposition potentials. However, at pH 2 and 3 the
experimental data did not follow either of the nucleation
mechanisms. The possible reason could be the solution
resistance under these two pH conditions. It should be
noted that algebraic compensation for IR drop (104 and208 V, for pH 2 and 3, respectively), performed by a
potentiostat, could not simulate the realistic solution
properties found in the presence of background electro-
lyte.
3.5. Effect of copper concentration
Effect of copper concentration on the reaction
mechanisms was studied at pH 1 for three differentcopper concentrations, 0.01, 0.025 and 0.05 M. Chron-
oamperometry experiments were performed at �/450
mV. The results are presented in Fig. 6a. The chron-
oamperograms were well defined with the current
densities increasing with the increase of copper concen-
tration. The corresponding fit of experimental data
according to Scharifker�/Hills’ model is presented in
Fig. 6a?. Instantaneous nucleation mechanisms wereobtained for all three copper concentrations up to t /
tm�/2.0. For extended reaction times, the calculated
data in Fig. 6a? departed from the instantaneous
mechanisms for higher concentrations of copper, 0.025
and 0.05 M. The exact reasons for deviation from the
model are not known. According to Radisic et al. [2] the
current from hydrogen reduction on formed copper
nuclei can cause a deviation from the model. Thisexplanation is questionable, however, because copper
surface area from 0.01 M copper sulfate is more readily
available. The morphology of a nucleus is a more
probable explanation for the deviation. Since the
nucleation models are derived for hemispherical geome-
try, any departure from this morphology will result in
deviation from the model. Thus in Fig. 9b and c, it can
be observed that the nuclei geometry is more dendritic/pyramidal, and as such can serve as an explanation for
the observed deviation.
3.6. Correlation between reaction models and nuclei
morphology
The morphology of copper nuclei was examined by
AFM for all studied parameters.
3.6.1. pH effect
Copper nuclei obtained at the end of ca experiments
during the pH effect study are presented in Fig. 7a�/c.
Although the nature of copper nuclei caused some
difficulties during AFM (inclination of some nuclei
was too steep to be resolved by a tip), several conclu-
sions can still be drawn from the images obtained. AtpH 1, copper was deposited in the form of equally sized
and somewhat rounded grains (Fig. 7a). At pH 2, Fig.
7b, the grains were no longer equally sized. Some of the
D. Grujicic, B. Pesic / Electrochimica Acta 47 (2002) 2901�/2912 2905
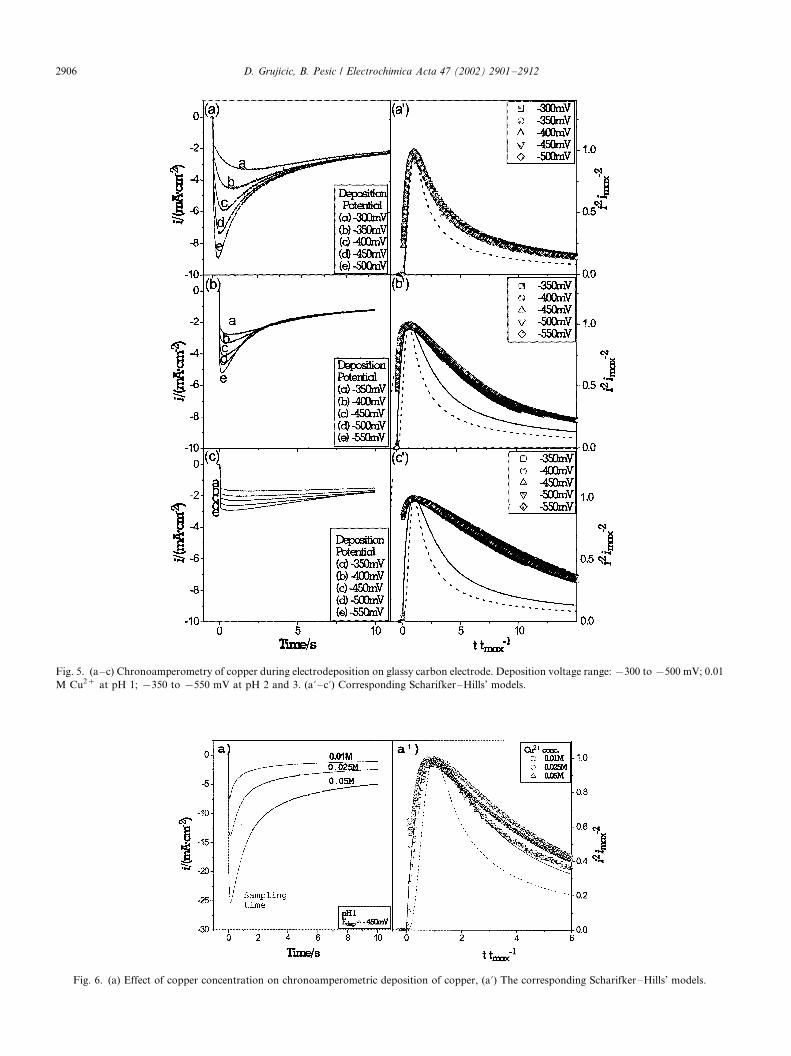
Fig. 5. (a�/c) Chronoamperometry of copper during electrodeposition on glassy carbon electrode. Deposition voltage range: �/300 to �/500 mV; 0.01
M Cu2� at pH 1; �/350 to �/550 mV at pH 2 and 3. (a? �/c?) Corresponding Scharifker�/Hills’ models.
Fig. 6. (a) Effect of copper concentration on chronoamperometric deposition of copper, (a?) The corresponding Scharifker�/Hills’ models.
D. Grujicic, B. Pesic / Electrochimica Acta 47 (2002) 2901�/29122906

grains at pH 2 (500 nm) were quite larger than at pH 1
(50 nm). At pH 3, Fig. 7c, the grains became elongated
and less populated on the surface (concluded form
additional images, not included here). The grain height
at pH 3 was also about 500 nm. Thus, pH increase was
responsible for the grain height increase, as well as the
increase of irregularity of grain shapes, and the decreaseof surface nuclei population density.
3.6.2. Deposition potential
The effect of deposition potential on morphology of
copper nuclei was studied at pH 1, 2, and 3 from 0.01 M
Cu2�. Fig. 8a�/c represent the results from copper
deposition test at pH 1. The ca experiments wereterminated when an exact amount of copper, equivalent
to 2.5 mC cm�2, was deposited. Each experiment was
followed by the atomic force microscopic study.
It was found that deposition potential mostly affects
the density of copper nuclei. At �/300 mV, Fig. 8a, the
nuclei were the largest and relatively scarce on the
surface, with a measured population density of about
3.75�/107 nuclei per cm2 (population density measure-
ment was performed by Nanoscope IIIa image analysis
software). An increase of deposition potential to �/400
mV, Fig. 8b, produced a nuclei population density of
4.19�/107 nuclei per cm2. Nuclei deposited at �/500 mV,
Fig. 8c, had the highest population density at 7.32�/107
nuclei per cm2. Since the amount of copper deposited
was constant for each condition, the surface with
the highest population density had to have the smallest
nuclei, Fig. 8c. The number of active sites depends
on the potential; this accounts for the increase in
nuclei population density as the deposition potential
increases.
Fig. 7. AFM of electrode surface upon electrodeposition of copper at
(a) pH 1, (b) pH 2 and (c) pH 3. Electrodeposition performed at �/450
mV from 0.01 M Cu2� solutions.
Fig. 8. Effect of deposition potential on the morphology (AFM) of
deposited copper at (a) �/300 mV, (b) �/400 mV, (c) �/500 mV.
Solution conditions: 0.01 M Cu2�; pH 1. Copper deposition equiva-
lent to 2.5 mC cm�2.
D. Grujicic, B. Pesic / Electrochimica Acta 47 (2002) 2901�/2912 2907

3.6.3. Concentration effect
The effect of copper concentration on the morphol-
ogy of copper nuclei was studied at pH 1, 2, and 3. Fig.
9a�/c represents the results from the copper deposition
study at pH 1 in 0.01, 0.025 and 0.05 M Cu2� solutions.
The AFM images were taken 0.8 s after beginning each
experiment for all three concentrations (Fig. 6a, line
designates sampling time). For the effect of copper
concentration, the ca experiments were terminated at
fixed time rather than fixed amount of copper deposited,
in contrast to the study of deposition potential discussed
above. By fixing the time, it was ensured that the
reaction was in the same stage for all three concentra-
tions.
For the 0.01 M copper concentration, Fig. 9a, the
nuclei were relatively small and densely distributed on
the surface. At a higher copper concentration, Fig. 9b,
the size of nuclei increased, but the nuclei population
density decreased, which was even more pronounced at
a higher copper concentration, Fig. 9c.
A schematic presentation of the effect of concentra-tion on nuclei size distribution and governing mechan-
isms is given in Fig. 10a and b, for lower and higher
metal concentrations, respectively. Regarding the de-
scribed nucleation mechanisms, another column is
added representing the stage of a chronoamperometric
reaction responsible for nuclei formation, Fig. 10c.
Stage I represents the initial conditions prior to the
onset of the reduction reaction. A liquid boundary filmlayer adjacent to the solid substrate and a solution bulk
are depicted. The liquid boundary film is presented in
the simplest possible terms, as used by Scharifker�/Hills
[12], thus no double layer properties were considered. At
the very beginning of electroreduction the number of
copper atoms produced on the surface is a function of
initial bulk concentration. In the case of lower metal
concentration, Fig. 10a, the copper atoms are spacedfurther apart compared with the case with higher metal
concentration, Fig. 10b. Once distributed over the
surface in the atomic state, atoms must travel toward
each other in order to minimize the surface energy.
Atoms spaced further apart have to travel longer
distances in order to group together and form a nucleus.
Since this is energetically unfavorable they have to
group together with the nearest neighbors, resulting inlarge number of small nuclei. On the other hand, when
the initial number of reduced metal atoms is large, the
close proximity of atoms will result in grouping to form
a large nucleus. The size of each nucleus determines the
size of its diffusion zone.
Decrease of nuclei population density with the
increase of concentration was also predicted by the
Scharifker�/Hills model [12]. According to the model,nuclei population density can be calculated for different
copper concentrations as a function of peak current imax
and corresponding peak time, tmax:
N0�0:065
�1
8pC0Vm
�1=2� nFC0
imaxtmax
�2
(5)
where, n , number of electrons involved; F , Faraday
constant; C0, concentration of species in the bulk; Vm,molar volume; tmax, peak time and imax, peak current
density. Calculated and measured nuclei population
densities are given in Table 1.
Data in Table 1 show that both calculated and
measured nuclei densities decrease with the increase of
copper concentration. The difference between the calcu-
lated and measured nuclei population densities was
about one order of magnitude, contrary to the datareported by others [2,13], whose difference was several
orders higher. The possible explanation for the differ-
ence could be the inability of the mathematical model to
Fig. 9. Effect of concentration on the morphology (AFM) of copper
deposited under potentiostatic conditions at �/450 mV for 0.8 s.
Copper concentrations (a) 0.01 M, (b) 0.025 M, (c) 0.05 M. All
solutions at pH 1.
D. Grujicic, B. Pesic / Electrochimica Acta 47 (2002) 2901�/29122908
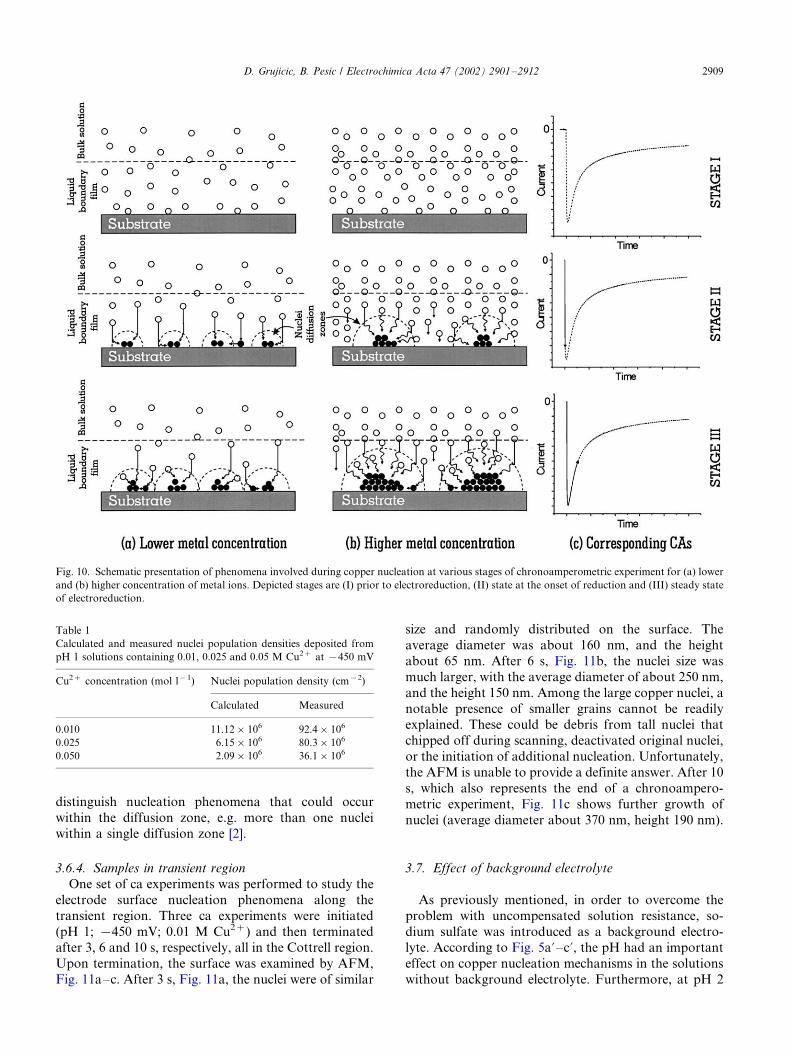
distinguish nucleation phenomena that could occur
within the diffusion zone, e.g. more than one nuclei
within a single diffusion zone [2].
3.6.4. Samples in transient region
One set of ca experiments was performed to study the
electrode surface nucleation phenomena along the
transient region. Three ca experiments were initiated
(pH 1; �/450 mV; 0.01 M Cu2�) and then terminatedafter 3, 6 and 10 s, respectively, all in the Cottrell region.
Upon termination, the surface was examined by AFM,
Fig. 11a�/c. After 3 s, Fig. 11a, the nuclei were of similar
size and randomly distributed on the surface. The
average diameter was about 160 nm, and the height
about 65 nm. After 6 s, Fig. 11b, the nuclei size was
much larger, with the average diameter of about 250 nm,
and the height 150 nm. Among the large copper nuclei, a
notable presence of smaller grains cannot be readilyexplained. These could be debris from tall nuclei that
chipped off during scanning, deactivated original nuclei,
or the initiation of additional nucleation. Unfortunately,
the AFM is unable to provide a definite answer. After 10
s, which also represents the end of a chronoampero-
metric experiment, Fig. 11c shows further growth of
nuclei (average diameter about 370 nm, height 190 nm).
3.7. Effect of background electrolyte
As previously mentioned, in order to overcome the
problem with uncompensated solution resistance, so-
dium sulfate was introduced as a background electro-lyte. According to Fig. 5a?�/c?, the pH had an important
effect on copper nucleation mechanisms in the solutions
without background electrolyte. Furthermore, at pH 2
Fig. 10. Schematic presentation of phenomena involved during copper nucleation at various stages of chronoamperometric experiment for (a) lower
and (b) higher concentration of metal ions. Depicted stages are (I) prior to electroreduction, (II) state at the onset of reduction and (III) steady state
of electroreduction.
Table 1
Calculated and measured nuclei population densities deposited from
pH 1 solutions containing 0.01, 0.025 and 0.05 M Cu2� at �450 mV
Cu2� concentration (mol l�1) Nuclei population density (cm�2)
Calculated Measured
0.010 11.12�106 92.4�106
0.025 6.15�106 80.3�106
0.050 2.09�106 36.1�106
D. Grujicic, B. Pesic / Electrochimica Acta 47 (2002) 2901�/2912 2909

and 3, copper nucleation mechanisms did not fit the
nucleation model of Scharifker�/Hills.
The role of background electrolyte was studied by
repeating the effect of pH experiments in the presence of
1.0 M sodium sulfate solutions. The results are pre-
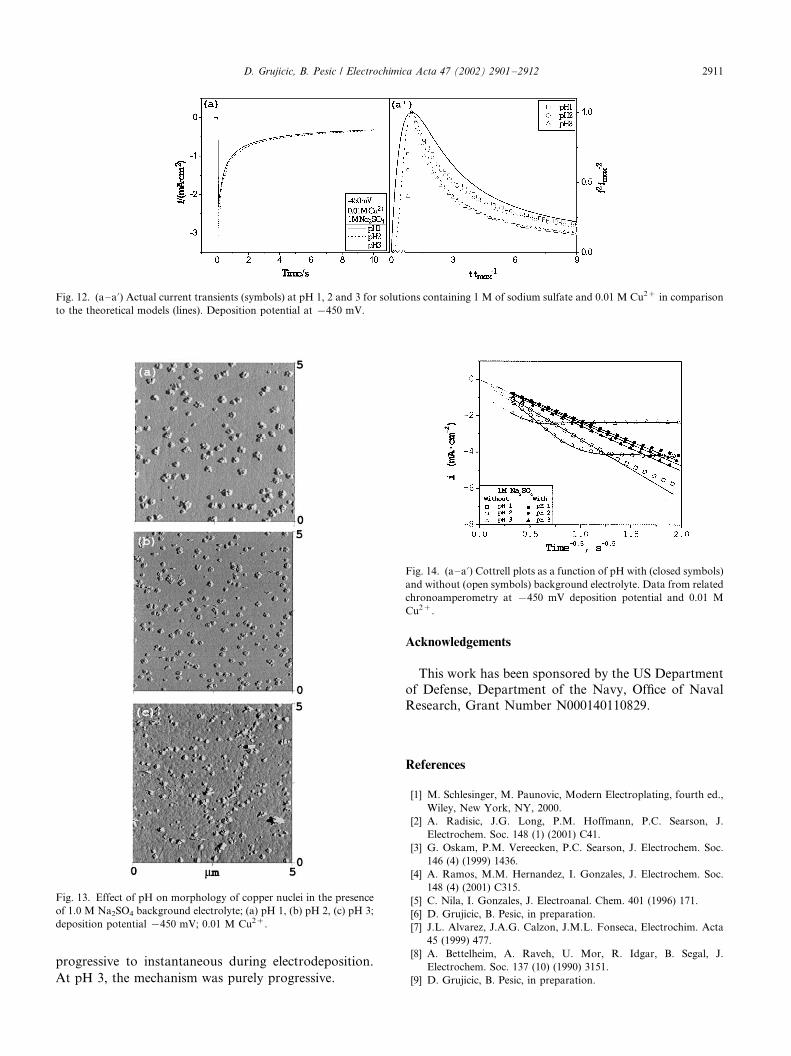
sented in Fig. 12a�/a?.At pH 3 copper nucleation followed the progressive
nucleation model during the entire reaction time, Fig.
12a? (triangle symbols). At pH 1 and 2, however, copper
initiated the nucleation on the surface according to the
progressive nucleation mechanisms, but with time, the
mechanism shifted toward the instantaneous mode
(closed circle and square symbols approach the solid,
instantaneous model, line). The departure from pro-
gressive nucleation mechanism was at about t /tmax�/2.
Fig. 13a�/c provide further proof of the difference in
nucleation mechanisms as a function of pH. The size of
nuclei deposited at pH 1 and 2, Fig. 13a�/b, correspond-
ing to the end of t /tmax scale, was almost uniform,
characterizing the instantaneous nucleation. However,
at the pH 3, Fig. 13c, the size of nuclei deposited was
fairly random, a characteristic for progressive nuclea-
tion.The effect of background electrolyte results, Fig. 12a�/
a? and Fig. 13a�/c, are very intriguing and deserve a
separate study. No further attention was given to this
parameter in this paper.
3.8. Diffusion coefficients calculation
Since the Cottrell equation (2) describes the system
under a diffusion-controlled regime, the expression canbe utilized for calculating diffusion coefficients. The plot
of current density versus inverse square root of time
should be linear and pass through the origin. The slope
of the line contains the information on the diffusion
coefficient. According to Fig. 14, the effect of pH in the
absence of a supporting electrolyte, a straight line
relationship was obtained only for pH 1 (open square
symbols). In the presence of 1.0 M sodium sulfate, asdescribed previously, pH had no effect; thus all pH data
fell close to one straight line (closed symbols). The
diffusion coefficient calculated in the absence of back-
ground electrolyte was 0.8�/10�5 cm2 s�1, compared
with the values of 0.57�/0.61�/10�5 published elsewhere
[3,14,15], while in the presence of background electro-
lyte, the diffusion coefficient was 0.43�/10�5.
4. Conclusions
The electrochemistry combined with the AFM was a
successful experimental approach for studying the
copper nucleation mechanisms during electrodeposition.
The electrochemical techniques had a dual role: (a)
copper electrodeposition, and (b) mechanistic interpre-tation. The AFM microscopy was a useful tool for
correlating the size distribution of copper nuclei with the
electrochemical findings.
Among the studied parameters, it was determined that
copper concentration, deposition potential, solution pH
and the presence of a background electrolyte all had
profound effects on the nucleation mechanisms of
copper on the glassy carbon surface. An increase ofpH and copper concentration produced nuclei with a
coarser texture and lower population density. An
increase of deposition potential and addition of back-
ground electrolyte had opposite effects. In the absence
of background electrolyte, the nucleation models of
Scharifker and Hills [12], additionally supported by
morphological information produced by AFM, showed
that copper nucleates according to instantaneous me-chanisms at pH 1. At pH 2 and 3, the mechanism was
inconclusive. In the presence of background electrolyte,
at pH 1 and 2 the mechanism of nucleation shifted from
Fig. 11. Copper nuclei morphology along the transient pathway after
(a) 3 s, (b) 6 s and (c) 10 s; 0.01 M Cu2�, pH 1.
D. Grujicic, B. Pesic / Electrochimica Acta 47 (2002) 2901�/29122910
progressive to instantaneous during electrodeposition.
At pH 3, the mechanism was purely progressive.
Acknowledgements
This work has been sponsored by the US Department
of Defense, Department of the Navy, Office of Naval
Research, Grant Number N000140110829.
References
[1] M. Schlesinger, M. Paunovic, Modern Electroplating, fourth ed.,
Wiley, New York, NY, 2000.
[2] A. Radisic, J.G. Long, P.M. Hoffmann, P.C. Searson, J.
Electrochem. Soc. 148 (1) (2001) C41.
[3] G. Oskam, P.M. Vereecken, P.C. Searson, J. Electrochem. Soc.
146 (4) (1999) 1436.
[4] A. Ramos, M.M. Hernandez, I. Gonzales, J. Electrochem. Soc.
148 (4) (2001) C315.
[5] C. Nila, I. Gonzales, J. Electroanal. Chem. 401 (1996) 171.
[6] D. Grujicic, B. Pesic, in preparation.
[7] J.L. Alvarez, J.A.G. Calzon, J.M.L. Fonseca, Electrochim. Acta
45 (1999) 477.
[8] A. Bettelheim, A. Raveh, U. Mor, R. Idgar, B. Segal, J.
Electrochem. Soc. 137 (10) (1990) 3151.
[9] D. Grujicic, B. Pesic, in preparation.
Fig. 12. (a�/a?) Actual current transients (symbols) at pH 1, 2 and 3 for solutions containing 1 M of sodium sulfate and 0.01 M Cu2� in comparison
to the theoretical models (lines). Deposition potential at �/450 mV.
Fig. 13. Effect of pH on morphology of copper nuclei in the presence
of 1.0 M Na2SO4 background electrolyte; (a) pH 1, (b) pH 2, (c) pH 3;
deposition potential �/450 mV; 0.01 M Cu2�.
Fig. 14. (a�/a?) Cottrell plots as a function of pH with (closed symbols)
and without (open symbols) background electrolyte. Data from related
chronoamperometry at �/450 mV deposition potential and 0.01 M
Cu2�.
D. Grujicic, B. Pesic / Electrochimica Acta 47 (2002) 2901�/2912 2911

[10] H.-H. Huang, STABCAL-Stability Calculation for Aqueous Sys-
tems, Montana Tech, The University of Montana, Butte, MT,
2002.
[11] Southampton Electrochemistry Group, in: T.J. Kemp (Ed.),
Instrumental Methods in Electrochemistry, Ellis Horwood Ltd,
Chichester, UK, 1985.
[12] B. Scharifker, G. Hills, Electrochim. Acta 28 (7) (1983) 879.
[13] M.P. Pardave, M.T. Ramirez, I. Gonzales, A. Serruya, B.R.
Scharifker, J. Electrochem. Soc. 143 (5) (1996) 1551.
[14] E. Gileadi, V. Tsionsky, J. Electrochem. Soc 147 (2) (2000) 567.
[15] M. Georgiadou, D. Vegret, R.L. Sani, R.C. Alkine, J. Electro-
chem. Soc. 148 (1) (2001) C54.
D. Grujicic, B. Pesic / Electrochimica Acta 47 (2002) 2901�/29122912


