
Di r ecci ó n:Di r ecci ó n: Biblioteca Central Dr. Luis F. Leloir, Facultad de Ciencias Exactas y Naturales, Universidad de Buenos Aires. Intendente Güiraldes 2160 - C1428EGA - Tel. (++54 +11) 4789-9293
Co nta cto :Co nta cto : [email protected]
Tesis Doctoral
Electrodos modificados y susElectrodos modificados y susaplicaciones en electrocatálisisaplicaciones en electrocatálisis
Völker, Edgar
2013
Este documento forma parte de la colección de tesis doctorales y de maestría de la BibliotecaCentral Dr. Luis Federico Leloir, disponible en digital.bl.fcen.uba.ar. Su utilización debe seracompañada por la cita bibliográfica con reconocimiento de la fuente.
This document is part of the doctoral theses collection of the Central Library Dr. Luis FedericoLeloir, available in digital.bl.fcen.uba.ar. It should be used accompanied by the correspondingcitation acknowledging the source.
Cita tipo APA:
Völker, Edgar. (2013). Electrodos modificados y sus aplicaciones en electrocatálisis. Facultadde Ciencias Exactas y Naturales. Universidad de Buenos Aires.
Cita tipo Chicago:
Völker, Edgar. "Electrodos modificados y sus aplicaciones en electrocatálisis". Facultad deCiencias Exactas y Naturales. Universidad de Buenos Aires. 2013.

UNIVERSIDAD DE BUENOS AIRES
Facultad de Ciencias Exactas y Naturales
Departamento de Química Inorgánica, Analítica y Química Física
Electrodos modificados y sus aplicaciones en electrocatálisis
Tesis presentada para optar al título de Doctor de la Universidad de Buenos Aires
en el área Química Inorgánica, Química Analítica y Química Física
Edgar Völker
Directores de tesis: Dr. Federico J. Williams; Dr. David J. Schiffrin
Consejero de Estudios: Dr. Darío Estrin
Lugares de Trabajo: DQIAyQF ‐ INQUIMAE, FCEyN, Universidad de Buenos Aires, Argentina.
Department of Chemistry, University of Liverpool, Reino Unido.
Buenos Aires, 2013


For Ana Inés


i
Acknowledgments
This thesis is dedicated to my beloved wife, Ana Inés. Without you at my side I could not have done this. Thank you for your patience, your encouragement and your joyfulness. You are the light of my life!
I also want to dedicate this thesis to the memory of my mother, who always supported me in everything I undertook and who taught me that there are many important things in life besides science. I miss you!
A huge thank you to Prof. Federico Williams for being the best advisor one could hope for. You were always there when I needed you and always with a word of encouragement. Thank you for making me bring this to conclusion!
Another huge thank you to Prof. David Schiffrin. You made my (and my wife’s) stay at Liverpool one of the best experiences of my life. Thank you for being an excellent tutor but also an outstanding human being. I will treasure your wise comments and your hospitality for years to come. Thanks also to Margery for her kind words and hospitality.
Thanks also to Prof. Ernesto Calvo, for letting me be a part of your group for so many years. Thank you for teaching me the basics of electrochemistry and so many other things. Without your help, this could not have been possible. Thank you also for being supportive when I needed it.
Thank you to CONICET for the scholarship that helped me through the first years of the PhD.
Many thanks to all my lab‐mates in Argentina, both past and present, there are too many to name them all! I want to thank especially Dr. Mario Tagliazucchi and Dr. Alejandra Ricci. Both of them are now pursuing other goals, but I remember fondly the time we spent together. Thank you for all your encouragement and kind help you gave me.
Thank you to all the Professors at the Inorganic Chemistry Department at the University of Buenos Aires, Argentina. Thank you for some fruitful discussions.
A big thank you to the Marie Curie Fellowships Programme, for letting me the opportunity to know first‐hand how science is done abroad.
A huge thank you to all the senior ELCAT members: Prof. Elisabet Ahlberg, Prof. David Schiffrin, Prof. Juan Feliú, Prof. Marc Koper, Prof. Timo Jacob, Dr. Sarah Horswell, Dr. Petr Krtil, Dr. Enrique Herrero, Dr. Rob Potter, Dr. Susanne Holmin. The amount of knowledge I gained from you is priceless. Thank you for transmitting your passion to the next generation of scientists. I had the greatest of time in all the ELCAT meetings.
To all my fellow ELCAT members: THANK YOU! I’ve finally made it too! Thank you all for your kindness, your passion, your knowledge and your good disposition to your fellow members. I will remember you all very fondly!

ii
Thanks to Prof. Timo Jacob and Prof. Peter Myers for their invaluable help with DFT calculations and GC experiments respectively. I learned a lot from you and I really appreciate it.
To all my lab‐mates at the University of Liverpool, a big thank you too. I’ve spent a great deal of time there and your help and knowledge was invaluable to me. Thank you Laura, Laura, Joanna, Maryam, Humaira, Dan and Claudio.
Thanks to all the Chemistry Department at the University of Liverpool for making my stay there a true pleasure. Thanks especially to Mr. Charles Clavering and Mr. Richard Dewson for your help with electronic equipment and with mechanical stuff, respectively. Also big thanks to Mr. Mike Chatterton for some help with the XRD measurements.
A huge, huge thank you to Prof. Mariano Bossi. You were the one that convinced me to follow up science and encouraged me at all times. You were always there with kind words of advice and helped me through many stages. Thank you, my dear friend!
Also big, big thanks to Dr. Julia Roberti. I actually cannot thank you enough for all your help these years. You know it’s been a long road, but I finally made it, in no small part thanks to you. Thank you for being so supportive and listening to my complaints (and also my success!). Keep up the excellent work you are doing in Heidelberg! Miss you a lot!
Thank you Paula Roberti for being there, both in good and not so good times. Your encouragement during these years is greatly appreciated.
Thanks also to Ana María, mostly for helping my wife during the first few months at Liverpool, when we were still settling down and I was doing long hours at the lab. But also thank you for being so supportive and kind.
Thanks to the rest of my family: Dad, Axel, his family, grandma and everybody else. Thanks for believing in me!
Finally, thank you Alexander! We are waiting for you!!!

iii
Resumen La investigación básica y aplicada en electrodos funcionalizados ha ido incrementándose en los últimos 30 años debido a su diversidad de aplicaciones en catálisis, óptica, electrónica, protección contra la corrosión, etc. Existen diversas maneras en las cuales se puede modificar un electrodo, ya sea por deposición de películas por spin o dip coating, adsorción de monocapas autoensambladas, drop casting, autoensamblado capa‐por‐capa, etc. En esta tesis estudiamos la modificación química controlada de superficies de electrodos y sus aplicaciones en reacciones electrocatalíticas y redox. Materiales diversos como Au, Cu, aleaciones Au‐Cu, polioxomolibdatos y polímeros redox fueron utilizados como electrodos funcionalizados. Estos materiales fueron caracterizados exhaustivamente y se estudiaron sus aplicaciones en reacciones electrocatalíticas de importancia en medio ambiente (reducción de CO2, nitritos, cloratos y peroxodisulfatos), así como también en reacciones redox. Durante esta tesis se desarrolló un nuevo método para la síntesis de nanoaleaciones Au‐Cu soportadas en negro de carbón. La síntesis produce nanopartículas aleadas, estables y robustas. Las nanopartículas Au‐Cu fueron caracterizadas por espectroscopía UV‐visible, DRX, ICP, XPS y HR‐TEM; que juntas dan evidencia que las partículas están realmente aleadas. En paralelo, se prepararon aleaciones Au‐Cu macizas que también fueron caracterizadas por diversas técnicas experimentales (DRX, ICP, XPS) y cuyas propiedades superficiales fueron estudiadas. Mediante XPS con resolución angular (ARXPS) se observó que, en ausencia de adsorbatos, la superficie de las aleaciones Au‐Cu está enriquecida en Au. Al exponer la aleación Au‐Cu a una atmósfera de O2 puro, la superficie se reorganiza y se enriquece en Cu, mostrando que los catalizadores no son estáticos ya que el medio en el que el electrodo está presente puede afectar su organización superficial. También hicimos cálculos DFT que corroboran ambas observaciones. Además, se estudió la segregación hacia la superficie de impurezas que se encontraban en el seno de los electrodos macizos. Encontramos que pequeñas concentraciones de impurezas que inevitablemente se encuentran en los materiales constitutivos de las aleaciones afectan a los sistemas macizos, pero dejan inalterados a los sistemas nanoparticulados. Se estudió la actividad electrocatalítica de electrodos macizos Au‐Cu con el foco en la reducción de CO2 hacia hidrocarburos y alcoholes. Encontramos que los electrodos macizos Au‐Cu reducen CO2 a CO pero sin conversión a productos líquidos. También se estudió la actividad catalítica orientada a la reducción de CO2 con nanopartículas Au‐Cu soportadas en negro de carbón depositadas en electrodos de carbono vítreo (GC). Mediante cromatografía líquida (LC‐UV) se detectó producción de etanol. También se funcionalizaron electrodos de Au con películas de polielectrolitos autoensamblados capa‐por‐capa modificados con aniones de polioxometalatos (POM). Las películas fueron caracterizadas por elipsometría, XPS, FTIR y microbalanza de cuarzo (QCM). Encontramos que hay una delaminación parcial de las películas autoensambladas al sumergirlas en solución, pero luego de esa primer delaminación la película remanente es estable y duradera. Las películas tienen buena actividad catalítica para la reducción de nitratos, cloratos y peroxodisulfatos. Por último, se estudiaron películas de polielectrolitos autoensambladas capa‐por‐capa modificadas con un complejo de Os que presenta una cupla redox, depositadas sobre sustratos de acero pasivado. Las películas fueron caracterizadas por elipsometría in situ y ex situ y por XPS. La respuesta electroquímica del complejo de Os fue estudiada. Encontramos que dicha respuesta es enlentecida debido a la transferencia electrónica a través de la capa pasiva. Se estimó que la constante de transferencia electrónica es de 4 a 6 órdenes de magnitud más lenta que para el mismo complejo de Os adsorbido sobre superficies de Au. El trabajo presentado en esta tesis muestra ejemplos relevantes de electrodos modificados químicamente, orientados a reacciones electrocatalíticas de importancia ambiental. Desarrollamos un método simple para la síntesis de nanopartículas Au‐Cu estables, duraderas y de composición controlada que sirven como catalizadores para la electroreducción de CO2. El conocimiento adquirido servirá para futuras investigaciones ya que mostramos que las nanoaleaciones Au‐Cu no sufren desactivación como los catalizadores basados puramente en Cu. También mostramos que moléculas grandes como los polioxomolibdatos pueden ser incorporados en películas autoensambladas capa‐por‐capa mediante intercambio iónico. Esto es un hallazgo importante ya que permite la funcionalización controlada de electrodos con estas moléculas de alta relevancia en el campo de la electrocatálisis. A pesar de las potenciales aplicaciones de películas de polielectrolitos autoensamblados capa‐por‐capa, existen pocas publicaciones de películas autoensambladas sobre superficies oxidadas. En esta tesis extendimos este concepto a superficies de relevancia industrial. Demostramos la capacidad de modificar superficies de acero pasivadas autoensamblando multicapas de polielectrolitos usando como sonda una molécula redox unida a la cadena de poli(alilamina). Por último, investigamos el proceso de

iv
transferencia electrónica entre el metal y el polímero de osmio a través de estados electrónicos en la película pasiva con un espesor mayor a la distancia de tuneleo directo. Palabras clave: electrodos modificados químicamente, nanoaleaciones, nanopartículas Au‐Cu, autoensamblado capa‐por‐capa, polioxomolibdatos, electrocatálisis, reducción de CO2.

v
Nanostructured films and electrodes and their applications in electrocatalysis Abstract Basic and applied research on functionalized electrodes have been constantly increasing in the last 30 years due to the diverse applications in catalysis, optics, electronics, corrosion protection, etc. There are diverse ways in which an electrode can be modified, such as film deposition via spin and dip coating, deposition of self‐assembled monolayers, drop casting, layer‐by‐layer self‐assembly (LbL), etc. In this thesis we studied the controlled chemical modification of electrode surfaces and their applications towards electrocatalytic and redox reactions. Different materials, such as Au, Cu, Au‐Cu alloys, polyoxomolybdates and redox polymers were used as functionalized electrodes. These materials were thoroughly characterized and their applications in the electrocatalysis of environmentally important reactions (CO2, nitrite, chlorate and peroxodisulfate reduction) as well as redox reactions were analysed. A new one‐step method for synthesizing Au‐Cu nanoalloys supported on carbon black was developed. Our synthetic approach yields stable, robust and truly alloyed metallic nanoparticles. Au‐Cu nanoparticles were characterized by UV‐Visible spectroscopy, XRD, ICP, XPS and HR‐TEM, which give evidence of true alloying in the particles. In parallel, Au‐Cu bulk alloys were prepared and thoroughly characterized with several experimental techniques (XRD, XPS, ICP) and their surface properties were studied. Firstly, it was observed via angle resolved XPS (ARXPS) that the surface of the Au‐Cu alloys are Au enriched in absence of any adsorbates. When subjected to an atmosphere of pure O2, the surface reorganizes and becomes Cu enriched, demonstrating that the environment is responsible for surface reorganizations and that catalysts are not static. We also carried out DFT calculations that corroborate both observations. Furthermore, segregation of bulk impurities was also studied. We found out that low concentration impurities that are inevitably present in the starting up materials affect bulk systems but not nanoparticulate systems. The catalytic activity of Au‐Cu bulk electrodes towards the reduction of CO2 into longer chain hydrocarbons and alcohols was studied. We found out that Au‐Cu bulk electrodes reduce CO2 into CO without the production of liquid products. Carbon black‐supported Au‐Cu nanoparticles were deposited onto glassy carbon (GC) electrodes and their catalytic activity towards CO2 reduction was studied. Ethanol production was detected using LC‐UV. Electrode functionalization was also achieved using the layer‐by‐layer technique. In this case, LbL self‐assembled polyelectrolyte films modified with polyoxometalates anions (POM) were deposited on Au substrates. The films were characterized with ellipsometry, XPS, FTIR and quartz crystal microbalance (QCM). We found that initially there is partial delamination of the films when submerged in solution, but after this first delamination, the remaining film is stable and durable. The films have good catalytic activity for the electroreduction of nitrite, chlorate and peroxodisulfate. Finally, LbL self‐assembled polyelectrolyte films modified with a redox active Os complex on passivated carbon steel substrates were studied. The films were characterized by in situ and ex situ ellipsometry and XPS. The electrochemical response of the Os complex was studied. We found that the response is slowed down by the sluggish electron transfer through the passive layer. The electron transfer rate constant was calculated to be 4 to 6 orders of magnitude slower than for the same Os complex attached to Au substrates. The work presented in this thesis shows relevant examples of chemically modified electrodes oriented toward electrocatalytic reactions of environmental importance. Firstly we developed a one‐step method for the synthesis of stable and robust Au‐Cu nanoparticles of controlled composition which serve as good catalysts for CO2 electroreduction. The knowledge gained will serve for future investigations as we have shown that Au‐Cu nanoalloys do not suffer from the deactivation observed on Cu‐based catalysts. We have also shown that large and important molecules such as polyoxomolybdates could be incorporated into LbL films via ion‐exchange. This is an important finding as it allows for the controlled functionalization of electrodes with these instrumental molecules. Despite the great potential applications of LbL self‐assembled polyelectrolyte films, there are only a few reports of LbL films on oxide‐covered surfaces. In this thesis we have extended this technology to industrially relevant surfaces. We demonstrated the feasibility of modifying a passive steel surfaces by LbL self‐assembling polyelectrolyte multilayers using as reporting molecule a redox osmium complex tethered to a poly(allylamine) backbone. Furthermore, we investigated the electron transfer process

vi
between the metal and the adsorbed osmium polymer through electronic states in the passive oxide film with a thickness larger than that of direct tunnelling distance. Keywords: chemically modified electrodes, nanoalloys, Au‐Cu nanoparticles, layer‐by‐layer self‐assembly, polyoxomolybdates, electrocatalysis, CO2 reduction.
vii
Table of Contents
Chapter 1 – Introduction
1.1 Electrode modification ………………………………………………………………………………………………………………. 3
1.2 Alloys …………………………………………………………………………………………………………………………………………. 4
1.2.1 Definitions …………………………………………………………………………………………………………………………. 4
1.2.2 Surface properties ……………………………………………………………………………………………..……………… 4
1.2.3 Nanoalloys ………………………………………………………………………………………………………………………… 5
1.3 Layer‐by‐layer self‐assembled electrodes ………………………………………………………………………………….. 6
1.4 Polyoxometalates ………………………………………………………………………………………………………………….….. 8
1.5 Electrocatalysis ………………………………………………………………………………………………………………….……. 11
1.5.1 Generalities …………………………………………………………………………………………………………………….. 11
1.5.2 Electroreduction of CO2 ……………………………………………………………………………………………….….. 12
1.5.3 Electroreduction of NO2‐, ClO3
‐ and S2O82‐ ………………………………………………………………………… 15
1.5.4 Polyoxometalates as electrocatalysts ………………………………………………………………………………. 16
1.6 Aims and outline of the Thesis ………………………………………………….…………………………………………….. 17
References ………………………………………………………………………………………………………………………….…………. 18
Chapter 2 – Experimental methods
2.1 Electrochemical methods ………………………………………………………………………………………….…………….. 25
2.1.1 Cyclic Voltammetry ………….……………………………………………………………………………………………... 26
2.1.2 Instrumentation ………………………………………………………………………………………….………………..…. 30
2.2 X‐ray Photoelectron Spectroscopy (XPS) ……………………………………………………………………………….... 31
2.2.1 Angle resolved XPS (ARXPS) …………………………………………………………………………………………..… 32
2.2.2 Instrumentation ………………………………………………………………………………………………………….…… 34
2.2.3 O2 dosing ………………………………………………………………………..………………………………………………. 35
2.3 Fourier transform infrared spectroscopy (FTIR) ………………………………………………………………..……… 38
2.3.1 Instrumentation ………………………………………………………………………………………………………..…….. 38
2.4 UV‐Visible spectroscopy ……………………………………………………………………………………………..……..……. 39
2.4.1 Instrumentation …………………………………………………………………………………….…………………..……. 39
2.5 Inductively coupled plasma optical emission spectroscopy (ICP‐OES) ……………………………………... 40

viii
2.5.1 Instrumentation …………………………………………………………………………………………………………..….. 40
2.6 Transmission Electron Microscopy (TEM) ………………………………………………………………………………… 40
2.6.1 Instrumentation …………………………………………………………………………………………….………………… 41
2.7 X‐ray Diffraction …………………………………………………………………………………………………………………….… 42
2.7.1 Instrumentation ……………………………………………………………………………………………………..……….. 44
2.8 Chromatography (Liquid and gas chromatography: LC, GC) ………………………………………………….…. 44
2.8.1 Instrumentation …………………………………………………………………………………………………………….… 45
2.9 Ellipsometry …………………………………………………………………………………………………………………………….. 45
2.9.1 Instrumentation …………………………………………………………………………………………………………….… 48
2.10 Quartz Crystal Microbalance (QCM) ………………………………………………………………………………………. 48
2.10.1 Instrumentation …………………………………………………………………………………………………………..… 49
2.11 Materials ……………………………………………………………………………………………………………………………….. 50
2.11.1 Solutions and reagents ………………………………………………………………………………………………..… 50
2.11.1 Electrode modification ………………………………………………………………………………………………..… 51
References ………………………………………………………………………………………………………………………….…………. 52
Chapter 3 – Au‐Cu bulk electrodes and its application for electroreduction of
CO2
3.1 Introduction …………………………………………………………………………………………………………………………….. 57
3.2 O2 induced Cu surface segregation in Au‐Cu bulk alloys …………………………………………………………… 58
3.2.1 Sample preparation and characterization ………………………………………………………………….…….. 58
3.2.2 Au surface segregation on Au‐Cu alloys in UHV …………………………..…………………………..…….. 59
3.2.3 Effects of O2 exposure ………………………………………………………………..……………………………………. 61
3.2.4 DFT calculations ………………………………………………………………………………………..…………………….. 65
3.2.5 Discussion ………………………………………………………………………………………………………………………… 66
3.2.6 Conclusions ……………………………………………………………………………………………………………………… 68
3.3 Temperature‐induced surface segregation of impurities on Au‐Cu bulk electrodes …………………. 69
3.3.1 Temperature dependent ARXPS experiments – segregation of impurities on a Au‐Cu bulk
electrode ………………………………………………………………………………………………………………………………….. 69
3.3.2 DFT modelling ………………………………………………………………………………………………………………….. 72
3.3.3 Discussion ………………………………………………………………………………………………………………………… 73
3.3.4 Conclusions ………………………………………………………………………………………………………….………….. 74

ix
3.4 Electroreduction of CO2 with Au‐Cu bulk electrodes ………………………………….……………………………. 75
3.4.1 Introduction …………………………………………………………………………………………………………………….. 75
3.4.2 Sample preparation and characterization ………………………………………………………………………... 75
3.4.3 Electrochemical cells used for CO2 reduction ……………………………………………………….………….. 76
3.4.4 Electroreduction of CO2 …………………………………………………………………………………………….…….. 78
3.5 Final Comments ………………………………………………………………………………………………………………………. 80
References ………………………………………………………………………………………………………………………….…………. 82
Chapter 4 – Au‐Cu alloy nanoparticles supported on carbon black and their
application for electroreduction of CO2
4.1 Introduction …………………………………………………………………………………………………………………………..… 89
4.2 Synthesis and characterization of Au‐Cu nanoparticles ……………………………………………………………. 89
4.2.1 Synthesis ………………………………………………………………………………………………………………….……… 89
4.2.2 Sample characterization …………………………………………………………………………………..……………… 90
4.3 Electroreduction of CO2 with Au‐Cu alloy nanoparticles supported on carbon black ……………..… 94
4.3.1 Electrodes and electrochemical cells used for CO2 reduction ………………………………….………. 94
4.3.2 Electroreduction of CO2 …………………………………………………………………………………………..………. 95
4.4 Conclusions ……………………………………………………………………………………………………………………………. 100
References ………………………………………………………………………………………………………………………….………. 101
Chapter 5 – Layer‐by‐layer self‐assembled films containing polyoxo‐
molybdates over Au surfaces
5.1 Introduction ……………………………………………………………………………………………………………………….…. 105
5.2 Sample preparation and characterization ……………………………………………………………………………... 106
5.3 Stability of films containing POM …………………………………………………………………………………………... 113
5.4 Electrochemical behaviour of LbL films containing POM anions …………………………………………….. 115
5.5 Electrocatalytic activity of LbL films containing POM anions ………………………………………………….. 118
5.6 Conclusions ……………………………………………………………………………………………………………………………. 119
References ………………………………………………………………………………………………………………………….………. 121

x
Chapter 6 – Layer‐by‐Layer self‐assembled redox polyelectrolytes on passive
steel
6.1 Introduction …………………………………………………………………………………………………………………………… 127
6.2 Electrode modification ………………………………………………………………………………………………………….. 127
6.3 X‐ray Photoelectron Spectroscopy of self‐assembled films on passive steel ………………………….. 128
6.4 Ellipsometric characterization of self‐assembled films on passive steel …………………………………. 131
6.5 Electrochemical properties of self‐assembled PAH‐Os/PVS films on passive steel …………………. 135
6.6 Conclusions ……………………………………………………………………………………………………………………………. 137
References ………………………………………………………………………………………………………………………….………. 138
Chapter 7 – Conclusions and future outlook
7.1 General conclusions ………………………………………………………………………………………………………………. 143
7.1 Future outlook ………………………………………………………………………………………………………………………. 145
References ………………………………………………………………………………………………………………………….………. 147

Chapter 1
Introduction


Introduction 3
This Thesis deals with chemical modification of electrode surfaces and their applications towards
electrocatalytic and redox reactions. Different materials, such as Au, Cu, Au‐Cu alloys,
polyoxomolybdates and redox polymers were used as functionalized electrodes, were thoroughly
characterized and their application for electrocatalysis (carbon dioxide, nitrite, chlorate and
peroxodisulfate reduction) as well as redox reactions was analysed. The work is experimental by
nature and new methods of nanoparticle synthesis and layer‐by‐layer self‐assembly methods were
developed and will be presented here. This work opens up many new possibilities in the field of
nanostructured films and modified surfaces.
1.1 – Electrode modification
The surface of an object is of critical importance in chemical reactions and determines many
properties such as catalytic activity, corrosion resistance, hydrophobicity, optical properties, etc.
Even though the surface atoms in a macroscopic object are only about 1 in 100 000 000,1 they are
the ones responsible for the interaction with the environment and for the properties listed above, so
it is imperative to have a clear understanding of the surface properties of an object.
In many cases, the original surface properties of a material are not adequate for certain applications.
If the material in question is a metal, a solution to this problem could be to alloy it with a second
metal in a way that their enhanced properties could address the needs. Another option could be
modifying the existing surface with a layer of a different composition. Previously, surface
modification was based on thick coatings, whose final aim was to decorate, or at most, protect
against corrosion. On the first half of the 20th century physical adsorption of molecules on surfaces
was studied2 followed then by covalent union modification of surfaces.3 By the end of the 20th
century, nanotechnology introduced a whole new set of techniques useful for the modification and
study of thin films (such as scanning microscopy techniques)4, and this brought a new breath into the
field, with several new methods for surface modification.

4 Introduction
1.2 – Alloys
1.2.1 Definitions
An alloy is a mixture or metallic solid solution composed of two or more elements, at least one of
which is a metal. Alloys usually have different properties from those of the component elements. For
example, some alloys possess high strength, others have low melting temperatures, some are
especially resistant to corrosion, and others have desirable magnetic, thermal, or electrical
properties. Brass is an alloy made with copper and zinc. Steel is an alloy made with iron and carbon,
a non‐metal. Alloy steels are made by alloying steel with other metals; for example, stainless steel is
a chromium‐nickel steel.
Historically, alloys have been known for a long time. In fact, the “Bronze Age” was named after the
bronze alloy, an alloy of copper and tin which makes it appreciably harder than copper alone.
Another example is brass, an alloy of copper and zinc with improved properties regarding casting,
corrosion resistance, etc. Brass was known since 3rd millennium BC, samples were found in the
Middle East region.5
Alloys are usually classified as substitutional or interstitial alloys, depending on the atomic
arrangement that forms the alloy. They can be further classified as homogeneous (consisting of a
single phase), or heterogeneous (consisting of two or more phases) or intermetallic (where there is
no distinct boundary between phases).6
Gold alloys readily with copper forming solid solutions, since their atomic radii are relatively similar
(1.442 Å for Au and 1.278 Å for Cu).7 They form ordered phases in the Au3Cu, AuCu and AuCu3
compositions.8
1.2.2 Surface properties
The surface atomic structure of a material plays a crucial role in several applications, one of them
being heterogeneous catalysis, where a large number of catalysts (for instance automotive exhaust
converters) are multimetallic and where synergistic effects due to the interaction at atomic level of
the two (or more) active metal species at the surface are believed to be significant.9, 10 Other areas of
technological interest for multimetallic surfaces are, for instance, corrosion and hardening.
One of the factors that affect the surface composition of an alloy and that is of critical importance
for (electro)catalysis is surface segregation. This happens when the chemical composition in the bulk
of the alloy differs from that of the surface due to the selective segregation of one of the

Introduction 5
components of the alloy to the surface. The driving force for this phenomenon is the minimization of
the surface free energy of the system, or, when in the presence of reactants, it could be caused by
relative affinity of one of the alloy components towards key reactive intermediates.11 No matter the
cause, it could be critical to the desired (electro)catalytic reaction so it is important to understand its
effect.
1.2.3 Nanoalloys
As the surface of an alloy is of critical importance in (electro)catalysis, the best way to minimize the
amount of material is to use nanoalloys, that is alloy materials in the nanometre range. Also, their
chemical and physical properties may be tuned by varying the composition and atomic ordering as
well as the size of the particles.12 Nanoalloys are also of interest as they may display properties
which are distinct from the corresponding bulk alloys due to finite size effects, e.g., there are
examples of pairs of elements (such as iron and silver) which are immiscible in the bulk but readily
mix in finite clusters.13 This field of materials chemistry has been growing in the last 10‐15 years, and
their use has not only been limited to the field of catalysis,14 but also optoelectronics,15 magnetism,16
and even medical applications.17
Nanoalloys may also show segregation effects. The segregation in AmBn nanoalloys may depend on
several factors. Here we name the most important ones:12
(1) Relative strengths of A‐A, B‐B, and A‐B bonds. To a first approximation, if A‐B bonds are
strongest, this favours mixing; otherwise, segregation is favoured, with the species forming strongest
homonuclear bonds tending to be at the centre (core) of the cluster.
(2) Surface energies of bulk elements A and B. The element with lowest surface energy tends to
segregate to the surface.
(3) Relative atomic sizes. Smaller atoms tend to occupy the more sterically confined core.
(4) Strength of binding to surface ligands (surfactants). For supported nanoparticles, the element
that binds most strongly to the support or ligands may be pulled out toward the surface.
The observed atomic arrangement for a particular AmBn nanoalloy depends critically on the balance
of the factors outlined above as well as on the preparation method and experimental conditions.
It is common practice to protect the nanoparticles with a ligand shell as this avoids coalescence at
high cluster densities. Two types of stabilization can be distinguished:18 electrostatic stabilization
due to coulombic repulsion between nanoparticles, arising from the electrical double layer of ions
adsorbed at the particle surface (e.g., when preparing sodium citrate gold sols), and steric
6 Introduction
stabilization due to the coordination of bulky organic molecules, such as polymers, block
copolymers, bulky P, N, and S donors, etc.
For catalytic applications, it is usual to deposit the nanoalloys onto a substrate such as carbon black,
which is an amorphous conductive carbon powder which acts as support for the nanoparticles on an
electrode. Carbon black usually has a very large surface area (200 – 300 m2 g‐1),19 which is useful for
electrocatalytic applications.
1.3 Layer‐by‐layer self‐assembled electrodes
The layer‐by‐layer (LbL) method for preparing thin films on substrates is based on the alternate
adsorption of macromolecules (such as polyelectrolytes, dendrimers, enzymes, etc.). This was shown
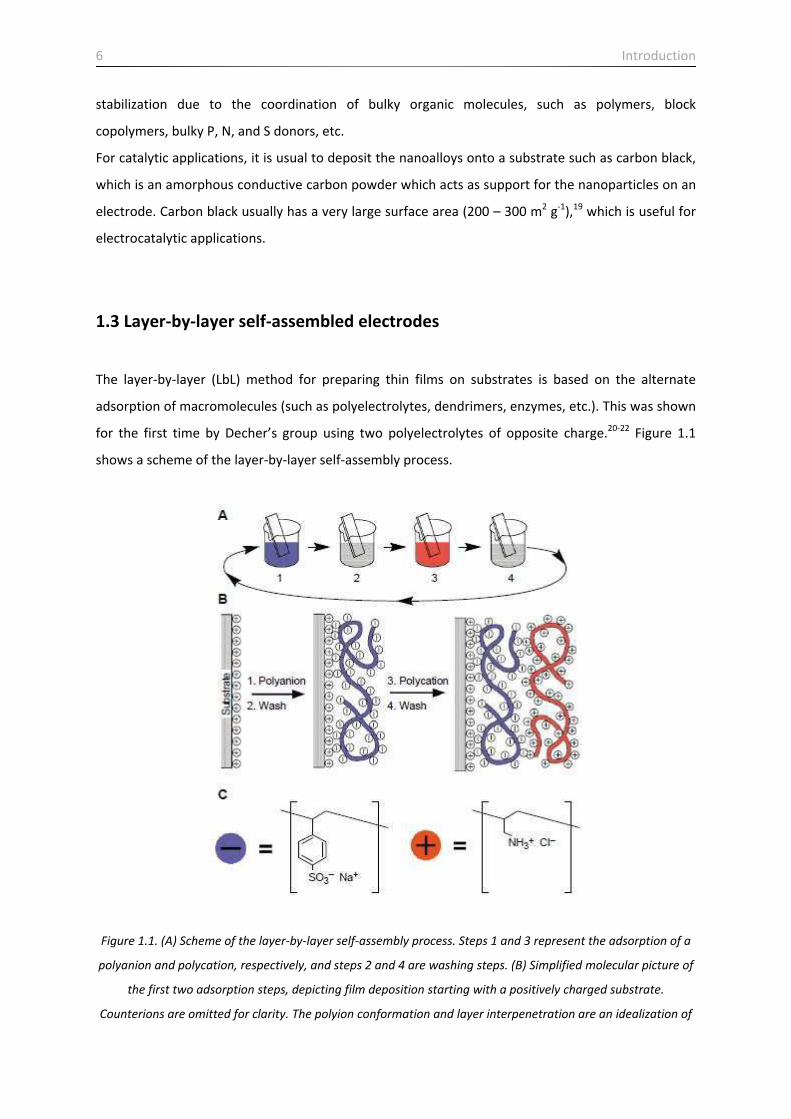
for the first time by Decher’s group using two polyelectrolytes of opposite charge.20‐22 Figure 1.1
shows a scheme of the layer‐by‐layer self‐assembly process.
Figure 1.1. (A) Scheme of the layer‐by‐layer self‐assembly process. Steps 1 and 3 represent the adsorption of a
polyanion and polycation, respectively, and steps 2 and 4 are washing steps. (B) Simplified molecular picture of
the first two adsorption steps, depicting film deposition starting with a positively charged substrate.
Counterions are omitted for clarity. The polyion conformation and layer interpenetration are an idealization of

Introduction 7
the surface charge reversal with each adsorption step. (C) Chemical structures of two typical polyions, the
sodium salt of poly(styrene sulfonate) and poly(allylamine hydrochloride. Taken from ref. 22
The process starts with a charged substrate (in the case of the figure, a positively charged substrate)
of arbitrary size and shape. Some substrates like glass and metal oxides have a permanent superficial
charge, whereas other types of substrate require a chemical treatment. For example, charged thiols
can be employed over Au surfaces or sylanes on ITO glass. The charged substrate is introduced in the
solution of the oppositely charged polyelectrolyte (in the case of Figure 1.1 A, the negatively charged
polyelectrolyte, the polyanion) for 15‐20 minutes. After this, the polymer is adsorbed onto the
surface and the electrostatic charge is inversed. The substrate is then washed thoroughly with water
to remove any partially adsorbed polymers, and then it is immersed in the oppositely charged
polyelectrolyte solution (in the case of Figure 1.1 A, the positively charged polyelectrolyte, the
polycation) for another 15‐20 minutes, after which the new polymer is adsorbed and the
electrostatic charge is inversed again. The process is repeated in sequence until one obtains the film
with the desired thickness. The thickness increase of each adsorbed layer is generally in the order of
0.1 – 10 nm, so the films obtained are nanostructured.
The simplicity and versatility of the LbL self‐assembly method has made it one of the most successful
tools for electrode modification of the last 20 years. The materials used as build‐up for self‐assembly
is not limited to polyelectrolytes, but includes dendrimers,23 enzymes,24 nanoparticles,25 inorganic
macroions26 and practically any kind of macromolecule.
Another concept which is closely related to the self‐assembly process is that of ionic exchange. This
was introduced by Rubner and co‐workers when they used polyelectrolyte self‐assembled films as
reactor sites for nanoparticle growth.27, 28 The polyelectrolytes used, poly(allylamine hydrochloride)
(PAH, the polycation) and poly(acrylic acid) (PAA, the polyanion) are called “weak” polyelectrolytes,
in the sense that their protonation depends on the pH solution from which they are deposited. By
adjusting the pH, they were able to control the number of free carboxylic acid groups present in
multilayer thin films: most of the ionized acid groups end up forming ion pairs with the cationic
groups of PAH. The remaining non‐ionized carboxylic acid groups, however, are available for
subsequent ionic exchange with oppositely charged species. That is the concept of self‐assembly by
ionic exchange.

8 Introduction
1.4 Polyoxometalates
Polyoxometalates constitute a large category of coordination‐type salts and free acids with each
member containing a complex and high molecular weight anion. In these anions, two to eighteen
hexavalent molybdenum atoms (addenda atoms) surround one or more central atoms
(heteroatoms). Tungsten, vanadium, and to a lesser degree niobium, tantalum and transition metals
can replace some of the molybdenum atoms in the polyoxometalates structure. Some examples are:
岷PMoな2O4ど峅戴貸 岷SiWな2O4ど峅替貸 岷TeMo6O24峅滞貸
where P袋泰, Si袋替, Te髪6 are the central atoms (heteroatoms), respectively.
Polyoxometalates have been used in a large number of applications, including catalysis,29
electrochemistry,30 medicine,31 corrosion protection,32 etc.
Polyoxometalates can take on several different structures. The addenda atoms like Mo or W (M)
make up the framework by combining with oxide ions and forming polyhedral units (MOx) with x = 4,
5, 6 or 7.These units share edges and/or vertices between them.
The framework usually contains a central heteroatom (like P or Si) which, depending on its
coordination number can combine with a different number of oxide ions.
The arrangement of the MOx polyhedra and the central heteroatom gives rise to numerous
polyoxometalate structures that have been discovered over the years. Table 1.1 shows some
examples of some of the most well‐known structures and their general formulas.

Introduction 9
Table 1.1. Structures of common polyoxometalate structures. Pictures taken from33
Of these structures, the Keggin structure [XM12O40]n‐ is the most well‐known and thoroughly
researched. In 1934 Keggin determined the structure of a‐Keggin anions using X‐ray diffraction
experiments.34 The Keggin structure is one of the most stable and widely available polyoxometalate.
It has a diameter of ca. 1 nm and is comprised of a central tetrahedron, XO4, encompassed by 12
edge and corner sharing metal octahedra, MO6 (Figure 1.2).35

10 Introduction
Figure 1.2. Keggin structure. The heteroatom (purple) can be seen in the centre of the tetrahedron it forms with
the 4 surrounding oxygen atoms (red). The addenda atoms are depicted in blue. Image taken from33
There are in total 40 close packed O atoms with four M3O13 groups made up of bridging M‐O‐M
bonds between the octahedra, 12 terminal M=O bonds and the four internal X‐O‐M bonds that make
up the tetrahedral centre (Figure 1.3).
Figure 1.3. [PW12O40]3‐ molecular structure illustrating the various forms of oxygen bonding present within a
Keggin structure (W = M, P = X). The same structure holds for [PMo12O40]3‐
Introduction 11
1.5 Electrocatalysis
1.5.1 Generalities
The concept of electrocatalysis is applied to electrochemical reactions that start from a dissociative
chemisorption or a reaction step in which the electrode surface is involved. In that sense,
electrocatalysis and heterogeneous catalysis have some common characteristics: (i) the substrate
(electrode) activity depends on its electronic structure; (ii) substrate–adsorbate interactions due to
either reactants or products are relevant; (iii) rate processes are sensitive to both the aspect ratio of
catalyst particles and the mean coordination number of surface atoms; and (iv) the electrocatalyst
lifetime depends on poisoning effects due to the accumulation of byproducts as well as particle
surface sintering and ripening phenomena at the electrode.36
On the other hand, there are some key differences between heterogeneous catalysis and
electrocatalysis due to the presence of the electrochemical double layer at the electrode–electrolyte
interface, and the influence of the applied potential on the reaction rate and the change in the
composition of the solution side of the electrochemical double layer and the concentration of
intermediates and products of reaction there. These are specific features of electrocatalysis that
make the activation energy of electrocatalytic reactions depend considerably on the applied
potential. Thus, the electrode potential is an important adjustable variable that can produce
dramatic changes in the rate of the electrocatalytic reactions.36, 37
In recent years there has been a renewed interest in the field of electrocatalysis, mainly due to the
development of electrocatalysts for fuel cells. Energy production with fuel cells involves the
electrocatalytic oxidation of a fuel (hydrogen or small alcohols) and the reduction of oxygen at the
cathode. The latter reaction has elicited a lot of interest in the development of new catalysts,
possibly noble‐metal free,38 in order to reduce the overpotential (the potential below the
equilibrium potential which is needed for the reduction to proceed) and therefore the energy losses
of the process.39 On the other side of the spectrum, electrocatalysis is also concerned with the
conversion of small molecules into valuable or harmless products. This is the case of the cathodic
reactions that will be studied in this Thesis: carbon dioxide (CO2), nitrite (NO2‐), chlorate (ClO3
‐) and
peroxodisulfate (S2O82‐) reduction.

12 Introduction
1.5.2 Electroreduction of CO2
Significant reductions in carbon dioxide emissions and the development of nonfossil fuel energy
sources are critical to minimize the effects of CO2 as a greenhouse gas in the atmosphere and reduce
the world economies dependence on nonrenewable energy sources such as crude oil.40 Studies by
the Intergovernmental Panel on Climate Change (IPCC) show that to stabilize the atmospheric
concentration of CO2 at 350‐400 ppm and limit the global mean temperature increase to 2.0‐2.4 oC,
global CO2 emissions in 2050 would have to be reduced by 50‐80% of the emission levels in the year
2000.41 Several strategies have been proposed as a strategy to decrease the accumulation of CO2 in
the atmosphere such as: carbon capture and sequestration (although this technology would not
address the problem of non‐renewable energy sources);42 the production of biofuels from algae and
woody biomass;43 and the use of wind, solar and tidal power.44 All of these technologies show some
promise, although at this point it is too early to tell which of these strategies are technologically
feasible and make economic and practical sense.
Another avenue that has been studied for the last 20 years is the direct electrochemical reduction of
CO2. It has already been shown that several products can be produced, including formic acid, carbon
monoxide, methane, ethylene, and alcohols.45 These products can be used as commodity chemicals
as well as fuels, thus allowing CO2 to be recycled into compounds that can act as energy carriers. The
key requirement, of course, is that the electricity used to convert the CO2 must be renewable, or at
least from a carbon‐neutral source such as nuclear; otherwise, more CO2 would be emitted in
producing the electricity than would be reduced in the process. The electrochemical conversion of
CO2 has great potential to help overcome several of the challenges facing the implementation of
carbon‐neutral energy sources because it provides a means of storing renewable electricity in a
convenient, high‐energy‐density form.
Copper is unique among metal electrodes for CO2 reduction as it is the only one able to produce
hydrocarbons at significant current densities. High hydrogen overvoltage electrodes with negligible
CO adsorption (such as Hg, Cd, Pb, Ti, In and Sn) can reduce CO2 with a high current efficiency.
However, these metals are poor catalysts in the sense that the primary product is formate (i.e. there
is no breaking of the carbon–oxygen bond of CO2). At the low hydrogen overvoltage metals with a
high CO adsorption strength (such as Pt, Ni, Fe and Ti) CO2 is reduced to form tightly adsorbed CO.
Because of the low turnover of the adsorbed CO the principal product is hydrogen. The electrode
materials with a medium hydrogen overvoltage and a weak CO adsorption, catalyse the breaking of
the carbon–oxygen bond in CO2, but allow the CO to desorb. These include Au, Ag, Zn and Cu, with
Introduction 13
Au, Ag and Zn producing CO with high current efficiencies, but with Cu being able to further react CO
to more reduced species in significant amounts.45
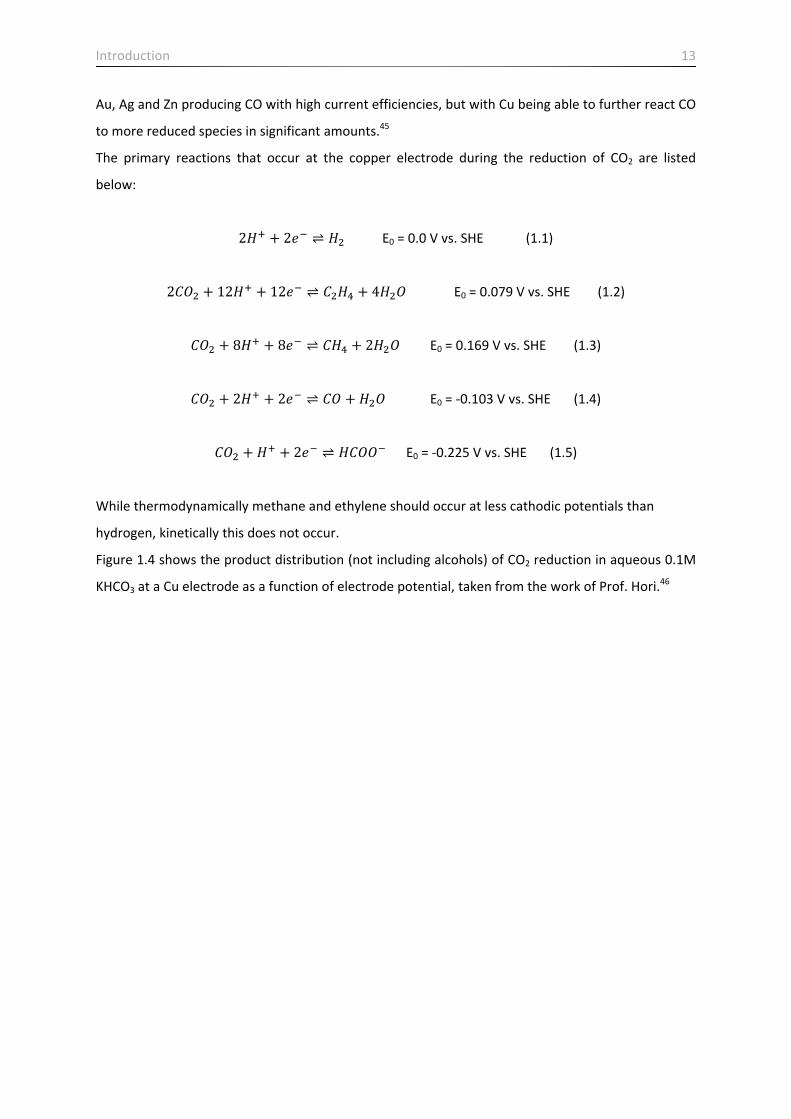
The primary reactions that occur at the copper electrode during the reduction of CO2 are listed
below:
2茎袋 髪 2結貸 ⇌ 茎態 E0 = 0.0 V vs. SHE (1.1)
2系頚態 髪 な2茎袋 髪 な2結貸 ⇌ 系態茎替 髪 4茎態頚 E0 = 0.079 V vs. SHE (1.2)
系頚態 髪 ぱ茎袋 髪 ぱ結貸 ⇌ 系茎替 髪 2茎態頚 E0 = 0.169 V vs. SHE (1.3)
系頚態 髪 2茎袋 髪 2結貸 ⇌ 系頚 髪 茎態頚 E0 = ‐0.103 V vs. SHE (1.4)
系頚態 髪 茎袋 髪 2結貸 ⇌ 茎系頚頚貸 E0 = ‐0.225 V vs. SHE (1.5)
While thermodynamically methane and ethylene should occur at less cathodic potentials than
hydrogen, kinetically this does not occur.
Figure 1.4 shows the product distribution (not including alcohols) of CO2 reduction in aqueous 0.1M
KHCO3 at a Cu electrode as a function of electrode potential, taken from the work of Prof. Hori.46

14 Introduction
Figure 1.4. Product distribution (below) and total current produced (above) as a function of applied potential
(versus reversible hydrogen electrode, RHE) in the electrochemical reduction of CO2 at a copper electrode in 0.1
M KHCO3 (pH 6.8) at 18.5 oC, as measured by Hori et al46
The faradaic yields of CO and HCOO‐ rise at ‐0.9 V, reaching a maximum between ‐1.2 and ‐1.25 V
(vs. SHE), and drop at more cathodic potentials. C2H4 begins to increase at ‐1.1 V; CH4 starts at ‐1.2 V,
rising steeply with the potential. These features suggest that CO and HCOO‐ may be precursors to
hydrocarbons and alcohols.
HCOO‐ is not reduced at all at Cu electrodes, whereas CO is electrochemically reduced to
hydrocarbons and alcohols with a similar product distribution with CO2 reduction. Infrared
spectroscopic measurements show that CO is adsorbed on a Cu electrode in CO2 saturated
electrolytic solution.47 These facts verify that CO is intermediately formed during CO2 reduction at Cu
electrodes and further reduced to hydrocarbons and alcohols.
A question arises: why is Cu the only metal electrode capable of yielding hydrocarbons and alcohols
from CO2 reduction? The reason has not yet been fully elucidated, but a possible explanation is given
below.

Introduction 15
Au, Cu, Ni and Pt electrodes yield CO from CO2, and it was already stated that CO is a key
intermediate in the hydrocarbon production pathway of CO2 reduction. Table 1.2 compares the
electrocatalytic activities of these metals during the reduction of CO and the heat of adsorption of
CO.
Faradaic efficiency (% )
Electrode Potential
(V vs. SHE)
CH4 C2H4 Other HCs
and
alcohols
H2 CO heat of
adsorption
(Kcal mol‐1)
Au ‐1.49 0.0 0.0 0.0 101.6 9.2
Cu ‐1.40 16.3 21.2 12.5 45.5 17.7
Ni ‐1.46 2.6 0.3 0.7 94.2 40.8
Pt ‐1.29 0.1 0.0 0.0 96.8 46.6
Table 1.2. Electrochemical reduction of CO in 0.1 M KHCO3 at various metal electrodes. Product distribution and
its relation with CO heat of adsorption. From ref.47
On the basis of the heats of adsorption, CO will scarcely interact with Au surface. Thus CO will not be
reduced at Au. Ni and Pt have high heats of adsorption, and adsorb CO strongly. CO, highly stabilized
on the surface, cannot be further reduced. The heat of adsorption of Cu is intermediate among these
metals, leading to CO adsorption with moderate strength; CO is effectively reduced to hydrocarbons
at Cu.48
One of the drawbacks of Cu electrodes is their tendency to easily become oxidized, thus limiting
their usefulness as electrocatalysts for CO2 reduction. As stated above, Au is capable of reducing CO2
to CO, which is a key intermediate in the production of hydrocarbons from CO2 reduction. Thus, by
alloying Cu with Au, one could extend the lifetime of the electrode by avoiding early electrode
oxidation and possibly also increase the production of hydrocarbons via the increased production of
CO driven by the extra Au content. This is the key motivator for Chapters 3 and 4 of this Thesis,
where Au‐Cu alloys are studied both in bulk and nanoparticle form.
1.5.3 Electroreduction of NO2‐, ClO3
‐ and S2O82‐
The electroreduction of nitrite, chlorate and peroxodisulfate were used as analytes for the feasibility
of using the chemically modified electrodes discussed in Chapter 5 of this Thesis as electrocatalysts.

16 Introduction
Their electrochemical properties were thus not studied in details and only a brief discussion will be
presented here.
NO2‐ is a well‐known substance which can induce methemoglobinemia and react with secondary and
tertiary amines forming carcinogenic nitrosamines.33 Therefore, the detection of nitrite in biological
denitrification, acid rain, and industrial waste is of critical importance.37 The direct electroreduction
of nitrite requires a large overpotential at most bare electrode surfaces, that is why several studies
have been made on modified electrodes to electroreduce NO2‐. Since the sulphur compounds play
key roles in a number of pathways and biogeochemical processes, the determination of sulphur
oxoanions is important for industry, medicine and the environment.
1.5.4 Polyoxometalates as electrocatalysts
Polyoxometalates attached to electrode surfaces have been used as electrocatalysts for these
species, as well as for hydrogen evolution reaction, oxygen and hydrogen peroxide reduction. A large
number of heteropolyanions undergo a series of reversible one‐ and two‐electron reductions, and
the reduced heteropolyanions (so‐called “heteropolyblue”) are the active species.
Three methods have been commonly used to immobilize polyoxometalates onto the electrode
surface:
1) Adsorption of polyoxometalates on the electrode surface by dip coating. Glassy carbon,49
graphite,49 Au50 and Hg51 are some of the electrode materials onto which polyoxometalates
spontaneously bind.
2) Entrapping polyoxometalates into polymers on the electrode surface. This can be done in several
different ways: electrostatic layer‐by‐layer self‐assembly of polyoxomolybdate and a polycation52 or
by simultaneous53, 54 or alternate55 electropolimerization and adsorption of polyoxomolybdates.
3) Electrodeposition of polyoxometalates onto the electrode surface within the polyoxometalate
solution under constant potential at ‐1.2 V vs. SCE.56
None of the works published so far has discussed the possibility of layer‐by‐layer self‐assembling a
polyectrolyte film on Au substrates and then modify them with polyoxometalates via ionic exchange.
This is what was done in this Thesis and the electrocatalytic response of the modified electrodes is
compared to those of the existing literature.

Introduction 17
1.6 Aims and outline of the Thesis
The main aim of this work is to develop and characterize new electrode materials and modified
electrodes and study their applicability in the field of electrocatalytic reactions. As these are relevant
topics in present day materials science, three key aspects have been taken as examples and have
been studied.
1 – Au‐Cu alloys both in bulk and nanoparticles, and their applicability for their use in the
electroreduction of CO2. Chapter 3 deals with Au‐Cu bulk alloys, with aims to obtain a clearer
understanding of the alloying characteristics and the surface properties when in presence of
different adsorbates and impurities. A comparison is made with nanoparticulate systems. Chapter 4
deals with nanoparticulate Au‐Cu alloys supported on carbon black with a focus on the synthesis and
characterization of the nanoparticles, as a novel way of synthesizing Au‐Cu nanoparticles was
developed. Their applicability in the electroreduction of CO2 was assayed.
2 – Layer‐by‐layer self‐assembled polyelectrolyte films modified with polyoxometalates via ionic
exchange and their use as electrocatalysts for NO2‐, ClO3
‐ and S2O82‐ reduction. Chapter 5 explains all
the development and characterization of these films on Au substrates, their effect with pH and their
feasibility as electrocatalysts. The novelty of these modified electrodes is the way the
polyoxometalate is incorporated, via ionic exchange. They were thoroughly characterized and their
electrocatalytic response was compared to other types of polyoxometalate‐modified electrodes.
3 – Layer‐by‐layer self‐assembled redox polyelectrolyte films on carbon steel. Chapter 6 focuses on
the conditions required for self‐assembling redox polyelectrolytes on carbon steel, with a thorough
characterization of the films and their possible applications for corrosion protection.
The three cases studied are very rich and varied and the conclusions that can be extracted from
analysing them can be very enlightening and might enrich the subject of both materials and catalysis
science.

18 Introduction
References
1. Sergeev, G.B. Nanochemistry. Elsevier, Amsterdam, (2006).
2. Langmuir, I. Surface Chemistry. (1932).
http://nobelprize.org/nobel_prizes/chemistry/laureates/1932/langmuir‐lecture.pdf
3. Murray, R.W. Chemically Modified Electrodes. Acc. Chem. Res. (1980) 13, 135‐141.
4. Binning, G.; Rohrer, H.; Gerber, C.; Weibel, E. Surface Studies by Scanning Tunneling
Microscopy. Phys. Rev. Lett. (1982) 49, 57‐61.
5. Thornton, C.P. Of brass and bronze in prehistoric southwest Asia, in Metals and mines:
Studies in archaeometallurgy. Eds.La Niece, S.; D. Hook; P.T. Craddock. Archetype
Publications: London, (2007).
6. Habashi, F. Introduction, in Alloys ‐ Preparations, Properties, Applications. Ed.Habashi, F.
Wiley‐VCH: Weinheim, (1998).
7. Emsley, J. The Elements. Clarendon Press, Oxford, (1989).
8. Renner, H. Precious Metals, in Alloys ‐ Preparations, Properties, Applications. Ed.Habashi, F.
Wiley‐VCH: Weinheim, (1998).
9. Campbell, C.T. Bimetallic Surface Chemistry. Annu. Rev. Phys. Chem. (1990) 41, 775‐837.
10. Nieuwenhuys, B.E. The chemical properties of alloy single crystal surfaces. Chem. Phys. Solid
Surf. (1993) 6, 185‐224.
11. Nilekar, A.U.; Ruban, A.V.; Mavrikakis, M. Surface segregation energies in low‐index open
surfaces of bimetallic transition metal alloys. Surf. Sci. (2009) 603, 91‐96.
12. Ferrando, R.; Jellinek, J.; Johnston, R.L. Nanoalloys: From Theory to Applications of Alloy
Clusters and Nanoparticles. Chem. Rev. (2008) 108, 845‐910.
13. Andrews, M.P.; O'Brien, S.C. Gas‐phase "molecular alloys" of bulk immiscible elements: iron‐
silver (FexAgy). J. Phys. Chem. (1992) 96, 8233‐8241.
14. Russell, A.E.; Rose, A. X‐ray Absorption Spectroscopy of Low Temperature Fuel Cell Catalysts.
Chem. Rev. (2004) 104, 4613‐4636.
15. Hodak, J.H.; Henglein, A.; Giersig, M.; Hartland, G.V. Laser‐Induced Inter‐Diffusion in AuAg
Core−Shell Nanoparピcles. J. Phys. Chem. B (2000) 104, 11708‐11718.
16. Sumiyama, K.; Suzuki, K.; Makhlouf, S.A.; Wakoh, K.; Kamiyama, T.; Yamamuro, S.; Konno,
T.J.; Xu, Y.F.; Sakurai, M.; Hihara, T. Structural evolution and magnetic properties of nano‐
granular metallic alloys. J. Non Cryst. Solids (1995) 192‐193, 539‐545.
17. Rosi, N.L.; Mirkin, C.A. Nanostructures in Biodiagnostics. Chem. Rev. (2005) 105, 1547‐1562.

Introduction 19
18. Bönnemann, H.; Richards, R.M. Nanoscopic Metal Particles − Syntheピc Methods and
Potential Applications. Eur. J. Inorg. Chem. (2001) 2455‐2480.
19. Wang, X.; Li, W.; Chen, Z.; Waje, M.; Yan, Y. Durability investigation of carbon nanotube as
catalyst support for proton exchange membrane fuel cell. J. Power Sources (2006) 158, 154‐
159.
20. Decher, G.; Hong, J.D. Buildup of ultrathin multilayer films by a self‐assembly process.
1.Consecutive adsorption of anionic and cationic bipolar amphiphiles on charged surfaces.
Chem. Macromol. Symp. (1991) 46, 321‐327.
21. Decher, G.; Hong, J.D.; Schmitt, J. Buildup of ultrathin multilayer films by a self‐assembly
process: III.Consecutively alternating adsorption of anionic and cationic polyelectrolytes on
charged surfaces. Thin Solid Films (1992) 210/211, 831‐835.
22. Decher, G. Fuzzy Nanoassemblies: Toward Layered Polymeric Multicomposites. Science
(1997) 277, 1232‐1237.
23. Zeng, F.; Zimmerman, S.C. Dendrimers in Supramolecular Chemistry: From Molecular
Recognition to Self‐Assembly. Chem. Rev. (1997) 97, 1681‐1712.
24. Lvov, Y.; Ariga, K.; Ichinose, I.; Kunitake, T. Assembly of Multicomponent Protein Films by
Means of Electrostatic Layer‐by‐Layer Adsorption. J. Am. Chem. Soc. (1995) 117, 6117‐6123.
25. Kotov, N.A. Layer‐by‐Layer Assembly of Nanoparticles and Nanocolloids: Intermolecular
Interactions, Structure and Materials Perspectives, in Multilayer Thin Films. Eds.Decher, G.;
B.J. Schlenoff. Wiley‐VCH: Weinheim, (2003).
26. Liu, S.; Kurth, D.G.; Bredenkötter, B.; Volkmer, D. The Structure of Self‐Assembled Multilayers
with Polyoxometalate Nanoclusters. J. Am. Chem. Soc. (2002) 124, 12279‐12287.
27. Joly, S.; Kane, R.; Radzilowski, L.; Wang, T.; Wu, A.; Cohen, R.E.; Thomas, E.L.; Rubner, M.F.
Multilayer Nanoreactors for Metallic and Semiconducting Particles. Langmuir (200) 16, 1354‐
1359.
28. Wang, T.C.; Rubner, M.F.; Cohen, R.E. Polyelectrolyte Multilayer Nanoreactors for Preparing
Silver Nanoparticle Composites: Controlling Metal Concentration and Nanoparticle Size.
Langmuir (2002) 18, 3370‐3375.
29. Kozhevnikov, I.V. Catalysis by Heteropoly Acids and Multicomponent Polyoxometalates in
Liquid‐Phase Reactions. Chem. Rev. (1998) 98, 171‐198.
30. Sadakane, M.; Steckhan, E. Electrochemical Properties of Polyoxometalates as
Electrocatalysts. Chem. Rev. (1998) 98, 219‐237.
31. Rhule, J.T.; Hill, C.L.; Judd, D.A. Polyoxometalates in Medicine. Chem. Rev. (1998) 98, 327‐
358.

20 Introduction
32. Katsoulis, D.E. A Survey of Applications of Polyoxometalates. Chem. Rev. (1998) 98, 359‐387.
33. http://en.wikipedia.org/wiki/Polyoxometalate
34. Keggin, J.F. The Structure and Formula of 12‐Phosphotungstic Acid Proc. R. Soc. Lond. A
(1934) 144, 75‐100.
35. Tsigdinos, G.A. Heteropoly Compounds of Molybdenum and Tungsten. Topics in Current
Chemistry (1978) 76, 1‐64.
36. Arvia, A.J.; Bolzán, A.E.; Pasquale, M.A. Electrocatalysis: A Survey of Fundamental Concepts,
in Catalysis in Electrochemistry ‐ From Fundamentals to Strategies for Fuel Cell Development.
Eds.Santos, E.; W. Schmickler. John Wiley & Sons, Inc.: New Jersey, (2011).
37. Duca, M., Electrocatalysis of the nitrite reduction. PhD Thesis, Leiden University, (2012).
38. Morozan, A.; Jousselme, B.; Palacin, S. Low‐platinum and platinum‐free catalysts for the
oxygen reduction reaction at fuel cell cathodes. Energy Environ. Sci. (2011) 4, 1238‐1254.
39. Ramaswamy, N.; Mukerjee, S. FundamentalMechanistic Understanding of Electrocatalysis of
Oxygen Reduction on Pt and Non‐Pt Surfaces: Acid versus AlkalineMedia. Advances in
Physical Chemistry (2012) 491604.
40. Whipple, D.T.; Kenis, P.J.A. Prospects of CO2 Utilization via Direct Heterogeneous
Electrochemical Reduction. J. Phys. Chem. Lett. (2010) 1, 3451‐3458.
41. Barker, T.I.B.; Bernstein, L.; Bogner, J.E.; Bosch, P.R.; Dave, R.; Davidson, O.R.; Fisher, B.S.;
Gupta, S.; Halsnæs, K.; Heij, G.J.; Kahn Ribeiro, S.; Kobayashi, S.; Levine, M.D.; Martino, D.L.;
Masera, O.; Metz, B.; Meyer, L.A.; Nabuurs, G.J.; Najam, A.; Nakicenovic, N.; Rogner, H.‐H.;
Roy, J.; Sathaye, J.; Schock, R.; Shukla, P.; Sims, R.E.H.; Smith, P.; Tirpak, D.A.; Urge‐Vorsatz,
D.; Zhou, D., Eds. IPCC, 2007: Climate Change 2007: Mitigation. Contribution of Working
Group III to the Fourth Assessment Report of the Intergovernmental Panel on Climate
Change. Metz, B., et al.Cambridge University Press, New York. (2007).
42. Oloman, C.; Li, H. Electrochemical Processing of Carbon Dioxide. Chem. Sus. Chem. (2008) 1,
385‐391.
43. Williams, P.J.L.; Laurens, L.M.L. Microalgae as biodiesel & biomass feedstocks: Review &
analysis of the biochemistry, energetics & economics. Energy Environ. Sci. (2010) 3, 554‐590.
44. Abbott, D. Keeping the Energy Debate Clean: How Do We Supply the World's Energy Needs?
Proc. IEEE (2010) 98, 42‐66.
45. Gattrell, M.; Gupta, N.; Co, A. A review of the aqueous electrochemical reduction of CO2 to
hydrocarbons at copper. J. Electroanal. Chem. (2006) 594, 1‐19.

Introduction 21
46. Hori, Y.; Murata, A.; Takahashi, R. Formation of hydrocarbons in the electrochemical
reduction of carbon dioxide at a copper electrode in aqueous solution. J. Chem. Soc., Faraday
Trans. 1 (1989) 85, 2309‐2326.
47. Hori, Y.; Koga, O.; Yamazaki, H.; Matsuo, T. Infrared Spectroscopy of Adsorbded CO and
Intermediate Species in Electrochemical Reduction of CO2 to Hydrocarbons on a Cu Electrdoe.
Electrochim. Acta (1995) 40, 2617‐2622.
48. Hori, Y. Electrochemical CO2 reduction on metal electrodes, in Modern Aspects of
Electrochemistry, Vol. 42. Ed.Vayenas, C.G. Springer: New York, (2008).
49. Rong, C.; Anson, F.C. Spontaneous adsorption of heteropolytungstates and
heteropolymolybdates on the surfaces of solid electrodes and the electrocatalytic activity of
the adsorbed anions. Inorg. Chim. Acta (1996) 242, 11‐16.
50. Keita, B.; Nadjo, L.; Belanger, D.; Wilde, C.P.; Hilaire, M. Electrochemical quartz crystal
microbalance: evidence for the adsorption of heteropoly and isopoly anions on gold
electrodes. J. Electroanal. Chem. (1995) 384, 155‐169.
51. Rong, C.; Anson, F.C. Unusually Strong Adsorption of Highly Charged Heteropolytungstate
Anions on Mercury Electrode Surface. Anal. Chem. (1994) 66, 3124‐3130.
52. Liu, S.; Volkmer, D.; Kurth, D.G. Functional Polyoxometalate Thin Films via Electrostatic
Layer‐by‐Layer Self‐Assembly. J. Cluster Sci. (2003) 14, 405‐419.
53. Bidan, G.; Genies, E.M.; Lapkowski, M. Polypyrrole and poly( N‐methylpyrrole) films doped
with Keggin‐type heteropolyanions: preparation and properties. J. Electroanal. Chem. (1988)
251, 297‐306.
54. Keita, B.; Belhouari, A.; Nadjo, L.; Contant, R. Electrocatalysis by polyoxometalate/polymer
systems: reduction of nitrite and nitric oxide. J. Electroanal. Chem. (1995) 381, 243‐250.
55. Xi, X.; Dong, S. Electrocatalytic reduction of nitrite using Dawson‐type tungstodiphosphate
anions in aqueous solutions, adsorbed on a glassy carbon electrode and doped in polypyrrole
film. J. Mol. Catal. A: Chem. (1996) 114, 257‐265.
56. Keita, B.; Nadjo, L. Activation of Electrode Surfaces ‐ Application to the Electrocatalysis of the
Hydrogen Evolution Reaction. J. Electroanal. Chem. (1985) 191, 441‐448.

22 Introduction

Experimental Methods 23
Chapter 2
Experimental methods

24 Experimental Methods

Experimental Methods 25
2.1 Electrochemical Methods
Electrochemical techniques are based on the study of the electrical current between an electrode
and an external circuit. This current is due to the electron exchange between a molecular species
which can be adsorbed or in solution, and the electrode (Faradaic process); or due to the electric
charge redistribution on the vicinity of the electrode, produced by changes in the distribution of
charged molecules or in the electric dipole orientation (non‐Faradaic processes or capacitive
processes).
An electrode reaction is a heterogeneous chemical process that involves electronic transfer to or
from a surface, usually metallic or semiconductor. It can be represented as:
頚 髪 券結貸 ⇌ 迎 (2.1)
The reduced species (R) is oxidised by giving up electrons to the electrode, or the oxidised species
(O) is reduced by gaining electrons from the electrode. The current density (i) will be considered as
positive for the anodic (oxidative) process, while for the cathodic (reductive) process it will be
negative.
The electroactive species can be in solution or as a film on the electrode, be the solvent or the
electrode themselves. The product of an electrochemical reaction can go into the solution, gaseous
phase or a new phase on the electrode.
The electrochemical techniques most commonly used require a three electrode cell. The working
electrode is that in which the electrochemical changes of interest occur. The current circulates from
the working electrode through an external circuit to an auxiliary or counterelectrode, of much bigger
area than the working electrode to prevent limiting the charge flux. The circuit is closed through the
electrolyte solution. The working electrode potential is determined by measuring its potential
difference with respect to a reference electrode situated in the solution. No current circulates
through this electrode and its potential differs from that of the solution by a constant. The working
electrode potential measurement is affected by the ohmic drop i.Rs (where i is the current that
circulates through the cell and Rs is the solution resistance between the working and reference
electrode). In conditions where there is a large current (for example, large sweep rates) it is
convenient to use large electrolyte concentrations or place the reference electrode as close as
possible to the working electrode to minimise Rs.

26 Experimental Methods
A potentiostat is a device that allows control of the potential between the working and reference
electrodes, while simultaneously recording the current that circulates between the working
electrode and the counter electrode.
Figure 2.1. Scheme of a simple potentiostat
Figure 2.1 shows a scheme of a simple potentiostat. The operational amplifier is responsible of
keeping the voltage between the working electrode and the reference electrode as similar as
possible to the power supply voltage, Ei. This condition is satisfied by adjusting its output controlling
automatically the cell current. The current is measured by controlling the voltage drop through
resistor Rm: a larger resistor will make the current smaller and vice versa.1, 2
Depending on the experiment, it might be preferable to keep the electrode potential constant or to
change it in a predetermined way, while recording the resultant current. There are a large variety of
electrochemical techniques that employ a potentiostat. In this Thesis, the main technique was cyclic
voltammetry, which will be briefly described in the following section.
2.1.1 Cyclic Voltammetry
Cyclic voltammetry is an electrochemical technique that consists of sweeping the working electrode
potential between two limits, E1 and E2, with a known sweep rate (懸, see Figure 2.2). As the potential
E2 is reached, the ramp is inverted (usually at the same sweep rate) and when it reaches E1 there are
several possibilities: the sweeping can stop, it can be repeated or it can be taken to another
potential E3. The cell current is recorded as a function of the applied potential (which is in itself a
function of time). A plot of the current vs. potential curve is called a cyclic voltammogram. It is the

Experimental Methods 27
electrochemical spectrum of a substance: it shows at which potentials the redox processes occur,
coupled chemical reactions can be detected and it is also possible to detect adsorption phenomena.
Figure 2.2. Potential – time profile for a cyclic voltammetry
Generally, the potential window in which one can work is given by the region with absence of
oxidation‐reduction peaks of the electrode (when it is used as an inert reaction platform), the
solvent decomposition, the reaction of impurities, and in the case of adsorbed films, the stability
regions of these films.
The shape of the voltammogram can tell if one is dealing with a reversible or irreversible reaction, an
electrochemically active adsorbed species or if there are any coupled chemical reactions.
Figure 2.3 shows a typical voltammogram of an electroactive reversible couple in solution.

28 Experimental Methods
Figure 2.3. Cyclic voltammogram for a reversible couple in solution on an inert electrode. EpA, Ep
C and ipA, ip
C are
the anodic and cathodic potentials and currents respectively. Ep/2A is the potential at half peak height (when the
current is ip/2A) and E1/2 is the potential that is halfway between Ep/2
A and EpA
For a reversible couple, the peak current follows equation (2.2), known as the Randles‐Sevčik
equation:
件椎 噺 伐ど.446ぬ券繋畦 岾津庁眺脹峇怠/態 系眺著経怠/態懸怠/態 (2.2)
Where 件椎 is the peak current (in A); 券 is the number of electrons exchanged at the electrode; 繋 is the
Faraday constant (9.65 x 10⁴ C mol‐1); 畦 is the electrode area (in cm2); 経 is the diffusion coefficient of
the electroactive species (in cm2 s‐1); 懸 is the sweep rate (in V s‐1) and 系眺著 is the concentration of
the electroactive species in the bulk of the solution (in mol cm‐3). For this case, it is assumed that
there is a reduced species in solution that oxidises at the electrode.
The peak potential can be expressed as:
継椎 噺 継怠/態 伐 な.などひ 眺脹津庁 (2.3)
With 継怠/態 噺 継待嫗 髪 岾眺脹津庁峇 ln 岾帖馴帖捺峇怠/態

Experimental Methods 29
Where 継待嫗 is the formal potential of the redox pair; 経眺 and 経潮 are the diffusion coefficients of the R
and O species respectively.
Note that for an electroactive species in solution, the peak current is proportional to the square root
of the sweep rate (懸怠/態). The following are some typical parameters for a reversible species in
solution (at 25 oC):
a) The difference between the anodic and cathodic peak potentials must be 59 mV divided by the
number of electrons that the couple exchanges: ∆継椎 噺 継椎凋 伐 継椎寵 噺 のひ兼撃/券. b) The module of the difference between the peak potential and the half peak height potential must
be 59 mV divided by the number of electrons that the couple exchanges: 弁継椎 伐 継椎/態弁 噺 のひ陳蝶津 .
c) The relation between the peak currents must be: 鞭沈妊豚沈妊頓鞭 噺 な. d) 継椎 is independent of 懸. e) For potentials larger than 継椎, 件態 is proportional to 建.
When there is an electroactive species adsorbed on an electrode, the shape of the voltammogram is
modified because now the reactants and products do not have to diffuse to and from the electrode
to transfer charge. Figure 2.4 shows a typical cyclic voltammetry for and adsorbed species on the
surface of an electrode.
Figure 2.4. Cyclic voltammogram for a reversible adsorbed species on the surface of an electrode

30 Experimental Methods
In an ideal scenario, the anodic and cathodic peaks are situated at the same potential: 継椎凋 噺 継椎寵. The current increases when nearing the potential of the couple, it reaches a maximum at that point
and then falls to zero due to the depletion of molecules on the electrode capable of
oxidising/reducing, because there are no electroactive molecules that can come from the bulk of the
solution. The anodic and cathodic peak areas are equal, as well as the peak currents (弁件椎凋弁 噺 弁件椎寵弁). The full width at half maximum (FWHM) is: ∆継椎,怠/態 噺 苔待.滞津 mV (25 oC). The amperometric response
of a reversible couple adsorbed on an electrode is given by:
件椎 噺 津鉄庁鉄替眺脹 畦懸ち待∗ (2.4)
Where ち待∗ is the surface concentration of redox sites.
For electroactive species adsorbed on the surface of an electrode, the current is proportional to the
sweep rate 懸, as compared to the previous case which was proportional to 懸怠/態. The area of the
oxidation and reduction peaks represents the charge (芸) necessary for the complete oxidation and
reduction of the adsorbed film on the electrode. With this charge it is possible to estimate the
surface concentration of redox sites on the surface of the electrode with the equation:
ち待∗ 噺 町津庁 (2.5)
2.1.2 Instrumentation
Electrochemical measurements were performed with three different commercial potentiostats:
Autolab PGSTAT 30, Autolab PGSTAT 20 (Eco‐Chemie, Netherlands), controlled by the program
General Purpose Electrochemical Software (GPES) and TEQ‐02 (NanoTEQ, Argentina), controlled by
the program TEQ‐02.
Different electrode cells were used. They will be described in the appropriate sections, as well as the
different types of working electrodes used. Reference electrodes were of the Ag/AgCl types,
prepared with a Ag wire previously anodised in 0.1 M KCl and immersed in saturated KCl in a thin
glass tube. The connection to the solution was done via a Vycor ® glass frit. All the potentials stated
in this Thesis are referred to the Ag/AgCl (sat.) scale.

Experimental Methods 31
2.2 X‐ray photoelectron spectroscopy (XPS)
X‐ray photoelectron spectroscopy (XPS), also known as Electron Spectroscopy for Chemical Analysis
(ESCA) is a technique based on the photoemission phenomenon. When irradiating a sample with
photons, these can be absorbed by the electrons of the atoms that comprise the material. If the
photon energy (月鉱) is greater than the binding energy of the electrons (継喋), the electrons can gain
enough energy to be expelled from the material. In XPS, X‐rays are used to irradiate the sample, the
energy of these rays being enough to eject photoelectrons from the orbitals closer to the nucleus.
The kinetic energy (継賃) of the emitted photoelectrons is:3
継賃 噺 月鉱 伐 継喋 伐ΦS (2.6)
Where ΦS is the spectrometer work function. The binding energy of the emitted electrons, 継喋, identifies uniquely the element and orbital from which the electron was emitted.
The photoemission process is shown schematically in Figure 2.5, where an electron from the 1s shell
is ejected due to the absorption of the incident X‐ray.
Figure 2.5. Scheme of the photoionization process for an electron
The photoelectron intensity (荊) coming from atoms situated at a depth 権 from the surface detected
at an angle 肯 (measured from the surface normal) is given by the Beer‐Lambert law:
荊 噺 荊待結貸佃/碇 達誰坦提 (2.7)

32 Experimental Methods
Where 膏 is the attenuation length of the material (generally a few nm) that takes into account the
elastic and inelastic collisions that the electron can suffer while travelling through the material. The
“straight line approximation” is commonly used, in which the elastic collisions are discarded. In this
case, the attenuation length is then equal to the inelastic mean free path.3 The only photoelectrons
that are capable of coming out of the material are those who are no more than a few 膏 deep,
specifically, 95% of the collected intensity comes from photoelectron emitted as deep as ぬ膏 cos 肯. As 膏 values are in the order of ≈ 1 – 4 nm,4 it makes XPS a very surface‐sensitive material
characterization technique.
One of the main reasons why the XPS technique is so useful lies in the fact that it is capable of
providing surface sensitive information while keeping the sample undamaged. As well as providing
information about which type of atom the photoelectron is coming from, it is also able to provide
information about oxidation states, because the binding energy of an electron on a certain orbital is
affected by its electronic environment.1, 3
XPS is an ultra‐high vacuum technique (UHV), it requires pressures in the order of 10‐8 – 10‐10 mbar.
Spectrometers are composed of an X‐ray source (usually Mg or Al anodes), an electron analyser
which is able to measure their kinetic energy, and a channeltron detector that counts these
electrons.
2.2.1 Angle resolved XPS (ARXPS)
The XPS technique not only has a high surface sensitivity, but it is also capable of determining
concentration profiles of the elements as a function of depth. A technique called Angle Resolved XPS
(ARXPS) is used in this case. From equation (2.7) it can be seen that the sensed depth depends on
the detection angle, 肯. Electrons that come from atoms that are deeper inside the bulk can be
detected with small detection angles, whereas increasing the detection angle makes these atoms
undetectable, thus the information is depth‐sensitive. Figure 2.6 illustrates this concept.

Experimental Methods 33
Figure 2.6 Angle resolved XPS (ARXPS) scheme. For small detection angles (a), the sensed depth is larger than
for larger detection angles (b)
Spectra are collected at different detection angles and thus the angle resolved XPS data is obtained.
Then, to convert them into depth profiles a method known as maximum entropy is used.5‐7 If the
sample consists of 倹 slabs that contain 件 elements at concentration 潔珍,沈, the total intensity detected at
an angle 肯 for element 件 can be expressed as:
荊沈岫肯岻 噺 ∑ 荊珍,沈岫肯岻珍 (2.8)
for which
荊珍,沈岫肯岻 噺 嫌沈潔珍,沈exp 峙貸佃 達誰坦提碇日 峩珍貸怠 (2.9)
where 権 is the thickness of each slab; 嫌沈 and 膏沈 are the sensitivity factor and attenuation length for
each element, respectively.
The procedure to estimate concentration profiles requires the optimisation of two quantities, a
minimisation of the least squares deviation from estimated trial functions and the maximisation of
an entropy term corresponding to the minimum information content consistent with the
experimental data, as discussed by Livesey and Smith.6
For each trial profile for each element, the sum of the squares of the errors (鋼態) was calculated
according to:
鋼沈態 噺 ∑ 岾彫日calc岫提岻貸彫日obs岫提岻峇蹄日鉄岫提岻提 (2.10)

34 Experimental Methods
Where 購沈岫肯岻 is the standard deviation due to experimental noise at an angle 肯. This expression must
be minimized while maximizing the entropy term 鯨: 鯨 噺 ∑ 潔珍,沈 伐 潔珍,沈待 伐 潔珍,沈 ln 釆頂乳,日頂乳,日轍 挽珍,沈 (2.11)
Where 潔珍,沈待 is the initial estimate for the concentration of species 件 at slab 倹. In ARXPS, the strategy is
to reconstruct the profile from a data set consisting of intensity measurements containing some
instrumental noise. The solution to this problem is the reconstruction that satisfies the data but
contains the minimum amount of structure necessary to do so. The required solution is therefore
the concentration profile that has the minimum information content (i.e. maximum entropy),
consistent with the data.6
The two conditions can be met simultaneously by minimizing the quantity 芸 噺 ど.の鋼態 伐 糠鯨, where 糠
is a regularisation constant that gives appropriate weights to the minimization of the squared errors
(鋼態) and the information content (鯨).7 A large value of 糠 would result in overly smoothed profiles,
while a small value would lead to data overfitting (i.e. fitted to the noise). The calculated profiles
were obtained by carrying out the above calculation in an MS Excel spreadsheet using the SOLVER
subroutine.
2.2.2 Instrumentation
XPS measurements were carried out using a commercial equipment SPECS UHV (SPECS, Germany)
equipped with a dual Al/Mg X‐ray source (XR‐50, SPECS), a hemispherical energy analyser of 150 mm
radius and a 9 channeltron detector, which allows for the simultaneous detection of photoelectron
in 9 different channels, thus decreasing the detection time (0.5 s per data) while keeping a good
signal‐to‐noise ratio. Operational pressures were ≈ 5 x 10‐10 mbar. The Mg‐K line was used
(excitation energy 1253.6 eV, 250 W) and most of the spectra were taken with a pass energy of 20
eV (in cases where this is different, it will be stated in the text).
All binding energies quoted in this work are referred to the Au 4f7/2 emission at 84.0 eV. All of the
samples were conductive and were grounded, so no charge compensation was necessary. Atomic
ratios were calculated from the integrated intensities of core level signals after corrections for
instrumental and photoionisation atomic sensitivity factors.8, 9 XP spectra analyses were done using
the software CasaXPS.10
For the ARXPS experiments, the detection angles used were 5, 30, 45, 60, 68 and 75o.

Experimental Methods 35
2.2.3 O2 dosing
The experiments where Au‐Cu bulk alloys were exposed to O2 (see Chapter 3) were carried out using
the transfer system illustrated schematically in Figure 2.7. It allows for the sample to be analysed in
UHV and then transferred to a gas‐dosing chamber where it is exposed to a controlled atmosphere
and then transferred back to main XPS chamber without ever being in contact the laboratory
atmosphere. Figure 2.8 shows pictures of the experimental setup.

Figure 2.7. Scheme of the XPS experimental setup for O2 dosing. (a) Setup used when measuring XPS spectra. During this procedure, the loading and gas dosing chambers
are connected and have the same base pressure of ≈ 5 x 10‐8 mbar. (b) During O2 dosing, pure O2 is admitted to the gas dosing chamber up to a pressure above 1 bar; while
the pump connected to the loading chamber is switched off and when atmospheric pressure is reached, it automatically doses N2 into it. (c) The O2 dosing valve is closed,
the sample is transferred back into the loading chamber and the pump is switched back on, emptying both the loading and gas dosing chambers down to ≈ 5 x 10‐8 mbar.
When this pressure is reached, the sample is transferred back into the main analysis chamber to be studied
36
Experim
ental M
ethods
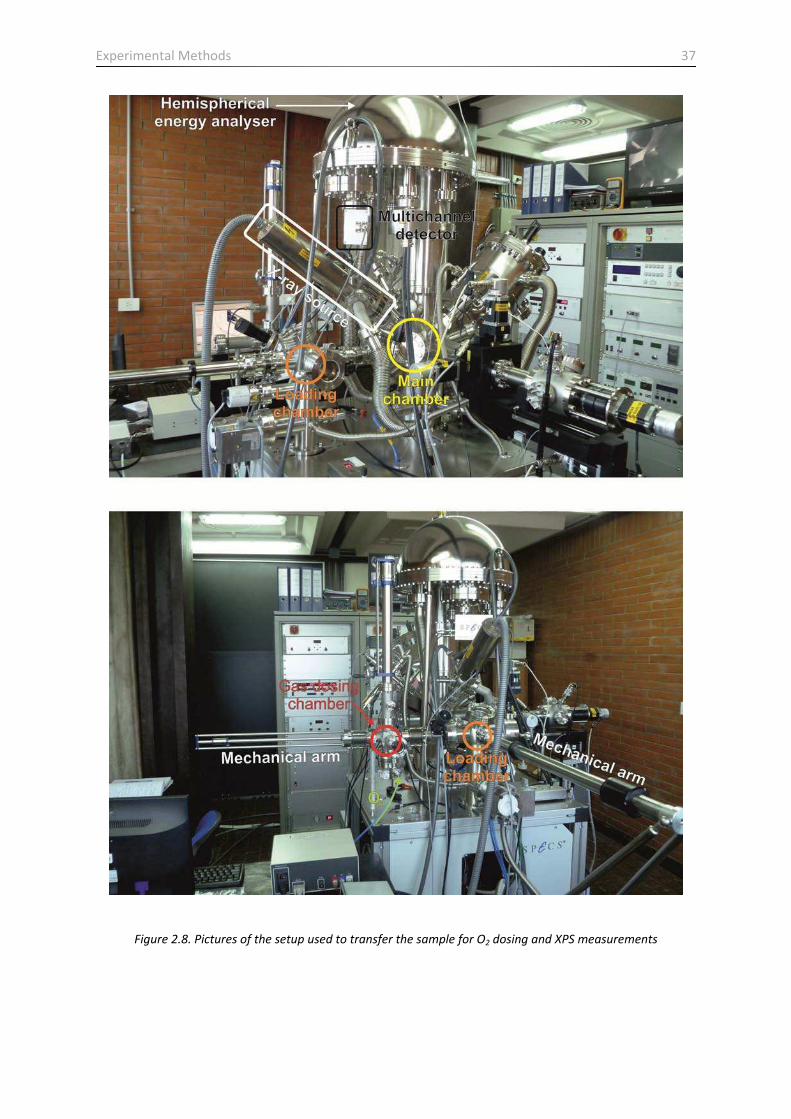
Experimental Methods 37
Figure 2.8. Pictures of the setup used to transfer the sample for O2 dosing and XPS measurements

38 Experimental Methods
The sample was transferred from the main analysis chamber (p ≈ 5 x 10‐10 mbar) to the loading
chamber (p ≈ 5 x 10‐8 mbar) with a mechanical arm and then transferred to the gas‐dosing chamber
via a second mechanical arm at 90 degrees from the first. Once there, the valve connecting the
loading with the gas dosing chamber was closed and O2 (99.99% , INDURA, Argentina) was fed, thus
exposing the sample to O2. The turbo pump connected to the loading chamber was switched off and
as atmospheric pressure was reached, pure N2 was fed into the loading chamber while closing
simultaneously the flow of O2 to the gas chamber. The valve connecting both chambers was then
opened; the sample transferred to the loading chamber and the pump was switched on again. Once
the pressure reached ≈ 5 x 10‐8 mbar, the sample was transferred back into the main chamber for
measurements. The whole operation took approximately 15 min. The O2 exposure time was 5 min
for all samples studied.
2.3 Fourier transform infrared spectroscopy (FTIR)
Infrared spectroscopy studies vibrational molecular transitions and thus it is useful for the
qualitative and quantitative determination of certain functional groups and internal molecular
vibrations. Most of the present day infrared spectrophotometers use Fourier transform
interferometers, which allow them to achieve shorter acquisition times than dispersive
spectrophotometers without sacrificing spectral resolution. For solid samples in absorption mode, a
small amount of the sample is mixed with pure KBr and pressed in pellet form. For thin films, the
absorption‐reflexion mode known as FTIR‐RAS is used. In this mode, the infrared beam is reflected
on the substrate underneath the film. The reflected intensity (迎聴) is compared with the one
obtained for the unmodified substrate (迎待) and the absorbance of the sample is calculated as 伐log岫迎聴/迎待岻.11 Usually, grazing angles are used (≈ 80o), because larger reflectivities are obtained.
2.3.1 Instrumentation
Infrared spectra were measured with an FTIR spectrometer Nicolet Magna 560 (Nicolet Instrument
Corporation, USA), equipped with a cryogenic MCT‐A detector cooled with liquid N2, a zinc selenide
polarizer (Nicolet, Spectratech, USA) and a purging equipment Whatman 75‐52. The spectra for the
POM‐modified LbL films on Au substrates (see Chapter 5) were obtained with an experimental setup
designed to work in the absorption‐reflection mode with an incidence angle of 80o. As a reference, a

Experimental Methods 39
clean Au substrate was used. Spectra were collected with a 4 cm‐1 resolution, averaging 100‐200
interferograms to obtain a good signal‐to‐noise ratio.
2.4 UV‐Visible spectroscopy
UV‐Visible spectroscopy is used to determine electronic molecular transitions, and thus is useful to
study organic compounds with a high degree of conjugation, transition metal ions and nanoparticles.
Metallic nanoparticles are very efficient absorbers of electromagnetic radiation in the UV‐Visible
range. The conduction electrons at the metallic surface of a nanoparticle vibrate collectively when
excited by light of a given wavelength (膏 ≈ 520 nm for Au NPs, 膏 ≈ 570 nm for Cu NPs) (see Figure
2.9). This collective oscillation is known as surface plasmon resonance, SPR, and as a consequence,
the nanoparticles present a large absorption at that given wavelength. The absorption wavelength is
affected by the size and shape of the nanoparticles.
Figure 2.9. Collective oscillation of the conduction electrons at the surface of a metallic nanoparticle – surface
plasmon
2.4.1 Instrumentation
A commercial UV‐Visible spectrophotometer Perkin Elmer UV/Lambda 25 (Perkin Elmer, UK) was
used. It was controlled by the software Perkin Elmer UVWinLab 6.0.4. Samples were placed in quartz
cuvettes of 1 cm length and the spectra were taken with 1 nm resolution.

40 Experimental Methods
2.5 Inductively coupled plasma optical emission spectroscopy (ICP‐OES)
Inductively coupled plasma optical emission spectroscopy is used to determine quantitatively most
of the elements in the periodic table present in aqueous solution in traces or sub traces levels.
With the help of a peristaltic pump, the liquid sample is transported to a nozzle where it is
transformed in an aerosol with the help of Ar gas. The aerosol is conducted to the ionisation zone
which consists of a plasma (generated when an Ar gas flux is subjected to an oscillating magnetic
field induced by a high frequency current). Inside the plasma, temperatures can reach as high as
8000 K. In these conditions, the atoms present in the sample are ionised / excited. When they decay
to their fundamental state, they emit radiation with a wavelength which is characteristic of each
element. This radiation is analysed through an optical system that separates the wavelengths, their
intensity is measured and thus the concentration of each element in the sample is determined.12, 13
2.5.1 Instrumentation
ICP analyses were done in an ICP‐OES CIROS VISION (SPECTRO Analytical Instruments GmbH,
Germany).
2.6 Transmission electron microscopy (TEM)
Transmission electron microscopy is used to characterise the size, shape, orientation and even
chemical composition of materials whose size scale is in the order of 1 to 100 nm. Its resolution is
much greater than optical microscopy (at best 150 nm), because the latter is limited by the
diffraction of light.14 Electron microscopy does not have this limitation because the electron
wavelength (in the order of 10‐2 to 10‐3 nm, depending on its energy15) is much smaller than visible or
ultraviolet light. Electron microscopes can resolve objects with sizes in the order of nanometres, or
even angstroms.
Depending on which type of electrons area detected, there are two types of electron microscopes:
the scanning electron microscope (SEM) and the transmission electron microscope (TEM). In both
cases, a sample is illuminated with high energy electrons (≈ 100 kV), but while in SEM the reflected
electrons are detected, in TEM the transmitted electrons are detected.

Experimental Methods 41
Energy Dispersive X‐ray Spectroscopy (EDS or EDX) is used to identify chemical elements that are
present in a sample illuminated by electrons, given that high energy electrons are a source of
ionising energy.16
As in an optical microscope, TEM can be divided in three parts: the illumination system, the
objective lens system and sample support and finally, the image formation system. All of these
components, as well as the sample are placed in high vacuum (10‐5 to 10‐7 Pa). The illumination
system consists of the electron source and the condensing lenses, and their function is to orient the
electrons that come from the source towards the sample. There are two types of electron sources:
thermionics and field emitters. The thermionic sources consist of a tungsten or (more presently) a
LaB6 crystal, which is heated to high temperatures (2700 K for tungsten filaments, 1700 K for LaB6
crystals) and they emit electrons. The field emission sources consist of a tungsten needle to which an
intense electric field is applied (1010 V m‐1), and as a consequence, they emit electrons with a more
compact energy band, being more monochromatic, more stable and more intense than thermionic
sources; thus obtaining better resolutions.15 The illumination system can be operated in two modes:
parallel beam, which is commonly used for TEM imaging, and converging lens, which is usually used
for EDS analysis and for scanning transmission electron microscopy (STEM).
The objective lens system and sample support is where all the interactions beam‐sample take place
and where all the images and diffraction patterns are formed.
The image formation system uses a series of lenses to magnify the image or the diffraction pattern
produced by the objective lens and then focalises them unto the observation screen or a PC.
To avoid electrical charging of the sample when it is irradiated with the electron beam, the samples
are placed in metallic grids (Cu, Ni or Au the most common) covered with a carbon or FOMVAR ®
film.
2.6.1 Instrumentation
The transmission electron microscope used in this work is a JEOL 3010 (JEOL, Japan). It has a
thermionic LaB6 source operating at 300 kV. It has an EDS system coupled to it. As some of the
samples studied in this Thesis were Au‐Cu alloys, Ni grids were used when doing the EDS analysis of
these samples.

42 Experimental Methods
2.7 X‐Ray Diffraction (XRD)
X‐ray diffraction provides information about the crystal structure of a crystalline sample. In a
crystalline solid, where the atomic positions are periodically repeated, the X‐ray beams which are
dispersed elastically by the atoms in certain directions become amplified due to constructive
interference, giving rise to a diffraction pattern. Information about the type and positions of the
atoms in the crystalline solid is extracted from this pattern.
The unit cell is the simplest portion of the crystalline structure of a solid, which when repeated by
translations reproduces the whole crystal. It is characterised by three vectors, a, b and c, which can
be described by their modules a, b and c and the interaxial angles, , and . These lengths and
angles are known as the lattice parameters, or lattice constants (see Figure 2.10a).
Figure 2.10. (a) Unit cell, characterised by the lattice parameters a, b and c and , and . (b) fcc structure,
typical of Cu and Au
There are seven types of unit cell which when repeated through translations reproduce all the
crystal: triclinic, monoclinic, orthorhombic, tetragonal, hexagonal, trigonal and cubic. One of the
other conditions that must be met is that each point in the lattice has to have the same number and
positioning of neighbours, that is to say, it has to have the same environment. There are 14 ways in
which this can be achieved in the seven types of unit cells, and these 14 forms are called Bravais
Lattices. Any crystalline solid can be classified into any one of these 14 types. For example, Cu and
Au present a face centred cubic crystalline structure (fcc) (see Figure 2.10b).
The Miller indexes are a way of uniquely describing the crystalline planes. These are calculated by
determining where the plane intersects the axis a, b and c, taking the reciprocal of these quantities

Experimental Methods 43
and turning them to whole numbers. They are usually stated between brackets and with the letters 月, 倦 and 健: (月倦健). Figure 2.11 shows some examples.
Figure 2.11. Miller indexes for cubic structures
When an X‐ray beam of wavelength is incident on a crystal where all the atoms are positioned in a
periodic arrangement with an interplanar separation 穴, there will be a diffraction maximum only
when Bragg’s law is obeyed:
券膏 噺 2穴 sin 肯 (2.12)
Where 券 is the diffraction order.
For a cubic crystalline system, the distance between two adjacent planes from the (月倦健) set can be
described as:
怠鳥鉄 噺 朕鉄袋賃鉄袋鎮鉄銚鉄 (2.13)
Where 欠 is the lattice parameter of the cubic system.
Combining equations (2.12) and (2.13), an expression can be reached in which the lattice parameter
for a cubic crystalline lattice can be calculated from the identification of the Miller indexes 月倦健 for the diffraction peak at an angle 肯: 欠 噺 碇態 坦辿樽提√月態 髪 倦態 髪 健態 (2.14)
Vegard’s law17 is an empirical rule that establishes that there is a linear relation (at constant T)
between the lattice parameter of a solid solution, like in an alloy (see Chapter 3) and the

44 Experimental Methods
concentration of the constituting elements. For example, if an alloy is composed of two elements 畦
and 稽 with a fraction content 捲 and な 伐 捲, Vegard’s law states that:
欠銚鎮鎮墜槻 噺 捲欠凋 髪 岫な 伐 捲岻欠喋 (2.15)
The x‐ray diffraction technique is also useful to analyse nanoparticles supported on carbon black
(see Chapter 4). In this case, Scherrer’s formula18 is used to correlate the crystallite size with the
width of the diffraction peak:
経朕 噺 碇庭廿 達誰坦提廿 (2.16)
Where 経朕 is the crystallite size, 膏 is the X‐ray wavelength, 紅朕 is the peak width at half maximum,
FWHM (in radians) and 肯朕 is the angle of the particular 月倦健 reflexion.
2.7.1 Instrumentation
A PANalytical X’Pert Pro Multi‐Puropose (PANalytical, UK) diffractometer with Co K1 (膏 = 1.789 Å)
was used. Spectra were analysed with the software Origin 8.5, and the diffraction peaks were fitted
with a non‐linear regression.
2.8 Chromatography (Liquid and gas chromatography: LC, GC)
Chromatographic techniques are used to separate and analyse the composition of an unknown
sample. Their most frequent uses are substance purity studies, and separation, identification and
quantification of different components of a mixture.
In a chromatographic experiment, a known volume of liquid (LC) or gas (GC) (called analyte) is
injected in the column with the help of a micro syringe. The analyte is carried through the column
with the help of a liquid (usually an organic solvent) or an inert gas (usually He, Ar or N2) which is
called the eluent or carrier gas. Both analyte and eluent or carrier gas are called the mobile phase.
As the analyte molecules pass through the column, their movement is slowed down by adsorption of
molecules to the walls of the column or on the filling material of the column (called the stationary
phase). The speed with which the molecules travel through the column depends on how strong the
adsorption is, which depends on the type of molecule and the type of filling material of the column.

Experimental Methods 45
As each type of molecule that composes the analyte has a different speed inside the column, they
are separated as they travel through it and they exit the column at different times (retention time).
As each component exits the column, it is detected and quantified. In this way, the analyte
components can be identified and quantified by their retention times and also qualitatively by
comparing the signal areas of each component.12
2.8.1 Instrumentation
LC experiments were performed with an Agilent 1200 device (Agilent, UK) equipped with a UV‐Vis
detector at 254 nm. The GC experiments were performed with an Agilent 6890N device (Agilent,
UK), equipped with an FID detector and He and H2 as carrier gases. The column used was a 30 m X
320 m BP1 column (SGE Australia).
2.9 Ellipsometry
Ellipsometry is an optical technique used to determine thickness and optical coefficients (index of
refraction and extinction coefficient) of a thin film deposited on a substrate. The technique is based
in measuring the polarisation state changes of the light when reflected on an interface and from
these measurements calculate the thickness and optical coefficients.
A polarised monochromatic beam of light incident on a sample can be described by the electric field
vector 継博 that oscillates in a plane perpendicular to the beam propagation direction. This vector can
be decomposed into two components, perpendicular and parallel to the plane of incidence, called 継椎 and 継聴 respectively (see Figure 2.12). For the incident beam:
継椎彫 噺 継待,椎彫 exp範件盤拳建 伐 倦権 髪 糠椎匪飯 (2.17) 継鎚彫 噺 継待,鎚彫 exp岷件岫拳建 伐 倦権 髪 糠鎚岻峅 (2.18)
And for the reflected beam:
継椎眺 噺 継待,椎眺 exp範件盤拳建 伐 倦権 髪 紅椎匪飯 (2.19) 継鎚眺 噺 継待,鎚眺 exp岷件岫拳建 伐 倦権 髪 紅鎚岻峅 (2.20)

46 Experimental Methods
Where 糠沈 and 紅沈 (件 噺 喧, 嫌) are the phases of each component of the incident and reflected beams,
and where 継待,沈眺 (件 噺 喧, 嫌) are related to 継待,沈彫 (件 噺 喧, 嫌) via the Fresnel coefficients.19 In the particular
case where 糠椎 噺 糠鎚 the incident light is linearly polarised and the electric field oscillation occurs in a
plane. When 糠椎 塙 糠鎚, the electric field vector rotates while oscillating describing an ellipse
(elliptically polarised light). In the particular case where 糠椎 伐 糠鎚 噺 講/2, the electric field vector
describes a circle (circularly polarised light).
Figure 2.12. Monochromatic light with wavelength incident on a film of thickness d deposited over a
substrate. The electric field vector is separated into a component parallel to the plane of incidence (継椎) and one
perpendicular to it (継鎚)
The quotient between the reflected and incident electric field for each component gives rise to the
complex reflexion coefficients 貢沈 (件 噺 喧, 嫌) whose quotient is a normalised reflexion coefficient:
貢 噺 諦妊諦濡 噺 磐帳轍,妊馴帳轍,妊内 帳轍,濡内帳轍,濡馴 卑 exp範件盤紅椎 伐 紅鎚 伐 糠椎 伐 糠鎚匪飯 (2.21)
Defining:
tanΨ 噺 磐帳轍,妊馴帳轍,妊内 帳轍,濡内帳轍,濡馴 卑 (2.22)
And
つ 噺 紅椎 伐 紅鎚 伐 糠椎 伐 糠鎚 (2.23)
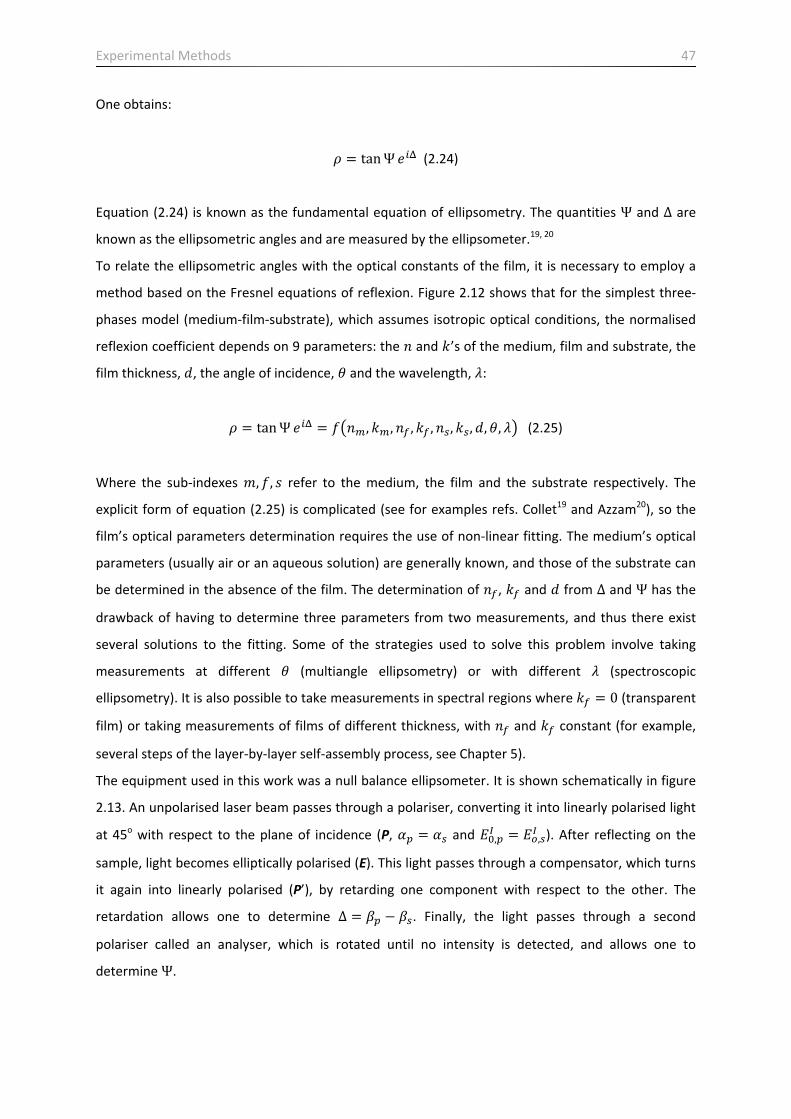
Experimental Methods 47
One obtains:
貢 噺 tanΨ結沈綻 (2.24)
Equation (2.24) is known as the fundamental equation of ellipsometry. The quantities Ψ and つ are
known as the ellipsometric angles and are measured by the ellipsometer.19, 20
To relate the ellipsometric angles with the optical constants of the film, it is necessary to employ a
method based on the Fresnel equations of reflexion. Figure 2.12 shows that for the simplest three‐
phases model (medium‐film‐substrate), which assumes isotropic optical conditions, the normalised
reflexion coefficient depends on 9 parameters: the 券 and 倦’s of the medium, film and substrate, the
film thickness, 穴, the angle of incidence, 肯 and the wavelength, 膏: 貢 噺 tanΨ結沈綻 噺 血盤券陳, 倦陳, 券捗 , 倦捗 , 券鎚, 倦鎚, 穴, 肯, 膏匪 (2.25)
Where the sub‐indexes 兼, 血, 嫌 refer to the medium, the film and the substrate respectively. The
explicit form of equation (2.25) is complicated (see for examples refs. Collet19 and Azzam20), so the
film’s optical parameters determination requires the use of non‐linear fitting. The medium’s optical
parameters (usually air or an aqueous solution) are generally known, and those of the substrate can
be determined in the absence of the film. The determination of 券捗, 倦捗 and 穴 from つ and Ψ has the
drawback of having to determine three parameters from two measurements, and thus there exist
several solutions to the fitting. Some of the strategies used to solve this problem involve taking
measurements at different 肯 (multiangle ellipsometry) or with different 膏 (spectroscopic
ellipsometry). It is also possible to take measurements in spectral regions where 倦捗 噺 ど (transparent
film) or taking measurements of films of different thickness, with 券捗 and 倦捗 constant (for example,
several steps of the layer‐by‐layer self‐assembly process, see Chapter 5).
The equipment used in this work was a null balance ellipsometer. It is shown schematically in figure
2.13. An unpolarised laser beam passes through a polariser, converting it into linearly polarised light
at 45o with respect to the plane of incidence (P, 糠椎 噺 糠鎚 and 継待,椎彫 噺 継墜,鎚彫 ). After reflecting on the
sample, light becomes elliptically polarised (E). This light passes through a compensator, which turns
it again into linearly polarised (P’), by retarding one component with respect to the other. The
retardation allows one to determine つ 噺 紅椎 伐 紅鎚. Finally, the light passes through a second
polariser called an analyser, which is rotated until no intensity is detected, and allows one to
determine Ψ.
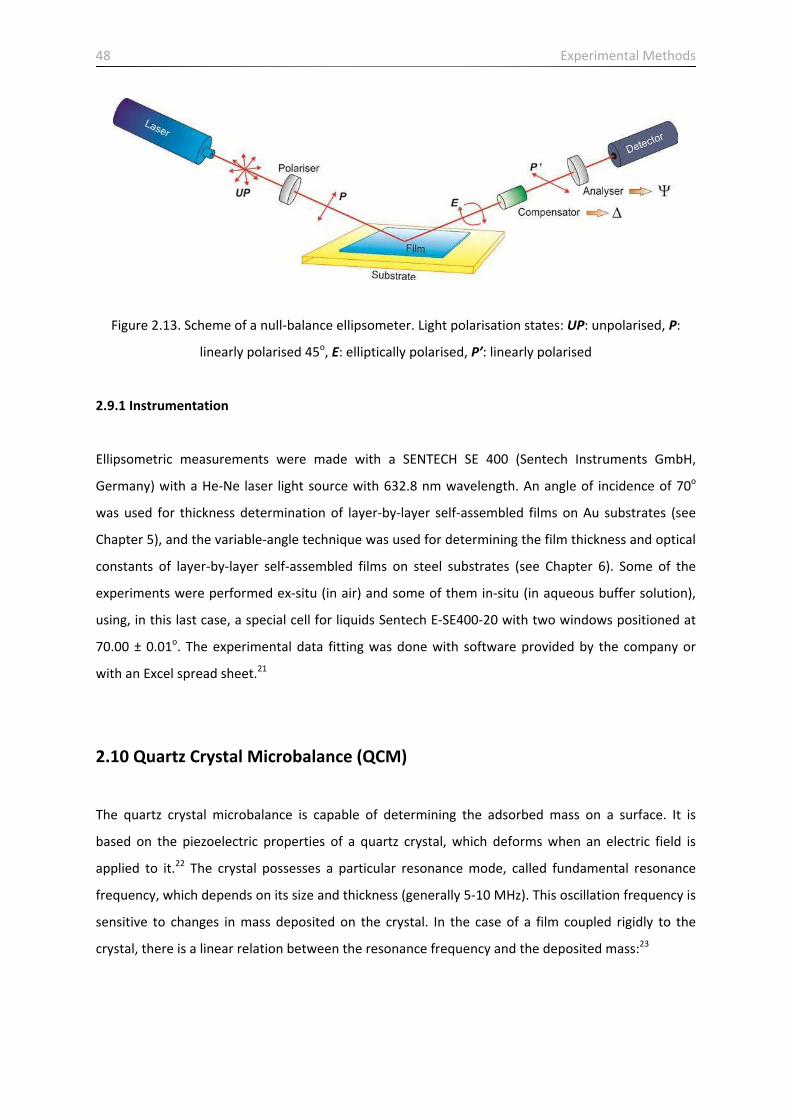
48 Experimental Methods
Figure 2.13. Scheme of a null‐balance ellipsometer. Light polarisation states: UP: unpolarised, P:
linearly polarised 45o, E: elliptically polarised, P’: linearly polarised
2.9.1 Instrumentation
Ellipsometric measurements were made with a SENTECH SE 400 (Sentech Instruments GmbH,
Germany) with a He‐Ne laser light source with 632.8 nm wavelength. An angle of incidence of 70o
was used for thickness determination of layer‐by‐layer self‐assembled films on Au substrates (see
Chapter 5), and the variable‐angle technique was used for determining the film thickness and optical
constants of layer‐by‐layer self‐assembled films on steel substrates (see Chapter 6). Some of the
experiments were performed ex‐situ (in air) and some of them in‐situ (in aqueous buffer solution),
using, in this last case, a special cell for liquids Sentech E‐SE400‐20 with two windows positioned at
70.00 ± 0.01o. The experimental data fitting was done with software provided by the company or
with an Excel spread sheet.21
2.10 Quartz Crystal Microbalance (QCM)
The quartz crystal microbalance is capable of determining the adsorbed mass on a surface. It is
based on the piezoelectric properties of a quartz crystal, which deforms when an electric field is
applied to it.22 The crystal possesses a particular resonance mode, called fundamental resonance
frequency, which depends on its size and thickness (generally 5‐10 MHz). This oscillation frequency is
sensitive to changes in mass deposited on the crystal. In the case of a film coupled rigidly to the
crystal, there is a linear relation between the resonance frequency and the deposited mass:23

Experimental Methods 49
∆血 噺 伐 態捗任鉄∆陳紐諦禎凋 (2.26)
Where つ血 is the frequency change caused by the addition of mass つ兼; 血待 is the fundamental
resonance frequency of the crystal; 畦 is the crystal area; 貢 is the density of quartz (2.648 g cm‐3) and 航 is the shear modulus of the quartz of AT cut (2.947 x 10¹¹ g cm‐1 s‐2). This equation, known as
Sauerbrey equation, holds if つ血 企 血待 and if the film is rigidly coupled to the crystal, that is to say, if
the acoustic wave propagates with equal speed on both materials.22 In the case where this last
condition is not met, it is necessary to consider the thickness and the viscoelastic properties of the
film.
The response of the quartz crystal resonator can be modelled with an equivalent circuit known as
Butterworth‐Van Dyke circuit (BVD) (see Figure 2.14C). The circuit components are related with
mechanical properties of the system: the inductance 詣 is related to the oscillator mass, the capacity 系 with the elastic response and the resistance 迎 with the friction losses. The capacity 系待 depends on
the electrical capacity of the parallel plate capacitor formed by the two electrodes on both faces of
the crystal, also on the loss parasite capacitance of the connectors and on the double layer
capacitance when one of the electrodes is in contact with the metal. When analysing the adsorption
of a thin film over a quartz crystal, ∆迎 and ∆隙挑 (隙挑 噺 2講血待詣) are determined.24 When the adsorbed
film behaves rigidly, ∆迎 伎 ∆隙挑 and equation (2.26) can be used.
This technique is compatible with electrochemical experiments, in which case it is called Quartz
Crystal microbalance with Electrochemical Control (EQCM), and it allows determining the mass of a
film when this is subjected to an electrochemical perturbation.22 This technique employs a cell that
exposes one of the crystal faces to the solution. The metallic contact of this face acts as a working
electrode. The potentiostat is uncoupled from the high frequency signals employed to excite the
crystal via a 1‐5 nF capacitor.
2.10.1 Instrumentation
A home‐made quartz crystal microbalance was employed, details can be found in a previously
published paper.24 This device is based on applying a sinusoidal signal with a voltage control
oscillator. The entry and exit voltages are measured as a function of the frequency and their
quotient (transference function) is fitted with a non‐linear regression and the BVD circuit
components are obtained. The data acquisition and analysis was done with software written in
QuickBasic 4.5.
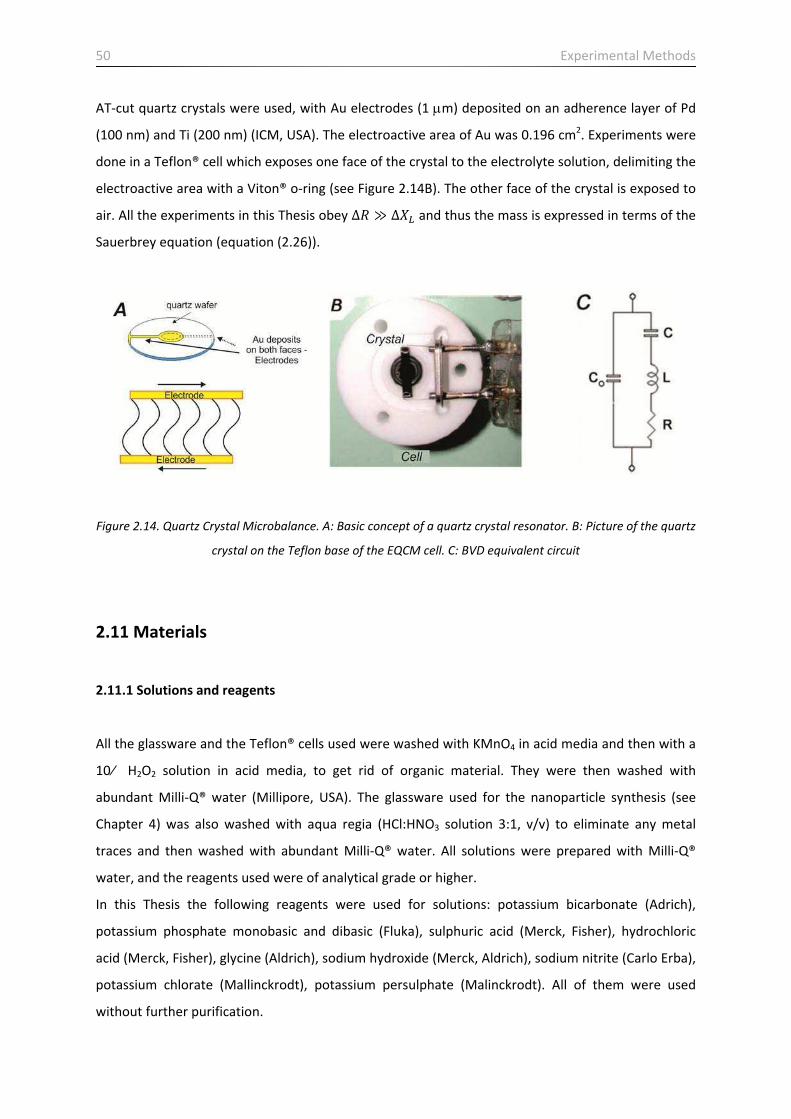
50 Experimental Methods
AT‐cut quartz crystals were used, with Au electrodes (1 m) deposited on an adherence layer of Pd
(100 nm) and Ti (200 nm) (ICM, USA). The electroactive area of Au was 0.196 cm2. Experiments were
done in a Teflon® cell which exposes one face of the crystal to the electrolyte solution, delimiting the
electroactive area with a Viton® o‐ring (see Figure 2.14B). The other face of the crystal is exposed to
air. All the experiments in this Thesis obey ∆迎 伎 ∆隙挑 and thus the mass is expressed in terms of the
Sauerbrey equation (equation (2.26)).
Figure 2.14. Quartz Crystal Microbalance. A: Basic concept of a quartz crystal resonator. B: Picture of the quartz
crystal on the Teflon base of the EQCM cell. C: BVD equivalent circuit
2.11 Materials
2.11.1 Solutions and reagents
All the glassware and the Teflon® cells used were washed with KMnO4 in acid media and then with a
10% H2O2 solution in acid media, to get rid of organic material. They were then washed with
abundant Milli‐Q® water (Millipore, USA). The glassware used for the nanoparticle synthesis (see
Chapter 4) was also washed with aqua regia (HCl:HNO3 solution 3:1, v/v) to eliminate any metal
traces and then washed with abundant Milli‐Q® water. All solutions were prepared with Milli‐Q®
water, and the reagents used were of analytical grade or higher.
In this Thesis the following reagents were used for solutions: potassium bicarbonate (Adrich),
potassium phosphate monobasic and dibasic (Fluka), sulphuric acid (Merck, Fisher), hydrochloric
acid (Merck, Fisher), glycine (Aldrich), sodium hydroxide (Merck, Aldrich), sodium nitrite (Carlo Erba),
potassium chlorate (Mallinckrodt), potassium persulphate (Malinckrodt). All of them were used
without further purification.

Experimental Methods 51
For the Au‐Cu nanoparticle synthesis (see Chapter 4) the following reagents were used: Hydrogen
tetrachloroaurate (III) tetrahydrate (99.9% ) (HAuCl4.3H2O, Aldrich), copper (II) nitrate hydrate
(99.999% ) (Cu(NO3)2.xH2O, Aldrich), Hydrolysed poly(vinyl alcohol), 98% , average molecular weight
of 16000 g mol‐1 (PVA, Acros Organics), sodium borohydride (99.9% ) (NaBH4, Merck), carbon black
(Vulcan XC‐72, Cabot).
For the ITO electrode modification (see Chapter 4) the following reagents were used: potassium
hydroxide (BDH), nitric acid (Fisher), (3‐mercaptopropyl) trimethoxysilane (Fluka), isopropanol
(Fisher).
For the layer‐by‐layer self‐assembled films containing polyoxomolybdate over Au (see chapter 5) the
following reagents were used: sodium 3‐mercaptopropane‐1‐sulfonate (MPS, Sigma Aldrich),
poly(allylamine hydrochloride) (PAH, Mw 56000, Aldrich), poly(acrylic acid, sodium salt) solution
(PAA, 35% in water, Mw 100000, Aldrich), phosphomolybdic acid hydrate (H3PMo12O40.xH2O, POM,
Aldrich).
For the layer‐by‐layer self‐assembled films on steel substrates (see Chapter 6) the following reagents
were used: NaOH (Merck), poly(allylamine hydrochloride) modified with an osmium pyridine‐
bipyridine complex (PAH‐Os), poly(vinylsulfonate) (sodium salt) (PVS – 25% solution w/w, Aldrich).
2.11.2 Electrode modification
The fabrication and/or modification of the different electrodes used in this work will be discussed
individually in each chapter.
52 Experimental Methods
References
1. Bard, A.J.; Faulkner, L.R. Electrochemical Methods ‐ Fundamentals and Applications, 2nd Ed.
John Wiley & Sons, New Jersey, (2001).
2. Group, S.E. Instrumental Methods in Electrochemistry. Horwood Publishing, Chichester,
(2001).
3. Watts, J.F.; Wolstenholme, J. An introduction to surface analysis by XPS and AES. John Wiley
& Sons, Chichester, (2003).
4. Seah, M.P.; Dench, W.A. Quantitative electron spectroscopy of surfaces: A standard data
base for electron inelastic mean free paths in solids. Surf. Interface Anal. (1979) 1, 2‐11.
5. Smith, G.C.; Livesey, A.K. Maximum Entropy: a New Approach to Non‐destructive
Deconvolution of Depth Profiles from Angle‐dependent XPS. Surf. Interface Anal. (1992) 19,
175‐180.
6. Livesey, A.K.; Smith, G.C. The determination of depth profiles from angledependent XPS using
maximum entropy data analysis. J. Electron Spectrosc. Relat. Phenom. (1994) 67, 439‐461.
7. Paynter, R.W. An ARXPS primer. J. Electron Spectrosc. Relat. Phenom. (2009) 169, 1‐9.
8. Scofield, J.H. Hartree‐Slater Subshell Photoionization Cross‐Sections At 1254 And 1487 eV. J.
Electron Spectrosc. Relat. Phenom. (1976) 8, 129‐137.
9. ASF Dataset provided by SPECS, 2008.
10. http://www.casaxps.com/
11. Bubert, H.; Jenett, H. Surface and Thin Film Analysis: Principles, Instrumentation and
Applications. Wiley‐VCH Verlag GmbH Weinheim, (2002).
12. Harvey, D. Modern Analytical Chemistry. McGraw‐Hill Higher Education, Boston, (2000).
13. http://www.ua.es/es/investigacion/sti/servicios/analisis_instrumental/analisis/icp_oes.html
14. Goodhew, P.J.; Humphreys, J.; Beanland, R. Microscopy with light and electrons, in Electron
Microscopy and AnalysisTaylor and Francis: London, (2001).
15. Williams, D.B.; Barry‐Carter, C. Transmission Electron Microscopy ‐ A Textbook for Materials
Science. Springer, New York, (2009).
16. Egerton, R.F. Electron Energy Loss Spectroscopy in the Electron Microscope. Plenum, New
York, (1996).
17. Vegard, L. Die Konstitution der Mischkristalle und die Raumfüllung der Atome. Z. Phys. (1921)
5, 17‐26.
18. Waseda, Y.; Matsubara, E.; Shinoda, K. X‐Ray Diffraction Crystallography. Springer‐Verlag,
Berlin, (2011).
Experimental Methods 53
19. Collet, E. Polarized Light: Fundamentals and Applications. Marcel Dekker Inc., New York,
(1993).
20. Azzam, R.M.A.; Bashara, N.M. Ellipsometry and Polarized Light. North Holland Publishing,
Amsterdam, (1977).
21. http://www.ccn.yamanashi.ac.jp/~kondoh/ellips_e.html
22. Buttry, D.A.; Ward, M.D. Measurement of Interfacial Processes at Electrode Surfaces with the
Electrochemical Quartz Crystal Microbalance. Chem. Rev. (1992) 92, 1355‐1379.
23. Sauerbrey, G.Z. Verwendung von Schwingquarzen zur Wägung dünner Schichten und zur
Mikrowägung. Z. Phys. (1959) 155, 206‐222.
24. Calvo, E.J.; Danilowicz, C.; Etchenique, R. Measurement of Viscoelastic Changes at Electrodes
modified with Redox Hydrogels with a Quartz Crystal Device. J. Chem. Soc. Faraday Trans.
(1995) 91, 4083‐4091.

54 Experimental Methods
Au‐Cu bulk electrodes and their application for electroreduction of CO2 55
Chapter 3
Au-Cu bulk electrodes and their application for electroreduction of CO2

56 Au‐Cu bulk electrodes and their application for electroreduction of CO2

Au‐Cu bulk electrodes and their application for electroreduction of CO2 57
3.1 Introduction
Metal alloy nanoparticles are frequently used as electrocatalysts.1, 2 In particular, Au‐Cu nanoalloys
have been used for many electrocatalytic reactions such as CO oxidation,3 propene epoxidation4 and
selective oxidation of benzyl alcohol to yield benzaldehyde.5
The electrocatalytic properties of alloys depend on their surface composition, which is, in general,
different from that in the bulk due to differences in the surface segregation energy of alloy
constituents, a question that has been extensively discussed.6, 7
The binary alloy system Au–Cu is a typical example of an alloy displaying surface segregation
phenomena that has been investigated both experimentally8‐11 and theoretically.12‐14 Theoretical
studies give a qualitative description of surface enrichment even though only considering that one of
the components of the alloy is a single atom (the guest) embedded in a matrix of atoms of the other
alloy component (the host). In consequence, these calculations do not take into account guest‐guest
interactions, which are of fundamental importance for predicting surface composition.
Chemisorption form the gas or liquid phase can have a large influence in the equilibrium
concentration which might then lead to a change in surface composition and a possible change in
electrocatalytic response.15
Sample annealing is a common practice during nanoparticle synthesis as a means of stabilizing their
configuration. The energy supplied to the system during this process is high enough to be able to
induce changes in the surface composition so that the final configuration can be different from that
of a non‐annealed sample, and thus may lead to completely different electrocatalytic behaviours.
Impurities that are buried deep inside the material can also diffuse to the surface if provided with
enough energy (temperature).
In this chapter the effects of chemical environment, temperature and impurities on the surface
composition of bulk Au‐Cu alloys are studied. Angle resolved XPS results as well as DFT calculations
are used to draw conclusions regarding the surface composition of these systems under the
influence of the effects above listed. Finally, the electrochemical response of these electrodes
towards CO2 reduction is analysed.

58 Au‐Cu bulk electrodes and their application for electroreduction of CO2
3.2 O2 induced Cu surface segregation in Au–Cu bulk alloys
3.2.1 Sample preparation and characterization
Au–Cu polycrystalline alloys were prepared from high purity base metals (3 mm diameter Au and Cu
rods 99.9985% , Premion, and 99.999% , Puratronics, respectively, Alfa Aesar, UK). The rods were
cleaned in boiling acetone and cut and weighed to obtain the correct Au/Cu fraction. Three different
compositions were prepared: Au0.90Cu0.10, Au0.85Cu0.15 and Au0.80Cu0.20. The metals were placed in
alumina crucibles and heated in a tube furnace (CTF 12/75/700, Carbolite, UK) under 10% H2/90% Ar
(BOC gases, UK) at 1100 oC for 6 h. The samples were left to cool in the reducing atmosphere of the
furnace and extracted only when they reached room temperature. The samples obtained had an
approximate diameter of 0.5 cm, and holes were drilled on the opposite side to mount them into the
Mo XPS sample‐holders. Figure 3.1 shows pictures of a typical alloy sample.
Figure 3.1. Pictures of Au‐Cu bulk alloys used for ARXPS experiments. (a) Polished surface. (b) Back side with
screw hole to fit on sample‐holder. (c) Side view
The front sides of each sample were polished with 1200 and 2400 abrasive paper and then with 9, 3,
1, 0.3 and 0.05 m alumina slurries (Buehler, Germany). The samples were rinsed with copious
amounts of Milli‐Q water (Millipore, USA) and sonicated in Milli‐Q water between each polishing
step. They were analysed by X‐ray diffraction (see Chapter 2, section 2.7), to ensure that alloys were
formed. Figure 3.2a shows the XRD spectra corresponding to Au0.90Cu0.10, Au0.85Cu0.15 and Au0.80Cu0.20
alloy samples.

Au‐Cu bulk electrodes and their application for electroreduction of CO2 59
Figure 3.2. (a) X‐ray diffraction spectra of the Au‐Cu alloys studied. (b) Vegard’s law plot
No individual signals of the alloying elements are observed, indicating that the samples obtained
were solid solutions. In addition, the expected shifts for the Au signals predicted from Vegard’s law16
(see Chapter 2, equation 2.15) are observed (see Figure 3.2b) for increasing concentration of Cu. The
lattice parameters were calculated for the three samples and the average values obtained were
4.013 ± 0.006 Å for Au0.80Cu0.20, 4.025 ± 0.006 Å for Au0.85Cu0.15 and 4.060 ± 0.005 Å for Au0.90Cu0.10.
These values lie between those of Au (4.079 Å) and Cu (3.610 Å).
3.2.2 Au surface segregation on Au‐Cu alloys in UHV
Before performing the ARXPS measurements, alloy samples were cleaned by Ar+ sputtering until no
contaminants were observed on their surfaces. Figure 3.3 shows the Cu and Au atomic compositions
for Au0.80Cu0.20, Au0.85Cu0.15 and Au0.90Cu0.10 as a function of XPS detection angle. The relative
compositions were calculated from the Au 4f and Cu 2p3/2 XP signals taking into account the relevant
sensitivity factors.17, 18 The solid lines in Figure 3.3 show the best fits using the concentration‐
gradient model with maximum entropy regularisation described in Chapter 2.19‐21

60 Au‐Cu bulk electrodes and their application for electroreduction of CO2
Figure 3.3. Cu (filled circles, left) and Au atomic % (open circles, right) calculated from the XPS data obtained as
a function of detection angle for the three polycrystalline Au–Cu alloys studied Au0.80Cu0.20–top, Au0.85Cu0.15—
middle and Au0.90Cu0.10–bottom). The lines correspond to the best fit obtained using a concentration‐gradient
model with maximum entropy regularisation19, 21. Insets: Au 4f and Cu 2p3/2 signals for each sample (the spectra
are shifted for clarity).
The insets of Figure 3.3 show the dependence of the Au 4f and Cu 2p3/2 XP signals on detection angle
(the spectra are shifted for clarity). The Au 4f signals show a clear increase in intensity as the
detection angle is increased, whereas the Cu 2p3/2 signals decrease demonstrating surface
enrichment in Au for the three alloys studied. There is previous experimental evidence for this
result, both for polycrystalline8, 10, 22 and single crystal alloys.8, 9, 11 As expected, the measured Au and
Cu compositions tend towards their nominal bulk values as the detection angle is decreased. The Cu
2p3/2 XP signal is seen at a binding energy of 932.4 eV, which is due to metallic Cu with no
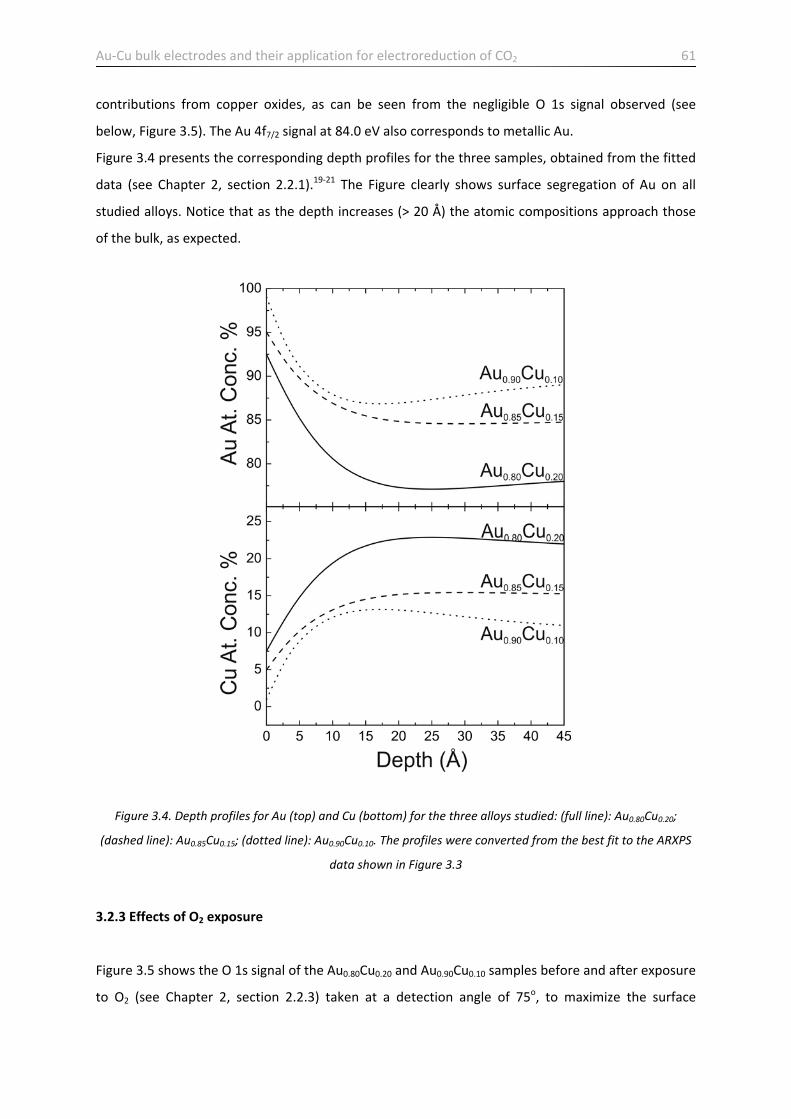
Au‐Cu bulk electrodes and their application for electroreduction of CO2 61
contributions from copper oxides, as can be seen from the negligible O 1s signal observed (see
below, Figure 3.5). The Au 4f7/2 signal at 84.0 eV also corresponds to metallic Au.
Figure 3.4 presents the corresponding depth profiles for the three samples, obtained from the fitted
data (see Chapter 2, section 2.2.1).19‐21 The Figure clearly shows surface segregation of Au on all
studied alloys. Notice that as the depth increases (> 20 Å) the atomic compositions approach those
of the bulk, as expected.
Figure 3.4. Depth profiles for Au (top) and Cu (bottom) for the three alloys studied: (full line): Au0.80Cu0.20;
(dashed line): Au0.85Cu0.15; (dotted line): Au0.90Cu0.10. The profiles were converted from the best fit to the ARXPS
data shown in Figure 3.3
3.2.3 Effects of O2 exposure
Figure 3.5 shows the O 1s signal of the Au0.80Cu0.20 and Au0.90Cu0.10 samples before and after exposure
to O2 (see Chapter 2, section 2.2.3) taken at a detection angle of 75o, to maximize the surface

62 Au‐Cu bulk electrodes and their application for electroreduction of CO2
sensitivity of the information collected. Immediately after sample cleaning and before exposure to
O2, both samples showed almost no presence of O. After exposure to O2, the O 1s XP signal
increased dramatically with a peak centred at ≈ 530.9 eV, which is attributed to adsorbed atomic
O.23 Note that the alloy with greater Cu content (Au0.80Cu0.20) has the greatest O surface
concentration, hence demonstrating the role of Cu in the alloy for enhancing O chemisorption.
Figure 3.5 .O 1s XP signal for Au0.80Cu0.20 (above) and Au0.90Cu0.10 (below) samples, before and after exposure to
1 bar of O2, taken at a detection angle of 75o with respect to surface normal. The spectra have been shifted for
comparison
Figure 3.6 shows the elemental surface compositions of the Au0.80Cu0.20 and Au0.90Cu0.10 alloys before
and after O2 exposure calculated from the Au 4f and Cu 2p3/2 XP signals at different detection angles.

Au‐Cu bulk electrodes and their application for electroreduction of CO2 63
Figure 3.6. Comparison of atomic Au (top) and Cu atomic % (bottom) of the Au0.80Cu0.20 (left) and Au0.90Cu0.10
(right) samples before (filled circles) and after (open circles) exposure to 1 bar of O2. The lines show the best fit
obtained using a concentration‐gradient model with a maximum entropy method
A clear change in surface composition is observed after exposure to O2. The surfaces of both
samples, which before O adsorption was Au‐enriched, becomes now enriched with Cu. It should be
noted that the results in Figure 3.6 correspond to a two‐element system (Au and Cu) before O
adsorption, whereas a three‐element system (Au, Cu and O) is present after adsorption. The results
at high take‐off angles clearly show the large Cu segregation induced by O adsorption. This effect
was further analysed by calculating the corresponding concentration profiles (Figure 3.7).

64 Au‐Cu bulk electrodes and their application for electroreduction of CO2
Figure 3.7. Depth profiles for Au0.80Cu0.20 (top) and Au0.90Cu0.10 (bottom) alloys after exposure to O2. The profiles
were converted from the best fit to the ARXPS data shown in Figure 3.6
Calculated depth profiles shown in Figure 3.7 clearly indicate that O adsorption modifies the
composition of only the top 2‐3 layers of the alloys, in excellent agreement with the DFT calculations
discussed below.
Sample surface roughness can play an important role in the calculated depth profiles.24, 25 Great care
was taken during the manipulation and polishing of the samples and sputtering was kept to a
minimum until almost no C contamination was detected, so as to minimise the influence of
roughness on the ARXPS results. The experimental data used to calculate the depth profiles is
obtained, however, from ratios of the XP signals for the different elements, therefore diminishing
the influence of roughness in the profiles calculated.

Au‐Cu bulk electrodes and their application for electroreduction of CO2 65
3.2.4 DFT calculations
In order to verify the reversal of surface segregation caused by oxygen adsorption, density functional
theory (DFT) calculations were performed for two different systems, clean and oxygen covered ( =
1.0 ML) surfaces. Place exchange energies for Cu were calculated using slab geometries. The
calculations were carried out on Au(111) surfaces when either the first or the second layer had been
fully exchanged with Cu atoms, thus representing preferential segregation of either Au or Cu to the
surface.
DFT calculations were done by Prof. Timo Jacob at Ulm University, Germany, as part of collaboration
in the ELCAT network. They were performed with SeqQuest,26 a periodic DFT code with localized
basis sets represented by linear combinations of contracted Gaussian functions (here at the
‘‘double‐ plus polarization’’‐ level). The PBE‐GGA exchange–correlation functional was employed in
tandem with standard (non‐local) norm‐conserving pseudopotentials. Integrations in reciprocal
space were performed with a Brillouin zone sampling of 9 x 9 k‐points per 1 x 1 unit cell. All surfaces
were represented by six‐layer slabs where the lowest two layers were fixed to the calculated bulk
structure while all remaining layers were allowed to optimize freely their geometry (up to less than
0.1 eV Å‐1).
Figure 3.8 shows schemes corresponding to the structures modelled. In the absence of adsorbates,
the calculated energy for the segregation of Au atoms to the surface was ‐0.37 eV atom‐1 (Process I ‐
II in Figure 3.8, negative energies indicate an overall energy gain). This shows that Au is preferentially
situated at the surface. The dissociative adsorption of 1.0 ML of oxygen on a gold terminated slab
requires 0.45 eV per oxygen atom (Process II‐III in Figure 3.8; all the values have been referenced to
½ O2(g)). This process is endothermic since the formation of an adsorbed layer by dissociation of
gaseous O2 is considered here and the adsorption energy of oxygen on gold is relatively low. Process
III‐IV corresponds to the place exchange of surface Au atoms by Cu with oxygen attached to Cu,
resulting in an energy change of ‐1.80 eV atom‐1. This large value is certainly sufficient to induce
almost any atom exchange at the surface resulting, therefore, in the composition and segregation
changes due to the adsorption of oxygen, as observed experimentally (see Figure 3.7).
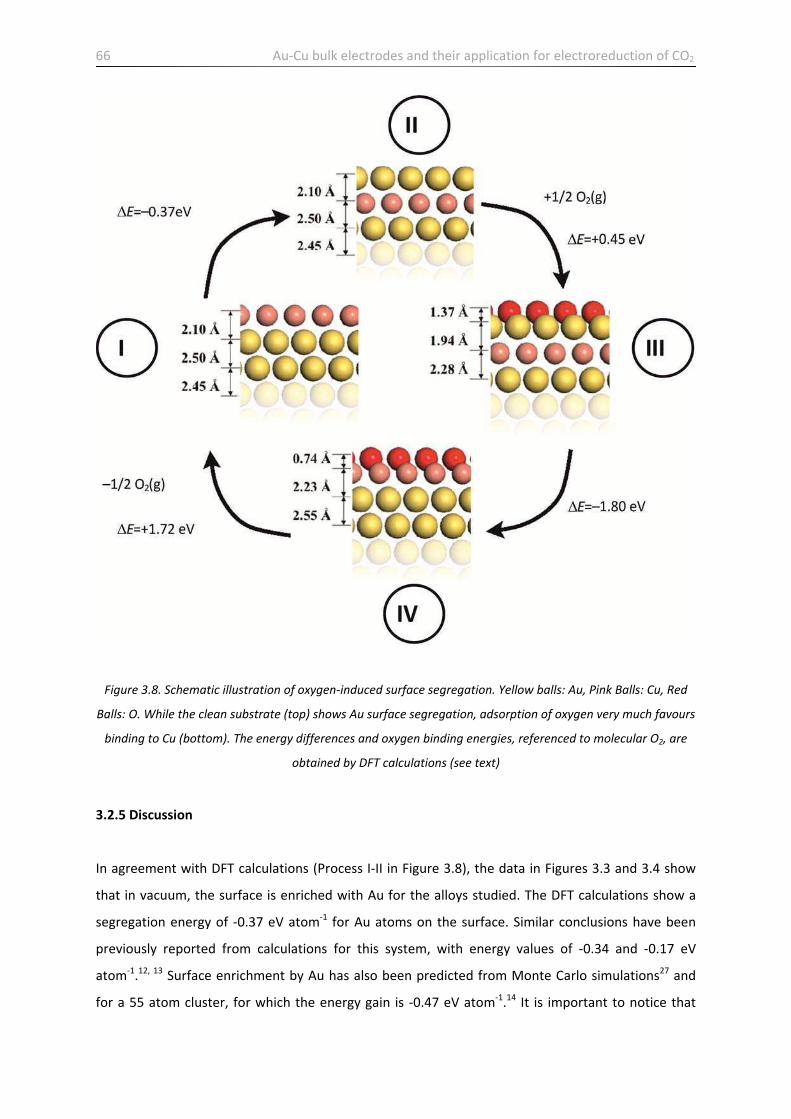
66 Au‐Cu bulk electrodes and their application for electroreduction of CO2
Figure 3.8. Schematic illustration of oxygen‐induced surface segregation. Yellow balls: Au, Pink Balls: Cu, Red
Balls: O. While the clean substrate (top) shows Au surface segregation, adsorption of oxygen very much favours
binding to Cu (bottom). The energy differences and oxygen binding energies, referenced to molecular O2, are
obtained by DFT calculations (see text)
3.2.5 Discussion
In agreement with DFT calculations (Process I‐II in Figure 3.8), the data in Figures 3.3 and 3.4 show
that in vacuum, the surface is enriched with Au for the alloys studied. The DFT calculations show a
segregation energy of ‐0.37 eV atom‐1 for Au atoms on the surface. Similar conclusions have been
previously reported from calculations for this system, with energy values of ‐0.34 and ‐0.17 eV
atom‐1.12, 13 Surface enrichment by Au has also been predicted from Monte Carlo simulations27 and
for a 55 atom cluster, for which the energy gain is ‐0.47 eV atom‐1.14 It is important to notice that
Au‐Cu bulk electrodes and their application for electroreduction of CO2 67
many of these theoretical calculations are simplifications of real systems, since they consider only
guest‐host structures, but they do not include guest‐guest interactions, although the results
obtained from them provide guidelines for the expected segregation behaviour. The DFT calculations
presented here offer a broader picture because interactions between all types of atoms (host‐host,
host–guest, guest‐guest) are considered.
The binding energy of Cu 2p3/2 for all samples studied at all detection angles before exposure to O2
was 932.4 eV (Figure 3.3). This binding energy is ascribed to metallic Cu with no contribution from
copper oxides since the O 1s XP signal before O2 exposure is negligible. The O 1s XP signal did not
increase as the detection angle was decreased, i.e. as deeper layers were probed. Thus, the small
amount of O detected was present on the surface and not in the bulk alloy.
After exposing both samples to O2, the binding energies of the Cu2p3/2 signals remain almost
unchanged (≈ 932.3 eV), but it is important to note that the Cu(I) BE is only 0.2 eV greater than that
of Cu(0).28 As for the O 1s XP signal, the spectra intensities taken at a detection angle of 75o increase
with respect to those before O2 dosing, and the binding energy at 530.9 eV indicates adsorption of O
atoms on the surface.23 From the DFT calculations above, if the surface remained unchanged, oxygen
adsorption on Au would be very unfavourable (+0.45 eV atom‐1, process II‐III in Figure 3.8). Surface
reorganization leading to enrichment by Cu atoms takes place due to the energetically much more
favourable O binding to Cu than to Au atoms (Process III‐IV in Figure 3.8). In consequence, the gain in
energy of ‐1.80 eV atom‐1 resulting from the transfer of Cu atoms to the surface, leads to a
significant surface enrichment by Cu. Although the present calculations have only considered full
monolayers, due to the very large energy gain, a similar behaviour with lower Cu surface
concentrations is expected. These qualitative studies indicate that surface species showing a strong
anisotropy and selectivity for binding to the different alloy constituents are capable of altering
profoundly the surface composition.
The change in surface composition due to oxygen adsorption is clearly demonstrated from the XPS
results in Figures 3.6 and 3.7, where the inversion of population of surface atoms from Au‐ to Cu‐
enriched is very noticeable. This effect is more marked for an alloy with a higher concentration of
Cu. Although the percentual surface Cu concentration increase is similar for both samples (about
26% ), there is a higher percentual concentration of adsorbed O on the surface of the Au0.80Cu0.20
alloy (25% ) than for the Au0.90Cu0.10 alloy (13% ). In consequence, the Au surface concentration
decreases in both cases.
A slight increase in Cu population due to O adsorption was previously observed by Okada et al.29 at
the other extreme of Cu concentrations from that investigated here, for a Cu3Au alloy. There is also
some additional theoretical evidence for the phenomena observed.30 Similar results for the specific

68 Au‐Cu bulk electrodes and their application for electroreduction of CO2
surface enrichment triggered by adsorbates have been obtained for Au‐Pd alloys, where the
presence of H or CO can induce the displacement of Pd atoms from the bulk to the surface;31, 32 and
for nanoalloys where migration of Pd atoms to the surface is observed on applying potentials that
result in the adsorption of oxygenated species.15 In addition, surface rearrangements have been
observed for Pt‐Co nanoalloys in contact with CO.33 Pt binds CO more strongly than Co, leading to
the formation of a Pt skin, which disappears on CO removal and resulting in a repopulation of the
surface with Co.34
3.2.6 Conclusions
In this section it was shown both experimentally (ARXPS) and theoretically (DFT) that for
polycrystalline Au–Cu alloys in vacuum, surface enrichment by Au at room temperature is observed.
When these samples were exposed to an O2 atmosphere, the surface compositions were inverted
due to O adsorption and became Cu‐enriched. The large changes in surface composition detected
indicate that experiments in a condensed phase will not necessarily preserve the bulk alloy
properties and in particular, the adsorption of oxygen species at different applied potentials in
electrochemical experiments will determine the electrocatalytic properties of these alloys due to the
profound changes in surface composition induced by adsorbates.15 Thus, the results presented in
this section indicate that during (electro‐) catalytic reactions that involve adsorbed oxygen species,
the Au–Cu alloy system might not remain rigid, but continuously change its surface composition as
previously discussed for the Pd‐Au system as an example of a ‘‘breathing’’ catalyst, i.e., a surface
alloy where fast atomic exchange processes driven by changes in segregation energies resulting from
adsorption can take place.31 It is expected that the phenomena observed is a general property of
gold‐transition metal alloys for which specific segregation of alloy components would be observed.15
Also, this behaviour might be extended to other types of environment, such as the presence of other
gases (CO2) or electrolytes, thus maybe, affecting the efficiency of the electrode as an
electrocatalyst.

Au‐Cu bulk electrodes and their application for electroreduction of CO2 69
3.3 Temperature‐induced surface segregation of impurities on Au‐Cu bulk
electrodes
3.3.1 Temperature dependent ARXPS experiments – segregation of impurities on a Au‐Cu bulk
electrode
It is important to determine the stability of the alloy electrode as a function of temperature,
whether it is because the electrode is subjected to high temperatures as part of its synthesis (such as
annealing) or as part of its operation cycle. Thus, ARXPS experiments on a Au0.85Cu0.15 sample were
performed at room temperature before and after annealing the sample at 325 oC. Figure 3.9 shows
XPS survey scans for a Au0.85Cu0.15 alloy at room temperature after Ar+ etching and after annealing in
UHV at 325 ˚C for one hour.
Figure 3.9. XPS survey scans for a Au0.85Cu0.15 alloy after Ar+ sputtering. 25 oC: no annealing; 325 oC : after
annealing for 1 hour
Only Au and Cu signals are observed before sample annealing, but after annealing at 325 oC for 1
hour, Pb 4f signals are clearly visible. This shows that the energy input provided by the temperature
increase is enough for Pb impurities that are inside the sample to diffuse to the surface. The binding
energy for Pb 4f7/2 is 136.9 eV, in excellent agreement with the literature data of 136.8 eV,
corresponding to sub monolayer coverage of Pb.35

70 Au‐Cu bulk electrodes and their application for electroreduction of CO2
No other signals from metals besides those of Au and Cu are present, although some small C 1s
signal can be seen, which can be attributed to some contamination of the constituent metals that is
deeply buried in the sample and that diffuses at higher temperatures. Interestingly, Pb was not
observed for any of the other alloys studied at lower temperatures (see previous section). These
results indicate that Pb is strongly specifically adsorbed at the surface and that it diffuses to the
surface when provided with enough energy. Figure 3.10 shows the Cu, Au and Pb atomic
compositions for Au0.85Cu0.15 alloy before and after annealing as a function of XPS detection angle. As
in the previous section, the relative compositions were calculated taking into account the sensitivity
factors for Au, Cu and Pb from the literature. The solid lines are the best fits to the ARXPS data.
Figure 3.10. ARXPS data obtained before (top) and after annealing the polycrystalline Au0.85Cu0.15 alloy at 325 oC for 1 hour (bottom). Cu (filled circles), Au (open circles) and Pb (filled triangles) atomic concentrations (% )
calculated from the XPS data obtained as a function of detection angle. The lines correspond to the best fit
obtained using a concentration‐gradient model with maximum entropy regularisation. Insets: Au 4f, Cu 2p3/2
and Pb 4f signals before and after annealing (the spectra are shifted for clarity)

Au‐Cu bulk electrodes and their application for electroreduction of CO2 71
Note that before annealing a two‐element system (Au and Cu) is considered, whereas after
annealing a three‐element system (Au, Cu and Pb) has to be used. It can clearly be seen that before
annealing, there is Au‐enrichment near the surface, as discussed in the previous section. However,
after annealing the sample at 325 oC for 1 hour, Pb diffuses to the surface, changing the surface
composition, making the surface Pb‐encriched. The concentration profiles as a function of sample
depth are shown in Figure 3.11. As explained in the experimental section, they were calculated using
a concentration gradient model with maximum entropy regularisation.
Figure 3.11. Concentration profiles for Cu (solid line), Au (dashed line) and Pb (dotted line) for a Au0.85Cu0.15
alloy before (top) and after annealing at 325 oC (bottom)

72 Au‐Cu bulk electrodes and their application for electroreduction of CO2
3.3.2 DFT modelling
The unexpected diffusion of Pb impurities to the surface of the electrode was modelled by DFT. They
were also done by Prof. Timo Jacob at Ulm University, Germany, as part of collaboration in the
ELCAT network. In this case, the calculations were performed with the CASTEP (Cambridge Serial
Total Energy Package) code7 that implements density functional theory (DFT) using plane‐wave
pseudopotentials. For all atoms, the core electrons were replaced by Vanderbilt ultrasoft
pseudopotentials.36 The exchange‐correlation energies were evaluated with the PBE‐form of the
generalized‐gradient approximation (GGA). In this work, a plane‐wave basis set with an energy cut‐
off of 380 eV was used for all surfaces. The Brillouin zones of the (1×1)‐surface unit cells were
sampled with (4×4) Monkhorst–Pack k‐point meshes. These surfaces were represented by 5‐layer
slabs, where periodic images were separated by a vacuum of at least 13 Å. During the geometry
optimizations the bottom two layers were fixed at the calculated bulk structure, and the geometry
of the remaining layers (plus adsorbates) was fully optimised (up to < 0.01 eV/Å).
In order to quantify the driving force for the observed segregation, Au(111) surfaces were modelled
with different amounts of Pb (1/9, 1/4, and 1.0 ML Pb) either being adsorbed on the surface or
replacing Au atoms in the first, second, or third topmost layers. This provides information about the
general segregation behaviour although multiple near‐surface layers might be influenced by this
segregation tendency (e.g., alternating decay of the enrichment by Pb). For a full Pb layer, the
adsorption on the Au(111) surface is 0.16 and 0.27 eV/Pb‐atom more stable than having Pb in the
second or third surface layer respectively, i.e. absorption is not favourable. However, when
considering lower coverages, absorption in the first layer becomes the preferred structure, while
having Pb in the lower surface layers shows the same trend of decreasing stability as with a full Pb
layer, but with higher energy differences. Here, having 1/4 ML Pb in the first surface layer is 0.74 and
1.00 eV/Pb more stable than having Pb in the second or third layers, respectively. Lowering the
coverage to 1/9 ML, that can be considered as a zero‐coverage limit, the segregation energy
increases slightly to 1.00 and 1.16 eV/Pb, respectively. These calculations show that Pb is more likely
to be at or near the surface of Au(111), a feature that was also observed with ARXPS (see Figures
3.10 and 3.11).
In order to compare the stability of the different surface compositions the surface free energies (see
Table 3.1), which should be lowest for the most stable configuration, were also analysed.

Au‐Cu bulk electrodes and their application for electroreduction of CO2 73
Pb in layer
Coverage
1/9 ML 1
/4 ML 1.0 ML
Adsorption 0 0.72 0.69 1.29
Absorption 1 0.70 0.61 1.28
2 0.80 0.80 1.43
Bulk 0.83 0.86 1.53
Table 3.1. Surface free energies 紘 (in eV/surface‐atom) for different amounts of Pb in different surface layers
In this case, the overall lowest value (i.e. highest stability) is obtained for 1/4 ML Pb in the first
surface layer (紘 = 0.61 eV/surface‐atom), although adsorption on the surface is only 0.08 eV/surface‐
atom less stable. The next stable structure is with 1/9 ML Pb, where again absorption into the first
surface layer is preferred. As expected, the least stable configuration is with a full Pb monolayer,
which is certainly due to the relatively weak Pb—Pb interactions compared to those of Au—Au.
From these calculations it can be concluded that Pb will indeed be present near the surface. The
most stable configuration is obtained for a surface that contains roughly 1/4 ML Pb in the first layer,
onto which additional Pb might be adsorbed.
Although these calculations refer to pure Au, the results would not be expected to differ for the alloy
studied since it was shown in the previous section that the alloy surface is enriched by Au atoms in
UHV.
3.3.3 Discussion
The surface coverage by Pb that would be expected for a diffusion controlled process can be
calculated assuming that adsorption is an irreversible process for this system and therefore, it can be
calculated from the integrated Fick’s first law for linear diffusion:37
ち岫建岻 噺 態帖迭/鉄寵弐痛迭/鉄訂迭/鉄 (3.1)
where ち岫建岻 is the surface concentration of Pb, 建 is the time, 経 is the diffusion coefficient of Pb atoms
in the materials and 系長 is the bulk concentration of Pb in the alloy.

74 Au‐Cu bulk electrodes and their application for electroreduction of CO2
Equation (3.1) assumes that there is no change in the activity coefficient of Pb with distance and
therefore, the value of 経 is uniform in all the material, and also that there are no additional
contributions to the diffusion rate, for instance, due to the formation of intermetallics or separate
phase formation. The temperature dependence of the solid state diffusion of Pb in Au was
investigated by Schopper38 between 20 and 100 ˚C employing an optical technique. It was found that
diffusion of Pb could be regarded as an activated process with a diffusion coefficient given by:
経 噺 岫ど.どな6 罰 ど.どどの岻結貸帳尼迩禰/眺脹 (3.2)
where 継銚頂痛 is the activation energy for diffusion, 迎 is the gas constant and 劇 is the absolute
temperature. From the work of Schopper, 継銚頂痛 = 71 ± 8 kJ mol‐1 and from equation (3.2), the
diffusion coefficient of Pb in Au at 598 K is approximately 経泰苔腿 = 9.8 x 10‐9 cm2 s‐1. No other reliable
data for the diffusion coefficient of Pb was found in the literature. The extrapolation of equation
(3.2) outside the range of measurements will introduce some uncertainty in the value of the
diffusion coefficient but in the absence of additional information, this value was employed to obtain
a qualitative estimate of the degree of coverage that could be expected.
From equation (3.2) and considering a diffusion time of 1 h (the annealing time), the expected
coverage is given by ち岫建岻 = 6.53 × 10‐3 系長 (系長 in mol cm‐3). From the densities of Cu and Au,39 the
alloy density was estimated at 17.77 g cm‐3 assuming approximate ideal solution behaviour and
therefore, a surface concentration of Pb can be estimated for a given concentration of impurity in
the alloy. From the above, a 1 ppm concentration of Pb as impurity would result in a Pb coverage of
5.7 x10‐10 mol cm‐2 or an atomic concentration of 3.5 x 1014 cm‐2. Considering a surface concentration
of Au of 1.5 x 1015 cm‐2,40 these calculations predict a 23% surface coverage, very close to the value
observed experimentally (≅ 22% , see Figure 3.11, bottom). The measurement of the actual level of
impurities in the materials employed to compare with this result presents great analytical difficulties
and the example given indicates the range of concentrations for which segregation of Pb would be
observed.
3.3.4 Conclusions
The results presented in this section are a clear example of the importance of low concentration of
impurities in alloys in determining the surface composition of bulk alloys. As the DFT calculations
show, Pb impurity atoms have a strong tendency to accumulate near the surface (either adsorbed on
the surface or absorbed in the first surface layer). Since annealing will enhance the system to

Au‐Cu bulk electrodes and their application for electroreduction of CO2 75
assume its preferred structure and composition distribution, drastic changes in the catalytic
behaviour would be expected for bulk samples. It is interesting to note, however, that the degree of
surface contamination for nanoparticles will be strongly dependent on their size due to the
availability of impurity atoms per cluster. In the example shown above, if the alloy containing 1 ppm
of Pb as impurity is present as nanoparticles of 5 nm diameter, on average 1 in 295 particles will
contain a single atom of Pb and hence, will have a very small effect on the electrocatalytic properties
of a nanoparticulate electrode. This unusual result is due to the confinement of Pb in the dispersed
nanoparticle material. The influence of the impurities on electrocatalytic properties will depend,
therefore, on the average size. So, even though a 1 ppm of Pb would appear as a high concentration
of poison for electrocatalytic reactions on bulk electrodes, this will, surprisingly, have an almost
undetectable effect for small nanoparticles.
3.4 Electroreduction of CO2 with Au‐Cu bulk electrodes
3.4.1 Introduction
Au‐Cu bulk alloys present segregation of Au atoms to the surface, but in the presence of oxygen, the
opposite occurs, as discussed above. Thus, the surface composition of an electroactive electrode is
subject to the environment and its reactivity might be affected by it. Previous work show that Cu
electrodes are suitable for CO2 reduction to C‐products, but their long‐term stability is an issue not
yet resolved. Alloying Au to Cu could provide extra stability whilst maintaining their catalytic activity
towards CO2 reduction. This section will focus on their reactivity towards CO2 reduction.
3.4.2 Sample preparation and characterization
Polycrystalline Au‐Cu bulk alloys were prepared in the same way as described in section 3.2.1. Three
different compositions were prepared: Au0.90Cu0.10, Au0.85Cu0.15 and Au0.80Cu0.20, as well as a pure Au
and pure Cu electrode. In this case, the samples were machined to a cylindrical shape with a
diameter of 0.3 cm, and they were fitted into PTFE sheaths so as to make disc electrodes of 0.072
cm2 area. Figure 3.12 shows some pictures detailing the samples.

76 Au‐Cu bulk electrodes and their application for electroreduction of CO2
Figure 3.12. Au‐Cu bulk alloys used for electroreduction experiments.
The electrodes were analysed by X‐ray diffraction, to ensure that alloys were formed. The results are
very similar to those obtained for the alloys used for ARXPS experiments, that is, no individual
reflections for the alloying elements were observed, indicating that the samples obtained were solid
solutions. The shifts for the reflections as a function of Au content follow Vegard’s law, indicating the
alloying of the constituent metals. Before performing electrochemical experiments, each electrode
was polished with 1200 and 2400 abrasive paper and then with 9, 3, 1, 0.3 and 0.05 m alumina
slurries (Buehler, Germany). The samples were rinsed with copious amounts of Milli‐Q water
(Millipore, USA) and sonicated in Milli‐Q water between each polishing step.
3.4.3 Electrochemical cells used for CO2 reduction
Cyclic voltammograms of bulk Au, Cu and Au‐Cu alloys were made in a three electrode cell of 50 ml
capacity (see Figure 3.13). The cell had two extra orifices: one as a gas inlet, with a special dispenser
that allowed the gas to be bubbled inside the solution or just above it; and a second orifice that
served as gas outlet. The same cell was used for electrolysis experiments of bulk Au and Au‐Cu
alloys.

Au‐Cu bulk electrodes and their application for electroreduction of CO2 77
Figure 3.13. (a) Details of the electrochemical cell used for the electrochemical experiments of CO2 reduction.
The working electrode (see Figure 3.12) is situated at the bottom of the holder. (b) Picture of the experimental
setup. Gas bottles to saturate the solution either with Ar or CO2. The potentiostat is shown the bottom right of
the picture
A special flow cell was used for the electrolysis experiments with a Cu electrode, as shown in Figure
3.14.
Figure 3.14. Pictures of the two‐electrode flow cell used for electrolysis experiments. (a) View from one end of
the stack. The two protruding electrodes are the Cu cathode and the DSA®‐O2 anode. (b) Side view of the stack,
where each part of the stack can clearly be seen. (c) Connection to the peristaltic pumps, anolyte and catholyte.
(d) Disassembled cell, with each part pictured. The only part not shown is the Nafion®‐423 membrane that
separates the anode from the cathode

78 Au‐Cu bulk electrodes and their application for electroreduction of CO2
This was a commercial two electrode flow cell (Micro Flow Cell, Electrocell, Denmark). It was
connected to two peristaltic pumps (see Figure 3.14c), one for the catholyte (0.1 M KHCO3) and one
for the anolyte (0.5 M H2SO4). The two electrodes were made of Cu (cathode) and a DSA®‐O2
(anode). The cell was constructed of stacks, which were pressed together by six screws on their
corners. The cathode and anode compartments were separated by a Nafion®‐423 membrane.
3.4.4 Electroreduction of CO2
Figure 3.15 shows the cyclic voltammograms of pure Au and Cu bulk electrodes in 0.1 M KHCO3, pH
6.8, saturated with Ar (full lines) and CO2 (dotted lines).
Figure 3.15. Cyclic voltammograms of Au and Cu bulk electrodes in 0.1 M KHCO3, pH 6.8. Full black line: Ar
saturated solution; dotted lines: CO2 saturated solution. Scan rate: 10 mV s‐1
Both Au and Cu electrodes in Ar saturated solution show an increase in current starting around ‐1 V,
which is the hydrogen evolution reaction; consequently bubble formation on the surface of the
electrodes at very negative potentials was observed.
In CO2 saturated solution the Au electrode presents a shoulder between ‐0.9 and ‐1.5 V. This is due
to CO2 being reduced to CO which then partially blocks the electrode by adsorbing to the Au
electrode,41 and thus the current decreases slowly at these potentials because it inhibits the
competing hydrogen evolution reaction. At more negative potentials, CO desorbs from the Au
electrode, which is not able to further reduce it42 but hydrogen evolution becomes more prominent
and starts unblocking the electrode and thus the current decreases again more rapidly.
For the Cu electrode the onset of CO2 reduction is shifted to slightly less negative potentials (+ 0.1 V)
compared to hydrogen evolution in Ar saturated solution. Cu is able to reduce CO2 to CO, as Au does,

Au‐Cu bulk electrodes and their application for electroreduction of CO2 79
but then CO is further reduced to other species (hydrocarbons and alcohols) on a Cu electrode, a fact
that is suggested by the voltammogram in the slight shoulder at around ‐1.3 V.
As it has been reported before, gaseous products from the reduction of CO2 in aqueous solutions on
Cu electrodes are CO (which is known now to be a key intermediate in the reduction of CO2), CH4,
C2H4 and small amounts of C2H6.43, 44 Liquid products are not as effectively produced, but CHOOH,
C2H5OH and n‐C3H7OH have been detected.43
Most previous works were oriented towards the detection of gaseous products and a discussion
about the possible mechanisms of CH4 and C2H4 formation was presented in the introduction, so no
attempt was made to further study this line of investigation. Instead, the focus was turned to the
liquid products generated after CO2 reduction, mainly the detection of C2H5OH and n‐C3H7OH. For
this purpose a commercial flow cell (see previous section) was used, and the electrolysis of a metallic
Cu electrode at constant current was run. The current was set at ‐50 mA, and every ten seconds, a 1
s pulse at +10 mA was applied. It was found that with this method the electrode lasted longer
without deactivation.45 The liquid products of the electrolysis were analysed with a GC (see Chapter
2) and the results are presented in Figure 3.15.
Figure 3.15. GC results for Cu electrode in CO2‐saturated 0.1 M KHCO3 (a) after 5 hours of electrolysis at ‐1.8 V
vs. Ag/AgCl. (b) before electrolysis.
No peaks are detected in the electrolyte solution before the electrolysis (Figure 3.15 (b)). After the
electrolysis was run for 5 consecutive hours, three clear peaks are detected at 1.087, 1.197 and
1.219 minutes. As a control, a mix of CH3OH, C2H5OH and iso‐C3H7OH in H2O was run, and it was
found that the peak at 1.087 min corresponded to C2H5OH, showing that the Cu electrode is capable
of reducing CO2 to alcohols. The other two peaks correspond to C3‐species.
a
b
C2H5OH C3‐Species

80 Au‐Cu bulk electrodes and their application for electroreduction of CO2
Au electrode electrolysis was run in a smaller cell (due to the limitations of using a large Au
electrode). As expected, no liquid products were detected as Au reduces CO2 to CO only, in
agreement with the literature.
Figure 3.16 shows the cyclic voltammograms of Au‐Cu bulk electrodes in 0.1 M KHCO3, pH 6.8,
saturated with Ar (full lines) and CO2 (dotted lines).
Figure 3.16. Cyclic voltammograms of Au‐Cu bulk electrodes in 0.1 M KHCO3, pH 6.8. Left: Au0.90Cu0.10, middle:
Au0.85Cu0.15, right: Au0.80Cu0.20 .Full black line: Ar saturated solution; dotted lines: CO2 saturated solution
There is clear evidence of CO2 reduction to CO in all three alloys studied: partial blockage of the
electrode by CO in CO2 saturated solution (dotted lines) is seen at around ‐1 V. There is not a clear
relationship between the shape of the voltammogram and the Cu content of the electrodes. In fact,
it is more probable that the voltammogram shape is influenced by which kind of surface the
electrode presents. According to previous work,46 a smooth polycrystalline Cu surface, with low
index faces promotes CO2 reduction mainly to CO but also with a high contribution of hydrogen
evolution. Roughening of the surface directs the reduction of CO2 to hydrocarbons, while minimizing
the competing reaction of hydrogen evolution.47 It is probable that for these samples, the large
amount of Au (relative to Cu), coupled with a probable smooth surface contributes to the reaction
being veered towards CO formation and not to C‐products. GC measurements show that no liquid
products are being formed.
3.5 Final Comments
In this chapter, surface properties and electrocatalytic activity towards CO2 reduction of Au‐Cu alloy
electrodes were studied. Au‐Cu alloys have preferentially Au‐enriched surfaces in vacuum, while the
reverse situation takes place when the electrode is in the presence of O2; an example of a
‘‘breathing’’ catalyst. Also, it was shown that the presence of impurities deep inside the electrodes

Au‐Cu bulk electrodes and their application for electroreduction of CO2 81
can diffuse to the surface if the sample is annealed. Extra care needs to be taken while synthesizing
and handling the electrodes as these impurities could affect drastically the performance of the
electrodes as electrocatalysts. Finally, the electroreduction of CO2 was studied using these
electrodes. Cu was shown to produce liquid organic products, Au produces only CO and the Au‐Cu
alloys did not produce any detectable amounts of CO2‐reduced liquid species.
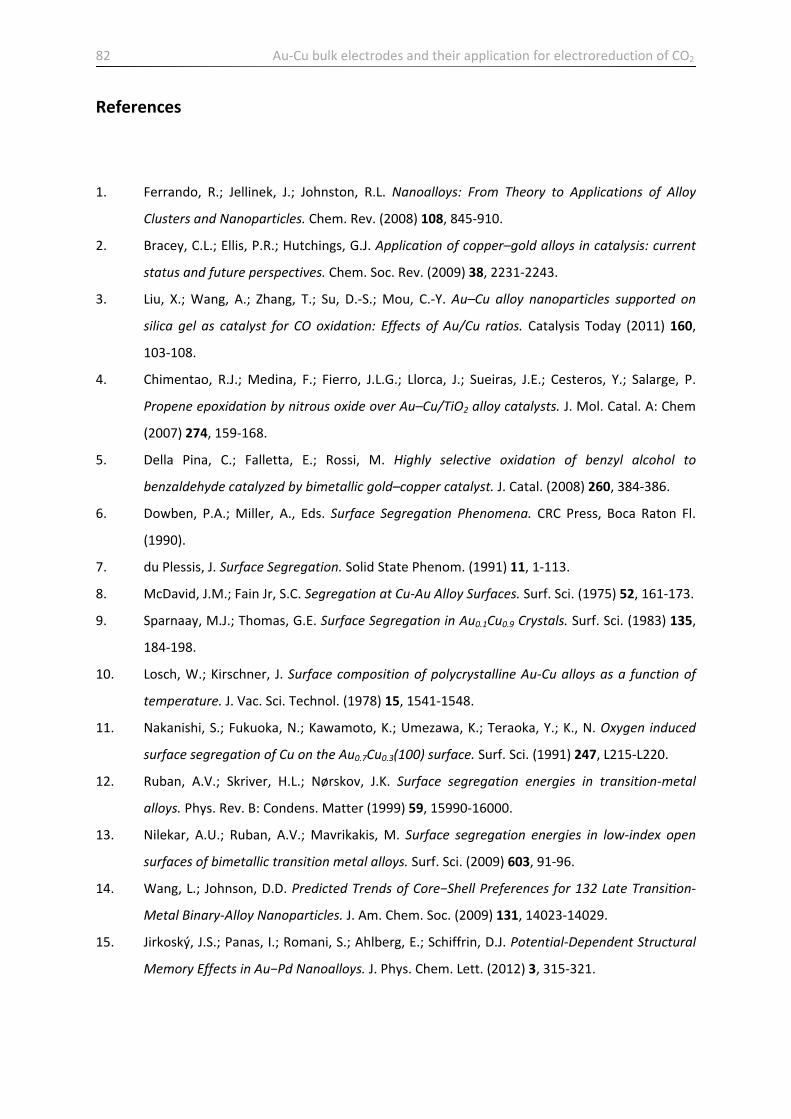
82 Au‐Cu bulk electrodes and their application for electroreduction of CO2
References
1. Ferrando, R.; Jellinek, J.; Johnston, R.L. Nanoalloys: From Theory to Applications of Alloy
Clusters and Nanoparticles. Chem. Rev. (2008) 108, 845‐910.
2. Bracey, C.L.; Ellis, P.R.; Hutchings, G.J. Application of copper–gold alloys in catalysis: current
status and future perspectives. Chem. Soc. Rev. (2009) 38, 2231‐2243.
3. Liu, X.; Wang, A.; Zhang, T.; Su, D.‐S.; Mou, C.‐Y. Au–Cu alloy nanoparticles supported on
silica gel as catalyst for CO oxidation: Effects of Au/Cu ratios. Catalysis Today (2011) 160,
103‐108.
4. Chimentao, R.J.; Medina, F.; Fierro, J.L.G.; Llorca, J.; Sueiras, J.E.; Cesteros, Y.; Salarge, P.
Propene epoxidation by nitrous oxide over Au–Cu/TiO2 alloy catalysts. J. Mol. Catal. A: Chem
(2007) 274, 159‐168.
5. Della Pina, C.; Falletta, E.; Rossi, M. Highly selective oxidation of benzyl alcohol to
benzaldehyde catalyzed by bimetallic gold–copper catalyst. J. Catal. (2008) 260, 384‐386.
6. Dowben, P.A.; Miller, A., Eds. Surface Segregation Phenomena. CRC Press, Boca Raton Fl.
(1990).
7. du Plessis, J. Surface Segregation. Solid State Phenom. (1991) 11, 1‐113.
8. McDavid, J.M.; Fain Jr, S.C. Segregation at Cu‐Au Alloy Surfaces. Surf. Sci. (1975) 52, 161‐173.
9. Sparnaay, M.J.; Thomas, G.E. Surface Segregation in Au0.1Cu0.9 Crystals. Surf. Sci. (1983) 135,
184‐198.
10. Losch, W.; Kirschner, J. Surface composition of polycrystalline Au‐Cu alloys as a function of
temperature. J. Vac. Sci. Technol. (1978) 15, 1541‐1548.
11. Nakanishi, S.; Fukuoka, N.; Kawamoto, K.; Umezawa, K.; Teraoka, Y.; K., N. Oxygen induced
surface segregation of Cu on the Au0.7Cu0.3(100) surface. Surf. Sci. (1991) 247, L215‐L220.
12. Ruban, A.V.; Skriver, H.L.; Nørskov, J.K. Surface segregation energies in transition‐metal
alloys. Phys. Rev. B: Condens. Matter (1999) 59, 15990‐16000.
13. Nilekar, A.U.; Ruban, A.V.; Mavrikakis, M. Surface segregation energies in low‐index open
surfaces of bimetallic transition metal alloys. Surf. Sci. (2009) 603, 91‐96.
14. Wang, L.; Johnson, D.D. Predicted Trends of Core−Shell Preferences for 132 Late Transiピon‐
Metal Binary‐Alloy Nanoparticles. J. Am. Chem. Soc. (2009) 131, 14023‐14029.
15. Jirkoský, J.S.; Panas, I.; Romani, S.; Ahlberg, E.; Schiffrin, D.J. Potential‐Dependent Structural
Memory Effects in Au−Pd Nanoalloys. J. Phys. Chem. Lett. (2012) 3, 315‐321.

Au‐Cu bulk electrodes and their application for electroreduction of CO2 83
16. Vegard, L. Die Konstitution der Mischkristalle und die Raumfüllung der Atome. Z. Phys. (1921)
5, 17‐26.
17. Scofield, J.H. Hartree‐Slater Subshell Photoioniztion Cross‐Sections at 1254 and 1487 eV. J.
Electron Spectrosc. Relat. Phenom. (1976) 8, 129‐137.
18. ASF Dataset, 2008, provided by SPECS.
19. Smith, G.C.; Livesey, A.K. Maximum Entropy: a New Approach to Non‐destructive
Deconvolution of Depth Profiles from Angle‐dependent XPS. Surf. Interface Anal. (1992) 19,
175‐180.
20. Livesey, A.K.; Smith, G.C. The determination of depth profiles from angledependent XPS using
maximum entropy data analysis. J. Electron Spectrosc. Relat. Phenom. (1994) 67, 439‐461.
21. Paynter, R.W. An ARXPS primer. J. Electron Spectrosc. Relat. Phenom. (2009) 169, 1‐9.
22. Mróz, S. Experimental determination of the composition depth profile of AuCu alloys via
Auger electron spectroscopy. Prog. Surf. Sci. (1998) 59, 323‐330.
23. Polcik, M.; Wilde, L.; Haase, J.; Brena, B.; Cocco, D.; Comelli, G.; Paolucci, G. Adsorption and
temperature‐dependent decomposition of SO2 on Cu(100) and Cu(111): A fast and high‐
resolution core‐level spectroscopy study. Phys. Rev. B: Condens. Matter (1996) 53, 13720‐
13724.
24. Zemek, J. Electron Spectroscopy of Corrugated Solid Surfaces. Anal. Sci. (2010) 26, 177‐186.
25. Oswald, S.; Oswald, F. Modeling of surface roughness for ARXPS. Phys. Status Solidi C (2007)
4, 1817‐1821.
26. Verdozzi, C.; Schultz, P.A.; Wu, R.; Edwards, A.H.; Kioussis, N. Layer intermixing during
metal/metal oxide adsorption: Ti/sapphire(0001). Phys. Rev. B: Condens. Matter (2002) 66,
125408.
27. Good, B.; Bozzolo, G.H.; Abel, P.B. Surface segregation in ternary alloys. Surf. Sci. (2000) 454‐
456, 602‐607.
28. Poulston, S.; Parlett, P.M.; Stone, P.; Bowker, M. Surface Oxidation and Reduction of CuO
and Cu2O Studied Using XPS and XAES. Surf. Interface Anal. (1996) 24, 811‐820.
29. Okada, M.; Moritani, K.; Fukuyama, T.; Mizutani, H.; Yoshigoe, A.; Teraoka, Y.; Kasai, T.
Comparative study of oxidation on Cu and Cu3Au surfaces with a hyperthermal O2 molecular
beam. Surf. Sci. (2006) 600, 4228‐4232.
30. Poon, H.C.; Khanra, B.C.; King, T.S. Surface composition of clean and oxygen‐covered Au3Cu
alloy. Phys. Rev. B: Condens. Matter (1993) 47, 16494‐16498.
31. Venkatachalam, S.; Jacob, T. Hydrogen adsorption on Pd‐containing Au(111) bimetallic
surfaces. Phys. Chem. Chem. Phys. (2009) 11, 3263‐3270.

84 Au‐Cu bulk electrodes and their application for electroreduction of CO2
32. Soto‐Verdugo, V.; Metiu, H. Segregation at the surface of an Au/Pd alloy exposed to CO. Surf.
Sci. (2007) 601, 5332‐5339.
33. Mayrhofer, K.J.J.; Hartl, K.; Juhart, V.; Arenz, M. Adsorbate‐Induced Surface Segregation for
Core–Shell Nanocatalysts. Angew. Chem. Int. Ed. (2009) 48, 3529‐3531.
34. Mayrhofer, K.J.J.; Hartl, K.; Juhart, V.; Arenz, M. Degradation of Carbon‐Supported Pt
Bimetallic Nanoparticles by Surface Segregation. J. Am. Chem. Soc. (2009) 131, 16348‐16349.
35. Liu, G.; Davis, K.A.; Meier, D.C.; Bagus, P.S.; Goodman, D.W.; Zajac, G.W. Interactions of
ultrathin Pb films with Ru(0001) and Pd(111). Phys. Rev. B (2003) 68, 035406.
36. Vanderbilt, D. Soft self‐consistent pseudopotentials in a generalized eigenvalue formalism.
Phys. Rev. B (1990) 41, 7892‐7895.
37. Bard, A.J.; Faulkner, L.R. Electrochemical Methods ‐ Fundamentals and Applications, 2nd Ed.
John Wiley & Sons, New Jersey, (2001).
38. Schopper, H. Die optische Untersuchung der Diffusion von Metallen ineinander. Z. Physik
(1955) 143, 93‐117.
39. Emsley, J. The Elements. Clarendon Press, Oxford, (1989).
40. CRC Handbook of Chemistry and Physics, 87th Ed. Ed.Lide, D.R. Taylor and Francis: Boca
Raton, (2007).
41. Christophe, J.; Doneux, T.; Buess‐Herman, C. Electroreduction of Carbon Dioxide on Copper‐
Based Electrodes: Activity of Copper Single Crystals and Copper–Gold Alloys. Electrocatal.
(2012) 3, 139‐146.
42. Hori, Y. CO2‐reduction, catalyzed by metal electrodes, in Handbook of Fuel Cells.
Eds.Vielstich, W.; A. Lamm; H.A. Gasteiger. John Wiley & Sons, Inc.: New York, (2003).
43. Hori, Y.; Murata, A.; Takahashi, R. Formation of Hydrocarbons in the Electrochemical
Reduction of Carbon Dioxide at a Copper Electrode in Aqueous Solution. J. Chem. Soc.,
Faraday Trans. 1 (1989) 85, 2309‐2326.
44. Kim, J.J.; Summers, D.P.; Frese Jr., K.W. Reduction of CO2 and CO to methane on Cu foil
electrodes. J. Electroanal. Chem. (1988) 245, 223‐244.
45. Jermann, B.; Augustynski, J. Long‐term activation of the copper cathode in the course of CO2
reduction. Electrochim. Acta (1994) 39, 1891‐1896.
46. Tang, W.; Peterson, A.A.; Varela, A.S.; Jovanov, Z.P.; Bech, L.; Durand, W.J.; Dahl, S.; Nørskov,
J.K.; Chorkendorff, I. The importance of surface morphology in controlling the selectivity of
polycrystalline copper for CO2 electroreduction. Phys. Chem. Chem. Phys. (2012) 14, 76‐81.

Au‐Cu bulk electrodes and their application for electroreduction of CO2 85
47. Kyriacou, G.; Anagnostopoulos. Electroreduction of CO2 on differently prepared copper
electrodes. The influence of electrode treatment on the current efficiences. J. Electroanal.
Chem. (1992) 322, 233‐246.

86 Au‐Cu bulk electrodes and their application for electroreduction of CO2

87 Au‐Cu alloy nanoparticles supported on carbon black
Chapter 4
Au-Cu alloy nanoparticles
supported on carbon black and their application for
electroreduction of CO2

88 Au‐Cu alloy nanoparticles supported on carbon black

Au‐Cu alloy nanoparticles supported on carbon black 89
4.1 Introduction
Metallic alloys give a broader range of properties than its base metal parts. In many cases, there is
an enhancement in specific properties upon alloying due to synergistic effects, and the rich diversity
of compositions, structures, and properties of metallic alloys has led to widespread applications,
especially in catalysis.1, 2 Thus, there is a big interest in synthesis and characterization of bimetallic
alloy nanoparticles.
Au‐Cu nanoalloys have been used for many electrocatalytic reactions such as CO oxidation,3 propene
epoxidation4 and selective oxidation of benzyl alcohol to yield benzaldehyde.5 However, despite its
importance, Au‐Cu nanoparticles have not been used for the electroreduction of CO2. This chapter
will focus on this reaction using Au‐Cu alloys in the nanoparticle state.
4.2. Synthesis and characterization of Au‐Cu alloy nanoparticles
4.2.1 Synthesis
Nanocrystalline Au‐Cu alloys supported on carbon black (Vulcan XC‐72R, Cabot Corporation, USA)
were employed. Before use, carbon black was treated by an acid wash (2 M HNO3) to eliminate
metal ion impurities. It was then washed repeatedly in water and then dried in air at 60 oC. The
nanoparticle synthesis is a slight variation of a Au nanoparticle recipe published earlier in Schiffrin’s
group.6 The desired amounts of HAuCl4.3H2O and Cu(NO3)2.xH2O (see Table 1) were dissolved in 1 L
of water and a polyvinyl alcohol (PVA) solution (25 mg in 50 ml H2O) was added. While stirring the
solution, 0.1 M aqueous NaBH4 was then added drop wise in a ten‐fold excess to ensure complete
reduction of the metals. The Au‐Cu colloidal solution was then added slowly (5 min) to a vigorously
stirred suspension of treated carbon dispersed in 200 ml of water in an ultrasonic bath. After
addition of the Au‐Cu colloidal solution, the dispersion was stirred for another hour and the carbon
supported catalyst was left to settle overnight. The catalyst was then separated by centrifugation
and washed with water until no chloride was detected with a AgNO3 solution, dried in air at 60 oC
and finally annealed for 5 h in a tube furnace at 320 oC under a 10% H2/90% Ar stream.

90 Au‐Cu alloy nanoparticles supported on carbon black
Sample HAuCl4.3H2O
mass (mg)
Cu(NO3)2.xH2O
mass (mg)
Carbon black
mass (mg)
Au 100 0 200.08
Au0.95Cu0.05 95 2.39 193.32
Au0.90Cu0.10 90 4.77 186.54
Au0.85Cu0.15 85 7.15 179.76
Au0.80Cu0.20 80 9.54 172.99
Au0.75Cu0.25 75 11.92 166.21
Cu 0 47.64 64.56
Table 1: Amounts of metal precursors and carbon black used for the synthesis of Au‐Cu nanoparticles. The
amounts were calculated to yield a metal loading of 20 w/w% with respect to the carbon black
4.2.2 Sample characterization
After the Au‐Cu colloid solution was prepared and before adding it to the carbon black water
dispersion, an aliquot was taken to the UV‐Vis spectrometer. Figure 1 shows the UV‐Vis spectra for
all the Au‐Cu colloids prepared (the spectra are shifted vertically for clarity) as well as some pictures
of the colloids and the carbon supported catalysts.
Figure 4.1. (a) UV‐Vis spectra of the Au‐Cu colloids studied. Spectra have been shifted vertically for clarity. (b)
Picture of Au‐Cu colloids with increasing amount of Cu from left to right. (c) Picture of carbon supported
catalysts

Au‐Cu alloy nanoparticles supported on carbon black 91
For the pure Au nanoparticles, there is a clear plasmon resonance band at ≈ 505 nm. As the Cu
content on the nanoparticles increases, the plasmon band shifts to higher wavelengths towards the
pure Cu nanoparticles plasmon band located at ≈ 570 nm. Alloy formation is suggested by the fact
that the optical absorption spectra show only one plasmon band.7 Two bands would be expected for
the case of a mixture of gold and copper nanoparticles. Moreover, there is a continuous shift of the
plasmon band that goes from that of pure Au band to the pure Cu band.
Small samples of the as‐prepared carbon supported catalysts were dissolved in freshly prepared
aqua regia and these solutions were analysed by ICP. Table 4.1 shows the metal molar fractions
obtained for each sample. From here on, the actual molar fractions will be used to identify each
sample. Table 4.1 also shows the metal concentration (Au + Cu) in relation to the amount of carbon
black ((Au + Cu) / C) (metal loading (w/w% )). These vary between 5 and 15 w/w% while the initial
nominal loading was 20 w/w% . It was noted that some of the Au‐Cu nanoparticles remained in
solution after addition to the carbon substrate. The loadings obtained were different from those
previously reported,6 although preparation conditions were similar. Slight variability in the various
samples employed can account for the different loadings.
Sample ICP molar fractions
(Au / Cu)
Loading (Au +
Cu) / C (w/w% )
TEM Particle
Diameter (nm)
XRD Particle
Diameter (nm)
Lattice
Parameter (nm)
Au 1 / 0 5.60 2.9 ± 0.5 3.3 ± 0.9 0.4076 ± 0.0045
Au0.95Cu0.05 0.93 / 0.07 9.63 3.6 ± 0.7 3.2 ± 0.9 0.4061 ± 0.0017
Au0.90Cu0.10 0.88 / 0.12 7.09 4.3 ± 1.3 3.6 ± 1.1 0.4044 ± 0.0015
Au0.85Cu0.15 0.82 / 0.18 8.14 5.8 ± 2.5 5.3 ± 0.8 0.4034 ± 0.0018
Au0.80Cu0.20 0.76 / 0.24 7.35 8.7 ± 2.8 7.9 ± 1.0 0.4015 ± 0.0007
Au0.75Cu0.25 0.71 / 0.29 9.30 10.3 ± 3.6 8.5 ± 1.2 0.3991 ± 0.0005
Cu 0 / 1 14.55 18.2 ± 4.1 17.4 ± 3.0 0.3610 ± 0.0003
Table 4.1. Results from the characterisation of the Au‐Cu nanoparticles supported on carbon black
The X‐ray diffraction patterns for the Au‐Cu nanoparticles supported on carbon black are shown in
Figure 4.2. No individual reflections for the alloying elements are observed, giving more evidence
that the nanoparticles obtained were solid solutions.
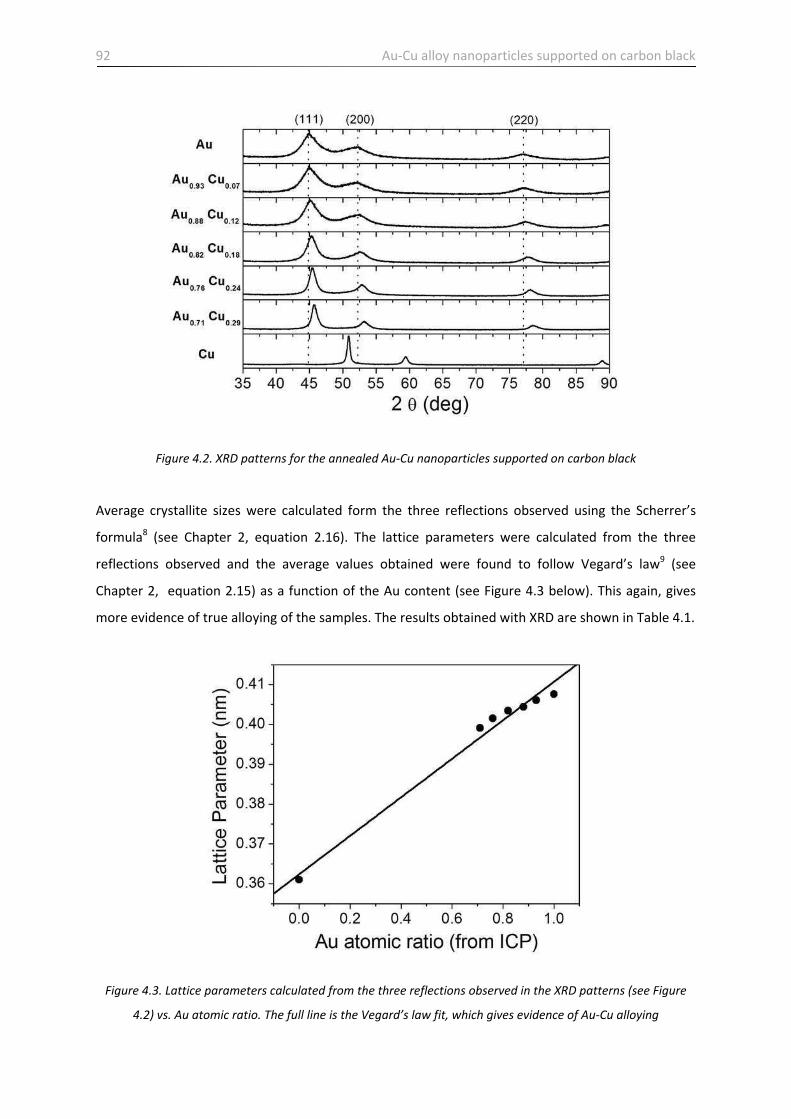
92 Au‐Cu alloy nanoparticles supported on carbon black
Figure 4.2. XRD patterns for the annealed Au‐Cu nanoparticles supported on carbon black
Average crystallite sizes were calculated form the three reflections observed using the Scherrer’s
formula8 (see Chapter 2, equation 2.16). The lattice parameters were calculated from the three
reflections observed and the average values obtained were found to follow Vegard’s law9 (see
Chapter 2, equation 2.15) as a function of the Au content (see Figure 4.3 below). This again, gives
more evidence of true alloying of the samples. The results obtained with XRD are shown in Table 4.1.
Figure 4.3. Lattice parameters calculated from the three reflections observed in the XRD patterns (see Figure
4.2) vs. Au atomic ratio. The full line is the Vegard’s law fit, which gives evidence of Au‐Cu alloying

Au‐Cu alloy nanoparticles supported on carbon black 93
TEM images corresponding to four samples studied are shown in Figure 4.4. Average size
distributions were estimated from sample sets of no less than 100 randomly chosen particles (see
insets to Figure 4.4). The results are summarized in Table 4.1 and compared with those obtained by
the Scherrer formula. Good agreement between both methods is observed.
Figure 4.4 – TEM images of Au‐Cu nanoparticles supported on carbon black. (Top left) Au0.93Cu0.07, (top right)
Au0.82Cu0.18, (bottom left) Au0.76Cu0.24, (bottom right) Au0.71Cu0.29
The mean particle size increases with increasing content of Cu in the nanoparticles. It is proposed
that PVA is not as effective as a stabilizing agent with Cu as with Au, thus leading to larger particles
when more Cu is present in them. The results presented in Table 4.1 show that there is good
agreement between the particle size obtained by TEM and by XRD, and this is an indication of the
size homogeneity of the synthesized nanoparticles. EDX analysis of a Au0.82Cu0.18 sample shows that

94 Au‐Cu alloy nanoparticles supported on carbon black
the nanoparticles are truly alloyed and that their atomic composition is similar to the ICP analysis,
yielding a 0.81/0.19 Au/Cu fraction.
The stabilizer used in the synthesis (poly(vinyl alcohol)) could block the nanoparticle surface and
hinder its electrocatalytic activity. PVA, however, undergoes pyrolytic decomposition at
temperatures above 250 oC as shown by thermogravimetric decomposition analyses of PVA10 and by
FTIR studies of PVA decomposition.6, 11 These studies show the loss of polymeric functionality at the
annealing temperature without affecting the catalytic properties of the catalyst. The degree of
decomposition of PVA at 320 oC (nanoparticle annealing temperature) was measured by weighing a
sample of PVA before and after thermal treatment under the same conditions used for annealing the
catalysts prepared. A weight loss of 85% was observed after heat treatment. EDX studies of a
Au0.82Cu0.18 sample before and after annealing showed virtually the same composition, indicating
that the annealing process does not affect the composition of the nanoparticles and only pyrolyses
the PVA.
As a means to determine the stability of Au‐Cu colloids, UV‐Vis measurements were repeated after 6
months. The same plasmon bands intensities, widths and positions were measured implying that the
colloids remain stable with time. Most of the carbon black supported nanoparticles are stable as
well: XRD experiments repeated after 6 months for the Au and Au‐Cu alloys still showed no
individual reflections for the alloying elements, indicating that no dealloying happened during at
least that period of time. In the case of pure Cu nanoparticles the repeated XRD experiments
showed oxidation peaks, so no further results will be shown for Cu nanoparticles.
In short, a new one‐step method for synthesizing Au‐Cu nanoparticles supported in carbon black has
been devised. The synthesis yields monodisperse Au‐Cu nanoalloys which are stable towards Cu
oxidation and are suitable candidates for use as electrocatalysts for CO2 electroreduction.
4.3 Electroreduction of CO2 with Au‐Cu alloy nanoparticles supported on
carbon black
4.3.1 Electrodes and electrochemical cells used for CO2 reduction
Cyclic voltammograms of Au‐Cu nanoparticle alloys attached to carbon black were carried out using
a glassy carbon (GC) disc electrode of 0.071 cm2 embedded in a PTFE tip, modified with the
electrocatalyst ink. The ink was prepared as previously reported.12 Typically, 2.5 mg of carbon
supported catalyst, 1.125 ml of water and 0.125 ml of 5% Nafion 117 solution (Fluka) were mixed in
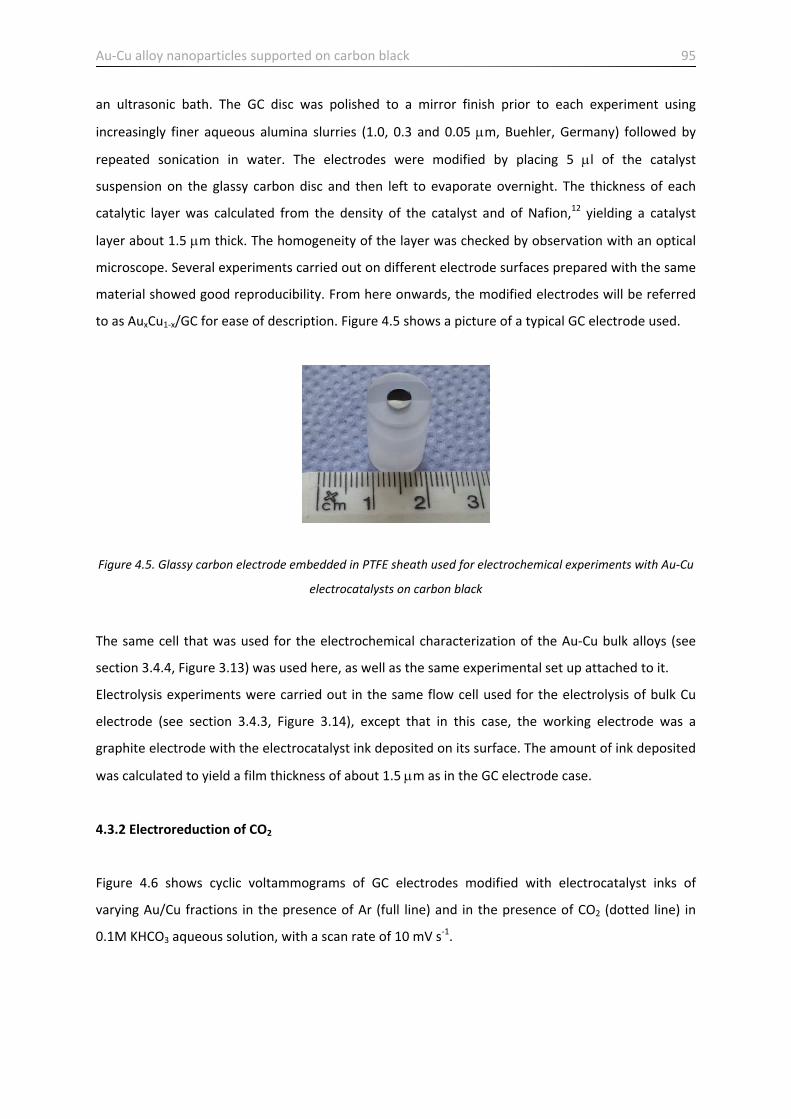
Au‐Cu alloy nanoparticles supported on carbon black 95
an ultrasonic bath. The GC disc was polished to a mirror finish prior to each experiment using
increasingly finer aqueous alumina slurries (1.0, 0.3 and 0.05 m, Buehler, Germany) followed by
repeated sonication in water. The electrodes were modified by placing 5 l of the catalyst
suspension on the glassy carbon disc and then left to evaporate overnight. The thickness of each
catalytic layer was calculated from the density of the catalyst and of Nafion,12 yielding a catalyst
layer about 1.5 m thick. The homogeneity of the layer was checked by observation with an optical
microscope. Several experiments carried out on different electrode surfaces prepared with the same
material showed good reproducibility. From here onwards, the modified electrodes will be referred
to as AuxCu1‐x/GC for ease of description. Figure 4.5 shows a picture of a typical GC electrode used.
Figure 4.5. Glassy carbon electrode embedded in PTFE sheath used for electrochemical experiments with Au‐Cu
electrocatalysts on carbon black
The same cell that was used for the electrochemical characterization of the Au‐Cu bulk alloys (see
section 3.4.4, Figure 3.13) was used here, as well as the same experimental set up attached to it.
Electrolysis experiments were carried out in the same flow cell used for the electrolysis of bulk Cu
electrode (see section 3.4.3, Figure 3.14), except that in this case, the working electrode was a
graphite electrode with the electrocatalyst ink deposited on its surface. The amount of ink deposited
was calculated to yield a film thickness of about 1.5 m as in the GC electrode case.
4.3.2 Electroreduction of CO2
Figure 4.6 shows cyclic voltammograms of GC electrodes modified with electrocatalyst inks of
varying Au/Cu fractions in the presence of Ar (full line) and in the presence of CO2 (dotted line) in
0.1M KHCO3 aqueous solution, with a scan rate of 10 mV s‐1.

96 Au‐Cu alloy nanoparticles supported on carbon black
Figure 4.6. Cyclic voltammograms of GC electrodes modified with Au‐Cu nanoparticles supported on carbon
black (see Figure for Au/Cu fractions). Supporting electrolyte: 0.1 M KHCO3 aqueous solution, scan rate: 10 mV
s‐1. Full line – Ar saturated solution, dotted line – CO2 saturated solution
Bubble formation was seen in all electrocatalyst‐modified GC electrodes in Ar saturated solution for
potentials negative of ‐1.2 V, confirming the hydrogen evolution reaction at these potentials.
In CO2 saturated solution the Au/GC electrode shows a clear decrease of the current at about ‐0.9 V,
and a shoulder between ‐1.0 and ‐1.3 V. As discussed in Chapter 3, section 3.4.3, Au is capable of

Au‐Cu alloy nanoparticles supported on carbon black 97
reducing CO2 to CO, but not further. The same effect is seen for Au nanoparticles, and a partial
blockage of the electrode can be seen between ‐1.0 and ‐1.3 V, caused by the CO molecules formed
at the Au nanoparticles surface. Below ‐1.3 V, the current decreases again with a slope similar as for
Ar saturated solution, clearly the electrode is no longer blocked by adsorbed CO molecules and
hydrogen evolution is taking place.
The Au0.93Cu0.07/GC electrode shows a similar behaviour as the Au/GC electrode, with a shoulder
between ‐1.0 and ‐1.3 V, caused by the CO molecules formed at the nanoparticles surface. The small
amount of Cu in the nanoparticles is likely not large enough to push forward the further reduction of
CO to other products. As the Cu content in the electrocatalysts increases, there is less blockage of
the modified electrodes by CO molecules and the reduction of CO proceeds further, as can be seen
by the large negative current values. The competing hydrogen evolution reaction is also taking place,
but there is a clear evidence of the electrocatalysts response towards CO2 reduction.
As a way of ascertaining that the electrochemical signal detected with the electrocatalyst‐modified
electrodes when in the presence of CO2 really comes from the Au‐Cu nanoparticles, some blank
experiments were performed. Figure 4.7 shows cyclic voltammograms in CO2 saturated aqueous
0.1M KHCO3 of a GC electrode without any modification (full line), the same GC electrode modified
with an ink that contained only carbon black with no nanoparticles (dashed line), and the same GC
electrode modified with an ink that contained a Au0.82Cu0.18 electrocatalyst supported on carbon
black (dotted line).
Figure 4.7. Cyclic voltammograms in aqueous CO2 saturated 0.1M KHCO3 of (full line): GC electrode; (dashed
line): GC electrode modified with an ink that contained only carbon black; (dashed line): GC electrode modified
with an ink with Au0.82Cu0.18 supported on carbon black. Scan rate: 10 mV s‐1
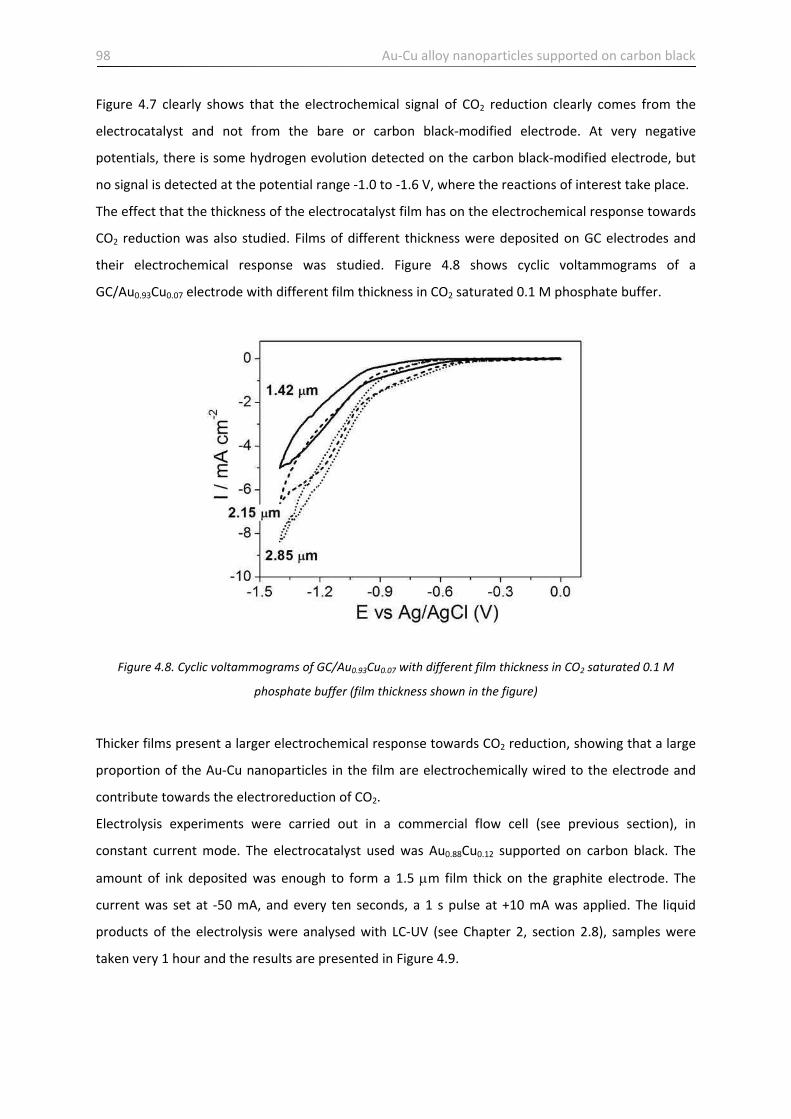
98 Au‐Cu alloy nanoparticles supported on carbon black
Figure 4.7 clearly shows that the electrochemical signal of CO2 reduction clearly comes from the
electrocatalyst and not from the bare or carbon black‐modified electrode. At very negative
potentials, there is some hydrogen evolution detected on the carbon black‐modified electrode, but
no signal is detected at the potential range ‐1.0 to ‐1.6 V, where the reactions of interest take place.
The effect that the thickness of the electrocatalyst film has on the electrochemical response towards
CO2 reduction was also studied. Films of different thickness were deposited on GC electrodes and
their electrochemical response was studied. Figure 4.8 shows cyclic voltammograms of a
GC/Au0.93Cu0.07 electrode with different film thickness in CO2 saturated 0.1 M phosphate buffer.
Figure 4.8. Cyclic voltammograms of GC/Au0.93Cu0.07 with different film thickness in CO2 saturated 0.1 M
phosphate buffer (film thickness shown in the figure)
Thicker films present a larger electrochemical response towards CO2 reduction, showing that a large
proportion of the Au‐Cu nanoparticles in the film are electrochemically wired to the electrode and
contribute towards the electroreduction of CO2.
Electrolysis experiments were carried out in a commercial flow cell (see previous section), in
constant current mode. The electrocatalyst used was Au0.88Cu0.12 supported on carbon black. The
amount of ink deposited was enough to form a 1.5 m film thick on the graphite electrode. The
current was set at ‐50 mA, and every ten seconds, a 1 s pulse at +10 mA was applied. The liquid
products of the electrolysis were analysed with LC‐UV (see Chapter 2, section 2.8), samples were
taken very 1 hour and the results are presented in Figure 4.9.

Au‐Cu alloy nanoparticles supported on carbon black 99
Figure 4.9. LC‐UV runs of Au0.88Cu0.12 ink modified graphite electrode after electrolysis at constant current in
CO2 saturated 0.1M KHCO3. The times indicate the time at which the sample was extracted from the electrolysis
cell
There is a clear signal at ≈ 1.16 min., whose intensity increases with electrolysis time, indicating that
a species is being formed from the electroreduction of CO2. Calibration measurements show that the
signal corresponds to C2H5OH. This indicates that the Au0.88Cu0.12 nanoalloy catalyst is efficient
towards the electroreduction of CO2 into liquid products. These promising results bear further study.
Unlike Cu catalysts which rapidly deactivate with usage, this experiment shows that Au‐Cu
nanoparticles do not deactivate after 4 hours of continuous operation. This is an important finding
as it suggests that Au prevents Cu oxidation stabilizing the catalyst, as it was recently reported in the
literature.3, 13

100 Au‐Cu alloy nanoparticles supported on carbon black
4.4 Conclusions
In this chapter a new, robust and simple method for the synthesis of Au‐Cu alloy nanoparticles was
presented. The nanoparticles obtained are homogeneous in their size distribution, and were shown
to be truly alloyed. The alloying of Cu with Au gives them long term stability, as opposed to pure Cu
nanoparticles, which oxidized after short period of time. The Au‐Cu nanoparticles supported on
carbon black are effective towards CO2 electroreduction, showing that they produce C2H5OH. These
results suggest that the catalytic property of Au‐Cu alloys is related to the surface roughness.14, 15 Au‐
Cu nanoparticles supported on carbon black present a “rougher” surface than Au‐Cu bulk alloys.
Indeed Au‐Cu bulk alloys did not yield any liquid products forming only CO (see Chapter 3, section
3.4.3). However, as shown above Au‐Cu alloyed nanoparticles are capable of reducing CO2 into more
valuable chemicals such as ethanol (over the same range of Au/Cu compositions). Different catalytic
properties of bulk and nanoparticulate metals have been observed in the past (e.g. CO oxidation
catalysed by Au), however, this is the first time that it is observed for an alloy system. Finally, these
results suggest that Au prevents Cu deactivation resulting in alloy catalysts which are more stable
than Cu catalysts.
Au‐Cu alloy nanoparticles supported on carbon black 101
References
1. Maroun, F.; Ozanam, F.; Magnussen, O.M.; Behm, R.J. The Roles of Atomic Ensembles in the
Reactivity of Bimetallic Electrocatlysts. Science (2001) 293, 1811‐1814.
2. Wang, C.; van der Vliet, D.; More, K.L.; Zaluzec, N.J.; Peng, S.; Sun, S.; Daimon, H.; Wang, G.;
Greeley, J.; Pearson, J.; Paulikas, A.P.; Karapetov, G.; Strmcnik, D.; Markovic, N.M.;
Stamenkovic, V.R. Multimetallic Au/FePt3 Nanoparticles as Highly Durable Electrocatalyst.
Nano Lett. (2011) 11, 919‐926.
3. Liu, X.; Wang, A.; Zhang, T.; Su, D.‐S.; Mou, C.‐Y. Au–Cu alloy nanoparticles supported on
silica gel as catalyst for CO oxidation: Effects of Au/Cu ratios. Catalysis Today (2011) 160,
103‐108.
4. Chimentao, R.J.; Medina, F.; Fierro, J.L.G.; Llorca, J.; Sueiras, J.E.; Cesteros, Y.; Salarge, P.
Propene epoxidation by nitrous oxide over Au–Cu/TiO2 alloy catalysts. J. Mol. Catal. A: Chem.
(2007) 274, 159‐168.
5. Della Pina, C.; Falletta, E.; Rossi, M. Highly selective oxidation of benzyl alcohol to
benzaldehyde catalyzed by bimetallic gold–copper catalyst. J. Catal. (2008) 260, 384‐386.
6. Jirkovský, J.S.; Halasa, M.; Schiffrin, D.J. Kinetics of electrocatalytic reduction of oxygen and
hydrogen peroxide on dispersed gold nanoparticles. Phys. Chem. Chem. Phys. (2010) 12,
8042‐8052.
7. Mulvaney, P. Surface Plasmon Spectroscopy of Nanosized Metal Particles. Langmuir (1996)
12, 788‐800.
8. Waseda, Y.; Matsubara, E.; Shinoda, K. X‐Ray Diffraction Crystallography. Springer‐Verlag,
Berlin, (2011).
9. Vegard, L. Die Konstitution der Mischkristalle und die Raumfüllung der Atome. Z. Phys. (1921)
5, 17‐26.
10. Shie, J.L.; Chen, Y.H.; Chang, C.Y.; Lin, J.P.; Lee, D.J.; Wu, C.H. Thermal Pyrolysis of Poly(vinyl
alcohol) and Its Major Products. Energy Fuels (2002) 16, 109‐118.
11. Thomas, P.S.; Guerbois, J.P.; Russel, G.F.; Briscoe, B.J. FTIR Study of the Thermal Degradation
of Poly(vinyl Alcohol). J. Therm. Anal. Calorim. (2001) 64, 501‐508.
12. Maillard, F.; Martin, M.; Gloaguen, F.; Léger, J.‐M. Oxygen electroreduction on carbon‐
supported platinum catalysts. Particle‐size effect on the tolerance to methanol competition.
Electrochim. Acta (2002) 47, 3431‐3440.

102 Au‐Cu alloy nanoparticles supported on carbon black
13. Christophe, J.; Doneux, T.; Buess‐Herman, C. Electroreduction of Carbon Dioxide on Copper‐
Based Electrodes: Activity of Copper Single Crystals and Copper–Gold Alloys. Electrocatal.
(2012) 3, 139‐146.
14. Tang, W.; Peterson, A.A.; Varela, A.S.; Jovanov, Z.P.; Bech, L.; Durand, W.J.; Dahl, S.; Nørskov,
J.K.; Chorkendorff, I. The importance of surface morphology in controlling the selectivity of
polycrystalline copper for CO2 electroreduction. Phys. Chem. Chem. Phys. (2012) 14, 76‐81.
15. Jaramillo, T.F.; Nørskov, J.K.; Varley, J.; Grabow, L.; Kuhl, K.; Cave, E.; Abram, D.; Ng, D.The
oxidation of water and the reduction of CO2 to fuels, Technical Report. SunCat, Stanford
University (2012).

Chapter 5
Layer-by-layer self-
assembled films
containing polyoxo-
molybdates over Au
surfaces

104 LbL self‐assembled films containing polyoxomolybdates over Au surfaces

LbL self‐assembled films containing polyoxomolybdates over Au surfaces 105
5.1 Introduction
In this chapter the focus will now turn to other types of nanostructured electrodes, namely layer‐by‐
layer self‐assembled polymer films containing polyoxomolybdates on Au electrodes.
In the last 20 years, the importance of polyoxometalates in the manufacture of chemically modified
electrodes has been recognized. As explained in more detail in Chapter 1, section 1.5,
polyoxometalates constitute a large category of polyoxoanions of mainly molybdenum, tungsten
and, to a lesser degree, vanadium. Heteropolyanions and their metal substituted derivatives have
some useful properties, such as the high stability of most of their redox states, the possibility of fine
tuning their redox potentials without affecting their structure, and the possibility of multiple
electron transfer. These properties make heteropolyanions attractive as redox catalysts for indirect
electrochemical processes,1, 2 corrosion inhibitors,3 etc. Among the large family of polyoxometalates,
some heteropolyanions with Keggin or Dawson structures have the ability to proceed in multiple,
consecutive, and reversible multi electron reductions to mixed‐valence species without
decomposition. The heteropolyanions have long‐term chemical stability with good ionic and
electronic conductivity, which are useful and attractive in modification of electrode surfaces.
However, one of the mayor drawbacks some polyoxometalates have is their limited pH‐stability. For
example polyoxomolybdates are known to decompose in solution: they undergo several hydrolysis
reactions as the pH increases above 2 releasing MoO42‐ and PO4
2‐ anions.
Attaching redox‐active polyoxometalates onto electrodes simplifies their electrochemical studies
and facilitates their applications in many fields. A number of strategies have been developed to
modify electrodes with a variety of heteropolyanions, such as (i) adsorption on electrode surfaces,4‐6
(ii) electrodeposition at a sufficiently negative potential,7, 8 (iii) doping in conductive,9 and
nonconductive polymers,10, 11 and (iv) other strategies.12‐16 Many authors have used chemically
modified electrodes to study the properties of polyoxometalates as heterogeneous catalysts. Studies
were made on the reduction of nitrite,13‐17 chlorate,13, 15, 18 bromate,13, 15, 19 hydrogen peroxide,15, 19, 20
and oxygen.13, 18
The Layer‐by‐Layer (LbL) self‐assembly technique has been used to form organized multilayers with
well‐defined morphological characteristics in the past.21 The method is based on the electrostatic
interaction between oppositely charged species that are used to build up a variety of multilayer
assemblies on a layer‐by‐layer basis with precise control of the thickness and layer sequences.21‐24 In
particular, electrochemically active polyelectrolyte multilayers have been investigated, both with
covalently bound electron donor/acceptor sites in the polymer backbone or with soluble redox ionic
species doping the polycation–polyanion structure.25 Among the redox active polyelectrolyte

106 LbL self‐assembled films containing polyoxomolybdates over Au surfaces
multilayers two different systems have been studied: (i) the acceptor/donor redox site covalently
attached to the polyelectrolyte backbone, i.e. ferrocene, osmium pyridine complexes,26, 27 and (ii) the
as‐formed polyelectrolyte multilayer exchanges redox active ions (i.e. hexacyanoferrate,27 osmium
bipyridinium28) from the electrolyte solution by breaking polycation–polyanion bonds and making
polyion‐ redox ion bonds in the structure.27 Multilayered molecular assemblies composed of
polyoxometalates and large water‐soluble polycation species have been built up in the past19, 29‐31
using these strategies.
This chapter describes a novel strategy for the controlled fabrication of multilayer films containing a
polyoxomolybdate anion (PMo12O403‐ , (POM)) on Au electrodes. Firstly, the Au substrate is covered
with a well‐defined layer‐by‐layer polyelectrolyte film and once the polyelectrolyte multilayer has
been built, the POM is incorporated in the film by ion exchange (see Chapter 1).32, 33 The resulting
functionalized electrodes were thoroughly characterized by ellipsometry, X‐ray photoelectron
spectroscopy (XPS), FTIR‐ATR, quartz crystal microbalance (QCM) and cyclic voltammetry (CV). It was
found that POM molecules are present in the multilayer film retaining their molecular structure and
that although there is an initial loss of mass when it is first submerged in acid or basic solutions, then
the POM‐functionalized electrodes remain stable in time and with usage. POM molecules
electrochemically wired to the Au surface seem to be stable with pH, as POM molecules in the film
are not hydrolysed when electrodes are exposed to solutions with pH = 4.8. Finally, the POM‐
functionalized electrodes were tested as electrocatalysts for the reduction of nitrite, chlorate and
peroxodisulfate, presenting a very good response.
5.2 Sample preparation and characterization
Au electrodes were prepared by thermal evaporation on Si (100) wafers. The wafers were cut into 2
x 1 cm pieces and they were degreased in a Soxhlet device with acetone for two days running. Once
degreased, they were washed with a 10% HF solution to eliminate the superficial SiO2 layer, then
with water and finally with isopropanol, and dried with a stream of N2. The clean Si wafers were
placed in an Edwards Auto 306 evaporator with an operating pressure < 10‐5 mbar. The evaporator
has a turret with 4 positions that allows the user to evaporate 4 different metals without breaking
the vacuum. The amount of metal deposited is measured with an in‐built quartz crystal
microbalance. Before depositing the Au layer (200 nm) an adherence layer of Ti (5‐10 nm) and Pd (10
nm) was deposited.

LbL self‐assembled films containing polyoxomolybdates over Au surfaces 107
The Au electrodes were cleaned electrochemically by cycling them between 0.0 and 1.6 V in 2M
H2SO4 solution at 10 V s‐1, followed by one cycle at 0.1 V s‐1 to check for possible contaminants. The
electrochemically active areas were calculated by measuring the oxide reduction peak.34 As a first
step of electrode modification it was immersed for one hour in a 50 mM sodium 3‐
mercaptopropane‐1‐sulfonate (MPS) in 10 mM H2SO4 solution. This procedure creates a self‐
assembled monolayer terminated in sulfonate groups thus leaving the Au surface negatively
charged, so the layer‐by‐layer deposition started with the poly(allylamine hydrochloride) (PAH)
polycation. The subsequent layers were deposited on the modified surface by alternate immersion
in a solution of the respective polyanion (poly(acrylic acid, sodium salt), PAA) or polycation (PAH) at
pH = 4.3 in both cases for 15 min and rinsing with Milli‐Q water until the desired number of layers
was achieved. Finally, the substrate was further modified with a final layer of PAH, then was
immersed in POM solution for at least 1 h and then rinsed with Milli‐Q water. As expected, if the
layer‐by‐layer process ended with a PAA layer, then no incorporation of POM was achieved by this
method. Electrodes are named Au/MPS/(PAHn+1/PAAn)/POM where n is the number of deposited
PAH‐PAA bilayers. Scheme 1 illustrates this process, while Scheme 2 shows the molecular structure
of the polyelectrolytes used.
Scheme 1. Layer‐by‐layer film growth process and ion exchange incorporation of polyoxomolybdate molecules
onto a Au electrode
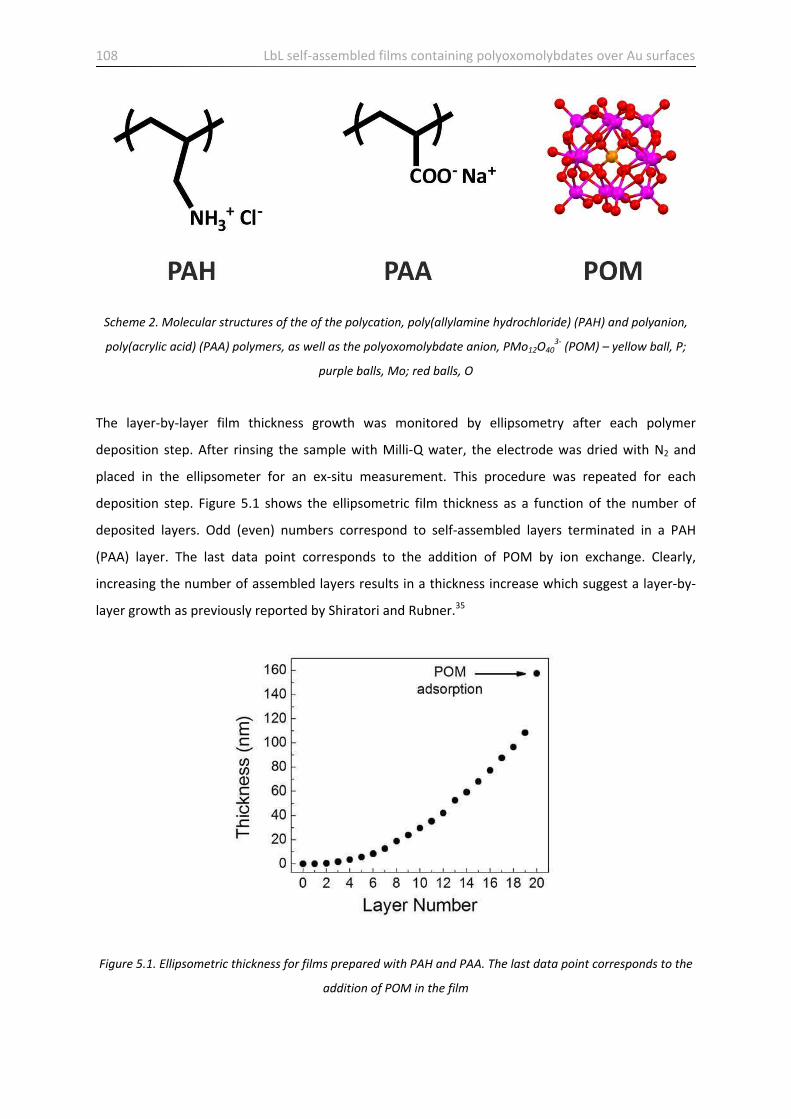
108 LbL self‐assembled films containing polyoxomolybdates over Au surfaces
Scheme 2. Molecular structures of the of the polycation, poly(allylamine hydrochloride) (PAH) and polyanion,
poly(acrylic acid) (PAA) polymers, as well as the polyoxomolybdate anion, PMo12O403‐ (POM) – yellow ball, P;
purple balls, Mo; red balls, O
The layer‐by‐layer film thickness growth was monitored by ellipsometry after each polymer
deposition step. After rinsing the sample with Milli‐Q water, the electrode was dried with N2 and
placed in the ellipsometer for an ex‐situ measurement. This procedure was repeated for each
deposition step. Figure 5.1 shows the ellipsometric film thickness as a function of the number of
deposited layers. Odd (even) numbers correspond to self‐assembled layers terminated in a PAH
(PAA) layer. The last data point corresponds to the addition of POM by ion exchange. Clearly,
increasing the number of assembled layers results in a thickness increase which suggest a layer‐by‐
layer growth as previously reported by Shiratori and Rubner.35
Figure 5.1. Ellipsometric thickness for films prepared with PAH and PAA. The last data point corresponds to the
addition of POM in the film

LbL self‐assembled films containing polyoxomolybdates over Au surfaces 109
The initial growth is slow, but after a few layers, the growth rate follows a linear behaviour. This
effect has been reported previously for layer‐by‐layer self‐assembled films,36 and it has been
attributed to the decreasing influence of the substrate as the number of layers increases. The choice
of pH = 4.3 for the polyelectrolyte solutions corresponds to a relatively small growth rate: at this pH,
the PAH chains are almost fully charged and so they adopt a more rod‐like conformation, giving rise
to thinner films than at higher pHs.35, 37 This pH range was chosen because it showed a more
reproducible growth rate than other pH ranges.
The last data point in Figure 5.1 clearly shows that the PAH/PAA self‐assembled film thickness
increases after the addition of POM molecules by ion exchange. This is mainly due to the
incorporation of bulky POM anion and water molecules into the film.38
The surface chemical composition of the Au/MPS/(PAHn+1/PAAn)/POM with n = 2, 3 and 4 was
determined by XPS. Broad spectra show the presence of the expected elements: Mo, P, O, C, N, S
and Au. Figure 5.2 shows the Au 4f, Mo 3d, N 1s and Mo 3p XP spectra corresponding to multilayer
films of increasing thickness, i.e. n = 2, n = 3 and n = 4.
Figure 5.2. Au 4f, Mo 3d, N 1s and Mo 3p XPS signals of Au/MPS/PAHn+1/PAAn/POM as a function of increasing
bilayer number, n = 2, n = 3 and n = 4
Clearly, as the number of layers n increases the Au 4f XP signal decreases. This is due to the
increased attenuation of the photoelectrons emitted by the Au atoms by the growing polyelectrolyte
overlayer. It follows that film thickness increases with the number of deposited layers in agreement
with the ellipsometric results discussed above. The Mo 3d and 3p XP signals increase as the number
of deposited layers n increases, therefore more phosphomolybdic acid is incorporated into the film
with increasing n. Furthermore the Mo 3d peak position (Mo 3d5/2 at 232.3 eV and Mo 3d3/2 at 235.4

110 LbL self‐assembled films containing polyoxomolybdates over Au surfaces
eV) indicates that Mo atoms are in a +6 oxidation state as expected. Also, XPS shows that the atomic
ratio Mo:P is approximately equal to 12:1 suggesting that the Keggin structure is maintained as the
polyoxomolybdate is incorporated in the film. Finally, the N 1s signal (400 eV) which partially
overlaps with the Mo 3p3/2 (398.1 eV) signal indicates the presence of the amine groups in the PAH
polyelectrolyte and its intensity increases with increasing number of layers as expected. The atomic
ratio Mo:N is approximately equal to 1:2 in all cases, i.e. there is approximately 1 POM molecule
every 24 N atoms in the films, indicating that as the number of amine sites in the multi‐layered film
(and hence film thickness) increases, the amount of POM molecules incorporated also increases. In
short, XPS measurements confirm the increased thickness of multilayer films with number of
deposited layers and demonstrate the incorporation of increasing amounts of polyoxomolybdate
anions with film thickness. Although POM ions are relatively big it should be beard in mind that the
films incorporate also large amounts of water and are very porous hence creating possible diffusion
pathways for the incorporation of the anion. Further evidence regarding incorporation of the
polyoxomolybdate heteropolyanion into the film is given by the FTIR measurements discussed
below.
Figure 5.3. FTIR‐ATR spectra of (a) Au/MPS/(PAH11/PAA10) and (b) Au/MPS/(PAH11/PAA10)/POM self‐assembled
films

LbL self‐assembled films containing polyoxomolybdates over Au surfaces 111
Figure 5.3 shows the FTIR‐ATR spectrum of (a) Au/MPS/(PAH11/PAA10) multilayer self‐assembled film
as well as (b) the same electrode after POM incorporation by ion exchange. The amine peak (~ 1640
cm‐1) and the symmetric and asymmetric carboxylate stretching peaks (1405 and 1565 cm‐1) seen in
Figure 5.3a are clear evidence of the PAH/PAA film formation. The positions of these signals change
slightly with the incorporation of POM into the film. The peaks associated to the Keggin‐type
polyoxomolybdate can clearly be seen in Figure 5.3b: the P‐O vibration belonging to the central PO4
unit appears at about 1053 cm‐1. The Mo=O and Mo‐O‐Mo (corner sharing) vibration bands are
overlapped in the multilayer film (930 and 900 cm‐1 respectively), while the Mo‐O‐Mo (edge sharing)
vibration band can be seen at 690 cm‐1. The positions of these bands are slightly shifted with respect
to the compound in a KBr pellet,39, 40 probably due to the interaction of the polyoxomolybdate
molecules with the surrounding polyelectrolyte molecules. Clearly, IR measurements indicate that
the polyoxomolybdate anions are successfully incorporated in the PAH/PAA thin multilayer film
retaining their Keggin‐type molecular structure.
Although XPS and FTIR‐ATR measurements demonstrate the absorption of POM into the PAH/PAA
multilayer films, it is not possible to easily estimate the amount of POM incorporated into the
multilayer film. Therefore Quartz Crystal Microbalance (QCM) measurements were carried out in
order to quantify the absorption of POM into the films. Figure 5.4 shows the change in mass (∆m) when two Au/MPS/(PAHn+1/PAAn) samples with different number of layers (n = 5 and n = 10) are
placed in contact with a solution containing POM molecules as measured by QCM. Initially the mass
increases due to the incorporation of polyoxomolybdate and possibly water molecules into the films.
The baseline measured after the removal of the POM solution was obtained after washing the
electrode several times with Milli‐Q water. The decrease in mass is probably associated with the loss
of POM weakly adsorbed on the topmost layers of the film. Therefore, the adsorbed mass is
estimated by subtracting the final and initial baselines.
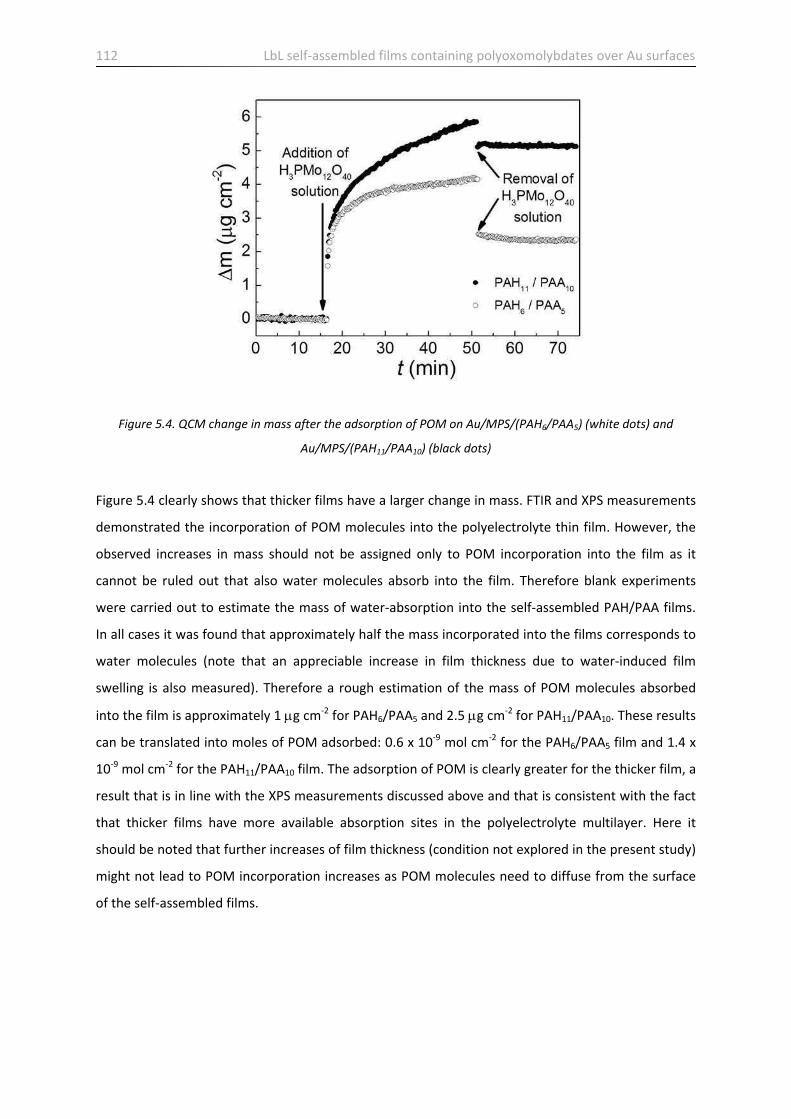
112 LbL self‐assembled films containing polyoxomolybdates over Au surfaces
Figure 5.4. QCM change in mass after the adsorption of POM on Au/MPS/(PAH6/PAA5) (white dots) and
Au/MPS/(PAH11/PAA10) (black dots)
Figure 5.4 clearly shows that thicker films have a larger change in mass. FTIR and XPS measurements
demonstrated the incorporation of POM molecules into the polyelectrolyte thin film. However, the
observed increases in mass should not be assigned only to POM incorporation into the film as it
cannot be ruled out that also water molecules absorb into the film. Therefore blank experiments
were carried out to estimate the mass of water‐absorption into the self‐assembled PAH/PAA films.
In all cases it was found that approximately half the mass incorporated into the films corresponds to
water molecules (note that an appreciable increase in film thickness due to water‐induced film
swelling is also measured). Therefore a rough estimation of the mass of POM molecules absorbed
into the film is approximately 1 g cm‐2 for PAH6/PAA5 and 2.5 g cm‐2 for PAH11/PAA10. These results
can be translated into moles of POM adsorbed: 0.6 x 10‐9 mol cm‐2 for the PAH6/PAA5 film and 1.4 x
10‐9 mol cm‐2 for the PAH11/PAA10 film. The adsorption of POM is clearly greater for the thicker film, a
result that is in line with the XPS measurements discussed above and that is consistent with the fact
that thicker films have more available absorption sites in the polyelectrolyte multilayer. Here it
should be noted that further increases of film thickness (condition not explored in the present study)
might not lead to POM incorporation increases as POM molecules need to diffuse from the surface
of the self‐assembled films.

LbL self‐assembled films containing polyoxomolybdates over Au surfaces 113
5.3 Stability of LbL films containing POM
Figure 5.5 shows the EQCM mass of a Au/MPS/(PAH6/PAA5) electrode after incorporation of POM
and after immersing it in a 0.1 M H2SO4 solution. As discussed above (see Figure 5.4) the
incorporation of POM and water molecules results in a mass gain of 28 % from the initial 6.8–8.7 g
cm‐2. The produced Au/MPS/(PAH6/PAA5)/POM electrode was immersed in a 0.1 M H2SO4 solution
resulting in a sharp mass decay to a relatively stable value of 6.5 g cm‐2, i.e. a value even smaller
than the initial mass before POM incorporation. This result suggests that POM and water as well as
polyelectrolyte molecules escape the polyelectrolyte multilayer film into solution.
Figure 5.5. EQCM mass of a Au/MPS/(PAH6/PAA5) electrode, after adsorption of POM and after immersion in a
0.1 M H2SO4 solution. Inset: cyclic voltammograms in 0.1 M H2SO4 solution, scan rate 0.1 V s‐1. The moment
when each cyclic voltammetry was made is shown on the main graph
The inset of Figure 5.5 shows two cyclic voltammetries (CV) performed on the
Au/MPS/(PAH6/PAA5)/POM electrode at different immersion times in 0.1 M H2SO4 solution. The
observed peaks correspond to electron transfer reactions involving POM molecules as will be
described in detail below (see Figures 5.7 and 5.8), demonstrating that despite the mass loss, some
POM molecules are retained in the film. Peak areas indicate that the coverage of POM molecules
electrochemically wired to the Au electrode that are retained in the film is 4.1 x 10‐11 mol cm‐2.
Furthermore, notice that the second CV performed 40 min after being immersed in 0.1 M H2SO4
solution has the same peak currents as the first one, and notice also that after the initial mass decay

114 LbL self‐assembled films containing polyoxomolybdates over Au surfaces
the total mass remains constant with immersion time and electrochemical use. This means that once
the POM‐modified multilayer film has suffered loss of material, a stable film with electrochemically
active POM redox sites is generated over the Au electrode with no further evidence of loss of
material.
Further evidence indicating the presence of POM molecules in the polyelectrolyte film after the
initial loss of material is given by XPS measurements. Figure 5.6 shows the Au 4f, Mo 3d, Mo 3p and
N 1s XP signals before and after immersion of a Au/MPS/(PAH5/PAA4)/POM electrode in a 0.1 M
H2SO4 solution.
Figure 5.06. Au 4f, Mo 3d, Mo 3p and N 1s XP signals before and after immersion of a
Au/MPS/(PAH5/PAA4)/POM electrode in 0.1 M H2SO4 solution
The Au 4f XP signal increases 85 % after immersion of the polyelectrolyte multilayer in the acid
solution. This indicates that the Au 4f photoelectrons are less attenuated as a result of the
immersion indicating a decrease in film thickness due to partial loss of material to solution as shown
by the EQCM measurements discussed in Figure 5.5. Furthermore the Mo 3d and Mo 3p XP signals
decrease by approximately 40 % indicating that some of the polyoxomolybdates is lost from the
polyelectrolyte multilayer film after the immersion. Also the N 1s XP signal arising from the PAH
polyelectrolyte decreases 34 % after immersion in the acid solution indicating partial delamination of
the polymer film. Partial dissolution of the polyelectrolyte self‐assembled film with loss of POM as
well as some polyelectrolyte molecules was observed for different number of deposited bilayers (n =
3–6). However, it is important to note that in all cases after the initial sharp decrease in mass, the
system does not suffer from further loss in mass and the amount of POM molecules wired to the Au

LbL self‐assembled films containing polyoxomolybdates over Au surfaces 115
electrode remains constant. Here it should be noted that POM‐modified films are not only
delaminated in acid solutions but that the same phenomenon takes place in basic media.
Furthermore, POM‐free PAH/PAA films do not suffer from delamination either in acid or basic
solutions. Therefore, it is proposed that incorporation of the relatively large POM anions into the LbL
films increases the distance between the bilayers and thus, weakens their interaction facilitating
delamination. The layers closer to the substrate remain attached as probably POM ions do not
penetrate the film homogeneously hence not weakening to the same extent the interaction
between these layers.
5.4 Electrochemical behaviour of LbL films containing POM anions
Figure 5.7 (left) shows cyclic voltammograms (CV) of Au/MPS/(PAH10/PAA9)/POM electrodes as a
function of supporting electrolyte pH in the range 1.1–4.8. Three peaks are present at pH 1.1 (peak I ~ 0.29 V, peak II ~ 0.09 V and peak III ~ 0.05 V vs. Ag/AgCl) whose intensity diminishes and whose
positions shift to negative potentials as the pH of the electrolyte solution is increased. The same pH‐
dependent electrochemical behaviour is commonly observed for POMs dissolved in solution or
immobilized in electrodes as in the present case.16 The dependence of peak position shift with
solution pH can be explained by the fact that POM reduction is accompanied by proton transfer
(from solution to the film) to maintain charge neutrality. It is thus consistent with the proposed
mechanism for the oxidation–reduction peaks of PMo12O403‐, which depends on pH as a result of
protonation:2
鶏警剣怠態蝶彫頚替待戴貸 髪 2結貸 髪 2茎袋 ⇌ 茎態鶏警剣怠待蝶彫警剣態蝶頚替待戴貸 (5.1)
鶏警剣怠待蝶彫警剣態蝶頚替待戴貸 髪 2結貸 髪 2茎袋 ⇌ 茎態鶏警剣腿蝶彫警剣替蝶頚替待戴貸 (5.2)
鶏警剣腿蝶彫警剣替蝶頚替待戴貸 髪 2結貸 髪 2茎袋 ⇌ 茎態鶏警剣滞蝶彫警剣滞蝶頚替待戴貸 (5.3)
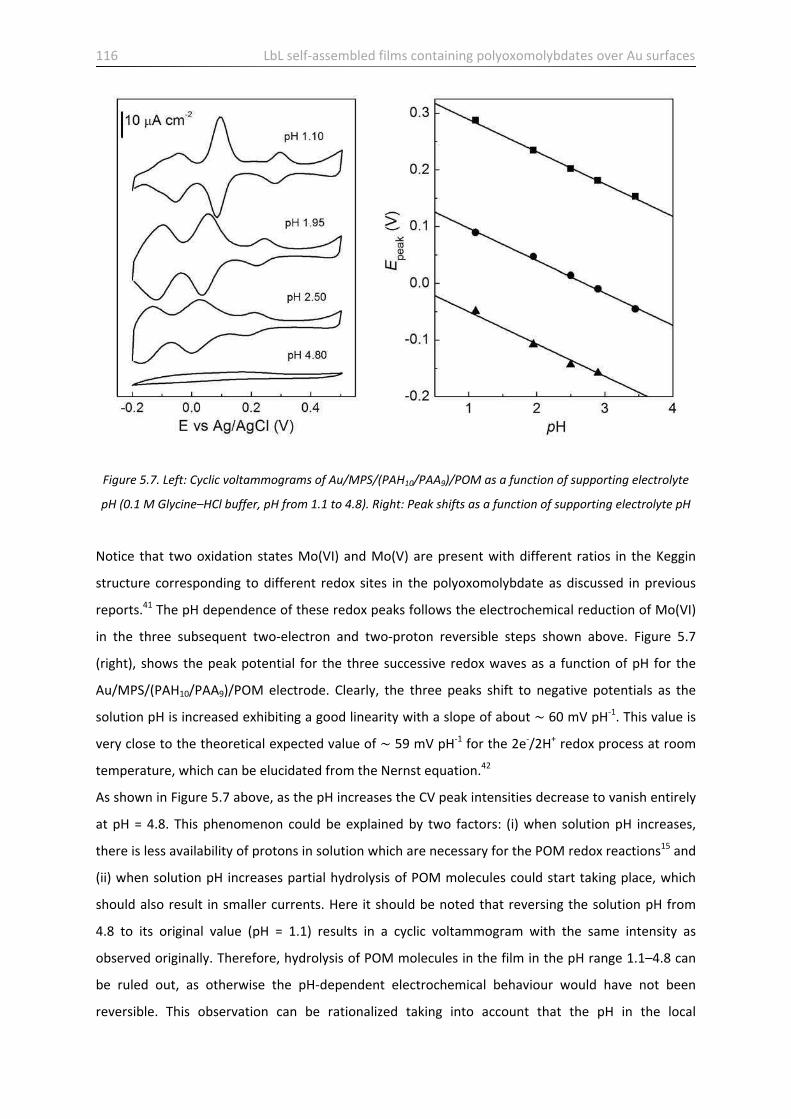
116 LbL self‐assembled films containing polyoxomolybdates over Au surfaces
Figure 5.7. Left: Cyclic voltammograms of Au/MPS/(PAH10/PAA9)/POM as a function of supporting electrolyte
pH (0.1 M Glycine–HCl buffer, pH from 1.1 to 4.8). Right: Peak shifts as a function of supporting electrolyte pH
Notice that two oxidation states Mo(VI) and Mo(V) are present with different ratios in the Keggin
structure corresponding to different redox sites in the polyoxomolybdate as discussed in previous
reports.41 The pH dependence of these redox peaks follows the electrochemical reduction of Mo(VI)
in the three subsequent two‐electron and two‐proton reversible steps shown above. Figure 5.7
(right), shows the peak potential for the three successive redox waves as a function of pH for the
Au/MPS/(PAH10/PAA9)/POM electrode. Clearly, the three peaks shift to negative potentials as the
solution pH is increased exhibiting a good linearity with a slope of about ~ 60 mV pH‐1. This value is
very close to the theoretical expected value of ~ 59 mV pH‐1 for the 2e‐/2H+ redox process at room
temperature, which can be elucidated from the Nernst equation.42
As shown in Figure 5.7 above, as the pH increases the CV peak intensities decrease to vanish entirely
at pH = 4.8. This phenomenon could be explained by two factors: (i) when solution pH increases,
there is less availability of protons in solution which are necessary for the POM redox reactions15 and
(ii) when solution pH increases partial hydrolysis of POM molecules could start taking place, which
should also result in smaller currents. Here it should be noted that reversing the solution pH from
4.8 to its original value (pH = 1.1) results in a cyclic voltammogram with the same intensity as
observed originally. Therefore, hydrolysis of POM molecules in the film in the pH range 1.1–4.8 can
be ruled out, as otherwise the pH‐dependent electrochemical behaviour would have not been
reversible. This observation can be rationalized taking into account that the pH in the local

LbL self‐assembled films containing polyoxomolybdates over Au surfaces 117
environment of the POM molecules in the film could be quite different to the solution pH.
Negatively charged POM molecules are expected to be surrounded by protonated amine groups
from the PAH polyelectrolyte that could be an important source of protons. This is an important
suggestion as it implies that inserting POM molecules into the film broadens the pH range in which
they could be used.
The surface coverage of POM on these electrodes was estimated by measuring cyclic voltammetries
as a function of the scan rate (pH of supporting electrolyte = 1.1).43 From these measurements the
coverage of POM in the Au/MPS/(PAH10/PAA9)/POM electrode was estimated at 8.4 x 10‐11 mol cm‐2
which is remarkably smaller than the initial (before any mass loss) POM coverage estimated by QCM:
1.2 x 10‐9 mol cm‐2 (see above). This implies that only ~ 7% of the POM initially present in the
multilayer film is retained after the film is delaminated. As discussed above, the retained amount of
POM molecules in the film remains constant with electrochemical use.
Figure 5.8. Cyclic voltammograms of Au/MPS/(PAHn+1/PAAn)/POM (n = 1, 2, 3, 4, 5 and 6) in 0.1 M H2SO4 at 100
mV s‐1. Inset: area of third anodic peak (E ~ 0.14 V) as a function of the number of layers
Figure 5.8 shows cyclic voltammograms of Au/MPS/(PAHn+1/PAAn)/ POM with n=1, 2, 3, 4, 5 and 6 in
0.1M H2SO4 at 100 mV s‐1. The inset shows the peak area of the third anodic peak (E ~ 0.14 V) vs. the
number of layers. The increase in peak area vs. the number of layers is linear, which shows that as
the number of layers is increased, more electrochemically active POM is retained in the film after
the initial delamination takes place. From the slope of this graph, a growth of 5 x 10‐12 mol cm‐2 of
electrochemically active POM per layer can be estimated. As was shown previously with XPS and

118 LbL self‐assembled films containing polyoxomolybdates over Au surfaces
QCM experiments more POM is adsorbed on fresh films as thickness increases and therefore more
electrochemically wired POM molecules are retained in the film after delamination takes place.
5.5 Electrocatalytic activity of LbL films containing POM anions
It is well known that reduced POM molecules are capable of delivering electrons to other species,
thus serving as powerful electron reservoirs for multielectron reductions. Furthermore, direct
electroreduction of nitrite, chlorate and peroxodisulfate require a large overpotential at most bare
electrode surfaces, while on the other hand, POM‐modified electrodes can catalyse the
electroreduction of NO2‐,13‐17, 41 ClO3
‐,13, 15, 18 and S2O82‐16 in aqueous solution. With these in mind, the
catalytic reduction of these three molecules has been examined to evaluate the feasibility of using
the POM modified electrodes in electroanalysis and electrocatalysis. Firstly it should be noted that
POM‐free Au/MPS/(PAHn+1/PAAn) electrodes show no electrochemical response in the presence of
nitrate, chlorate or peroxodisulfate in the range 0.4 to ‐0.2 V vs. Ag/AgCl. However, incorporation of
POM molecules into the polyelectrolyte film results in the electroreduction of nitrate, chlorate and
peroxodisulfate.
Figure 5.9. Cyclic voltammetries of Au/MPS/(PAH4/PAA3)/POM electrodes in the absence and presence of (a)
NO2‐, (b) ClO3
‐, (c) S2O8
2‐. Reactant concentrations (a): 10 mM, 20 mM,30 mM, 40 mM and 50 mM; (b): 10 mM,
30 mM, 50 mM, 70 mM, 100 mM; (c): 0.2 mM, 0.4 mM, 0.6 mM, 0.8 mM, 1 mM. Scan rate 0.025 V s‐1. Inset:
catalytic currents at the third reductive peak (~ 0.14 V vs. Ag/AgCl) as a function of reactant concentration
Figure 5.9 shows the electrocatalytic reduction of (a) NaNO2, (b) KClO3 and (c) K2S2O8 on
Au/MPS/(PAH4/PAA3)/POM electrodes in aqueous solution as a function of the increasing
concentration of the reactant. With increasing concentration of NO2‐ (Figure 5.9a), ClO3
‐ (Figure 5.9b)

LbL self‐assembled films containing polyoxomolybdates over Au surfaces 119
and S2O82‐ (Figure 5.9c), all three reduction peak currents increase gradually, whereas the
corresponding oxidation peak currents decrease, suggesting that the three molecules are reduced by
two‐, four‐, and six‐electron reduced species of POM anions (here it should be noticed that the first
and second reduction wave seem to be inert towards reducing ClO3‐). Furthermore, the six‐electron
reduced species have a much larger catalytic activity towards reduction of the molecules than the
two‐ and four‐ electron reduced species. In this reduction process, the four‐electron reduced species
is regenerated. The insets of Figure 5.9 show the catalytic currents at the third reductive peak (~
0.14 V vs. Ag/AgCl) as a function of reactant concentration. The responses of the electrodes are
linear in the ranges (a) 0.50–70.00 mM, (b) 0.90–100.00 mM and (c) 0.05–0.80 mM; and the
sensitivities are respectively, 0.51, 0.15 and 43.20 A cm‐2 mM‐1. These values are comparable to
those found in the literature: 0.5 A cm‐2 mM‐1 for NO2‐,16 0.74 A cm‐2 mM‐1 for ClO3
‐ 13 and 18.6 A
cm‐2 mM‐1 for S2O82‐.16 The data shows that the POM‐modified electrodes present a reasonable
response towards the detection of nitrate, chlorate and peroxodisulfate. The electrodes are quite
stable, yielding reproducible signals over different reactant experiments. The electrode response
was stable for at least 3 weeks, and when not in use, the modified electrode was stored in air. The
good stability and high sensibility of these electrodes make them promising candidates for
amperometric detectors.
5.6 Conclusions
A new, convenient and efficient method for the functionalization of layer‐by‐layer self‐assembled
polyelectrolyte films deposited over Au electrodes with polyoxomolybdate anions via ion exchange
from solution was developed and discussed in this chapter. POM functionalized electrodes were
thoroughly characterized with XPS, FTIR‐ATR, ellipsometry and EQCM which clearly show that POM
molecules can be successfully incorporated into polyelectrolyte films via ion exchange. These fresh
films suffer from a sharp delamination that involves the loss of polyelectrolyte as well as POM
molecules from the films into acid or basic solutions. Remarkably, after this initial sharp decrease in
mass they remain stable in time and with electrochemical use. Electrochemical measurements as a
function of pH suggest that POM molecules do not decompose even when the external pH is 4.8.
This is an important finding as it indicates that incorporation of POM molecules into layer‐by‐layer
self‐assembled monolayer films could prevent partial hydrolysis of POM from taking place in the pH
range studied. CV studies demonstrated that Au/MPS/(PAHn+1/PAAn)/POM electrodes have high
stability, fast response and good electrocatalytic activity for the reduction of nitrite, chlorate and

120 LbL self‐assembled films containing polyoxomolybdates over Au surfaces
peroxodisulfate; making these electrodes potential candidates for durable electrochemical sensors
for the detection of these molecules.

LbL self‐assembled films containing polyoxomolybdates over Au surfaces 121
References
1. Pope, M.Y.; Müller, A. Polyoxometalate Chemistry: An Old Field with New Dimensions in
Several Disciplines. Angew. Chem. Int. Ed. Engl. (1991) 30, 34‐48.
2. Sadakane, M.; Steckhan, E. Electrochemical Properties of Polyoxometalates as
Electrocatalysts. Chem. Rev. (1998) 98, 219‐237.
3. Paliwoda‐Porebska, G.; Stratmann, M.; Rohwerder, M.; Potje‐Kamloth, K.; Lu, Y.; Pich, A.Z.;
Adler, H.J. On the development of polypyrrole coatings with self‐healing properties for iron
corrosion protection. Corros. Sci. (2005) 47, 3216‐3233.
4. Dong, S.; Jin, Z. 1 : 12 Phosphomolybdic anion modified glassy carbon electrode. J. Chem. Soc.
Chem. Commun. (1987) 1871‐1872.
5. Wang, B.; Dong, S. Electrochemical study of isopoly and heteropolyoxometallate film
modified microelectrodes. Part 5. Preparation and electrochemical behaviour of a 2 : 18‐
molybdodiphosphate anion monolayer modified electrode. J. Electroanal. Chem. (1992) 328,
245‐257.
6. Kuhn, A.; Anson, F.C. Adsorption of Monolayers of P2Mo18O626‐ and Deposition of Multiple
Layers of Os(bpy)32+‐P2Mo18O626‐ on Electrode Surfaces. Langmuir (1996) 12, 5481‐5488.
7. Keita, B.; Nadjo, L. Activation of Electrode Surfaces. Application to the Electrocatalysis of the
Hydrogen Evolution Reaction. J. Electroanal. Chem. (1985) 191, 441‐448.
8. Keita, B.; Nadjo, L.; Krier, G.; Muller, J.F. Activation of Electrode Surfaces by
Isopolytungstates. J. Electroanal. Chem. (1987) 223, 287‐294.
9. Dong, S.; Cheng, L.; Zhang, X. Electrochemical studies of a lanthanide heteropoly
tungstate:molybdate complex in polypyrrole film electrode and its electrocatalytic reduction
of bromate. Electrochim. Acta (1997) 43, 563‐568.
10. Keita, B.; Essaadi, K.; Nadjo, L. Surface functionalization with oxometalates entrapped in
polymeric matices. Part I. New and remarkably stable poly(4‐vinylpyridine) based redox
coatings. J. Electroanal. Chem. (1989) 259, 127‐146.
11. Pham, M.‐C.; Bouallala, S.; Lé, L.A.; Dang, V.M.; Lacaze, P.‐C. Study of a heteropolyanion‐
doped poly(5‐amino‐1‐naphthol) film electrode and its catalytic activity. Electrochim. Acta
(1997) 42, 439‐447.
12. Keita, B.; Belhouari, A.; Nadjo, L. Oxometalate‐clay‐modified electrodes: synthesis and
properties of anionic clays pillared by metatungstate. J. Electroanal. Chem. (1993) 355, 235‐
251.

122 LbL self‐assembled films containing polyoxomolybdates over Au surfaces
13. Papadakis, A.; Souliotis, A.; Papaconstntinou, E. Functionalization of electrodes with
polyoxometalates P2Mo18O626‐ and P2W18O62
6‐. J. Electroanal. Chem. (1997) 435, 17‐21.
14. Wang, P.; Wang, X.; Zhu, G. Sol–gel‐derived ceramic carbon composite electrode containing
isopolymolybdic anions. Electrochim. Acta (2000) 46, 637‐641.
15. Zhou, M.; Guo, L.; Lin, F.; Liu, H. Electrochemistry and electrocatalysis of polyoxometalate‐
ordered mesoporous carbon modified electrode. Analytica Chim. Acta (2007) 587, 124‐131.
16. Guo, W.; Xu, L.; Xu, B.; Yang, Y.; Sun, Z.; Liu, S. A modified composite film electrode of
polyoxometalate/carbon nanotubes and its electrocatalytic reduction. J. Appl. Electrochem.
(2009) 39, 647‐652.
17. Keita, B.; Belhouari, A.; Nadjo, L.; Contant, R. Electrocatalysis by polyoxometalate I polymer
systems: reduction of nitrite and nitric oxide. J. Electroanal. Chem. (1995) 381, 243‐250.
18. Wang, P.; Li, Y. Electrochemical and electrocatalytic properties of polypyrrole film doped with
heteropolyanions. J. Electroanal. Chem. (1996) 408, 77‐81.
19. Wang, L.; Xiao, D.; Wang, E.; Xu, L. Electrochemistry of ITO electrode modified by multilayer
ultrathin films based on crown‐shaped polyoxomolybdate. J. Coll. Int. Sci. (2005) 285, 435‐
442.
20. Rong, C.; Anson, F.C. Spontaneous adsorption of heteropolytungstates and
heteropolymolybdates on the surfaces of solid electrodes and the electrocatalytic activity of
the adsorbed anions. Inorg. Chim. Acta (1996) 242, 11‐16.
21. Decher, G. Fuzzy Nanoassemblies: Toward Layered Polymeric Multicomposites. Science
(1997) 277, 1232‐1237.
22. Decher, G.; Hong, J.D.; Schmitt, J. Buildup of ultrathin multilayer films by a self‐assembly
process: III. Consecutively alternating adsorption of anionic and cationic polyelectrolytes on
charged surfaces. Thin Solid Films (1992) 210‐211, 831‐835.
23. Ferreira, M.; Cheung, J.H.; Rubner, M.F. Molecular self‐assembly of conjugated polyions: a
new process for fabricating multilayer thin film heterostructures. Thin Solid Films (1994) 244,
806‐809.
24. Laurent, D.; Schlenoff, J.B. Multilayer Assemblies of Redox Polyelectrolytes. Langmuir (1997)
13, 1552‐1557.
25. Tagliazucchi, M.; Calvo, E.J. in Chemically Modified Electrodes. Eds.Alkire, R.C., et al. Wiley‐
VCH Verlag GmbH & Co.: Weinheim, (2009).
26. Hodak, J.; Etchenique, R.; Calvo, E.J.; Singhal, K.; Bartlett, P.N. Layer‐by‐Layer Self‐Assembly
of Glucose Oxidase with a Poly(allylamine)ferrocene Redox Mediator. Langmuir (1997) 13,
2708‐2716.

LbL self‐assembled films containing polyoxomolybdates over Au surfaces 123
27. Farhat, T.R.; Schlenoff, J.B. Ion Transport and Equilibria in Polyelectrolyte Multilayers.
Langmuir (2001) 17, 1184‐1192.
28. Han, S.; Lindholm‐Sethson, B. Electrochemistry at ultrathin polyelectrolyte films self‐
assembled at planar gold electrodes. Electrochim. Acta (1999) 45, 845‐853.
29. Sun, C.; Zhao, J.; Xu, H.; Sun, Y.; Zhang, X.; Shen, J. Fabrication of multilayer films containing
1:12 phosphomolybdic anions on the surface of a gold electrode based on electrostatic
interaction and its application as an electrochemical detector in flow‐injection amperometric
detection of hydrogen peroxide. J. Electroanal. Chem. (1997) 435, 63‐68.
30. Cheng, L.; Niu, L.; Gong, J.; Dong, S. Electrochemical Growth and Characterization of
Polyoxometalate‐Containing Monolayers and Multilayers on Alkanethiol Monolayers Self‐
Assembled on Gold Electrodes. Chem. Mater. (1999) 11, 1465‐1475.
31. Fernandes, D.M.; Carapuça, H.M.; Brett, C.M.A.; Cavaleiro, A.M.V. Electrochemical behaviour
of self‐assembly multilayer films based on iron‐substituted α‐Keggin polyoxotungstates. Thin
Solid Films (2010) 518, 5881‐5888.
32. Wang, T.C.; Rubner, M.F.; Cohen, R.E. Polyelectrolyte Multilayer Nanoreactors for Preparing
Silver Nanoparticle Composites: Controlling Metal Concentration and Nanoparticle Size.
Langmuir (2002) 18, 3370‐3375.
33. Vago, M.; Tagliazucchi, M.; Williams, F.J.; Calvo, E.J. Electrodeposition of a palladium
nanocatalyst by ion confinement in polyelectrolyte multilayers. Chem. Commun. (2008) 5746‐
5748.
34. Finklea, H.O.; Snider, D.A.; Fedyk, J. Passivation of pinholes in octadecanethiol monolayers on
gold electrodes by electrochemical polymerization of phenol. Langmuir (1990) 6, 371‐376.
35. Shiratori, S.S.; Rubner, M.F. pH‐Dependent Thickness Behavior of Sequentially Adsorbed
Layers of Weak Polyelectrolytes. Macromolecules (2000) 4213‐4219.
36. Decher, G.; Schlenoff, J.B. Multilayer Thinf Films. Wiley‐VCH, Weinheim, (2003).
37. Tagliazucchi, M., Estudio de films nanoestructurados obtenidos mediante técnicas de
autoensamblado capa por capa. PhD Thesis, (2009).
38. Kozhevnikov, I.V. Catalysis by Polyoxometalates. John Wiley & Sons, Ltd., Sussex, (2002).
39. Fournier, M.; Rocchiccioli‐Deltcheff, C.; Kazansky, L.P. Infrared spectroscopic evidence of
bipolaron delocalization in reduced heterododecamolybdates. Chem. Phys. Lett. (1994) 223,
297‐300.
40. Ratajczak, H.; Barnes, A.J.; Bielansky, A.; Lutz, H.D.; Müller, A.; Pope, M.T. Vibrational
Spectroscopy of Heteropoly Acids, in Polyoxometalate Chemistry. Eds.Pope, M.T.; A. Müller.
Kluwer Academic Publishers: Netherlands, (2001).

124 LbL self‐assembled films containing polyoxomolybdates over Au surfaces
41. Girina, G.P.; Ovsyannikova, E.V.; Alpatova, N.M. Electrostatic Synthesis and Electrochemical
Properties of a Composition Comprising Ultrathin Layers of Silicododecamolybdate Anions
and Poly(allyl ammonium) Cations. Russ. J. Electrochem. (2007) 43, 1026‐1032.
42. Wang, J. Analytical Electrochemistry. Wiley‐VCH, New Jersey, (2006).
43. Bard, A.J.; Faulkner, L.R. Electrochemical Methods: Fundamentals and Applications. John
Wiley & Sons, New Jersey, (2001).

Chapter 6
Layer-by-Layer self-assembled redox
polyelectrolytes on passive steel

126 LbL Self‐Assembled Redox Polyelectrolytes on Passive Steel

LbL Self‐Assembled Redox Polyelectrolytes on Passive Steel 127
6.1 Introduction
This chapter deals carbon steel, a material which is ubiquitous in industry applications but is very
prone to suffer corrosion. The study will focus on the feasibility of growing a layer‐by‐layer self‐
assembled (LbL) polymer film on steel surfaces and their possible applications for corrosion
protection.
Passive iron and steel have long been known. Michael Faraday1 suggested that a thin oxide film
covers iron and its alloys, giving them resistance to corrosion. Since then there has been a long‐
standing controversy about the nature of this passivating oxide film, although it is now well accepted
that the film consists of iron oxides with Fe(II) adjacent to the metal and Fe(III) in the outside layer in
contact with the electrolyte.2‐10
Despite the great potential applications of LbL self‐assembled polyelectrolyte films, there are only a
few reports of LbL self‐assembled polyelectrolyte films on oxide‐covered surfaces. Bruenning et al.
described cross‐linked layered poly(allylamine)–poly(acrylic acid) films by amide formation after self‐
assembling a PAH–PAA multilayer on mercaptopropionic thiolated gold surfaces11 and aluminium
with a natural thin oxide layer.12 Schlenoff and coworker have shown that a self‐assembled
multilayer of poly(diallyldimethyl‐ammonium) (PDDA) and polystyrene sulfonate (PSS) on stainless
steel strongly suppresses corrosion in chloride solutions.13 Wang et. al. have self‐assembled a
molybdenum cluster on indium tin oxide electrode and studied the electrochemical properties.14
The purpose of this section is to demonstrate the feasibility of modifying a passive steel surface by
layer‐by‐layer self‐assembling polyelectrolyte multilayers using as reporting molecule a redox
osmium complex tethered to a poly(allylamine) backbone and to investigate the electron transfer
process between the metal and the adsorbed osmium polymer through electronic states in the
passive oxide film with a thickness larger than that of direct tunnelling distance.
6.2 Electrode modification
Steel samples employed were cut from SAE 1008/1010 Q‐panels. They were ground up to 1200 grid
paper and then polished to mirror‐like quality with 1, 0.3, and 0.05 μm Al2O3 slurries on a mechanical
polisher. Between each polishing step they were cleaned in an ultrasonic bath with acetone and
then ethanol for 5 min. Passivation of steel electrodes was carried out in 0.1 M NaOH aqueous
solution. A potential of −1.1 V was applied during 1 min to remove any impuriピes a─ached to the
surface. Then the potential was immediately stepped to + 0.3 V and left at this potential during 30

128 LbL Self‐Assembled Redox Polyelectrolytes on Passive Steel
min. Typical current values after this time were 0.75 – 1 μA cm–2. The passive layer was charged
negatively, so the layer‐by‐layer deposition started with the poly(allylamine hydrochloride)
polycation, modified with an osmium pyridine‐bipyridine complex (PAH‐Os). The subsequent layers
were deposited on the modified surface by alternate immersion in a solution of the respective
poly(vinylsulfonate, sodium salt) polyanion (PVS) or polycation (PAH‐Os) for 15 min and rinsing with
Milli‐Q water until the desired number of layers was achieved. Scheme 6.1 shows the structure of
the Poly(vinylsulfonate, sodium salt) (PVS) and the osmium bypiridine derivatized redox polymer Os‐
(bpy)2ClPyCH2NH‐poly(allylamine) (PAH‐Os) that are self‐assembled layer‐by‐layer on passive steel to
form the PAH‐Os/PVS polyelectrolyte films.
Scheme 6.1. Molecular structures of the polycation (PAH‐Os) and polyanion (PVS) polymers
6.3 X‐ray Photoelectron Spectroscopy of self‐assembled films on passive steel
The layer‐by‐layer self‐assembled films were analysed with XPS as a function of the number of
deposited layers. Broad scans show the presence of only Fe, O, and C in the “as prepared” steel
substrate surface. Deposition of polyelectrolyte films resulted in the appearance of N, S, and Os as
expected. Figure 6.1 shows the Fe 2p, C 1s, O 1s, N 1s, S 2p, and Os 4f XPS spectra as a function of
the number of deposited bilayers: passive steel (PS) and passive steel with an increasing number of
(PAH‐Os/PVS)x bilayers (x = 1, 2, 3, and 5) all terminated with PAH‐Os.

LbL Self‐Assembled Redox Polyelectrolytes on Passive Steel 129
Figure 6.1. XPS spectra of (PAH‐Os/PVS)x/PAH‐Os deposited over passive steel (PS) as a function of number of
bilayers x = 1, 2, 3, and 5
The Fe 2p3/2 spectrum corresponding to the passive steel sample is a broad signal containing
unresolved contributions at (i) 710.2 eV corresponding to FeO,15 (ii) 711.2 eV corresponding to
Fe2O3,15 and (iii) 711.9 eV corresponding to FeOOH.16 This assignment is based on XPS studies of
passivated iron published in the literature. It should be noted that no Fe0 is observed at 706.9 eV,
which means that the passive layer is thicker than three times the effective electron attenuation
length of the oxide, i.e., the thickness of the passive layer is greater than ~ 4 nm.15 This is in
agreement with the oxide layer thickness of 5 nm measured by ellipsometry (see section 6.4).

130 LbL Self‐Assembled Redox Polyelectrolytes on Passive Steel
Furthermore, the intensity of the Fe 2p signal decreases as the number of polyelectrolyte layers
increases, confirming layer deposition over the steel substrate. The (PAH‐Os/PVS)x/PAH‐OS
polyelectrolyte film thickness can be estimated from the attenuation of the Fe 2p signal using the
following expression:
彫彫轍 噺 結貸匂冬搭棟廃敗 (6.1)
Where 荊 (荊待) is the integrated area of the Fe 2p XPS signal after (before) film deposition, 穴 is the film
thickness (肯 = 90°), and 膏 is the attenuation length of the photoelectrons in the polyelectrolyte film.
The film thickness as a function of the number of deposited layers was estimated using the value of 膏 = 4.9 nm as estimated below (see Figure 6.5) and the resulting values are in excellent agreement
with those calculated from the ellipsometric measurements, as discussed in the following section
(see also Figures 6.4 and 6.5).
The C 1s spectrum of the passive film shows that a small amount of residual carbon is present before
polyelectrolyte deposition. As the number of polymer layers increases the C signal increases as
shown by the C 1s spectra, which contains two main contributions: the first one at 285.2 eV due to C
bonded to C atoms17 and the second one at 286.4 eV due to C bonded to the more electronegative
N and S atoms.17 The O 1s XPS spectrum corresponding to the passive steel sample has two main
contributions, the low binding energy peak at 530 eV is due to O2‐ anions in the oxide layer16
whereas the high binding energy peak at 531.5 eV is due to OH‐ in FeOOH.16, 18 As the polyelectrolyte
film is deposited a new signal in the O 1s signal appears at 531.7 eV due to the SO3‐ group of the
poly(vinylsulfonate).19 It is clear that as the number of deposited layers increases, the thickness of
the polyelectrolyte film and the intensity of the peak due to the sulfonate group increase whereas
the O 1s contribution from the iron oxide decreases.
The iron oxide passive layer shows no N 1s or S 2p signals. N 1s and S 2p XPS spectra show that both
signals increase with the number of polyelectrolyte layers deposited. The S 2p3/2 peak at 168.3 eV
arises from the SO3‐ group in the poly(vinylsulfonate) polyelectrolyte,19 whereas the N 1s signal is
due to the poly(allylamine) polyelectrolyte.20 The N 1s spectra have two components: the low BE
component at 400 eV is associated with N atoms from the aliphatic NH2 group in the PAH‐Os
backbone21 and to the N atoms in the pyridine and bypyridine ligands in the osmium complex;22
whereas the high BE component at 401.7 eV is due to protonated NH3+ groups21 whose positive
charge causes a high BE shift. Note that as the number of deposited layers increases the NH3+/NH2
ratio also increases. This can be rationalized as follows: the degree of NH2 protonation in the first
PAH‐Os layer should be low to reduce repulsions between positively charged groups. As the
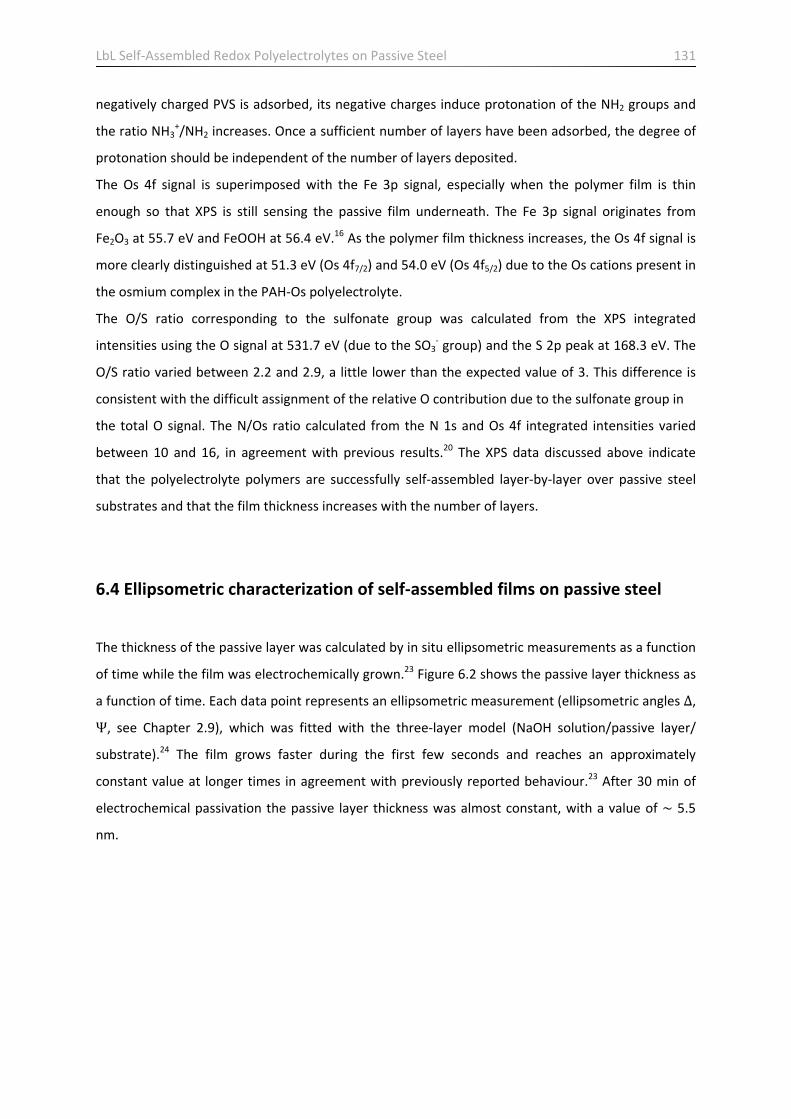
LbL Self‐Assembled Redox Polyelectrolytes on Passive Steel 131
negatively charged PVS is adsorbed, its negative charges induce protonation of the NH2 groups and
the ratio NH3+/NH2 increases. Once a sufficient number of layers have been adsorbed, the degree of
protonation should be independent of the number of layers deposited.
The Os 4f signal is superimposed with the Fe 3p signal, especially when the polymer film is thin
enough so that XPS is still sensing the passive film underneath. The Fe 3p signal originates from
Fe2O3 at 55.7 eV and FeOOH at 56.4 eV.16 As the polymer film thickness increases, the Os 4f signal is
more clearly distinguished at 51.3 eV (Os 4f7/2) and 54.0 eV (Os 4f5/2) due to the Os cations present in
the osmium complex in the PAH‐Os polyelectrolyte.
The O/S ratio corresponding to the sulfonate group was calculated from the XPS integrated
intensities using the O signal at 531.7 eV (due to the SO3‐ group) and the S 2p peak at 168.3 eV. The
O/S ratio varied between 2.2 and 2.9, a little lower than the expected value of 3. This difference is
consistent with the difficult assignment of the relative O contribution due to the sulfonate group in
the total O signal. The N/Os ratio calculated from the N 1s and Os 4f integrated intensities varied
between 10 and 16, in agreement with previous results.20 The XPS data discussed above indicate
that the polyelectrolyte polymers are successfully self‐assembled layer‐by‐layer over passive steel
substrates and that the film thickness increases with the number of layers.
6.4 Ellipsometric characterization of self‐assembled films on passive steel
The thickness of the passive layer was calculated by in situ ellipsometric measurements as a function
of time while the film was electrochemically grown.23 Figure 6.2 shows the passive layer thickness as
a function of time. Each data point represents an ellipsometric measurement (ellipsometric angles つ, Ψ, see Chapter 2.9), which was fitted with the three‐layer model (NaOH solution/passive layer/
substrate).24 The film grows faster during the first few seconds and reaches an approximately
constant value at longer times in agreement with previously reported behaviour.23 After 30 min of
electrochemical passivation the passive layer thickness was almost constant, with a value of ~ 5.5
nm.

132 LbL Self‐Assembled Redox Polyelectrolytes on Passive Steel
Figure 6.2. Passive film thickness as a function of time determined by in situ ellipsometric measurements. The
steel substrate was immersed in 0.1 M NaOH solution and the potential applied was +0.3 V vs Ag/AgCl. The
inset shows an enlargement of the first seconds of the passive film growth
Figure 6.3 shows the measured ex‐situ ellipsometric angles つ, Ψ (full circles) as a function of (i)
number of self‐assembled layer, (from 1 bilayer to 13 bilayers) and (ii) incidence angle (from 40o to
70o in 5o steps). The data were fitted in two ways, shown by the curves (full lines) in Figure 6.3. In the
first one, the ellipsometric angles were fitted as a function of the number of self‐assembled layers
for a fixed incidence angle with a three‐layer model (air/polymer film/passive layer). Here it is
assumed that the refractive index (npolymer) and the extinction coefficient (kpolymer) of the polymer film
are independent of the number of assembled layers.25, 26 In the second one, the ellipsometric
parameters were fitted as a function of incidence angle for a given number of self‐assembled layers.
In this case it is not necessary to assume average values for npolymer and kpolymer. Optical parameters
for the polyelectrolyte film obtained from both fits are very similar and are also in good agreement
with results obtained by Tognalli and Fainstein27 (at fixed angle npolymer = 1.54 ± 0.02 and kpolymer =
0.025 ± 0.02; at fixed number of self‐assembled layers npolymer = 1.52 ± 0.02 and kpolymer = 0.021 ±
0.02). From these data the thickness of the polyelectrolyte film was also calculated.

LbL Self‐Assembled Redox Polyelectrolytes on Passive Steel 133
Figure 6.3. Ellipsometric angles つ, Ψ fitted with a three‐layer model (air/polymer film/passive layer) as a
function of incidence angle (from 40° to 70°) and adsorption step (from 1 bilayer to 13 bilayers)
Figure 6.4 shows the thickness of the polyelectrolyte film self‐assembled on passive steel as a
function of the number of deposited layers (odd (even) numbers correspond to PAH‐Os (PVS)
terminated layers). Open circles show thickness values calculated from the attenuation of the Fe 2p
XPS signal (as discussed above) and full circles show values calculated from ellipsometric ex‐situ
data. Only the topmost layers (up to ~ 11 nm) can be sampled by XPS given the surface‐sensitive
nature of the technique and therefore XPS could only be used to calculate the thickness of relatively
thin films. The excellent agreement between the XPS and ellipsometric calculated thicknesses should
be noted at this point. Figure 6.4 shows that the rate of thickness growth with the number of
deposited layers is not constant: for thin films (up to 10−13 layers, about 30 nm) the rate of
thickness growth is smaller than for thicker films (greater than ~ 13 layers). A similar behaviour was
observed during the self‐assembly of PAH/PAA polyelectrolyte layers over thiolated Au substrates
(see Chapter 5) and it was attributed to the influence of the substrate on the growth of thin
polyelectrolyte films.

134 LbL Self‐Assembled Redox Polyelectrolytes on Passive Steel
Figure 6.4. Thickness of self‐assembled PAH‐Os/PVS films over passive steel as a function of the number of
deposited layers calculated from XPS data (open circles) and ex‐situ ellipsometric measurements (filled circles)
Figure 6.5 shows the normalized intensity of the XPS Fe 2p signal (see Figure 6.1) vs. the
ellipsometric film thickness for the first 5 bilayers of PAH‐Os/PVS adsorbed on passive steel, as well
as a fit done with equation (6.1), where the fitting parameter was the attenuation length, 膏. The
fitting is quite good and the obtained value of 膏 = 4.9 nm is quite reasonable for polyelectrlyte LbL
self‐assembled films.28
Figure 6.5. Fe2p XPS decay signal as a function of the self‐assembled PAH‐Os/PVS ellipsometric film thickness

LbL Self‐Assembled Redox Polyelectrolytes on Passive Steel 135
6.5 Electrochemical properties of self‐assembled PAH‐Os/PVS films on
passive steel
Figure 6.6a shows cyclic voltammograms of bare (dotted line), (PAH/PVS)4/PAH (dashed line), and
(PAHOs/PVS)4/PAH‐Os (full line) passive steel electrodes. The bare passive steel electrode (dotted
line) and the (PAH/PVS)4/PAH film (without the Os complex) self‐assembled over passive steel
(dashed line) give a base line with no oxidation–reduction peaks in the potential range scanned (−0.1
to 0.7 V vs. Ag/AgCl). On the other hand, (PAHOs/ PVS)4/PAH‐Os modified passive steel electrodes
show a clear oxidation peak around 0.50 V due to the oxidation of Os+2 to Os+3 and its corresponding
reduction peak at 0.12 V. Figure 6.6a shows that (i) the polyelectrolyte film self‐assembles onto the
passive surface and (ii) the electrochemical signal originates exclusively from the osmium complex.
Figure 6.6. Cyclic voltammograms of (a) bare (dotted line), (PAH/PVS)4/PAH (dashed line), and (PAH‐
Os/PVS)4/PAH‐Os (full line) passive steel electrodes at 10 mV/s; (b) (PAH‐Os/PVS)4/PAH‐Os self‐assembled over
a 3‐mercaptopropanoic acid modified Au electrode (dashed line) and passive steel electrode (full line) at 10
mV/s; and (c) (PAH‐Os/PVS)4/PAH‐Os self‐assembled over a passive steel electrode at increasing scan rates (5
mV/s to 100 mV/s)
Figure 6.6b shows cyclic voltammograms of the (PAH‐Os/PVS)4/PAH‐Os film self‐assembled onto an
Au/MPS modified electrode (dashed line) and passive steel electrode (full line). When the
polyelectrolyte film is self‐assembled over Au surfaces there is no difference in the oxidation and
reduction peak positions, suggesting that in this case the redox process is reversible. However, when
the polyelectrolyte film is self‐assembled on passive steel a substantial peak separation is apparent,
which is consistent with a limited electron flux at the oxidized iron surface resulting in an irreversible
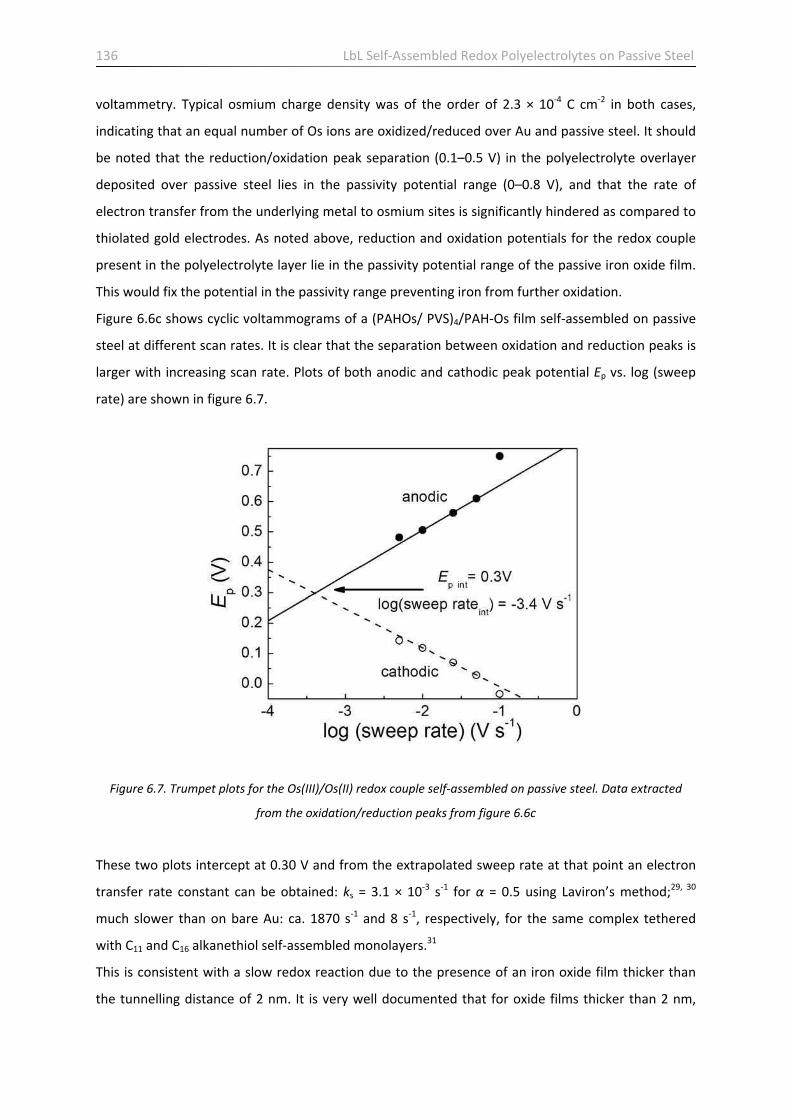
136 LbL Self‐Assembled Redox Polyelectrolytes on Passive Steel
voltammetry. Typical osmium charge density was of the order of 2.3 × 10‐4 C cm‐2 in both cases,
indicating that an equal number of Os ions are oxidized/reduced over Au and passive steel. It should
be noted that the reduction/oxidation peak separation (0.1–0.5 V) in the polyelectrolyte overlayer
deposited over passive steel lies in the passivity potential range (0–0.8 V), and that the rate of
electron transfer from the underlying metal to osmium sites is significantly hindered as compared to
thiolated gold electrodes. As noted above, reduction and oxidation potentials for the redox couple
present in the polyelectrolyte layer lie in the passivity potential range of the passive iron oxide film.
This would fix the potential in the passivity range preventing iron from further oxidation.
Figure 6.6c shows cyclic voltammograms of a (PAHOs/ PVS)4/PAH‐Os film self‐assembled on passive
steel at different scan rates. It is clear that the separation between oxidation and reduction peaks is
larger with increasing scan rate. Plots of both anodic and cathodic peak potential Ep vs. log (sweep
rate) are shown in figure 6.7.
Figure 6.7. Trumpet plots for the Os(III)/Os(II) redox couple self‐assembled on passive steel. Data extracted
from the oxidation/reduction peaks from figure 6.6c
These two plots intercept at 0.30 V and from the extrapolated sweep rate at that point an electron
transfer rate constant can be obtained: ks = 3.1 × 10‐3 s‐1 for α = 0.5 using Laviron’s method;29, 30
much slower than on bare Au: ca. 1870 s‐1 and 8 s‐1, respectively, for the same complex tethered
with C11 and C16 alkanethiol self‐assembled monolayers.31
This is consistent with a slow redox reaction due to the presence of an iron oxide film thicker than
the tunnelling distance of 2 nm. It is very well documented that for oxide films thicker than 2 nm,

LbL Self‐Assembled Redox Polyelectrolytes on Passive Steel 137
direct electron tunnelling from metal states to redox species in solution is hindered and therefore
electron states in the oxide film should participate in the electron transfer mechanism.32 Previous
experiments on electrochemical tunnelling spectroscopy of passive iron33, 34 have shown that there is
a low density of electronic states in the passive potential region of iron oxides in passivation layers
and this would explain the less reversible electron transfer for the otherwise fast Os(III)/Os(II) redox
couple.
6.6 Conclusions
In this chapter, it was shown that it is possible to self‐assemble an osmium redox polyelectrolyte
multilayer on a passive steel electrode, as shown by X‐ray Photoelectron Spectroscopy and
ellipsometry. The thickness of the (PAH‐Os/PVS)n/PAH‐Os multilayers self‐assembled over passive
steel increases with the number of dipping cycles in a comparable fashion to the films grown on
thiolated gold (see Chapter 5). Electrochemical experiments have shown that the
oxidation/reduction of the osmium sites lie in the passivity potential interval and the rate of electron
transfer from the underlying metal to osmium sites in the polymer overlayer is significantly hindered
as compared to thiolated gold electrodes. This is consistent with a low density of electronic states in
the passive film, as has been shown with electrochemical tunnelling spectroscopy (ECTS) and with
the sluggish electrochemistry at passive iron in contact with soluble redox species in the adjacent
electrolyte.35, 36 This is the first time that electron transfer rate through a passive oxide film is
measured with a redox couple probe that is directly attached to the oxide film rather than freely
diffusing in solution.

138 LbL Self‐Assembled Redox Polyelectrolytes on Passive Steel
References
1. Faraday, M. Experimental Researches in Electricity. Dover Publisher, London, (1848
(Reprinted 1965)).
2. Vetter, K.J. General kinetics of passive layers on metals. Electrochim. Acta (1971) 16, 1923‐
1937.
3. Chen, C.T.; Cahan, B.D. The Nature of the Passive Film on Iron I. Automatic Ellipsometric
Spectroscopy Studies. J. Electrochem. Soc. (1982) 129, 17‐26.
4. Chen, C.T.; Cahan, B.D. The Nature of the Passive Film on Iron II. A‐C Impedance Studies. J.
Electrochem. Soc. (1982) 129, 474‐480.
5. Chen, C.T.; Cahan, B.D. The Nature of the Passive Film on Iron III. The Chemi‐Conductor
Model and Further Supporting Evidence. J. Electrochem. Soc. (1982) 129, 921‐925.
6. Kruger, J. The nature of the passive film on iron and ferrous alloys. Corros. Sci. (1989) 29,
149‐162.
7. Kuroda, K.; Cahan, B.D.; Nazri, G.; Yeager, E.; Mitchell, T.E. Electron Diffraction Study of the
Passive Film on Iron. J. Electrochem. Soc. (1982) 129, 2163‐2169.
8. Oblonsky, L.J.; Davenport, A.J.; Ryan, M.P.; Isaacs, H.S.; Newman, R.C. In Situ X‐Ray
Absorption Near Edge Structure Study of the Potential Dependence of the Formation of the
Passive Film on Iron in Borate Buffer. J. Electrochem. Soc. (1997) 144, 2398‐2404.
9. Davenport, A.J.; Oblonsky, L.J.; Ryan, M.P.; Toney, M.F. The Structure of the Passive Film That
Forms on Iron in Aqueous Environments. J. Electrochem. Soc. (2000) 147, 2162‐2173.
10. Chin, Y.T.; Cahan, B.D. An Ellipsometric Spectroscopic Study of the Passive Film on Iron‐
Potential and Chloride Ion Dependence. J. Electrochem. Soc. (1992) 139, 2432‐2442.
11. Harris, J.J.; DeRose, P.M.; Bruening, M.L. Synthesis of Passivating, Nylon‐Like Coatings
through Cross‐Linking of Ultrathin Polyelectrolyte Films. J. Am. Chem. Soc. (1999) 121, 1978‐
1979.
12. Dai, J.; Sullivan, D.M.; Bruening, M.L. Ultrathin, Layered Polyamide and Polyimide Coatings
on Aluminum. Ind. Eng. Chem. Res. (2000) 39, 3528‐3535.
13. Farhat, T.R.; Schlenoff, B.J. Corrosion Control Using Polyelectrolyte Multilayers. Electrochem.
Solid‐State Lett. (2002) 5, B13‐B15.
14. Wang, L.; Xiao, D.; Wang, E.; Xu, L. Electrochemistry of ITO electrode modified by multilayer
ultrathin films based on crown‐shaped polyoxomolybdate. J. Colloid Interface Sci. (2005) 285,
435‐442.

LbL Self‐Assembled Redox Polyelectrolytes on Passive Steel 139
15. Roosendaal, S.J.; Giebels, I.A.M.E.; Vrendenberg, A.M.; Habraken, F.H.P.M. Determination of
photoelectron attenuation lengths in thin oxide films on iron surfaces using quantitative XPS
and elastic recoil detection. Surf. Interface Anal. (1998) 26, 758‐765.
16. McIntyre, N.S.; Zetaruk, D.G. X‐ray Photoelectron Spectroscopic Studies of Iron Oxides. Anal.
Chem. (1977) 49, 1521‐1529.
17. Briggs, D.; Beamson, G. High Resolution XPS of Organic Ploymers: The Scienta ESCA300
Database. John Wiley & Sons, New York, (1992).
18. Calvo, E.J.; Schiffrin, D.J. The electrochemical reduction of oxygen on passive iron in alkaline
solutions. J. Electroanal. Chem. (1988) 243, 171‐185.
19. Lindberg, B.J.; Hamrin, K.; Johansson, G.; Gelius, U.; Fahlman, A.; Nordling, C.; Siegbahn, K.
Molecular Spectroscopy by Means of ESCA. Phys. Scr. (1970) 1, 286‐298.
20. Tagliazucchi, M.; Williams, F.J.; Calvo, E.J. Effect of Acid‐Base Equilibria on the Donnan
Potential of Layer‐by‐Layer Redox Polyelectrolyte Multilayers. J. Phys. Chem. B (2007) 111,
8105‐8113.
21. Lourenço, J.M.C.; Ribeiro, P.A.; Botelho do Rego, A.M.; Braz Fernandes, F.M.; Moutinho,
A.M.C.; Raposo, M. Counterions in Poly(allylamine hydrochloride) and Poly(styrene sulfonate)
Layer‐by‐Layer Films. Langmuir (2004) 20, 8103‐8109.
22. Cohen, M.R.; Merrill, R.P. HREELS, ARUPS and XPS of pyridine on Ni(110). Surf. Sci. (1991)
245, 1‐11.
23. Chen, C.T.; Cahan, B.D.; Yeager, E., Passivation Studies of Iron, Nickel and their Alloys by In
Situ Ellipsometry and Ex Situ ESCA Techniques—Technical Report 48, 1979, Case Western
Reserve University: Cleveland, OH. p. 112‐113.
24. Azzam, R.M.A.; Bashara, N.M. Ellipsometry and Polarized Light. North‐Holland Publishing
Company, Amsterdam, (1977).
25. Forzani, E.S.; Otero, M.; Pérez, M.A.; Lopez Teijelo, M.; Calvo, E.J. The Structure of Layer‐by‐
Layer Self‐Assembled Glucose Oxidase and Os(Bpy)2ClPyCH2NH−Poly(allylamine)
Multilayers: Ellipsometric and Quartz Crystal Microbalance Studies. Langmuir (2002) 18,
4020‐4029.
26. Forzani, E.S.; Pérez, M.A.; Lopez Teijelo, M.; Calvo, E.J. Redox Driven Swelling of Layer‐by‐
layer Enzyme−Polyelectrolyte Mulピlayers. Langmuir (2002) 18, 9867‐9873.
27. Tognalli, N.; Fainstein, A. (2006). Personal communication.
28. Bain, C.D.; Whitesides, G.M. Attenuation Lengths of Photoelectrons in Hydrocarbon Films. J.
Phys. Chem. (1989) 93, 1670‐1673.

140 LbL Self‐Assembled Redox Polyelectrolytes on Passive Steel
29. Laviron, E. The use of linear potential sweep voltammetry and of a.c. voltammetry for the
study of the surface electrochemical reaction of strongly adsorbed systems and of redox
modified electrodes. J. Electroanal. Chem. (1979) 100, 263‐270.
30. Laviron, E. A multilayer model for the study of space distributed redox modified electrodes:
Part I. Description and discussion of the model. J. Electroanal. Chem. (1980) 112, 1‐9.
31. Ricci, A.; Rolli, C.; Rothacher, S.; Baraldo, L.; Bonazzola, C.; Calvo, E.J.; Tognalli, N.; Fainstein,
A. Electron transfer at Au surfaces modified by Tethered Osmium bipyridine–pyridine
complexes. J. Solid State Electrochem. (2007) 11, 1511‐1520.
32. Olmedo, A.M.T.; Pereiro, R.; Schiffrin, D.J. Solid state properties and electrode kinetics of the
Fe(CN)64−/Fe(CN)6
3− redox couple on passive iron in alkaline solutions. J. Electroanal. Chem.
(1976) 74, 19‐36.
33. Díez‐Pérez, I.; Sanz, F.; Gorostiza, P. Electronic barriers in the iron oxide film govern its
passivity and redox behavior: Effect of electrode potential and solution pH. Electrochem.
Commun. (2006) 8, 1595‐1602.
34. Díez‐Pérez, I.; Güell, A.; Sanz, F.; Gorostiza, P. Conductance Maps by Electrochemical
Tunneling Spectroscopy To Fingerprint the Electrode Electronic Structure. Anal. Chem. (2006)
78, 7325‐7329.
35. Stimming, U.; Schultze, J.W. The Capacity of Passivated Iron Electrodes and the Band
Structure of the Passive Layer. Ber. Bunsenges Phys. Chem. (1976) 80, 1297‐1302.
36. Stimming, U.; Schultze, J.W. A semiconductor model of the passive layer on iron electrodes
and its application to electrochemical reactions. Electrochim. Acta (1979) 24, 859‐869.

Chapter 7
Conclusions and
future outlook

142 Conclusions and future outlook

Conclusions and future outlook 143
7.1 General conclusions
The main goal of this work was to develop and characterize new electrode materials and modified
electrodes, and study their applicability in the field of electrocatalytic reactions. The results
presented were mostly experimental and exploratory, and have opened the field for future lines of
investigation.
Chapter 3 dealt with Au‐Cu bulk alloy electrodes. They were thoroughly characterized and their
surface properties were studied regarding their feasibility towards electrocatalytic reactions. Au‐Cu
bulk alloys show Au surface enrichment in UHV conditions. This was previously reported, both
experimentally1, 2 and theoretically.3, 4 XPS measurements showed that the Cu in the alloys was in
metallic state and not oxidized, so for the Au/Cu ratios studied in this work it is clear that alloying Cu
to Au stabilizes it and protects it from further oxidation. ARXPS results indicated that Cu
concentration decreased when closer to the surface. The Au‐Cu bulk alloy surface responds to the
presence of O2, accommodating its surface atomic population in a way that it becomes Cu enriched,
as Cu adsorbs O atoms. ARXPS measurements, as well as DFT calculations were employed to prove
this feature. The decrease in surface energy after this reorganisation (‐1.80 eV atom‐1) is quite large.
This behaviour poses interesting opportunities for these types of electrodes, where their surface
properties might change as a response to adsorbates, and thus, their reactivity might be attuned.
An interesting development aroused when studying the Au‐Cu bulk alloys as a function of annealing
temperature: Pb impurities in the alloys were detected after exposing the samples to annealing
temperatures above 325 oC. As before, the surface is Au enriched in UHV before annealing. After
annealing, Pb diffuses to the surface and becomes Pb enriched. This was shown both experimentally
(ARXPS) and theoretically (DFT). This goes to show that care needs to be taken during the synthesis
process, where small amounts of impurities in the starting up materials can diffuse to the surface
and thus affect their performance as electrocatalysts. This effect is not very pronounced when one
shifts to nanoparticulate systems, where a calculation shows that a 1 ppm of Pb as impurity in a
system of 5 nm diameter nanoparticles would represent that on average, 1 out of 295 particles
would contain a single atom of Pb. So, in a way, nanoparticulate systems are more “robust” towards
impurities than bulk systems.
It was shown that Cu bulk electrodes catalyse the electroreduction of CO2 towards liquid products
(ethanol and C3‐products), while Au only reduces CO2 to CO. The Au‐Cu bulk alloys studied did not
show production of liquid species from the electroreduction of CO2, but showed evidence of
reduction to CO.

144 Conclusions and future outlook
Chapter 4 presented the synthesis and characterization of Au‐Cu nanoparticles supported on carbon
black. A novel synthesis method for Au‐Cu nanoalloys was introduced which was shown to be
practical and robust, with monodisperse and stable nanoparticles that do not oxidize with time. The
synthesis uses poly(vinyl alcohol) as stabilizing agent. It was observed that particles with larger Cu
content in them showed larger mean sizes. It is proposed that PVA is not as effective as a stabilizing
agent with Cu as with Au, thus leading to larger particles when more Cu is present in them.
After adding the colloids to carbon black, the electrocatalysts were annealed to eliminate most of
the PVA. This annealing does not affect the nanoparticle structure or surface composition. EDX
studies of samples before and after annealing show the same composition and true alloying.
The modified electrodes showed electrochemical response towards CO2 reduction. The current is
proportional to the film thickness, showing that almost all of the nanoparticles in the electrocatalytic
film are electrically attached to the electrode and contribute to the electrochemistry. This is
important in the sense that the films are porous and thus, the electrochemical active area is very
large and thus more effective for electrocatalytic reactions.
GC electrodes modified with the Au‐Cu electrocatalysts showed production of ethanol as a result of
CO2 electroreduction. These results suggest that the catalytic properties of Au‐Cu alloys might be
related to the surface roughness,5 with Au‐Cu alloy nanoparticles supported on carbon black
presenting a much rougher surface structure than Au‐Cu bulk alloys. Au‐Cu bulk alloys did not show
production of liquid products, whereas nanoparticles are capable of reducing CO2 into more valuable
chemicals such as ethanol. This is a key result that bears further study. If there is a possibility of
systematizing the detection of liquid products from the electroreduction of CO2, the next step would
be to try to find a relationship between the surface characteristics and the product distribution, as
well as trying to establish a mechanism for CO2 reduction on Au‐Cu nanoalloys.
Unlike Cu catalysts which rapidly deactivate with usage, the experiments with Au‐Cu nanocatalysts
showed that Au‐Cu nanoparticles do not deactivate after several hours of continuous operation. This
was a key finding as it suggests that Au prevents Cu oxidation stabilizing the catalyst.
Chapter 5 shifted the focus of modified electrodes towards layer‐by‐layer self‐assembled polymer
films with incorporation of polyoxometalates via ionic exchange. The films grown are 100 nm thick,
about 10 times thinner than the Au‐Cu electrocatalytic inks discussed in the previous chapters. Even
so, their catalytic properties are exceptional, given the small amount of catalytic material (POM
anions) present in the films. Their response towards the electroreduction of the chosen salts is
comparable to those of published literature using other methods of attaching POM molecules to
electrodes.6, 7
Conclusions and future outlook 145
The films suffer from a sharp delamination that involves the loss of polyelectrolyte as well as POM
molecules from the films into acid or basic solutions, but after this initial sharp decrease in mass
they remain stable in time and with electrochemical use. Also, the electrochemical measurements
performed as a function of electrolyte solution pH suggest that POM molecules do not decompose
even when the external pH is 4.8, showing that incorporation of POM molecules into layer‐by‐layer
self‐assembled monolayer films could prevent partial hydrolysis of POM from taking place in the pH
range studied. Perhaps the most important finding in this part of the thesis was the fact that large
molecules such as polyoxomolybdates are able to be incorporated into LbL self‐assembled polymer
films via ionic exchange. This allows for a controlled functionalized electrode with catalytic
properties. All of these conclusions lead to think of the LbL self‐assembled POM‐modified films as
suitable candidates for electrocatalysts for several compounds.
As a final example of modified electrodes, carbon steel surfaces modified with LbL redox
polyelectrolytes were studied. The passive layer growth rate was monitored by in situ ellipsometry,
showing that most of the growth occurs during the first minute of applying the passivation potential.
The LbL self‐assembled redox polyelectrolyte films were characterized with ellipsometry and XPS
and the film thickness obtained by both techniques were in agreement. It was also shown that the
electrochemical response comes exclusively from the osmium complex present in the film. Also, the
electrochemical response is limited by the passive layer, as the same film self‐assembled unto Au
electrodes shows a completely reversible response. The electron transfer rate constant calculated
for the film on passive steel is 4 – 6 orders of magnitude slower than for films on Au substrates. This
is consistent with the low density of electronic states in the passive film.8, 9 This was the first time
that the electron transfer rate through a passive oxide film was measured with a redox couple probe
that is directly attached to the oxide film rather than freely diffusing in solution. This goes a long way
into understanding the surface properties of carbon steel surfaces. Further studies along this line
could yield some insight into designing anti corrosive films on carbon steel surfaces.
7.2 Future outlook
In summary, this work presented examples of modified electrodes with diverse uses, mostly
oriented toward electrocatalytic reactions. The knowledge gained will serve for future investigations
in the field of alloys (both in bulk and nanoparticles) and their application towards electroreduction
of CO2. These investigations should try to focus on systematizing the detection of liquid products of
Au‐Cu nanoalloy‐modified GC electrodes on the electroreduction of CO2, and through these results,

146 Conclusions and future outlook
try to obtain possible reaction mechanisms for CO2 reduction that would be of great help in the field
of catalysis. Also, the concept of the ionic exchange method for incorporating POM anions into LbL
self‐assembled polymer films on Au substrates concept could be extended to other kind of
substrates and study their stability and catalytic activity. Finally, LbL redox polyelectrolytes were
deposited on passivated carbon steel surfaces, using an Os complex as a probe to study the electron
transfer rate. It would be interesting to try to extend this concept to other kind of LbL materials, or
maybe other deposition methods to try to obtain surfaces that respond to external stimuli (e.g., they
become hydrophobic in the presence of a wetting agent, or an anticorrosive film).

Conclusions and future outlook 147
References
1. McDavid, J.M.; Fain Jr, S.C. Segregation at Cu‐au Alloy Surfaces. Surf. Sci. (1975) 52, 161‐173.
2. Mróz, S. Experimental determination of the composition depth profile of AuCu alloys via
Auger electron spectroscopy. Prog. Surf. Sci. (1998) 59, 323‐330.
3. Nilekar, A.U.; Ruban, A.V.; Mavrikakis, M. Surface segregation energies in low‐index open
surfaces of bimetallic transition metal alloys. Surf. Sci. (2009) 603, 91‐96.
4. Wang, L.; Johnson, D.D. Predicted Trends of Core−Shell Preferences for 132 Late Transiピon‐
Metal Binary‐Alloy Nanoparticles. J. Am. Chem. Soc. (2009) 131, 14023‐14029.
5. Tang, W.; Peterson, A.A.; Varela, A.S.; Jovanov, Z.P.; Bech, L.; Durand, W.J.; Dahl, S.; Nørskov,
J.K.; Chorkendorff, I. The importance of surface morphology in controlling the selectivity of
polycrystalline copper for CO2 electroreduction. Phys. Chem. Chem. Phys. (2012) 14, 76‐81.
6. Papadakis, A.; Souliotis, A.; Papaconsntantinou, E. Functionalization of electrodes with
polyoxometalates P2Mo18O626‐ and P2W18O62
6‐. J. Electroanal. Chem. (1997) 435, 17‐21.
7. Guo, W.; Xu, l.; Xu, B.; Wang, Y.; Sun, Z.; Liu, S. A modified composite film electrode of
polyoxometalate/carbon nanotubes and its electrocatalytic reduction. J. Appl. Electrochem.
(2009) 39, 647‐652.
8. Stimming, U.; Schultze, J.W. The Capacity of Passivated Iron Electrodes and the Band
Structure of the Passive Layer. Ber. Bunsenges Phys. Chem. (1976) 80, 1297‐1302.
9. Stimming, U.; Schultze, J.W. A semiconductor model of the passive layer on iron electrodes
and its application to electrochemical reactions. Electrochim. Acta (1979) 24, 859‐869.

148 Conclusions and future outlook
149
Some of the results obtained in this thesis have been published in the following reports:
1. Völker, E.; Williams, F.J.; Calvo, E.J.; Jacob, T.; Schiffrin, D.J. O2 induced Cu surface segregation in Au–Cu alloys studied by angle resolved XPS and DFT modelling. Phys. Chem. Chem. Phys. (2012) 14, 7448‐7455.
2. Völker, E.; Williams, F.J.; Calvo. E.J. Formation, characterization and electrocatalytic activity of layer‐by‐layer self‐assembled films containing polyoxomolybdate over Au surfaces. J. Electroanal. Chem. (2011) 673, 1‐7.
3. Völker, E.; Calvo, E.J.; Williams, F.J. Layer‐by‐Layer Self‐Assembled Redox on Passive Steel. Israel J. Chem. (2008) 48, 305‐312.


