
16
Electromagnetic Characterization of Composite Materials and
Microwave Absorbing Modeling
Davide Micheli1, Carmelo Apollo1, Roberto Pastore1, Ramon Bueno Morles1, Mario Marchetti1 and Gabriele Gradoni2
1“Sapienza” University of Rome, Astronautic, Electric and Energetic Engineering Department (DIAEE),
2University of Maryland, Institute for Research in Electronics and Applied Physics (IREAP), Paint Branch Drive, College Park, MD
1Italy 2USA
1. Introduction
This book chapter is based on the experimental activities conducted mainly at Sapienza University of Rome: Astronautic, Electric and Energetic Engineering Department in collaboration with University of Maryland, Institute for Research in Electronics and Applied Physics (IREAP). A branch of scientific research about composite materials is focused on electromagnetic characterization and subsequent application of electric conductive polymers. The use of such structures is relevant in aerospace/aeronautics, for electromagnetic (EM) protection from natural phenomena (lightning), and intentional interference with radar absorbing materials (RAM), in nuclear physics for shields adopted in particle accelerators, and for nuclear EM pulses (NEMP) protection, in electromagnetic compatibility (EMC) for equipment-level shielding, high-intensity radiated fields (HIRF) protection, anechoic chambers (for the realizations of wedges and pyramidal arrays), and human exposure mitigation. In this chapter, composite reinforced by carbon nanostructured materials are considered, mainly because of their interesting electromagnetic characteristics, such as high electrical conductivity and excellent microwave absorption. Composite materials as well their absorption capability are analyzed and numerical design of wide frequency band microwave absorbing structures is presented and discussed in details. It is crucial to highlight the need of interdisciplinary research fields to go through nanomaterials: besides nanotechnology, also electromagnetic wave propagation theory, composite materials manufacturing techniques, evolutionary computation algorithms, and use those to design the “quasi perfect absorber” are strongly required. In particular, we propose an inhomogeneous multilayer absorber made of micrometric graphite (at different wt%), and nanometric carbon particles (SWCNTs, MWCNTs, CNFs, at different wt%). At the end, an improvement of the traditional absorbers has been achieved upon optimization through an in-house winning particle optimization (WPO) algorithm, this last appositely conceived for absorbers optimization. Main goal of the presented work is to optimize the absorbers
www.intechopen.com

Advances in Nanocomposites - Synthesis, Characterization and Industrial Applications
360
achieving lower values (< -10 dB) of both reflection and transmission coefficients for angular apertures within 40° of the impinging plane wave (general far-field approximation of whatever active source). The developed evolutionary computation code is flexible in the selection of the algorithm parameters such as frequency band, incidence angular range, overall maximum multilayer thickness, composite material type of each layer, possibility to decide if the design optimization procedure must privilege thickness minimization and/or microwave absorption maximization during design. With respect to the present literature, the developed method considers the absorption capability taking into account both the reflection and the transmission properties of the entire multilayer structure. Moreover the absorption properties of the multilayer structures have been analyzed considering oblique incidence at fixed angles within a finite range. From the above explanation it is easy to understand the importance of numerical techniques such as evolutionary computation to design and optimize the absorber. Absorber mathematical model described in this chapter have been experimentally validated in laboratory (www.saslab.eu) located in DIAEE at Sapienza University of Rome. At the end of chapter the experimental validation is discussed.
2. Composite materials manufacturing and carbon filler analysis
This section focuses on characterization of nanomaterials adopted to build the electrically conductive composite materials and in nanostructured composite materials manufacturing. In formulating an electrically conductive composite material, a polymer is combined with highly conductive rigid particles. Electrical conductivity is accomplished though a certain level of particle-to-particle contact or close proximity. It is difficult to draw definite conclusions about electrical conductivity since it depends also from electromagnetic solicitation type, i.e., DC or AC current and type of electromagnetic wave propagation i.e., direct contacts electrodes or plane wave incidence on the composite material, [D.Micheli et al.,2010 ], [Xingcun Colin Tong, 2009 ], [Z. Ounaiesa et al., 2003 ]. Many further factors can affect the conductive properties of the filler loaded composite, including filler type, loading level, particle distributions, size, and shape, intrinsic conductivity of filler, process condition plating, and compounding. However, the key factors are particle conductivity, loading level and particle shape. The filler concentration -- i.e., the filler in weight % w.r.t. the polymer -- or the volume loading level of the filler is relevant in the percolation regime of the composite -- i.e., the threshold at which the composite changes form an insulator to a conductor. As the filler loading is increased further and reaches a critical point, the conductive particles
contact one another, and a continuous network is established. The sudden and precipitous
drop in resistivity is achieved through a generation of a continuous network, which is
defined as percolation threshold [Weber, M, & Kamal., 1997]. Once achieved the percolation,
a majority of the filler particles are in contact with at least two of their nearest neighbours,
thereby forming a continuous chain or network. An electrical charge could then be diffused
through the composite via this network without encountering the high-resistance polymer
resin. Additional filler loading beyond the percolation threshold does not substantially
reduce the resistivity of the composite [Sichel, 1982], the greater the aspect ratio of the
particles, the smaller the loading level needed to reach the percolation threshold [D.Micheli
et al.,2010 ]. In addition, the mixing process (dispersion) plays an important role in the
percolation and conductivity of the conductive composite material. For instance, increasing
www.intechopen.com

Electromagnetic Characterization of Composite Materials and Microwave Absorbing Modeling
361
the mixing time and hence the specific energy provided during the mixing process, the
homogeneity of the spatial distribution of the conductive particle in the matrix is improved
and the errors in composite material dielectric permittivity computation at microwave
frequencies are reduced. Composite materials considered in this work are based on epoxy
matrix reinforced with several species of carbon nanomaterials. These latter have been
chosen taking into account the lowest market prices: the economic aspects, normally
neglected in small laboratory applications, are on the contrary important in real applications
where the amount of carbon nanopowders fillers could be relatively high. In such scenario a
good compromise in terms of cost/performances has been obtained using industrial grade
multiwall carbon nanotubes (MWCNTs, about 300 $/kg), graphite micropowder (about 40
$/kg). Carbon nanofibers (CNFs, about 30 $/g) has been mainly considered only in the
carbon nanopowders analysis, while low cost MWCNTs and graphite micropowder have
been largely adopted in the large multilayer tile manufacturing.
2.1 Carbon filler characterization Carbon materials and epoxyresin considered in the experiments are:
• Micro Graphite (granular size < 20 μm), bought at SigmaAldrich;
• SWCNTs (Single Wall Carbon Nanotubes), bought at Carbolex (diameter around
1-2 nm, length 5-30 μm); http://www.nanotube-suppliers.com
• CNFs (Carbon NanoFibers), bought at SigmaAldrich (diameter around 75 nm, length
50-100 μm); http://www.sigmaaldrich.com/sigma-aldrich/home.html
• MWCNTs (Multi-Wall Carbon Nanotubes type NANOCYLTM NC7000), bought at
NANOCYL (diameter around 9.5 nm, length 1.5 μm, purity 90%)
http://www.nanocyl.com
• Epoxy-resin is: PrimeTM 20LV(density 1.123 g/cm3), Hardner(density 0.936 g/cm3);
http://www.gurit.com/
Carbon materials weight ratio (wt%) with respect to the polymer (epoxy-resin) are mainly in
the range 0.5-3 wt%. Scanning electron microscope (SEM) analysis has been widely adopted
in laboratory using VEGA TESCAN SEM model www.tescan.com. In particular, in Fig. 2.1.1,
a), b) pictures of functionalized SWCNTs are shown. Functionalization is used to purify
CNTs from impurities due to the manufacturing process of CNTs. This can be also carried
out through microwave heating, mainly performed by an electromagnetic cavity where the
field homogenization can be efficiently achieved [Prato et al., 2008]. In such a process, a
priori evaluation of power absorption plays a crucial role in prediction of impurity densities.
Comparing dimensions of SWCNTs and MWCNTs, it can be observed about 0.05 μm for
SWCNTs average diameters and about 2 μm for MWCNTs average diameters, i.e., such type
of MWCNTs are typically 40 times greater then SWCNTs. Also topologies of CNTs network
appear different: as a matter of fact MWCNTs are rope-like of bundled MWCNTs. Such
agglomerations (joint twisting and wrapping) of MWCNTs constitute a trouble in composite
materials manufacturing, because of intrinsic difficulties in dispersing CNTs within epoxy
resin matrix – i.e., overcoming physico-chemical bonds.
The individual particles in fact are held together by attraction forces of various physical and
chemical nature, including Van Der Waals forces and liquid surface tension. The attraction
forces must be overcome in order to deagglomerate and disperse the particles into liquid
www.intechopen.com

Advances in Nanocomposites - Synthesis, Characterization and Industrial Applications
362
media. Sonication is a process where ultrasounds are used to drastically reduce the size of
particle agglomerates melting against natural attraction forces. Ultrasonic cavitation
generates high shear forces that break particle agglomerates into single dispersed particles.
Fig. 2.1.1 a) SWCNTs zoom 5x (10μm scale), b) SWCNTs zoom 30x (2μm scale), c) MWCNTs zoom 5x (10μm scale), d) MWCNTs zoom 15x (2μm scale),
In order to easily compare dimensions of different carbon powders, we report a some picture showing the typical carbon fiber (CF) and carbon nanomaterials we used as SWCNTs MWCNTs and carbon nanofiber (CNFs). In polymerization process, epoxy-resin tend to spirally wrap CNTs, and if dense CNTs agglomeration takes place the polymerization process sometimes fails and localized parts of composite material could remain in a liquid status without completing the polymerization phase. Such structures are electromagnetically relevant themselves as they might exhibit planar chirality. This is why we tried to break up MWCNTs by means of sonication.
a)
b)
c)
d)
SWCNT
Bundle of MWCNTs
SWCNT
Bundle of MWCNTs
www.intechopen.com

Electromagnetic Characterization of Composite Materials and Microwave Absorbing Modeling
363
Fig. 2.1.2. a) Carbon Fiber (CF) zoom 20x (2μm scale), b) Carbon Nanofiber (CNFs) zoom
20x (2μm scale), c) Multi Wall Carbon Nanotube (MWCNTs) zoom 20x (2μm scale), d) Single Wall Carbon Nanotube (SWCNTs) zoom 20x (2μm scale).
2.2 Nanostructured composite material manufactoring Manufacturing of carbon based nanostrucutred composite materials is achieved through the following steps:
• Eventual carbon powders functionalization. • Mixing, sonication and degassing of epoxy-resin and carbon nanopowders mixed
dispersed with desired weigh percentage; • Hardener adding, if required by the epoxy-resin; • Composite curing by oven treatment. First step is crucial in preparation of homogeneous composite materials. In Fig. 2.2.1,
pictures of composite materials preparation are shown. Composite pictures before and a
after sonication phase are shown.
a)
b)
c)
d)
www.intechopen.com

Advances in Nanocomposites - Synthesis, Characterization and Industrial Applications
364
Fig. 2.2.1. a) Ingredients: Epoxyresin and MWCNTs, b) MWCNTs 3%wt and epoxy-resin manually mixed before sonication, c) Sonication process, d) MWCNTs 3%wt and epoxy-resin mixture after sonication.
Observing picture of same composite material before and after sonication phase,
immediately appear the difference in the dispersion of MWCNTs.
Nanostructured composite material manufacturing process end up with the injection of
described treated liquid mixture in the appropriate sample holder and curing with the
appropriate oven treatment. In Fig. 2.2.2., sample holder and oven are shown. In our case,
curing process requires about sixteen hours at temperature of 50 C°.
3. Nanostructured composite materials permittivity and microwave absorption characterization
3.1 Microwave measurements In this section measurement of permittivity of nanostructured composite materials are
shown. The microwave characterization process has been carried out by performing
scattering parameter measurements and extracting the complex electrical permittivity
through canonical algorithms. In particular, we performed the permittivity retrieval by
using different algorithms and comparing produced results. The algorithms adopted are
Nicholson-Ross, NIST iterative, and non-iterative [L. F.Chen & C. K. Ong, 2004], [Abdel-
Hakim & Boughriet, 1997], [James Baker-Jarvis, 1990]. The so obtained results can be
a)
b)
Sonicator
Mixture sonication
Mix after sonication
c)
Mix of MWCNT 3%wt and Epoxyresin before sonication
d)
MWCNTs
Epoxyresin
www.intechopen.com

Electromagnetic Characterization of Composite Materials and Microwave Absorbing Modeling
365
Fig. 2.2.2. a) Injection of liquid composite materials into sample-holder; b) Oven treatment: 16 hours and 50 C°; c,d) Final sample within sample holders for wave guide measurement of electromagnetic properties of composite materials in the band 4-18 GHz ; e,f) 200x200 mm tiles of composite materials for free space electromagnetic absorbing measurements.
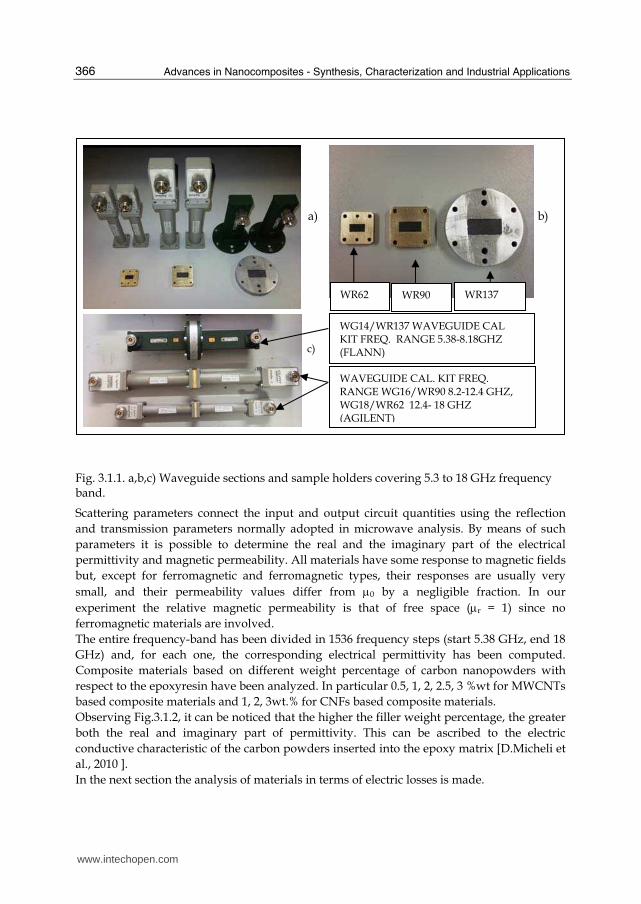
considered accurate within the limit of the employed numerical methods. Microwave
scattering parameters Sij, with i,j = 1,2, [Davide M. Pozar, 2005], are measured using a Vector
Network Analyzer (N5230C Agilent PNA-L) in the waveguide method shown in Fig.3.1.1.
Wave guide calibration kit are in the J-band (5.38-8.18 GHz)), X-band (8.2-12.4 GHz), P-band
(12.4-18 GHz). Sample holders, hosting the materials under test (MUT), were built using as a
shape model the thru connections of Flann and Agilent calibration kits (www.flann.com,
www.agilent.com).
a)
b)
6-8 GHz Final sample
Oven
c)
e)
6-8 GHz sample
8-12 GHz sample
4-6 GHz sample
12-18 GHz
Composite material curing
Final sample
Final samples for EM free space
Multilayer sample: EM free space
d)
f)
Sample holder
Composite material injection into sample holder before curing step
www.intechopen.com
Advances in Nanocomposites - Synthesis, Characterization and Industrial Applications
366
Fig. 3.1.1. a,b,c) Waveguide sections and sample holders covering 5.3 to 18 GHz frequency band.
Scattering parameters connect the input and output circuit quantities using the reflection
and transmission parameters normally adopted in microwave analysis. By means of such
parameters it is possible to determine the real and the imaginary part of the electrical
permittivity and magnetic permeability. All materials have some response to magnetic fields
but, except for ferromagnetic and ferromagnetic types, their responses are usually very
small, and their permeability values differ from μ0 by a negligible fraction. In our
experiment the relative magnetic permeability is that of free space (μr = 1) since no
ferromagnetic materials are involved.
The entire frequency-band has been divided in 1536 frequency steps (start 5.38 GHz, end 18
GHz) and, for each one, the corresponding electrical permittivity has been computed.
Composite materials based on different weight percentage of carbon nanopowders with
respect to the epoxyresin have been analyzed. In particular 0.5, 1, 2, 2.5, 3 %wt for MWCNTs
based composite materials and 1, 2, 3wt.% for CNFs based composite materials.
Observing Fig.3.1.2, it can be noticed that the higher the filler weight percentage, the greater
both the real and imaginary part of permittivity. This can be ascribed to the electric
conductive characteristic of the carbon powders inserted into the epoxy matrix [D.Micheli et
al., 2010 ].
In the next section the analysis of materials in terms of electric losses is made.
a)
c)
WG14/WR137 WAVEGUIDE CAL KIT FREQ. RANGE 5.38-8.18GHZ (FLANN)
WAVEGUIDE CAL. KIT FREQ. RANGE WG16/WR90 8.2-12.4 GHZ, WG18/WR62 12.4- 18 GHZ (AGILENT)
WR62 WR90 WR137
b)
www.intechopen.com

Electromagnetic Characterization of Composite Materials and Microwave Absorbing Modeling
367
Fig. 3.1.2. a) Real component; b) Imaginary component of permittivity of nanostructured composite materials based on MWCNTs; c) Real component; b) Imaginary component of permittivity of nanostructured composite materials based on CNFs in the 5.3 to 18 GHz frequency band.
3.2 Microwave electric conductivity Microwave electrical conductivity of a dielectric material can be evaluated by using the following equation:
( ) εεπσεπσ
ωεσε ′′=⇒==′′ 0
00
2)/ 2
fmSf
r (3.2.1)
Where σ is the electric conductivity (S/m), ε0 is the free space permittivity (8.854 × 1E-12
F/m), f is the frequency (Hz), ε” is the imaginary component of permittivity.
In Fig. 3.2.1, electric conductivity of nanostructured composite materials is reported as
function of frequency.
In general, the electric conductivity of nanopowder reinforced composite materials is mainly due to a couple of effects: the first is the high number of inter-nanostructure connections which plays a role in ohmic resistivity reduction, the second is explainable by thinking to the reinforced matrix as a nanocapacitance network, where a single capacitor is constituted
6 8 10 12 14 16 182
4
6
8
10
12
14
16
18
20
Frequency (GHz)
Re
al co
mp
on
en
t o
f P
erm
ittivity
Resin
Epoxy
MWCNTs
0.5%
MWCNTs
1%
MWCNTs
2%
MWCNTs
2.5%
MWCNTs
3%
6 8 10 12 14 16 180
5
10
15
Frequency (GHz)
Ima
g c
om
po
ne
nt
of
Pe
rmittivity
Resin
Epoxy
MWCNTs
0.5%
MWCNTs
1%
MWCNTs
2%
MWCNTs
2.5%
MWCNTs
3%
a)
b)
6 8 10 12 14 16 182
4
6
8
10
12
14
16
Frequency (GHz)
Re
al co
mp
on
en
t o
f P
erm
ittivity
Resin
Epoxy
CNFs
1%
CNFs
2%
CNFs
3%
6 8 10 12 14 16 180
1
2
3
4
5
6
Frequency (GHz)
Ima
g C
om
po
ne
nt
of
Pe
rmittivity
Resin
Epoxy
CNFs
1%
CNFs
2%
CNFs
3%
c)
d)
www.intechopen.com

Advances in Nanocomposites - Synthesis, Characterization and Industrial Applications
368
by two faced nanoparticles. The former effect is trivially related to the concentration, and becomes dominant above the percolation threshold, when many conduction pathways cross the matrix thus forming electrical connections. The latter is to be ascribed to the very large nanoparticles specific surface area (A) compared to micro-sized powder: the resulting effective capacitance (C) lowers the composite characteristic impedance, as clear from the fundamental capacitance impedance equation,
Cj
Zc ω1= (3.2.2)
(where C ∝ A).
Fig. 3.2.2. a) Electric Conductivity (S/m) of MWCNTs based composite materials; b) Electric Conductivity (S/m) of CNFs based composite materials.
3.3 Microwave absorption properties related to impedance matching conditions From permittivity results, the intrinsic wave impedances of the k-th material can be computed using the following equation.
rkrk
rk
rk
rkk jεε
μεμ
εμ
εμη ′′−′==
0
0
0
0 (3.3.1)
Where μrk is the relative permeability of the composite (equal to 1), εrk is the relative permittivity of the composite which is function of the frequency. Intrinsic wave impedance is a complex number and magnitudes are reported in Fig. 3.3.1. Observing the intrinsic wave impedance plot, it is possible to note that the higher the weight concentration of carbon nanopowders, the lower the intrinsic wave impedance of composite material. As shown in [D.Micheli et al.,2010], the wave impedance plays an important role in microwave reflection and absorption properties of materials in free space propagation condition, in the next section absorbing effectiveness of materials is described. There are three conditions that can minimize the EMI reflection from a surface. When an electromagnetic wave, propagating through a free space with impedance of Z0, happens upon a semi-infinite dielectric material boundary of impedance Zi, a partial reflection
a)
6 8 10 12 14 16 180
2
4
6
8
10
12
14
Frequency (GHz)
Ele
ctr
ic C
on
du
ctivity (
S/m
)
Resin
Epoxy
MWCNTs
0.5%
MWCNTs
1%
MWCNTs
2%
MWCNTs
2.5%
MWCNTs
3%
6 8 10 12 14 16 180
1
2
3
4
5
6
Frequency (GHz)
Ele
ctr
ic C
on
du
ctivity (
S/m
)
Resin
Epoxy
CNFs
1%
CNFs
2%
CNFs
3%
b)
www.intechopen.com

Electromagnetic Characterization of Composite Materials and Microwave Absorbing Modeling
369
Fig. 3.3.1. a) Intrinsic wave impedance of nanostructured composite materials based on MWCNTs in the 5.3 to 18 GHz frequency band; b) Intrinsic wave impedance of nanostructured composite materials based on CNFs in the 5.3 to 18 GHz frequency band
occurs. The reflection coefficient (dB), at the interface can be expressed using formalism of transmission lines [S. Ramo, J. Whinnery & T. Van Duzer, 1994]:
( ) ( )0
01020
ZZ
ZZLogfRC
i
i +−= (3.3.2)
Where: RC = Reflection Coefficient (dB);
Z0 ∼ 377 (Ω) is the free space impedance; Zi=Input impedance at the Air-Absorber interface; f = frequency (Hz).
The reflection coefficient falls to -∞ when Zi=Z0 , or, in other words, the composite material layer is impedance matched to the incident medium. Therefore, the absorbing material must be lossy (second condition), so that the EMI energy can be dissipated within the material and impedance matched (first condition), so that the electromagnetic wave is not reflected back. But in order to get a large amount of attenuation, values of permeability and/or permittivity should be large; this condition could imply low values of intrinsic impedance and as a consequence large values of RC(dB). As a consequence design of an absorber is a compromise between the front-face reflection coefficient and the loss per unit thickness. One method to search for the best compromise within the largest frequency band is the multilayer structure. Here the optimization of material of each layer and its related thickness play an important role in absorption maximization. Some of these structures are characterized by a surface impedance Zi, close as possible to
free-space impedance (~377Ω), and then changing their intrinsic impedance inside by gradually increasing their conductivity to keep the reflection coefficient at the boundary of each layer as low as possible, and allow the materials to convert the EMI energy into Joule heating for dissipating. There are a variety of absorbers but they can be classified into two basic types of structures and materials: resonant or graded dielectric or both of them.
a)
6 8 10 12 14 16 1860
80
100
120
140
160
180
200
220
240
Frequency (GHz)
Module
of in
trin
sic
wa
ve im
pedan
ce
Resin
Epoxy
MWCNTs
0.5%
MWCNTs
1%
MWCNTs
2%
MWCNTs
2.5%
MWCNTs
3%
6 8 10 12 14 16 18
80
100
120
140
160
180
200
220
Frequency (GHz)
Mo
dule
of
intr
insic
wa
ve im
pe
dan
ce
Resin
Epoxy
CNFs
1%
CNFs
2%
CNFs
3%
b)
www.intechopen.com

Advances in Nanocomposites - Synthesis, Characterization and Industrial Applications
370
In the next section a new search algorithms and absorbers design method are deeply analyzed. The third condition to obtain an absorber can be easily understood rewriting equation of reflection coefficient:
( ) ( )⎟⎟⎠⎞⎜⎜⎝
⎛ +⎟⎟⎠⎞⎜⎜⎝
⎛ −=+
−=1
1
2020
0
010
0
010
Z
Z
Z
Z
LogZZ
ZZLogfRC
i
i
i
i (3.3.3)
−∞→⇒===⇒= )(1
0
0
0
0
0
dBRCZ
Zif
rk
rkrk
rk
irkrk ε
μεμ
εμ
εμ
εμ (3.3.4)
In other words when relative permittivity is close to relative permeability values then, the
material intrinsic impedance become close to free space impedance (377 Ω) and reflection of electromagnetic wave become very low.
4. Numerical design and optimization of microwave absorber
4.1 Introduction This Section describes the approach adopted to design and optimize the microwave absorber multilayer structure. First the design and optimization problem are introduced and the electromagnetic model of absorber is described, then, winning particle optimization (WPO) method, are analyzed and applied for the numerical design of the microwave absorber. Two kind of structures are designed, one explicitly required in microwave absorbing materials (MAM), the other in microwave shielding structures (MSS). The first commonly called radar absorbing materials (RAM) are mostly known for their applications in stealth fighters and anechoic chambers; the second is developed for enhanced shielding applications where requirements are simultaneously both: microwave shielding and microwave absorbing capability of materials. Electromagnetic Interference (EMI), defined by NATO as an electromagnetic disturbance which interrupts, obstructs, or otherwise degrades the effective performance of electronic or electrical equipment. In aircraft, EMI can affect everything from fly-by-wire flight control systems to a cockpit fuel gauge and in extreme cases put a plane into an uncommanded dive or shut down a critical avionic system. Naturally occurring radio noise originating from atmospheric disturbances (including lightning) and extraterrestrial sources (such as sunspots) can also degrade the performance of electronic equipment. Communications signals may also interfere with the operation of sensitive electronic equipment. The most common type of EMI occurs in the radio frequency (RF) range of the electromagnetic (EM) spectrum, from 104 to 1012 Hertz. This energy can be radiated by computer circuits, radio transmitters, fluorescent lamps, electric motors, overhead power lines, lightning, and many other sources, and device failures caused by interference—or "noise"—from electromagnetic energy are increasing due to the growing number of products that contain sensitive electronic components. This is why we are
www.intechopen.com

Electromagnetic Characterization of Composite Materials and Microwave Absorbing Modeling
371
studying structures which simultaneously are able of absorbing and shielding from microwave point of view.
4.2 Electromagnetic model of multilayer absorber In RAM applications, reflection coefficient (RC) at the first air-multilayer interface can been
used as the main objective function (OF) parameter which need to be reduced using
numerical optimization techniques, whereas in shielding ones the most stringent
requirement considered is the transmission coefficient (TC) lowering. The multilayer
absorption is a key feature in shielding applications too, because of evident protection
constraints, so it has been quantified through the so-called ‘loss factor’ (LF%), defined as
[D.Micheli et, al,. 2009], and [D.M.Pozar, 2005]:
( ) 1001%22 ⋅−−= TCRCLF (4.2.1)
Where: RC is the Reflection Coefficient expressed in the linear form. TC is the Transmission Coefficient expressed in the linear form. Its physical meaning is related to the fraction of the incident power vanishing inside the
materials due to localization and dissipation phenomena. Since the calculation of RC and TC
becomes a crucial point for the optimization goal, a rigorous approach to relate transmitted
and reflected waves to the incident one inside each layer has been adopted. In particular,
such theoretical model relies on the forward/backward propagation matrix formalism
introduced in chapter one, accounting for each single interface effect on the local field
crossing. Both normal and oblique incidences have been evaluated during the automatic
optimization. Numerical optimization require the definition of some boundary conditions
for the dimensions of the multilayer structure adopted as absorber model [D.Micheli et, al,.
2010]. For all absorber presented in this book the thickness of each layer can range from 0 up
to 3 mm. Number of layers of absorber is upper-limited to maximum ten layers. The
effective number of layers is established each time by the numerical optimization procedure
which is able to remove one or more layers of the multilayer structure. Multilayer
configuration structures are depicted in Fig. 4.2.1.
It could be noticed that last layer could be air (i.e. free space in this context), or a perfect
electric conductor (PEC) as a function of the absorber we are interested to optimize. Usually
in typically RAM application PEC is applied since is assumed that such absorber need to be
applied like a coating on an existing metal based structure like an airplane or a boat. On the
contrary, in shielding application air is usually assumed as the surrounding medium for the
absorber.
The design algorithm needs to be capable not only to choose the number of layers and their
thickness but the material type too. In other words in the multilayer structure, layers order
is not a priori fixed but numerical techniques decides completely all layers parameters, from
layers number and layer thicknesses up to best composite material which must be adopted
for each layer of the multilayer structure. Without lack of generality, the case of normal
incidence is here reported, even though the current implemented formulation takes account
of both TM/TE modes. For an arbitrary layer u of the configuration depicted in Fig.4.2.1 it is
possible to write [D.Micheli et, al,. 2010],
www.intechopen.com

Advances in Nanocomposites - Synthesis, Characterization and Industrial Applications
372
Fig. 4.2.1. General Multilayer scheme.
( )
( ) ( )
11
1 1
1 1
1 11 1
uu zuz u uz u u u
u uu z u zuz u uz u
j zj z j z j zu u u u
j z j zj z j zu uu u u u
u u
E e E e E e E e
E e E e E e E e
κκ κ κ
κ κκ κη ηη η
−−
− −
− −+ − + −− −−−+ − + −+ + − −
+ = +− = − (4.2.1)
now, summing and subtracting each member of Eq. (4.2.1), it is straightforward to obtain
( )
( ) uzuuuzuuz
uzuuuzuuz
zju
zju
u
uzju
u
u
zju
zju
u
uzju
u
u
eEeEeE
eEeEeE
1
1
111
111
211
211
−
−
−−−−−+−
−+−−−−+−
=⎟⎟⎠⎞⎜⎜⎝
⎛ ++⎟⎟⎠⎞⎜⎜⎝
⎛ −=⎟⎟⎠
⎞⎜⎜⎝⎛ −+⎟⎟⎠
⎞⎜⎜⎝⎛ +
κκκ
κκκ
ηη
ηη
ηη
ηη
(4.2.2)
In order to establish a clear relationship between fields in u-th and (u-1)-th layers, upon
multiplication of )( 11 uuu zzje −− −−κ by the first of (4.2.1), and by the second of (4.2.1), we obtain
( ) ( ) ( ) ( )
( ) 11
1111
1
11 12
11
2
1
−−
−−−−
−+−
−−+−−−−−+−
==⎟⎟⎠
⎞⎜⎜⎝⎛ −+⎟⎟⎠
⎞⎜⎜⎝⎛ +
uzu
uuzuuuzuuzuuuz
zjku
zzjkzjku
u
uzzjkzjku
u
u
eE
eeEeeE ηη
ηη
(4.2.3)
( ) ( ) ( ) ( )
( ) 11
1111
1
11 12
11
2
1
−−
−−−−
+−−
−++−−−+−+−
==⎟⎟⎠
⎞⎜⎜⎝⎛ ++⎟⎟⎠
⎞⎜⎜⎝⎛ −
uzu
uuzuuuuuzuuu
zjku
zzjkzjku
u
uzzjkzjku
u
u
eE
eeEeeE ηη
ηη
(4.2.4)
Then, considering field and propagator products with common subscripts and taking advantage of the matrix formalism, one gets
εu μu
εu-1
μu-1
εu+1 μu+1
Incident
EM
Field
Air
1 u+1 u u-1 0
Air or
PEC
θu+1
θu
θu-1
Tu Tu-1
Ziu Ziu-1
ηu ηu-1
z
x ε1
μ1
η1
T1
z=0
www.intechopen.com

Electromagnetic Characterization of Composite Materials and Microwave Absorbing Modeling
373
( )( ) ( ) ⎥⎥⎦
⎤⎢⎢⎣⎡⋅=⎥⎥⎦
⎤⎢⎢⎣⎡
+−−+
−+−−−+−
−−−−
uuz
uuz
uzu
uzu
zjku
zjku
uuzjku
zjku
eE
eEV
eE
eE,1
1
111
11
(4.2.5)
Where: ( )1
1
1
1
,1
1
1
−−
−
−− +
−=⎟⎟⎠⎞⎜⎜⎝
⎛ +⎟⎟⎠⎞⎜⎜⎝
⎛ −=
uu
uu
u
u
u
u
uuR ηηηη
ηηη
η (4.2.6)
And:
( )( ) ( ) ( ) ( ) ( )
( ) ( ) ( ) ( ) ( )( ) ( ) ( ) ( ) ( )
( ) ( ) ( ) ( ) ( ) ⎥⎥⎦⎤
⎢⎢⎣⎡=
=⎥⎥⎦⎤
⎢⎢⎣⎡
⎟⎟⎠⎞⎜⎜⎝
⎛ +=
−+−+−
−−−−−−
−+−+−
−−−−−−−
−−−−−−−−
−−−−−−−−
uuzuuuzu
uuzuuuzu
uuzuuuzu
uuzuuuzu
zzjkzzjkuu
zzjkuu
zzjk
u
zzjkzzjkuu
zzjkuu
zzjk
u
uuu
eeR
eReT
eeR
eReV
1111
1111
1111
1111
,1
,11
,1
,11,1 1
2
1
ηη
(4.2.7)
In (4.2.5) the ‘local’ transmission coefficient takes the usual form
1
2
−+=uu
uuT ηη
η (4.2.8)
as well as the ‘local’ reflection coefficient:
uu
uuuR ηη
ηη+−=
−−−
1
11 (4.2.9)
Both the expressions involve the intrinsic layer impedancesη . Each matrix element of (4.2.5) models the (u-1)-th layer crossing through the phase shift
( ) ( ) ( ) 11111 −−−−− =−= uzuuuzuu dkzzkδ (4.2.10)
Where k(u-1)z and du-1 are the layer wavenumber along z-axes and layer thickness respectively. Following the above formalism, the overall multilayer reflection and transmission can be calculated through the simple matrix product:
nnn VVVV ,12,11,0,0 −⋅= AA (4.2.11)
Each matrix represents a material interface. In particular 1,0V is referred to last interface
while 1,n nV − is referred to the initial free-space and layer material interface met by the
propagating electromagnetic wave. Referring to (4.2.1), it is worth noticing that the number of material strata is exactly (n+1) - i.e., the number of interfaces plus one required to take into account the interface between last layer of the multilayer and the surrounding theoretically infinite medium (free space or PEC). Now let us to consider the interface separating the last two regions n and n-1, in case of right-hand unbounded medium (often called as the multilayer coating) where the last-th layer is air we get for the last interface:
www.intechopen.com
Advances in Nanocomposites - Synthesis, Characterization and Industrial Applications
374
⎥⎥⎦⎤
⎢⎢⎣⎡⋅⎥⎦
⎤⎢⎣⎡⋅⎟⎟⎠
⎞⎜⎜⎝⎛ +=⎥⎥⎦
⎤⎢⎢⎣⎡
−−−−
+−−−+−
−−
−+−−+
11
11
11
1
1,
1,
1 1
11
2
1nn
nn
nt
nt
zjkn
zjkn
nn
nn
n
nzjk
n
zjkn
eE
eE
R
R
eE
eE
ηη
(4.2.12)
Where:
, 1
, 1, 11
, 111
, 1
111,0 0
1
111
12
1
1
since in our scenario 1 and 1 0 we have:
1
1
n nnn n
n nn
n n
nn n
RV
R
RT
R
n n -
RV T
R
ηη −
− −−−−− −
−
⎛ ⎞ ⎡ ⎤= + ⋅ =⎜ ⎟ ⎢ ⎥⎜ ⎟ ⎣ ⎦⎝ ⎠⎡ ⎤= ⎢ ⎥⎣ ⎦
⇓= =
⎡ ⎤= ⎢ ⎥⎣ ⎦
(4.2.13)
Which gains symmetry and anti-symmetry properties, whereas in the case of a perfect electrical conductor (PEC) backed absorber, we find the unitary matrix:
⎥⎦⎤⎢⎣
⎡=11
110,1V (4.2.14)
Such a simplified forms is not retrievable from (4.2.7) directly, hence the application of
boundary conditions is further required in deriving it. Once calculated the general matrix of
(4.2.11) one can relate the fields impinging from unbounded left-hand medium to the field
outgoing from the last interface. In case of unbounded right-hand medium, we obtain
⎟⎟⎠⎞
⎜⎜⎝⎛⋅=⎟⎟⎠
⎞⎜⎜⎝⎛
−++0
00,
0 E
EV
En
n i.e., ⎟⎟⎠⎞
⎜⎜⎝⎛⋅⎥⎥⎦
⎤⎢⎢⎣⎡=⎟⎟⎠
⎞⎜⎜⎝⎛
−++0
02,20,
1,20,
2,10,
1,10,
0 E
E
VV
VVE
nn
nnn (4.2.15)
Whereas in case of PEC medium, Eq. (4.2.15) turns into
⎟⎟⎠⎞
⎜⎜⎝⎛⋅⎥⎥⎦
⎤⎢⎢⎣⎡=⎟⎟⎠
⎞⎜⎜⎝⎛
−+0
02,20,
1,20,
2,10,
1,10,
0
0
E
E
VV
VV
nn
nn (4.2.16)
Drawing on representation of (4.2.22) or (4.2.23) it’s straightforward to find a formal
expression of reflection coefficient Γ at the first interface and of transmission coefficient T.
They are defined as
2,20,
1,20,
0
0
n
n
V
V
E
E −==Γ +−
(4.2.17)
⎟⎟⎠⎞
⎜⎜⎝⎛ −== −
+2,20,
1,20,2,1
0,1,10,
0
0
0
n
nnn
n
n
n V
VVV
E
ET η
ηηη
(4.2.18)
www.intechopen.com

Electromagnetic Characterization of Composite Materials and Microwave Absorbing Modeling
375
As will be discuss later on the chapter, the employed algorithm can operate in different optimization-oriented modalities. The one toward the minimization of material thickness needs for the possibility of removing layers from the maximum allowed set. This means that, in bringing optimization, a layer could not be necessary anymore - i.e. no longer physically present - even though related interface matrixes are still required for product completion of (4.2.90). This is easy to figure out in automatic computation contexts: in other words, when an arbitrary layer is removed the u-th thickness du =zu-1-zu=0 tends to zero and Eq.(4.2.7) turns into the identity matrix:
( )( ) ( ) ( ) ( ) ( )
( ) ( ) ( ) ( ) ( )
( ) ( ) ( ) ( ) ( )( ) ( ) ( ) ( ) ( ) ⎥⎦
⎤⎢⎣⎡=⎥⎥⎦
⎤⎢⎢⎣⎡⋅=
=⎥⎥⎦⎤
⎢⎢⎣⎡
+=
−−−−
−−−−−−−−
++−
−−−
−+−+−
−−−−−
−−
10
011
21
00,1
0,1
0
,1
,1
1
,1
11
11
1111
1111
zuzu
zuzu
uuzuuuzu
uuzuuuzu
jkjkuu
jkuu
jk
zzjkzzjkuu
zzjkuu
zzjk
uu
uuu
eeR
eRe
eeR
eReV
ηηη
(4.2.19)
In such case we take ηu-1= ηu and nu-1= nu as a consequence and hence does not affect
the crossing field. So, provided this rule is properly applied, matrix of Eq.(4.2.15) Eq.(4.2.15)
are the only required for the implementation. One further critical occurrence to be taken into
account is that of the last layer removal. If this happens, the last matrix form of (4.2.15) must
shift backward to the previous interface of Eq.(4.2.11) and 21, Ι=−nnV ; this procedure must
be iterated when multiple layers close to the last interface are removed. Such type of check
can be executed from the right to the left or vice versa as a function of the initial layer
thickness checked at the start of the procedure. Oblique incidence can be easily accounted
for upon insertion of TE and TM impedance form in Eq.(4.2.7).
5. Search algorithm adopted to design multilayer absorber
The most popular evolutionary algorithm is Genetic Algorithm (GA). GA attempts to
simulate the phenomenon of natural evolution. In natural evolution, each species searches
for beneficial adaptations in an ever-changing environment.
As species evolve, the new attributes are encoded in the chromosomes of individual
members. This information does change by random mutation, but the real driving force
behind the evolutionary development is the combination and exchange of chromosomal
material during breeding [ Mitsuo Gen, Runwei Cheng, 1999]. In this book an optimization
algorithm called winning particle optimization (WPO) is proposed [D.Micheli et, al,. 2010].
5.1 Winning particle optimization algorithm Winning particle optimization (WPO), is a very simple algorithm, where at each time epoch
of evolution, particle which best fit the objective function (OF), is deputed to pilot the
trajectory of the remaining nonintelligent particles within the multidimensional space of
solutions. In WPO, particles trajectories are simply defined by jumping of particles.
Jumping is defined as coordinates sum or difference with respect to the current best fitting
particle. The best particle represents the best position which defines the remaining particles
search space and as a consequence, differently from the other particles, the best fitting
www.intechopen.com

Advances in Nanocomposites - Synthesis, Characterization and Industrial Applications
376
particle is not subject to any displacement action within the iteration cycle. It must remain in
a fixed position while the other particles jump around it, searching for a new potential best
position in the space of solutions. At each WPO iteration, a new portion of the search space is
explored and the same or most probably a new potential better fitting location for each particle
is always found. In Fig. 5.1.1, WPO flow chart related to (5.1.1) is shown. At the beginning of
the algorithm, particles are randomly distributed within the n-dimensional search space. After
that at the first step of the WPO algorithm, evaluation of objective function (OF) for all the
particles are computed. In the next step, particles are compared to each other using value of
their objective function and the best fitting particle is marked with its proper index position.
Each particle position is completely defined by its coordinates and their number represents the
dimensionality of the space where particles jump in search of the optimal final solution.
Trajectory of each particle, except that of the best fitting particle, is defined in the following
way: if m-th-coordinate position of a certain particle Pk is lesser then the corresponding m-th-
coordinate position of the current best particle PBq, then the new m-th-coordinate position will
result from the sum of particle and best particle m-th-coordinates; while if m-th-coordinate
position of a certain particle Pk is greater then the corresponding m-th-coordinate position of
the current best particle PBq, then the new m-th-coordinate position will result from the
difference of best particle and particle m-th-coordinates;. Calling q the index of the best particle
found at each iteration cycle, the condition which needs to be satisfied is q≠k. Two different
evolutions expressed by the Eq.(5.1.1) and (5.1.2), are possible, they define particles positions at
i+1-th-iteration as a function of particles position at previous i-th-iteration. In the rest of work,
method related to Eq.(5.1.2) has been applied.
( ) ( ) ( ).1 iPRgiPBiP kmmm
qm
km ⋅⋅⋅+=+ δ (5.1.1)
( ) ( ) ( )iPBgiPRiP qm
kmm
km ⋅+⋅⋅=+ δ1 (5.1.2)
( ) ( )( ) ( )
eParameterConvergenc
1]-[0 interval thein number random
Dimensions Space
to 1
and Number Particle to 1
Number Particle to 1
if 1
if 1
where
==
==
≠==
>−=<+=
δ m
km
km
km
km
R
n
nm
qkq
k
iPBiPg
iPBiPg
R is a random number in the closed range 0-1, which in random way adjust the amount of
jumps for each single coordinate particle dimension. Such randomization helps the search
phase of optimal solution. Convergence parameter δ is defined later; it helps the final
convergence of the WPO algorithm. Even thought mutation operation has not been applied
on the subsequent reported optimization it has to be noticed that mutation has been
included in WPO algorithm. At the end of the WPO diagram, a boundary conditions check
www.intechopen.com
Electromagnetic Characterization of Composite Materials and Microwave Absorbing Modeling
377
for the new particles coordinates set is required in order to avoid to overcome the admitted
constraints. The entire loop cycle can be iterated several times in order to get the required
OF minimization.
When out of boundary conditions are verified for the m-th-particles coordinates, then, it
could happen that some particles are forced to go toward the limit of search space.
During the evolution boundary conditions checking procedure is done and variables are set
to max or min value of admitted range if the current value are respectively above or lower
these limits. The WPO idea based on a quasi-random particles jumps system, assuring an
effective method for solutions space exploration. In order to ease the WPO convergence, a
mechanism which provide a progressive reduction of the maximum amplitude of jumps has
been introduced and is identified by the triplet δ,P,σ parameters.
Calling IN the number of WPO iterations and supposing i the current i-th iteration, then the
value of δ is given by the following equation:
.1
1P
IN
i ⎟⎠⎞⎜⎝
⎛+−= σδ (5.1.3)
In (5.1.3), the meaning of σ,P parameters stays in fast or slow convergence of the WPO
algorithm. In particular the higher the σ, the greater the initial jumps amplitude and the
greater the distances where particles start to explore the search space. As far as P is
concerned the higher its value, the faster the convergence to a suboptimal solution i.e., local
minimum or maximum. The higher the current iteration number, the lower the δ parameter
value. Parameter δ is by the position of the current particle, as in (5.1.1) and (5.1.2). Example
related to (5.1.1) is::
δδ ⋅⋅−=⋅⋅+= kmm
qm
km
kmm
qm
km PRBPPPRBPP .
In Fig. 5.1.2, sequence of pictures shows the convergence of WPO algorithm for some
canonical test functions [Franciszek Seredynski1, Albert Y. Zomaya, and Pascal Bouvry]:
Sphere, Rastrigin, Griewank, Rosembrok, Akley, is shown. Parameter, is decreased with
the iterations IN using P = σ = 1. Two different scenarios are compared, the first referring
to Iteration Number (IN) = 500, Dimensions of Space Solution (DIM)=20, Number of
exploring agents (Num Agents)=20; while the second referring to Iteration
Number(IN)=500, Dimensions of Space Solution (DIM)=60, Number of exploring agents
(Num Agents)=100.
In order to evaluate the robustness of WPO algorithm, for each test function, the algorithm
as been tested repetitively for twenty times.
In Table. 5.1.1. and 5.1..2, the mean and standard deviation values are shown for two
different scenario, the first referring to Iteration Number (IN)=500, Dimensions of Space
Solution (DIM)=20, Number of exploring agents (Num Agents)=20; while the second
referring to Iteration Number (IN)=500, Dimensions of Space Solution (DIM)=60, Number of
exploring agents (Num Agents)=100.
It can be noticed that convergence difficulties increases for Rastrigin and Rosembrok test
functions when the dimension of solution space changes from 20 to 60.
www.intechopen.com

Advances in Nanocomposites - Synthesis, Characterization and Industrial Applications
378
Fig. 5.1.1. WPO flow chart
Start WPO Algorithm
Particles Pi fitness evaluation
Mark the best particle (BPq) with index-q ranging from 1 to max particles number (PN)
Extraction of all m-th coordinates of each particles in the n-dimensional space
qm
km BPP <
[ ]nmkq ,1, ∈≠
kmm
qm
km PRBPP ⋅⋅+= δ
yesno
Mutation procedure for some randomly selected position coordinates m of particles
qm
km BPP ≠
Check of boundary conditions minBC and maxBC for
each m-th particle coordinate
WPO Optimization is ok ? yesno
Initial random particles generation
End WPO
kmm
qm
km PRBPP ⋅⋅−= δ
www.intechopen.com

Electromagnetic Characterization of Composite Materials and Microwave Absorbing Modeling
379
Fig. 5.2.2. a),b),c),d),e) Typical Objective Function minimization with: IN=500, DIM=20, AGENT=20 and f),g),h),i),l) Typical Objective Function minimization with: IN=500, DIM=60, AGENT=100.
0 100 200 300 400 5000
0.5
1
1.5
2x 10
8
IterationsRosenbro
ck O
bje
ctive F
unction
0 100 200 300 400 5000
500
1000
1500
Iterations
Griew
ank O
bje
ctive F
unction
0 100 200 300 400 5000
200
400
600
800
1000
Iterations
Rastrig
in O
bje
ctive F
unction
0 100 200 300 400 5000
5
10
15
20
25
Iterations
Akle
y O
bje
ctive F
unction
0 100 200 300 400 5000
0.5
1
1.5
2x 10
5
Iterations
Sphere
Obje
ctive F
unction
0 100 200 300 400 5000
1
2
3
4x 10
4
Iterations
Sphere
Obje
ctive F
unction
0 100 200 300 400 5000
100
200
300
400
500
Iterations
Griew
ank O
bje
ctive F
unction
0 100 200 300 400 5000
1
2
3
4
5x 10
7
IterationsRosem
bro
k O
bje
ctive F
unction
a)
c)
e)
0 100 200 300 400 5000
5
10
15
20
25
Iterations
Akle
y O
bje
ctive F
unction
0 100 200 300 400 5000
100
200
300
400
Iterations
Rastr
igin
Obje
ctive F
unction
d)
b)
f)
h)
l)
i)
g)
www.intechopen.com

Advances in Nanocomposites - Synthesis, Characterization and Industrial Applications
380
TEST Function
Theoretical Convergence
value
WPO Mean Values
Dim=20 NAgent=20
WPO Standard Deviation Dim=20
NAgent=20
WPO Mean Value
Dim=60 NAgent=100
WPO Standard Deviation Dim=60
NAgent=100
Sphere 0 0 0 0 0 Rastrigin 0 0 0 0 0 Griewank 0 0 0 0 0 Rosenbrok 0 56.1 0.7 56.1 0.7 Akley 0 0 0 0 0
Table 5.1.1. WPO Test: IterNumber=500 , DIM=20 and 60, NumAgent=20 and 100, RunRipetition=20.
5.2 Absorber multilayer structure optimized by winning particle optimization In Fig. 5.2.1, a design of an absorber in the 5-18 GHz band is shown. In particular the optimization has been conducted by the WPO algorithm, taking onto account for both: microwave loss factor maximization expressed in (4.2.1) and multilayer thickness minimization [D.Micheli et, al,. 2010]. In Fig. 5.2.1. a,b) reflection coefficient TE,TM remain below -10 dB for incidence angles in the range 0°-40° in the most part of the bandwidth (5.38-18 GHz). In Fig. 5.2.1 b), it can be observed that for incidence angle of 20°, 30°, 40°, 60°, TM reflection coefficient is lower than that at 0° incidence angle. Such angles are the Brewster angles for a lossy material more often referred to Zenneck angles [Sophocles J.Orfanidis, 2009]. In Fig.5.2.1 c,d), transmission Coefficient TE, TM remain below -15 dB within all the bandwidth and linearly decrease with the frequency as expected. In Fig.5.2.1. e) minimization of objective function is shown, it can be observed that after the 550 i-th iteration the convergence of WPO algorithm doesn’t evolve towards lower values and as a consequence toward better solutions. In Fig. 5.2.1 f), the absorber multilayer structure is schematically shown. It can be observed two type of absorber mixed together the first where the intrinsic layer impedances decrease from the top to the bottom of absorber and the second where an high layer impedance (resin) is put between lower impedance layers (MWCNTs), recalling in mind resonant absorbers behaviour.
6. Experimental validation of mathematical model for microwave absorbers design
In order to experimentally validate the mathematical model and the design method
described in previous sections, we realized and tested several multilayer square tiles, one
made of graphite and the others made of MWCNTs. Tiles structure, their dimensions and
reflection loss results (dB), are shown in Fig. 6.1.
In order to test the reflection loss of tiles we built an in-house NRL arch measurement, also called bi-static reflection method [Umari, M. H. et al.]. In this configuration, two antennas are used for transmitting and receiving signals respectively, and the microwave reflectivity at different incident angles can be measured. The NRL Arch is the industry standard for testing the reflectivity of materials. Originally designed at the Naval Research Laboratory
www.intechopen.com

Electromagnetic Characterization of Composite Materials and Microwave Absorbing Modeling
381
Fig. 5.2.1. a,b) Reflection coefficient (dB) TE, TM of absorber, c,d) Transmission coefficient (dB) TE, TM of absorber, e) WPO minimization of objective function which takes into account for both: loss factor and thickness, f) scheme of absorbing multilayer structure made of carbon composite material .
6 8 10 12 14 16 18-55
-50
-45
-40
-35
-30
-25
-20
-15
-10
-5
0
Frequency (GHz)
Mo
du
le o
f R
efle
ctio
n C
oe
ffic
ien
t T
E (
dB
)
theta=0°
theta=10°
theta=20°
theta=30°
theta=40°
theta=50°
theta=60°
theta=70°
theta=80°
6 8 10 12 14 16 18-55
-50
-45
-40
-35
-30
-25
-20
-15
-10
-5
0
Frequency (GHz)
Mo
dule
of R
eflectio
n C
oe
ffic
ient
TM
(dB
)
theta=0°
theta=10°
theta=20°
theta=30°
theta=40°
theta=50°
theta=60°
theta=70°
theta=80°
6 8 10 12 14 16 18-50
-45
-40
-35
-30
-25
-20
-15
-10
Frequency (GHz)Mo
du
le o
f T
ransm
issio
n C
oe
ffic
ien
t T
E (
dB
)
theta=0°
theta=10°
theta=20°
theta=30°
theta=40°
theta=50°
theta=60°
theta=70°
theta=80°
6 8 10 12 14 16 18-50
-45
-40
-35
-30
-25
-20
-15
-10
Frequency (GHz)Mo
du
le o
f T
ran
sm
issio
n C
oe
ffic
ien
t T
M (
dB
)
theta=0°
theta=10°
theta=20°
theta=30°
theta=40°
theta=50°
theta=60°
theta=70°
theta=80°
0 100 200 300 400 500 600 700 80025
30
35
40
45
50
55
60
65
70
75
Iterations of WPO algorithm
Ob
jective
Fu
nctio
n m
inim
iza
tio
n
a)
c)
b)
e)
d)
f)
3,0 mm
0,1 mm
6,0 mm
3,0 mm
Epoxyresin
MWCNTs 0.5%
Epoxyresin
Inicidence Wave Reflected Wave
∞∞
MWCNTs 3%
α
Transmitted Wave
www.intechopen.com

Advances in Nanocomposites - Synthesis, Characterization and Industrial Applications
382
Fig. 6.1. a) Graphite based tile of 10.9 mm thickness; b) MWCNTs based tile of 6.97 mm thickness; b) MWCNTs based tile of 6 mm thickness.
(NRL), the NRL Arch allows for quick, repeatable and non-destructive testing of microwave absorbent materials over a wide frequency range. Reflectivity is defined as the reduction in reflected power caused by the introduction of an absorbent material. This reduction in power is compared to a ‘perfect’ reflection which is approximated very well by the reflection of a flat metallic plate. Antennas can be located anywhere on the arch to allow measurements of performance at off normal angles of incidence. Vector network analyzer is
Graphite 10%
Graphite 5%
Aluminum plate
∼2,60 ± 0.5mm
∼2,50 ± 0.5mm
∼2,80 ± 0.5mm
∼3,00 ± 0.5mm
Inicidence Wave Reflected Wave
200 mm
200 mm
Graphite 15%
α
Epoxyresin
MWCNTs 1%
MWCNTs 2%
Aluminum plate
∼0,50 ± 0.5mm
∼0,97 ± 0.5mm
∼3,00 ± 0.5mm
∼3,00 ± 0.5mm
Inicidence Wave Reflected Wave
200 mm
200 mm
∼2,50 ± 0.5mm
MWCNTs 3%
α
-9
-8
-7
-6
-5
-4
-3
-2
-1
0
1
8.2
8.4
2
8.6
4
8.8
7
9.0
9
9.3
1
9.5
3
9.7
5
9.9
8
10
.2
10
.4
10
.6
10
.9
11
.1
11
.3
11
.5
11
.8 12
12
.2
Frequency (GHz)
Re
fle
ctio
n L
oss (
dB
)
Measured RL TE(dB), inc.10deg
Measured RL TM(dB), inc.10deg
Simulated RL TE(dB), inc.10deg
Simulated RL TM(dB), inc.10deg
No_Materials_on_metal_plate
Simulated
MeasuredReference
-35
-30
-25
-20
-15
-10
-5
0
5
8.2
8.4
2
8.6
4
8.8
7
9.0
9
9.3
1
9.5
3
9.7
5
9.9
8
10
.2
10
.4
10
.6
10
.9
11
.1
11
.3
11
.5
11
.8 12
12
.2
Frequency (GHz)
Re
fle
ction
lo
ss (
dB
)
Measured RL TE(dB), inc.5deg
Measured RL TM(dB), inc.5deg
Simulated RL TE(dB), inc.5deg
Simulated RL TM(dB), inc.5deg
No Materials on metal plate
Reference
Simulated
Measured
-20
-15
-10
-5
0
5
8.2
8.4
2
8.6
4
8.8
7
9.0
9
9.3
1
9.5
3
9.7
5
9.9
8
10.2
10.4
10.6
10.9
11.1
11.3
11.5
11.8 12
12.2
Frequency (GHz)
Reflection loss (
dB
)
Measured RL TE(dB), inc.5deg
Measured RL TM(dB), inc.5deg
Simulated RL TE(dB), inc.5deg
Simulated RL TM(dB), inc.5deg
No Materials on metal plate
Reference
Simulated
Measured
a)
Epoxyresin
MWCNT 3%
Alluminum plate
∼2,3 ± 0.25mm
∼3,00 ± 0.01mm
Inicidence Wave Reflected Wave
200 mm
200 mm
∼3,7 ± 0.25mm
5°
b)
c)
www.intechopen.com

Electromagnetic Characterization of Composite Materials and Microwave Absorbing Modeling
383
used for measurements to provide both the stimulus and the measurement. Calibration is performed by measuring the resultant power reflecting off the metal plate over a broad frequency range. This is established as the ‘perfect’ reflection or 0 dB level (i.e. the reference level). The material under test is then placed on the plate and the reflected signal measured in dB. Time domain gating may be used to eliminate antenna cross talk and reduce the error introduced by room reflections. Using this configuration, the properties of materials at different directions can be characterized. It should be noted that in bi-static reflection measurements, the reflection is dependent on the polarization of the incident wave. Incident waves with parallel and perpendicular polarization usually result in different reflection coefficients. In Fig. 6.2, bistatic measurement system and the tiles in composite material are shown. In this configuration, bistatic measurement system has been based on Agilent software 8571E (material measurement), and Agilent PNA-L vector analyzer. Antennas were bought at Q-par Angus Ltd and are in the range 8-12 GHz. After calibration, measurement of a known sample consisting in ECCOSORB AN73 absorber, [www.eccosorb.com], has been performed in order to be aware about errors in the NRL measurement setup. Confidence of measurements was within 2 dB of interval with respect to reflection properties declared in ECCOSORB data sheet. At the end measurements of the manufactured samples have been performed for TE and TM mode. In Fig. 6.2, comparison between measured and simulated RAM structures is shown. It can be noticed that simulated curve shows similar behaviour with respect to measured one. Discrepancies in reflection loss data are around 2 dB, which is an acceptable accuracy in such kind of measurements.
Fig. 6.2. a) bistatic measurement system sheme, b) bistatic measurement system located at (www.saslab.eu).
7. References
D. Micheli *, C. Apollo, R. Pastore, M. Marchetti, (2010). X-Band microwave characterization of carbon-based nanocomposite material, absorption capability comparison and RAS design simulation, Elsevier Composites Science and Technology 70 (2010) 400–409
Xingcun Colin Tong, (2009). Advanced Materials and Design for Electromagnetic Interference Shielding, CRC Press
Z. Ounaiesa,*, C. Parkb, K.E. Wiseb, E.J. Siochic, J.S. Harrisonc, (2003). Electrical properties of single wall carbon nanotube reinforced polyimide composites, Elsevier Science@Direct.
Tx Ant. Rx Ant.
Tile
NRL ARCH.
AGILENT PNA
Horn Antenna Signal Detector
Metal Plate
Absorbing Material Sample
To be tested
Min 800 mm Min 200mm
Min 200mm
Horn Antenna Signal Generator
a) b)
www.intechopen.com

Advances in Nanocomposites - Synthesis, Characterization and Industrial Applications
384
Weber, M, and Kamal., (1997). Estimation of the volume resistivity of electrically conductive composites, Polymer Composites 18(6), 711-725
Sichel, E., (1982). Carbon Black-Polymer Composites, New York: Marcel Dekker. Prato et al.,(2008). Using the Selective Functionalization of Metallic Single-Walled Carbon
Nanotubes to Control Dielectrophoretic Mobility. J. Am. Chem. Soc., 130 (25) L. F.Chen and C. K. Ong, (2004). Microwave Electronics; Measurement and Materials
Characterization, NeoNational University of Singapore Print & John Wiley Abdel-Hakim and Boughriet, (1997). Noniterative Stable Transmission/Reflection Method for
Low-Loss Material Complex Permittivity Determination, IEE Trans. Microwaves, Antennas Propagat., Vol. 45, N.1.
James Baker-Jarvis, (1990). Transmission / Reflection and Short-Circuit Line Permittivity Measurements, U.S. Department of Commerce, National Institute of Standard and Technology (NIST).
Davide M. Pozar, (2005). Microwave Engineering, John Wiley, third edition, pp. 174-180, 2005. S. Ramo, J. Whinnery and T. Van Duzer, (1994). Fields and Waves in Communications
Electronics, JohnWiley & Sons. D. Micheli, R. Pastore, C. Apollo, M. Marchetti, G. Gradoni, F. Moglie, V. Mariani Primiani,
(2009). Carbon Based Nanomaterial Composites in RAM and Microwave Shielding Applications, 9th Nanotechnology Conference: IEEE NANO 2009.
D. Micheli, R. Pastore, C. Apollo, M. Marchetti, G. Gradoni, F. Moglie, V. Mariani Primiani, (2010). Design of Broadband Quasi-Perfect Electromagnetic Absorbers using Carbon Nanostructure-Based Composites, IEEE Nanotechnology.
Davide Micheli, Carmelo Apollo, Roberto Pastore, Mario Marchetti, (2010). Nanomaterials in Radar Absorbing Material Design using Particle Swarm Optimization and Genetic Algorithm, 50th ISRAEL ANNUAL CONFERENCE ON AEROSPACE SCIENCES, Conference tag number: 50IACAS-542, Feb 2010.
Davide Micheli, Carmelo Apollo, Roberto Pastore, Mario Marchetti, (2010). Modeling of Microwave Absorbing Structure using Winning Particle Optimization applied on Electrically Conductive Nanostructured composite material, ICEM 2010 –XIX International Conference on Electrical Machines, TPC-6: Theory, Modeling and Design, Proc. IEEE. RF-013846, Set. 2010.
Mitsuo Gen, Runwei Cheng, (1999). Genetic Algorithms, 1st edition, John Wiley & Sons. Franciszek Seredynski1, Albert Y. Zomaya, and Pascal Bouvry. Function Optimization with
Coevolutionary Algorithms. Umari, M. H. Ghodgaonkar, D. K. Varadan, V. V. and Varadan, V. K. (1991). A free-space
bistatic calibration technique for the measurement of parallel and perpendicular reflection coefficients of planar samples, IEEE Transactions on Instrumentation and Measurement, 40 (1), 19–24.
Emerson & Cuming Microwave Products. NRL Arch Reflectivity Testing basic notes. Available: http://www.eccosorb.com/
Sophocles J.Orfanidis, (2009). Electromagnetic wave and Antennas. http://www.ece.rutgers.edu/
www.intechopen.com

Advances in Nanocomposites - Synthesis, Characterization andIndustrial ApplicationsEdited by Dr. Boreddy Reddy
ISBN 978-953-307-165-7Hard cover, 966 pagesPublisher InTechPublished online 19, April, 2011Published in print edition April, 2011
InTech EuropeUniversity Campus STeP Ri Slavka Krautzeka 83/A 51000 Rijeka, Croatia Phone: +385 (51) 770 447 Fax: +385 (51) 686 166www.intechopen.com
InTech ChinaUnit 405, Office Block, Hotel Equatorial Shanghai No.65, Yan An Road (West), Shanghai, 200040, China
Phone: +86-21-62489820 Fax: +86-21-62489821
Advances in Nanocomposites - Synthesis, Characterization and Industrial Applications was conceived as acomprehensive reference volume on various aspects of functional nanocomposites for engineeringtechnologies. The term functional nanocomposites signifies a wide area of polymer/material science andengineering, involving the design, synthesis and study of nanocomposites of increasing structuralsophistication and complexity useful for a wide range of chemical, physicochemical and biological/biomedicalprocesses. "Emerging technologies" are also broadly understood to include new technological developments,beginning at the forefront of conventional industrial practices and extending into anticipated and speculativeindustries of the future. The scope of the present book on nanocomposites and applications extends farbeyond emerging technologies. This book presents 40 chapters organized in four parts systematicallyproviding a wealth of new ideas in design, synthesis and study of sophisticated nanocomposite structures.
How to referenceIn order to correctly reference this scholarly work, feel free to copy and paste the following:
Davide Micheli, Carmelo Apollo, Roberto Pastore, Ramon Bueno Morles, Mario Marchetti and GabrieleGradoni (2011). Electromagnetic Characterization of Composite Materials and Microwave Absorbing Modeling,Advances in Nanocomposites - Synthesis, Characterization and Industrial Applications, Dr. Boreddy Reddy(Ed.), ISBN: 978-953-307-165-7, InTech, Available from: http://www.intechopen.com/books/advances-in-nanocomposites-synthesis-characterization-and-industrial-applications/electromagnetic-characterization-of-composite-materials-and-microwave-absorbing-modeling


