
Emergence and Influence of Expertise in
Group Decision Making: A Judgmental Task
by
Golnaz Tajeddin
A thesis
presented to the University of Waterloo
in fulfillment of the
thesis requirement for the degree of
Master of Applied Science
in
Management Sciences
Waterloo, Ontario, Canada, 2007
c©Golnaz Tajeddin, 2007

I hereby declare that I am the sole author of this thesis. This is a true copy of the thesis,
including any required final revisions, as accepted by my examiners.
I understand that my thesis may be made electronically available to the public.
Golnaz Tajeddin
ii
Abstract
This thesis investigates the emergence and influence of expertise in group decision making
while performing a judgmental task. Previous studies focused on intellective tasks or com-
pared the group performance with the performance of the best individual in the group. In
this study, performance feedbacks are provided to groups to help group members compare
the individual performances and identify the expert.
Laboratory experiments were conducted in which the task was to select a proverb that
Canadians would like the most from the list of four proverbs from countries other than
Canada. The four proverbs for each question were guaranteed to have equal selection
probability based on the pretest survey. 18 four-person cooperative groups were asked
to perform the task for eight iterations each. One member in each group was selected
randomly to be the expert. Groups received performance feedbacks that reinforced the
expert at the end of each iteration. The amount of information conveyed to each group
regarding the expertise level of each group member was measured with a novel application
of information analysis that captures the expert’s gradual emergence. Experiment results
supported the hypotheses of this study that (1) group members recognize the expert when
working on a judgmental task with performance feedback and (2) while performing a
judgmental task, the expert has more influence on the group decision making compared to
others.
iii
Acknowledgements
I still remember Professor Safayeni’s quote in our theory development class: ”Doing re-
search is like going on a journey”. Having almost finished this journey, I clearly see the
trueness in that sentence. I was blessed with having the best group of people accompanying
me in this unique journey. First and foremost, I am especially grateful to my supervisor,
Professor Frank Safayeni, for his constant support, guidance, and encouragement. I would
like to thank my readers, Professor Rob Duimering and Professor Olga Vechtemova, for
spending time reading my thesis and giving me constructive feedback. I also wish to thank
my friends in our lab, Natasha, Joannie, Min, Chris, and Richard, for their friendship and
support and for attending my pilot study.
I would like to extend my warmest gratitude to my friend Somayeh, for her true belief
in me and for all the unconditional support and encouragement she has given me. I want
to say thank you to my close friend Afra, who played the role of an older, patient, and
kind sister for me by listening to all my naggings and cheering me up.
I am deeply grateful to my wonderful parents, Mahnaz Azadeh and Hassan Tajeddin,
for their unconditional love: always putting my happiness before theirs. I want to thank
my dearest sister, Elnaz, for if it wasn’t for the great desire to go back and see her as soon
as possible, writing this thesis could have taken a lot longer.
I shall not conclude without thanking my beloved husband, Iman, for his patience,
kindness, and accompany. I am sure that I would not have finished this thesis without his
support.
iv

Dedicated To Iman:
In appreciation of all his support throughout this journey: a unique support
v

Contents
1 Introduction 1
2 Literature Review and Hypotheses 3
2.1 Literature . . . . . . . . . . . . . . . . . . . . . . . . . . . . . . . . . . . . 3
2.1.1 Expert . . . . . . . . . . . . . . . . . . . . . . . . . . . . . . . . . . 3
2.1.2 Task . . . . . . . . . . . . . . . . . . . . . . . . . . . . . . . . . . . 4
2.1.3 Expert and Group Decision Making . . . . . . . . . . . . . . . . . . 5
2.1.4 Expert Recognition . . . . . . . . . . . . . . . . . . . . . . . . . . . 7
2.1.5 Expert Influence . . . . . . . . . . . . . . . . . . . . . . . . . . . . 9
2.2 Hypotheses . . . . . . . . . . . . . . . . . . . . . . . . . . . . . . . . . . . 10
2.2.1 Expert Recognition . . . . . . . . . . . . . . . . . . . . . . . . . . . 10
2.2.2 Expert Influence . . . . . . . . . . . . . . . . . . . . . . . . . . . . 12
3 Methodology 15
3.1 Stimulus . . . . . . . . . . . . . . . . . . . . . . . . . . . . . . . . . . . . . 15
3.2 Survey . . . . . . . . . . . . . . . . . . . . . . . . . . . . . . . . . . . . . . 17
3.2.1 Task . . . . . . . . . . . . . . . . . . . . . . . . . . . . . . . . . . . 17
3.2.2 Participants . . . . . . . . . . . . . . . . . . . . . . . . . . . . . . . 18
3.2.3 Procedure . . . . . . . . . . . . . . . . . . . . . . . . . . . . . . . . 18
3.2.4 Result . . . . . . . . . . . . . . . . . . . . . . . . . . . . . . . . . . 18
vi

3.3 The Experiment . . . . . . . . . . . . . . . . . . . . . . . . . . . . . . . . . 19
3.3.1 The Task . . . . . . . . . . . . . . . . . . . . . . . . . . . . . . . . 19
3.3.2 Participants . . . . . . . . . . . . . . . . . . . . . . . . . . . . . . . 20
3.3.3 Procedure . . . . . . . . . . . . . . . . . . . . . . . . . . . . . . . . 20
4 Results 23
4.1 Experimental Data . . . . . . . . . . . . . . . . . . . . . . . . . . . . . . . 23
4.2 Expert Recognition . . . . . . . . . . . . . . . . . . . . . . . . . . . . . . . 23
4.3 Expert Influence . . . . . . . . . . . . . . . . . . . . . . . . . . . . . . . . 24
4.3.1 Expert Followership . . . . . . . . . . . . . . . . . . . . . . . . . . . 24
4.3.2 Social Decision Schemes . . . . . . . . . . . . . . . . . . . . . . . . 26
4.3.3 Information Analysis . . . . . . . . . . . . . . . . . . . . . . . . . . 33
4.3.4 Expert Influence at the Individual Level . . . . . . . . . . . . . . . 36
4.4 Other Results . . . . . . . . . . . . . . . . . . . . . . . . . . . . . . . . . . 37
4.4.1 Reason for Expert’s Performance . . . . . . . . . . . . . . . . . . . 37
4.4.2 Enjoying Group work . . . . . . . . . . . . . . . . . . . . . . . . . . 38
5 Discussion and Conclusion 41
5.1 Discussion . . . . . . . . . . . . . . . . . . . . . . . . . . . . . . . . . . . . 41
5.1.1 Expert Recognition . . . . . . . . . . . . . . . . . . . . . . . . . . . 41
5.1.2 Expert Influence . . . . . . . . . . . . . . . . . . . . . . . . . . . . 42
5.1.3 Reason for Expert’s Performance . . . . . . . . . . . . . . . . . . . 44
5.1.4 Enjoying Group work . . . . . . . . . . . . . . . . . . . . . . . . . . 45
5.1.5 Other Observations . . . . . . . . . . . . . . . . . . . . . . . . . . . 45
5.2 Research Contributions . . . . . . . . . . . . . . . . . . . . . . . . . . . . . 48
5.3 Limitations of the Study . . . . . . . . . . . . . . . . . . . . . . . . . . . . 49
5.4 Areas of Future Research . . . . . . . . . . . . . . . . . . . . . . . . . . . . 50
vii

A Survey Questions 53
B Survey Instructions 59
C Experiment Questions 61
D Online Registration 65
E Experiment Instructions 67
F Results Table 71
G Questionnaire - Participants 73
H Questionnaire - Observers 75
I Details of All Group Experiments 77
J The Result of Questionnaires in Detail 85
Appendices
Bibliography 91
viii
List of Tables
3.1 Algorithm for choosing the expert . . . . . . . . . . . . . . . . . . . . . . . 21
4.1 Expert followership in the first and last four iterations . . . . . . . . . . . 25
4.2 t test for comparing Expert Followership in the first and last four iterations 26
4.3 Obtained frequency - First four trials . . . . . . . . . . . . . . . . . . . . . 27
4.4 Obtained frequency - Last four trials . . . . . . . . . . . . . . . . . . . . . 28
4.5 Obtained probability - First four trials . . . . . . . . . . . . . . . . . . . . 29
4.6 Obtained probability - Last four trials . . . . . . . . . . . . . . . . . . . . 30
4.7 Predicted probability: majority otherwise proportionality . . . . . . . . . . 30
4.8 K-S test for standard social decision models . . . . . . . . . . . . . . . . . 31
4.9 K-S tests for expert-weighted social decision models . . . . . . . . . . . . . 32
4.10 The pointing system for information analysis . . . . . . . . . . . . . . . . . 34
4.11 t test- expert’s standing out score under different EF . . . . . . . . . . . . 36
4.12 t test for comparing convergence in the first and last four iterations . . . . 38
4.13 t test for comparing the reason for expert’s good performance . . . . . . . 39
4.14 t test for comparing the enjoyment of group work . . . . . . . . . . . . . . 40
J.1 Summary of questionnaire completed by group members excluding experts 85
J.2 Summary of questionnaire completed by experts . . . . . . . . . . . . . . . 89
J.3 Summary of questionnaire completed by observers . . . . . . . . . . . . . . 90
ix

List of Figures
2.1 Schematic of the basic components of SDS theory (adopted from Stasser, 1999) 7
4.1 Expert standing out and followership . . . . . . . . . . . . . . . . . . . . . 35
x
Chapter 1
Introduction
From the early times to present, most people have lived in groups. They have preferred
to perform their activities such as working, learning, worshiping, and playing in a group
rather than isolated from others (Forsyth, 2006). Moreover, groups, in recent days, are
essential management tools that organizations use to make a novel combination of individ-
uals to work on novel tasks (Gersick, 1988). Therefore, research in this area would have a
great influence on organizations. One of the important tasks that groups perform is mak-
ing different types of decisions. In most cases groups outperform individuals in judging,
estimating, choosing, and problem solving (Stasser and Dietz-Uhler, 2001).
When a group makes a decision, individuals have their own choices in most cases. The
group discusses these individual choices and reaches the group choice. This is one of the
interesting and important dynamics of a group that has attracted many researchers in
previous decades. Many studies have addressed how the group choice is made from the
individual choices.
A group should be able to recognize and utilize all its resources in order to enhance its
performance. One of the major resources in a group is the expertise of its members(McGrath,
1984). Therefore, recognizing and utilizing experts has a great effect on the group’s per-
1

2
formance. Experts emerge gradually in groups based on the individual and group perfor-
mances and the feedback that a group receives during the group work. The first focus of
this study is the emergence of the expert in group decision making and the group’s ability
to recognize the expert.
Expert recognition is the first toward utilizing expertise in group decision making.
Therefore, the second focus of the current study is the influence of the expert in group
decision making. This part would address the difference between the expert’s influence
and other group members’ influence on the group decision.
In designing the experiment to investigate these questions, the main concern was to
make a case that was a good representative of real life cases. Since in the realistic setting
the tasks are often judgmental with feedbacks, the task chosen for the experiment was also
a judgmental task followed by the performance feedback.
In summary, this thesis investigates the emergence, recognition, and influence of exper-
tise in group decision making while the group works on a judgmental task and receives a
performance feedback. The remainder of the thesis is ordered as follows. Chapter 2 begins
with defining “expert”and “judgmental task”and proceeds to reviewing previous studies in
the literature. The chapter concludes by identifying the existing gap in the literature and
defining the hypotheses of this study. Chapter 3 discusses the methodology and provides a
detailed description of the experiment. Chapter 4 analyzes the results of the experiment.
Finally, Chapter 5 outlines the conclusions, areas for future research, and limitations of
the study.
Chapter 2
Literature Review and Hypotheses
2.1 Literature
There is a rich literature on various aspects of group decision making and problem solving.
This chapter provides an overview of the literature addressing similar issues to the one
studied in this research: the emergence of experts and their influence on the decision
making process of groups performing judgmental tasks. The first two sections provide
definitions of the two major elements of the study: expert and the judgmental task. The
last two sections discuss expert recognition and influence.
2.1.1 Expert
In the literature of group decision making there are two major definitions for expert, each
corresponding to its own stream of research. The first definition builds on Wegner (1986)
theory of transactive memory which views experts as individuals who have access to more
information (than other group members) in a specific domain (Stewart and Stasser, 1995).
With this definition, expertise does not necessarily imply possession of higher skills or
abilities.
3

4
As such, the stream of research using this definition has largely focused on the infor-
mation sharing effect of experts during the group decision making process. For example,
Stewart and Stasser (1995) examined how the expert facilitates mentioning and validation
of unshared information in collective recall and decision making groups. The facilitation
occurs through increasing member’s awareness of who holds what type of information.
The study found that assigned expertise significantly increased the proportion of unshared
information revealed in the group during both collective recall and decision making tasks.
The second definition sees experts as ”the group member who had the highest perfor-
mance on the task during previous tasks” (Bonner et al., 2002; Henry et al., 1996). This
definition leads to the studies such as the recognition and influence of expert in group
decision making process (For example: Littlepage et al., 1997; Bonner et al., 2002; Bonner,
2004) and comparing the group performance with the that of the expert (For example:
Libby et al., 1987; Laughlin et al., 2003, 2006). Since these are also the focus of this re-
search, the second definition is adopted. The following sections provide a more detailed
overview of the studies in this latter stream of research, especially with regards to the
tasks defined, and expert recognition and influence on the expert and group decision mak-
ing process.
2.1.2 Task
The variety of tasks used in the literature fall along a spectrum of pure judgmental to
pure intellective ones (Laughlin, 1980; Laughlin et al., 1991). Intellective tasks, such as
mathematical problems, possess objectively correct answers, provable to others with the
same conceptual system. In contrast, judgmental tasks involve evaluative, behavioral,
or aesthetic judgment and it is impossible to demonstrate the correct answer to them
(Laughlin et al., 2003; Bonner, 2000) .
As such, the main factor that differentiates between intellective and judgmental task

Literature Review 5
is demonstrability of the correct answer. Laughlin and Ellis (1986) suggested four require-
ments for demonstrability of correct responses: (a) group consensus on a conceptual system;
(b) sufficient information regarding the task; (c) recognizability of the correct answer, if
proposed, by incorrect members; (d) possession of sufficient ability, motivation, and time
by the correct members to demonstrate the correct answer to the incorrect group member.
Some of the most commonly used intellective tasks in studying group decision making
are: deductive rule-learning problem, Master mind game (Laughlin et al., 1999; Bonner et al.,
2002), Letters to number task (Laughlin and Bonner, 1999; Laughlin et al., 2003; Bonner,
2004; Laughlin et al., 2006).
The Desert Survival Situation (Littlepage and Mueller, 1997), estimating unknown
quantities (Henry, 1993; Henry et al., 1996), and choosing the title for the partly revealed
picture (Bonner, 2000) are examples of the judgmental tasks found in the literature.
2.1.3 Expert and Group Decision Making
The majority of studies on the expert and group decision making compare the group
performance with the performance of the best group member: the expert.
Literature suggests that groups perform better than independent individuals on a wide
range of problems. In one study, the highly intellective task, Letters to Numbers, was
used in five different ways. The result showed that the three-person groups performed
better than the best of an equivalent number of individuals on letters to numbers problems
(Laughlin et al., 2003). In another Letters-to-Numbers task study, Laughlin et al. (2006)
examined the effect of the group size on the group performance and suggested that three-
person groups are necessary and sufficient to perform better than the best individual on
highly intellective problems. Moreover, Henry (1995) proposed two ways by which the
groups can perform as well as their best members even in tasks without demonstrable
solution (judgmental tasks): (a) asking a group to share task-relevant information or (b)

6
asking a group to try to determine the most accurate member.
In group decision making, information is contributed by members and then socially
processed to reach the group agreement. In literature, the social process where information
contributed by members is known as the social combination process, and the scheme the
group used to reach the group decision is known as social decision scheme.(Davis, 1969;
Restle and Davis, 1962). Lorge and Slomon (1955) developed the model for the group
problem solving showing how group combine the individual answers to reach the group
solution. Later, Davis (1973) applied their proposed model for the group decision making
process. To apply the model, it was assumed that the group decision task is to select
a response from a set of mutually exclusive and exhaustive alternatives. A group does
that by mapping the individual preferences distribution to a collective group decision.
This mapping process is tested against the model drawn from the theoretical expectations
which implies what would happen (Bonner et al., 2002).
A noteworthy theory in the literature of group decision making is the social decision
scheme theory. The social decision scheme theory includes four basic elements: individual
preferences, group composition (preference distribution among members), group influence
(social combination rule), and collective decision (Stasser, 1999). Stasser (1999) demon-
strated these four elements in a simple schematic depicted in figure 2.1.
There are many different forms of social decision schemes in the literature such as:
majority in which the group selects the choice advocated by the majority of the group
members, proportionality in which the probability of a group choosing a certain choice
is the proportion of members advocating that choice, equiprobability in which each ad-
vocated choice is equally probable to be chosen as a group choice (Davis, 1973). Social
decision schemes may be the combination of two or three. For example: majority otherwise
proportionality which means that the group will select the choice advocated by majority
but, if no majority exists, the group will weigh each options in proportion on number of
members chosen that option. These decision schemes are referred as standard decision

Literature Review 7
Figure 2.1: Schematic of the basic components of SDS theory (adopted from Stasser, 1999)
scheme (Bonner et al., 2002).
The standard decision scheme treats all the group members as being indistinguishable
and interchangeable. Therefore, it is not suitable for the cases that there is a difference
between the group members. For this purpose, Bonner (2000) introduced the social per-
mutation which includes a new set of models that identify a certain group member and
treat that individual as a consistent entity across the trials. These models are discussed in
more detail in section 4.
2.1.4 Expert Recognition
In group decision making, one of the major resources available to the group is the expertise
of the group members (Laughlin, 1980; McGrath, 1984). Therefore, the group performance
depends on both the level of expertise in the group and the group’s ability to recognize the
expert(Bottger, 1984; Libby et al., 1987). A review of literature recommends that, for the
purpose of expert recognition and utilization of the expertise, the task should possess two
primary characteristics. First, diagnostic information on performance should be available

8
to group members. Second, the task should have a medium level of difficulty (Bonner et al.,
2002). Diagnostic information on the relative competencies, knowledge, or performance of
the group members should be available to all group members so that they can assess the
relative expertise of group members. Explicit performance feedback leads a group member
to carry out a social comparison process with other group members(O’Leary-Kelly, 1998).
Moreover, the task should possess a level of difficulty that allows for substantial variation
in member performance which helps members to recognize the differences in the expertise
levels among group embers(Libby et al., 1987).
Bonner (2004) examined the recognition and influence of the expertise in three-person
groups working on a letter-to-numbers task. First, all participants completed the task
individually and were ranked from first (with the highest performance at the individual
level) to third, within their prospective three-member group. Then the task was performed
twice in the same three-person groups. Some groups were provided feedback on the ranking
information of all group members; whereas, other groups did not receive any information
regarding the individual performance of group members. The result showed that groups
with explicit ranking information and group without ranking information both calibrated
with respect to the expertise while working on an intellective problem-solving task.
In another study, Littlepage and Mueller (1997) investigated how personal characteris-
tics and behavior of the expert relate to the group’s recognition and utilization of expertise.
The participants completed the desert survival situation problem in groups of four or five
people. The study found that an expert who was more talkative and highly used the influ-
ence tactic reason was more likely to be recognized as an expert by other group members.
Furthermore, an expert was more influential if one of the following conditions existed: (a)
was male, (b) was talkative, (c) received support from a talkative colleague, (d) used reason
to show that his/her response was correct.
Littlepage et al. (1997) examined the impact of group experience and task experience
on the group performance. The participants completed the desert survival situation or

Literature Review 9
the price estimation tasks in groups of three to six people. The result showed that task
experience led to better group performance. Moreover, group experience on a related task
also increased the group performance by facilitating recognition and utilization of member
expertise.
2.1.5 Expert Influence
Besides investigating the expert recognition, the important aspect studied in the literature
was the influence of the expert in group decision making. Einhorn et al. (1997)) suggested
that the group judgment is a weighted combination of the individual judgments and the
crucial point is how the group allocated these weights to the opinions of different group
members. They developed four base line models: (a) the random model, (b) the mean or
composite model, (c) the best-member model, and (d) the proportional model. The third
model is of interest in this research.
Yetton and Bottger (1982) also concluded that groups weighted individual inputs in
proportion to an individual’s expertise and this led to better group performance. In the
study of expert’s influence in group decision making, Bonner et al. (2002) asked three-
person groups to solve either an easy or moderately difficult version of the deductive logic
game Mastermind. The result demonstrated that groups gave more weight to the expert’s
input in their decision making in moderately difficult intellective problem, in which case the
group decision making process was best approximated by expert-weighted social decision
schemes. However, in the condition where the task was easy or the group lacked ranking
information, groups were not more likely to adopt options advocated by the expert.
Later in another study, Bonner (2004) examined three-person groups working on letters
to numbers, an intellective problem-solving task. Bonner believed that the greater com-
plexity of the problem compared to Mastermind (The one used in Bonner et al., 2002)
and the increased opportunities for group members to make decisions, provided a more

10
interaction-rich task environment. The study concluded that the group decisions were
best approximated by expert-weighted decision schemes in which the expert has twice the
influence of other group members.
2.2 Hypotheses
2.2.1 Expert Recognition
Reviewing the literature reveals gaps that can be addresses by future research. First, the
emergence of expertise is not a one shot process. Instead, it is a dynamic continuous process
that occurs throughout the group’s life. Information regarding the expertise level of group
members is generated gradually during the group work. This information accumulates and
builds the group perception of each members’ expertise in the given task. In real world
settings, people often have estimates of other people’s expertise level. These estimates are
built based on the individual’s performance compared to that of others. People do not
recognize someone as an expert only because of one good performance. Neither do they
change their mind about someone as a result of one poor performance. They accumulate all
available information and change their perception regarding the individual’s expertise level
gradually. To capture this concept in the current study, first, the experiment is designed
such that the group performs a task for eight iterations to allow enough time for building
perceptions and, second, the amount of information generated at the end of each iteration
regarding each group members’ expertise is measured using information analysis discussed
in details in Section 4.3.3.
Second, most studies in the field of expert recognition and influence in group decision
making have used an intellective task. As mentioned in Section 2.1.2, intellective tasks
have a demonstrable solution that the expert can show and also provide a reason for
in order to persuade other group members. In performing intellective tasks, the expert

Literature Review 11
recognition process is straight forward (Laughlin, 1980). In contrast, a judgmental task
is one for which a demonstrable correct solution does not exist. The task chosen for the
current study is a judgmental task for two reasons. First, to investigate whether the
results of studies based on intellective tasks are also true for a judgmental task. Second,
a judgmental task better represent real life decisions and better captures the effect of an
expert compared to an intellective task. Most real life decisions do not have solutions
that are demonstrable and provable. Different preferences, points of views, agendas, etc.,
create many feasible and desirable solutions for most real life decisions. In addition, expert
followership in an intellective task is, arguably, following a certain line of logic and reasoning
rather than following a certain individual (the expert). I believe that the expert’s effect
on group is better captured when the group follows the expert as an individual not as a
provable mathematical problem. In judgmental tasks, group members are unable to present
evidence for their correct answer in order to convince other group members (Henry et al.,
1996). However, there should be a feedback system in the process in order to distinguish
between individual performances and reinforce the expert. Therefore, the judgmental task
should be designed such that to have a correct answer. The Task in the current study has
designed in a way that can benefit from both characteristics of not having a demonstrable
correct answer while having a correct answer which distinguished between group members’
performances. This has been accomplished by choosing a qualitative judgmental task,
which has a correct answer based on a survey conducted prior to the experiment. The
details of the stimulus have been discussed in Section 3.1. Bonner (2004) showed that the
group recognized the expert when working on an intellective problem-solving task, letters
to numbers. This leads to questioning whether the group also recognizes the expert while
performing a judgmental task. In the task chosen for this study there is a performance
feedback which leads group members to carry out a social comparison process with other
group members(O’Leary-Kelly, 1998).
As discussed in Section 2.1.4 Bonner et al. (2002) defined two characteristics for the
12
task in order for group members to recognize and utilize the expertise: (a) group access to
the performance diagnostic information, (b) the task should possess a level of difficulty that
allows for significant variation in performance in order for members to identify different
levels of expertise. The task chosen for the current study satisfied both conditions. First,
the group received performance feedback at the end of each iteration. Second, a pretest
was conducted to choose questions such that all four choices had equal probability to be
chosen by group members. These points lead to the first hypothesis:
H1: Group members recognize the expert when working on a judgmental task with per-
formance feedback.
2.2.2 Expert Influence
Expert recognition is a first step in using this resource in group decision making. This leads
to the more interesting question: does the expert have more influence in group decision
making compared to other members? Literature suggests that in a group decision making
process group members weight each individual’s inputs in proportion to the individual’s
expertise level. Bonner et al. (2002); Bonner (2004) supported this idea using three-person
groups working on two different intellective tasks: mastermind and letters to numbers.
The most important characteristic of these two tasks is that both of them have correct
demonstrable solutions. Therefore, it is easier for the expert to present evidence for the
correct answer and persuade followership among other group members. But, how about a
judgmental task in which it is not easy to prove the correct answer or there is no unique
logic to find the answer? For example, in selecting the proverbs that Canadian would like,
one might try to relate the proverbs to the Canadian culture, while others might look at
the length or sound of the proverbs. There is no way to prove which one of these logics is
correct if any. In addition, the result may not be the same even if two individuals apply
Literature Review 13
the same logics. So, what would the group members do when they have to choose between
their own logic and the expert’s answer while past experience shows that the expert’s per-
formance was better than any one else? I believe that group members often prefer the
expert’s choice over their own judgment. The example of this idea is pervasive in our day
to day life when we ask experts for their recommendations and, furthermore, when we
follow the experts’ recommendations when we have experienced their good performance
previously. Therefore, the second hypothesis was as follows:
H2: While performing a judgmental task, the expert has more influence on the group deci-
sion making compared to others.


Chapter 3
Methodology
3.1 Stimulus
To explore a specific behavior of the group during the decision making process, the group
should have a task to perform. Each task, with its unique characteristics, would reveal
different aspects of the group dynamics. Therefore, the first step in running the experiment
is to select a task that is appropriate to test the hypotheses. Based on the hypotheses, the
desired experiment should fulfill the following requirements:
1. To show the gradual emergence of expertise, the group should perform the task
several times.
2. To create an expert, it should be possible to show that the expert’s individual choices
are correct in most cases without controlling the expert’s choice in any way. There-
fore, a task is needed that does not have a clear answer or a task for which any answer
is believable and acceptable as the correct answer.
3. To reinforce the position of one group member as the expert, group members should
receive feedbacks on group and individual performances after each iteration.
15
16
4. To induce discussion and provide enough information regarding the difference be-
tween an expert and other group members, the answer to each question should have
multiple choices that are chosen with the same probability. This concept is discussed
in more details later in this section.
Based on the requirements above, the judgmental task selected for this study was to
“choose a proverb that Canadians would like the most from a list of four proverbs from
countries other than Canada”.
One could use different arguments to find the best answer. Individuals select their
choices based on their personal experiences and their perceptions of the proverbs and
the Canadian taste and culture. Since group members have different perceptions and
experiences, different answers are chosen. Hence, any answer for this question would be
acceptable as the correct answer.
In order to fulfill the fourth requirement, the four choices of each question should
have the same chance of being chosen by the group members at the individual level. For
example, assume that a question has four choices: a, b, c, and d. If a has a higher chance
of selection comparing to b, c, and d, it is likely that most or even all group members
choose a as their individual choice. In such a case, by saying that a is the correct answer,
little or no information on the expertise level of each group member is provided. The value
of information would be more if individual choices are spread out on different choices.
In contrast, consider the following scenario: one group member chooses a, while other
members choose b, c, and d, respectively. Assuming a is announced as the correct answer,
compared to the previous scenario, here the group members receive more information
regarding the first member’s expertise level. In the second scenario one person “sticks
out”while no one does so in the first. In other words, the second scenario provides more
information that distinguishes between the group members in terms of their expertise level.

Methodology 17
To design the task that possesses the discussed characteristics, an on-line survey was
run to select the desired questions from an original pool made earlier. The details of the
survey are discussed in section 3.2.
To accomplish the first and second requirements, The group performed the task eight
times and the chosen expert was reinforced to be correct in six out of eight iterations. The
expert was decided to be correct six times instead of eight for the following reasons. First,
this would be more realistic and, therefore, the result of the study would be more applicable
to real situations. Second, the group members, including the expert, could get suspicious
and alter their behavior accordingly if they were told that one individual is correct in all
iterations.
3.2 Survey
The survey was aimed at finding eight questions in which all four choices have equal
selection probability.
3.2.1 Task
The task is to choose one proverb that Canadian would like the most from the list of
four proverbs from countries other than Canada. First, 120 proverbs from Germany, Italy,
Russia, Japan, and France were chosen. All of these proverbs were translated into English.
Then, a Canadian individual was asked to review them and eliminate those that were
similar to an English proverb or those he had difficulty understanding.
As a result, the list of proverbs decreased to 97. Eighty proverbs were randomly chosen
from this list and divided to groups of four, resulting in twenty four-choice questions. These
questions are presented in Appendix A .

18
3.2.2 Participants
The participants in this survey were 111 students enrolled in the Organization Theory
course at The University of Waterloo who received course credit for their participation.
The participants were divided into four groups of 26, 29, 28 and 28 and each group was
asked to answer an on-line survey containing five questions.
3.2.3 Procedure
Each set of five questions were uploaded in one web page and the corresponding group
of participants were asked to visit the web page and answer the questions. The survey
started with a set of instructions presented in Appendix B. After reading the instructions
and entering their personal information (to receive the course credit), they were directed
to the first question. Each question was uploaded on one page. They had to answer a
question completely before advancing to the next one.
For each question, they were, first, asked to choose a proverb that they thought Cana-
dians would like the most and, then, write down a brief description of their reason. The
reasoning section was made a compulsory part of each question in order to move to the next
question and earn credit. By doing so, the participants were forced to spend some time
reading each question, thinking about the proverbs, and choosing one of them reasonably.
3.2.4 Result
The desired distribution for each question was a uniform distribution of(
14, 1
4, 1
4, 1
4
). A
goodness-of-fit test was performed for each question to test whether the question has the
desired distribution. Eight questions that passed the goodness-of-fit test with α = 0.05
and had the lowest test statistics were chosen for the group study.
Methodology 19
3.3 The Experiment
3.3.1 The Task
Each group consisted of four members. A group of four was chosen because it seems that
such a group can generate all the different scenarios such as:
• Majority:
– Strong majority: four individuals choosing the same answer e.g.,(a,a,a,a)
– Medium majority: three individuals choosing the same choice e.g.,(a,a,a,b)
– Weak majority: two individuals selecting the same answer while the other two
select answers that are different from majority and from each other e.g.,(a,a,b,c)
• Even split:
The situation in which two members choose one answer while the other two select
another choice e.g.,(a,a,b,b).
• Distributing over the choices
The condition in which each individual picks the choice different from others e.g.,(a,b,c,d)
The Task was to choose one proverbs that they think Canadians would like the most from
four choices provided . They were asked to, first, answer the question individually and,
then, have a group discussion and pick an answers as the group choice. Each group was
asked to perform the same task eight times. These eight questions that had the desired
characteristics discussed in Section 3.1 are presented in Appendix C.
20
3.3.2 Participants
The participants in this experiment were 79 undergraduate students enrolled in the Orga-
nization Theory course at The University of Waterloo who received course credit for their
participation and 4 graduate students who participated in the pilot study. Participation in
this experiment was voluntary and students received two bonus marks for participating in
the experiment with the opportunity of receiving two additional bonus marks depending
on their individual and group performance.
In order to participate in this experiment, the students were asked to register for their
desired time slot by visiting a web page designed for registrations. The web page included
a brief description of the study, instructions for registration, and the available time slots.
These instructions are included in Appendix D.
Although four participants were required for each experiment, five individuals were al-
lowed to register for each time slot. By doing so, the common situations that an experiment
needed to be canceled due to the absence of one individuals was avoided. In the cases that
all five participants showed up, the fifth person was assigned to an observer role.
3.3.3 Procedure
The experiment was set up in the Uncertainty Lab at the Management Sciences Department
at The University of Waterloo. Four cameras were used to video record the experiments.
Each camera focused on one of the participants. The participants were made aware of the
video recording before the registration process and, once more, before the experiment.
The group members sat around a round table with dividers assigning a quarter of the
table to each one of them. Each group member was assigned a color code written on a
piece of paper on their table segment: blue, green, red, and yellow.
To maintain consistency among all groups, the experiment instructions were video
recorded and projected for each group before they started the task. The instructions are
Methodology 21
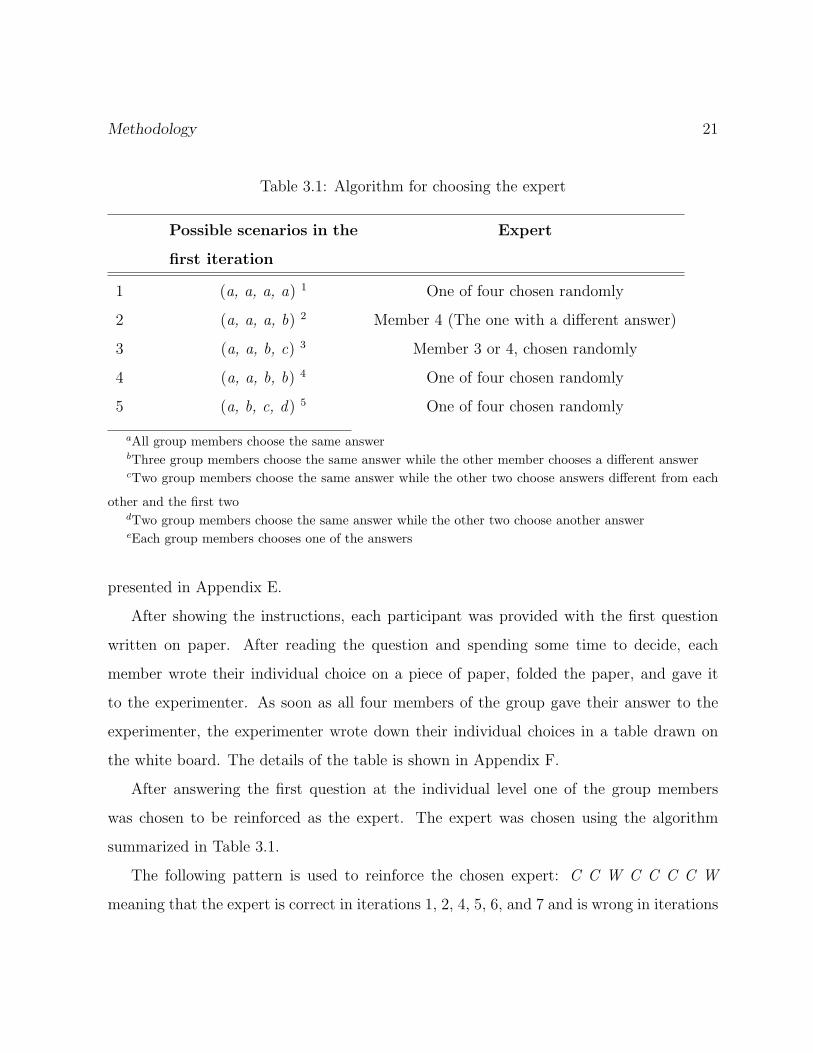
Table 3.1: Algorithm for choosing the expert
Possible scenarios in the
first iteration
Expert
1 (a, a, a, a) 1 One of four chosen randomly
2 (a, a, a, b) 2 Member 4 (The one with a different answer)
3 (a, a, b, c) 3 Member 3 or 4, chosen randomly
4 (a, a, b, b) 4 One of four chosen randomly
5 (a, b, c, d) 5 One of four chosen randomly
aAll group members choose the same answerbThree group members choose the same answer while the other member chooses a different answercTwo group members choose the same answer while the other two choose answers different from each
other and the first twodTwo group members choose the same answer while the other two choose another answereEach group members chooses one of the answers
presented in Appendix E.
After showing the instructions, each participant was provided with the first question
written on paper. After reading the question and spending some time to decide, each
member wrote their individual choice on a piece of paper, folded the paper, and gave it
to the experimenter. As soon as all four members of the group gave their answer to the
experimenter, the experimenter wrote down their individual choices in a table drawn on
the white board. The details of the table is shown in Appendix F.
After answering the first question at the individual level one of the group members
was chosen to be reinforced as the expert. The expert was chosen using the algorithm
summarized in Table 3.1.
The following pattern is used to reinforce the chosen expert: C C W C C C C W
meaning that the expert is correct in iterations 1, 2, 4, 5, 6, and 7 and is wrong in iterations
22
3 and 8. So, the correct answer in 6 out of 8 iterations is the same as the expert’s individual
choice. In the two iterations that the expert is wrong the correct answer is chosen randomly.
Following the individual choice, the group had a discussion to pick the group choice.
The time for discussion was not limited and there was no suggested process on how to come
up with the group choice. As the group announced its choice, the experimenter would write
down their group choice in the table on the white board followed by the correct answer
and then the next iteration would start.
The group members were told that this correct answer was based on the survey con-
ducted among the undergraduate students at The University of Waterloo while in fact ,as
discussed above, the correct answer was either the expert’s individual choice or chosen
randomly.
The group answered four questions following the procedure above. After the fourth
question, there was a mid-point discussion. The group had about five minutes to discuss
their own performance and plan a strategy to obtain better results. After the mid-point
discussion, they answered four more questions with the same procedure outlined above.
The participants were, then, asked to answer the questionnaire presented in Appendix
G. In answering the questionnaire, the participants’ overall senses were of interest rather
than their judgments based on the results. To reduce the effect of the results on their
response, the results table was hidden during the questionnaire.
In case all five individuals registered for the time slot showed up, one of them was asked
to be the observer. The observer did not participate in any group discussions, but instead
was asked to write an observation report on the interesting dynamics and events in the
group decision making process. The observer was also asked to answer the questionnaire
in Appendix H at the end of the experiment.
Chapter 4
Results
4.1 Experimental Data
The table presented in Appendix F was completed for each group during their experiment.
Details of all group experiments are presented in Appendix I.
All participants completed a questionnaire presented in Appendices G and H at the
end of the experiment. Data acquired from the questionnaires were divided into three
categories: group members excluding experts, experts, and observers and is available in
Appendix J: Table J.1, Table J.2, and Table J.3, respectively.
4.2 Expert Recognition
Question 1 in the questionnaire was designed to test Hypothesis 1. The answers to this
question demonstrate that group members, including the expert, recognized the expert as
the individual with the best performance. Tables J.1 and J.2 show that 98% of group
members excluding the expert and 89% of the experts believed that someone was better
than others in the group task. Moreover, in all cases, the person recognized by the group
23
24
as the best performer was the same person that reinforced as the expert.
Although these statistics strongly supported the first hypothesis, analysis presented in
section 4.3 further confirmed the result. The influence of the expert on group members and
how the expert’s influence increased over iterations is discussed in section 4.3. Evidently,
this would be impossible without first recognizing someone as the expert in the group.
4.3 Expert Influence
The main hypothesis of this study is the second one which discusses the expert’s influence
on other group members during the group decision making process. This hypothesis was
tested in three different ways, each capturing a different aspect of the problem. In next
sections, these three approaches are discussed.
4.3.1 Expert Followership
In order to measure the degree by which the group follows the expert in their group choice,
a measure called ”Expert Followership” was defined. Expert followership for each iteration
is 1 or 0 representing whether the group choice is the same as the expert’s individual choice
or not, respectively. Expert followership for n iterations is the sum of expert followership of
the n iterations. In this experiment the expert followership for the first four iterations was
compared to that of the last four. I expected the group to recognize the expert gradually
and, hence, the influence of the expert to increase over iterations. Therefore, I believed
that the expert followership in the last four iterations should be significantly greater than
that of the first four. Expert followership of all groups are presented in Table 4.1.
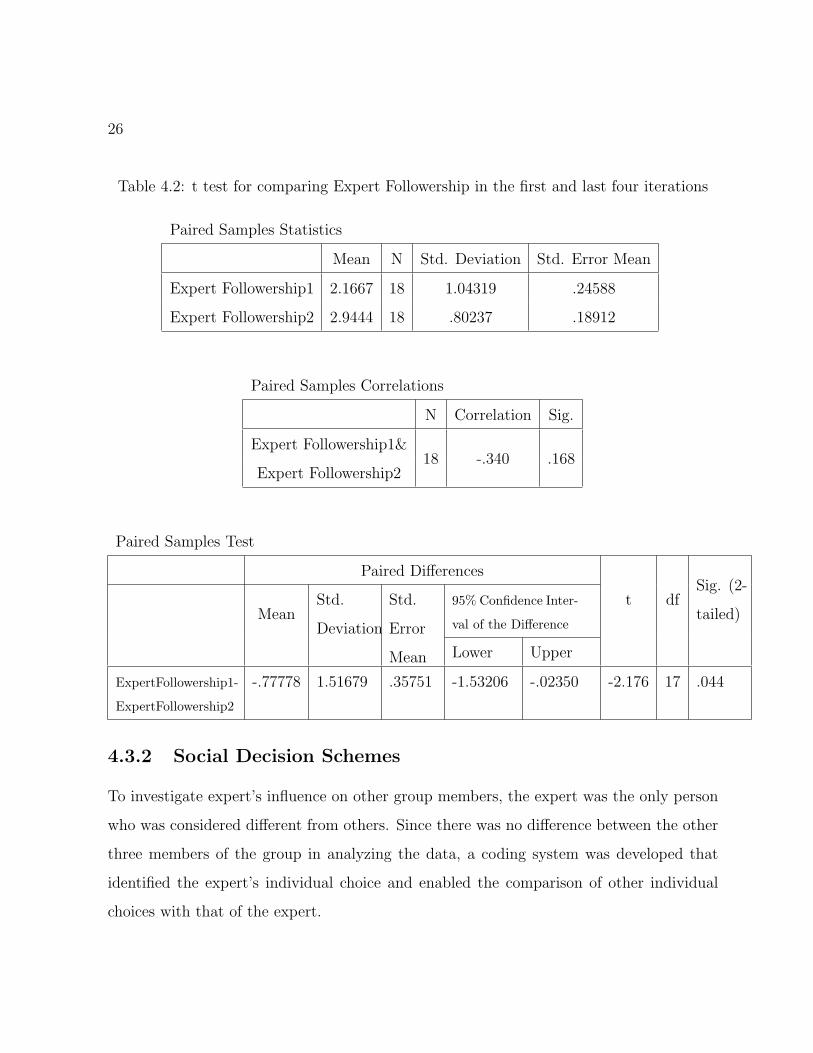
Table 4.2 provides the result of the t test1. Since the sample size (n=18) was not large,
normality tests were also performed for both data sets. The normality tests confirmed that
1The statistical analysis was done using the SPSS package.

Results 25
Table 4.1: Expert followership in the first and last four iterations
Expert followership
First four iterations Last four iterations
Group 1 1 4
Group 2 3 2
Group 3 0 3
Group 4 4 3
Group 5 1 3
Group 6 1 4
Group 7 3 3
Group 8 1 3
Group 9 2 3
Group 10 3 2
Group 11 3 3
Group 12 2 4
Group 13 3 3
Group 14 2 3
Group 15 3 3
Group 16 2 4
Group 17 3 2
Group 18 2 1
both data sets followed a normal distribution. Therefore, the t test was valid for comparing
the mean of these two data sets. The t test indicated that expert followership for the last
four iterations was significantly larger than that of the first four.
26
Table 4.2: t test for comparing Expert Followership in the first and last four iterations
Paired Samples Statistics
Mean N Std. Deviation Std. Error Mean
Expert Followership1 2.1667 18 1.04319 .24588
Expert Followership2 2.9444 18 .80237 .18912
Paired Samples Correlations
N Correlation Sig.
Expert Followership1&18 -.340 .168
Expert Followership2
Paired Samples Test
Paired Differences
t dfSig. (2-
tailed)MeanStd.
Deviation
Std.
Error
Mean
95% Confidence Inter-
val of the Difference
Lower Upper
ExpertFollowership1-
ExpertFollowership2
-.77778 1.51679 .35751 -1.53206 -.02350 -2.176 17 .044
4.3.2 Social Decision Schemes
To investigate expert’s influence on other group members, the expert was the only person
who was considered different from others. Since there was no difference between the other
three members of the group in analyzing the data, a coding system was developed that
identified the expert’s individual choice and enabled the comparison of other individual
choices with that of the expert.

Results 27
For the purpose of this analysis, a four letter sequence was used to show each group’s
individual choices. The leftmost letter represents the expert’s individual choice and the
nest three letters represent individual choices of other group members. The expert’s choice
is labeled A, while, in fact, it could be either a, b, c, or d. All other member choices that
were the same as the expert’s were also labeled A. The remaining member choices were all
labeled B if they are all the same, two labeled B and one C if two were the same and one
differs, and labeled B, C and D if they were all different. The four letter sequence was
constructed by ordering the labels alphabetically.
All iterations for all groups were categorized, first, based on the individual choices and,
then, based on the group choice. The group choice was either the expert’s choice, or a
non-expert choice. A non-expert choice was further divided into three categories: majority
choice, minority choice, and the choice not advocated by any group member. Tables 4.3 and
4.4 present the frequency of each category in the first and last four iterations, respectively.
Table 4.3: Obtained frequency - First four trials
Possible
scenarios at
Individual level
Frequency
Group Choice
Expert ChoiceNon Expert Choice
Majority Minority Not Advocated
AAAA 3 3 0
AAAB 15 14 1 0
AABB 11 7 4 0
AABC 10 7 3 0
ABBB 7 0 7 0
ABBC 19 5 9 3 2
ABCD 7 3 4
Eleven different social decision schemes were tested against the obtained results. Each
28
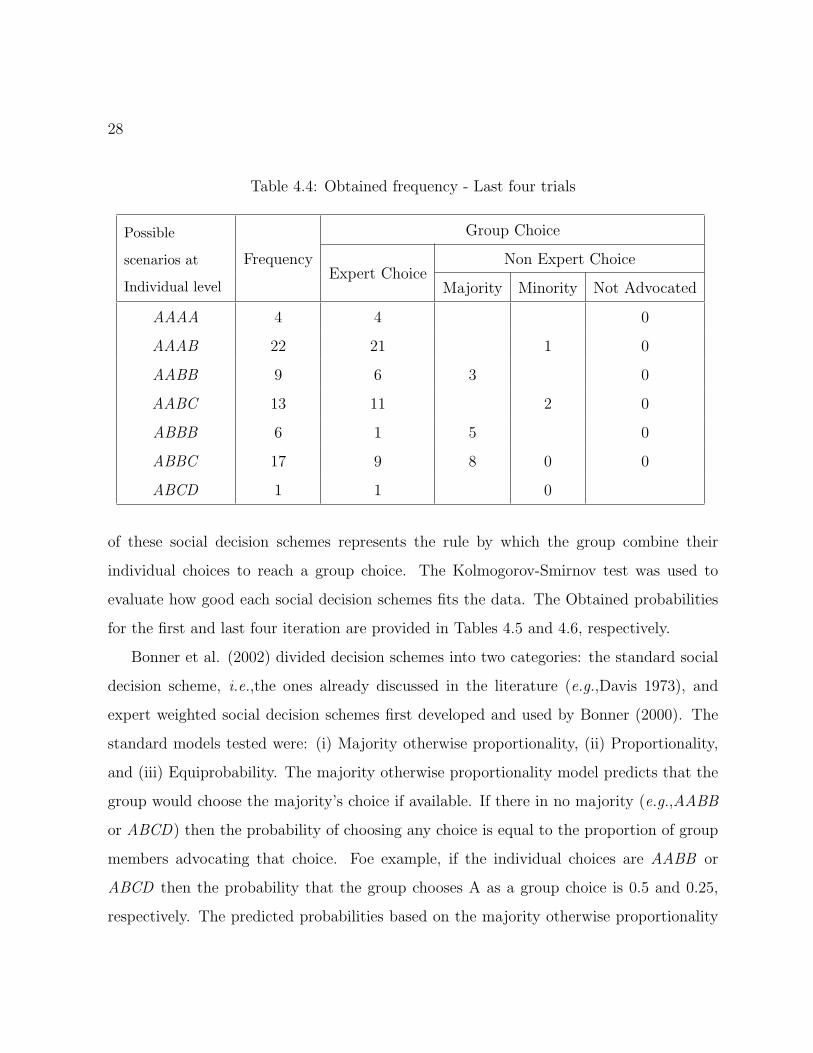
Table 4.4: Obtained frequency - Last four trials
Possible
scenarios at
Individual level
Frequency
Group Choice
Expert ChoiceNon Expert Choice
Majority Minority Not Advocated
AAAA 4 4 0
AAAB 22 21 1 0
AABB 9 6 3 0
AABC 13 11 2 0
ABBB 6 1 5 0
ABBC 17 9 8 0 0
ABCD 1 1 0
of these social decision schemes represents the rule by which the group combine their
individual choices to reach a group choice. The Kolmogorov-Smirnov test was used to
evaluate how good each social decision schemes fits the data. The Obtained probabilities
for the first and last four iteration are provided in Tables 4.5 and 4.6, respectively.
Bonner et al. (2002) divided decision schemes into two categories: the standard social
decision scheme, i.e.,the ones already discussed in the literature (e.g.,Davis 1973), and
expert weighted social decision schemes first developed and used by Bonner (2000). The
standard models tested were: (i) Majority otherwise proportionality, (ii) Proportionality,
and (iii) Equiprobability. The majority otherwise proportionality model predicts that the
group would choose the majority’s choice if available. If there in no majority (e.g.,AABB
or ABCD) then the probability of choosing any choice is equal to the proportion of group
members advocating that choice. Foe example, if the individual choices are AABB or
ABCD then the probability that the group chooses A as a group choice is 0.5 and 0.25,
respectively. The predicted probabilities based on the majority otherwise proportionality
Results 29
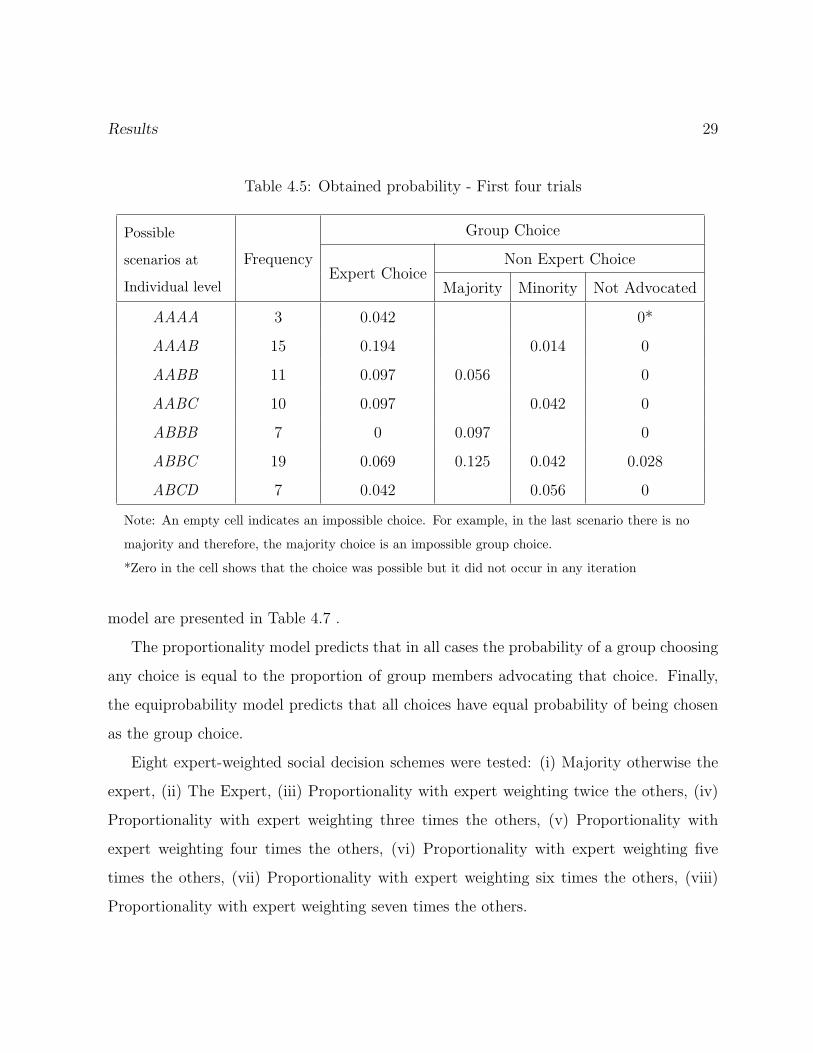
Table 4.5: Obtained probability - First four trials
Possible
scenarios at
Individual level
Frequency
Group Choice
Expert ChoiceNon Expert Choice
Majority Minority Not Advocated
AAAA 3 0.042 0*
AAAB 15 0.194 0.014 0
AABB 11 0.097 0.056 0
AABC 10 0.097 0.042 0
ABBB 7 0 0.097 0
ABBC 19 0.069 0.125 0.042 0.028
ABCD 7 0.042 0.056 0
Note: An empty cell indicates an impossible choice. For example, in the last scenario there is no
majority and therefore, the majority choice is an impossible group choice.
*Zero in the cell shows that the choice was possible but it did not occur in any iteration
model are presented in Table 4.7 .
The proportionality model predicts that in all cases the probability of a group choosing
any choice is equal to the proportion of group members advocating that choice. Finally,
the equiprobability model predicts that all choices have equal probability of being chosen
as the group choice.
Eight expert-weighted social decision schemes were tested: (i) Majority otherwise the
expert, (ii) The Expert, (iii) Proportionality with expert weighting twice the others, (iv)
Proportionality with expert weighting three times the others, (v) Proportionality with
expert weighting four times the others, (vi) Proportionality with expert weighting five
times the others, (vii) Proportionality with expert weighting six times the others, (viii)
Proportionality with expert weighting seven times the others.

30
Table 4.6: Obtained probability - Last four trials
Possible
scenarios at
Individual level
Frequency
Group Choice
Expert ChoiceNon Expert Choice
Majority Minority Not Advocated
AAAA 4 0.056 0
AAAB 22 0.292 0.014 0
AABB 9 0.083 0.042 0
AABC 13 0.153 0.028 0
ABBB 6 0.014 0.069 0
ABBC 17 0.125 0.111 0 0
ABCD 1 0.014 0 0
Table 4.7: Predicted probability: majority otherwise proportionality
Possible
scenarios at
Individual level
Group Choice
Expert ChoiceNon Expert Choice
Majority Minority Not Advocated
AAAA 0.056 0
AAAB 0.306 0 0
AABB 0.063 0.063 0
AABC 0.181 0 0
ABBB 0 0.083 0
ABBC 0 0.236 0 0
ABCD 0.003 0.010 0
The majority otherwise the expert model predicted that the group would choose the
majority’s choice if available. If there was no majority, the expert choice would be chosen.
Results 31
The expert model predicts that the group always chooses the expert’s choice. The other
six decision schemes predict that the probability of choosing any choice was equal to the
proportion of group members advocating that choice but, the influence of the expert is
inflated by counting the expert as more than one member (i.e.,twice, three times, . . . , seven
times). For example, in the proportionality with expert weighting four times compared to
others, the expert acts as five members instead of one. In other words, in a group of four
members, the expert receives a 55+3
proportion of the influence and each one of the other
three members receives a 15+3
proportion of the influence.
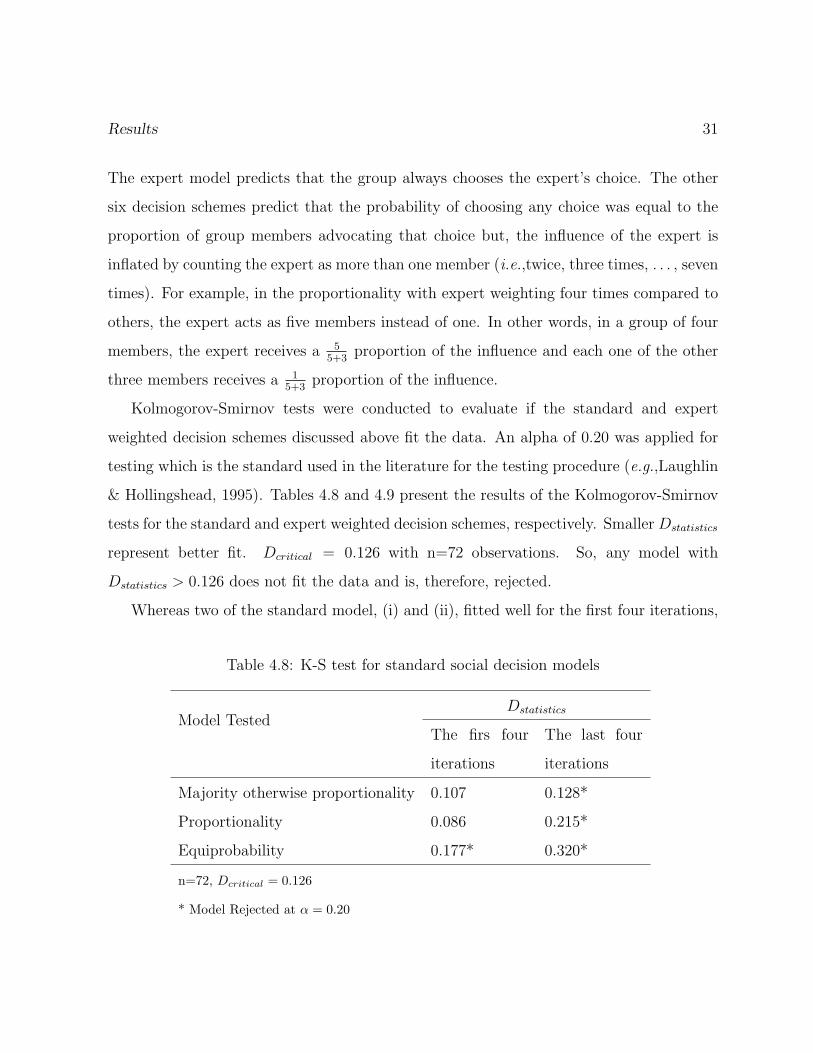
Kolmogorov-Smirnov tests were conducted to evaluate if the standard and expert
weighted decision schemes discussed above fit the data. An alpha of 0.20 was applied for
testing which is the standard used in the literature for the testing procedure (e.g.,Laughlin
& Hollingshead, 1995). Tables 4.8 and 4.9 present the results of the Kolmogorov-Smirnov
tests for the standard and expert weighted decision schemes, respectively. Smaller Dstatistics
represent better fit. Dcritical = 0.126 with n=72 observations. So, any model with
Dstatistics > 0.126 does not fit the data and is, therefore, rejected.
Whereas two of the standard model, (i) and (ii), fitted well for the first four iterations,
Table 4.8: K-S test for standard social decision models
Model TestedDstatistics
The firs four
iterations
The last four
iterations
Majority otherwise proportionality 0.107 0.128*
Proportionality 0.086 0.215*
Equiprobability 0.177* 0.320*
n=72, Dcritical = 0.126
* Model Rejected at α = 0.20
32
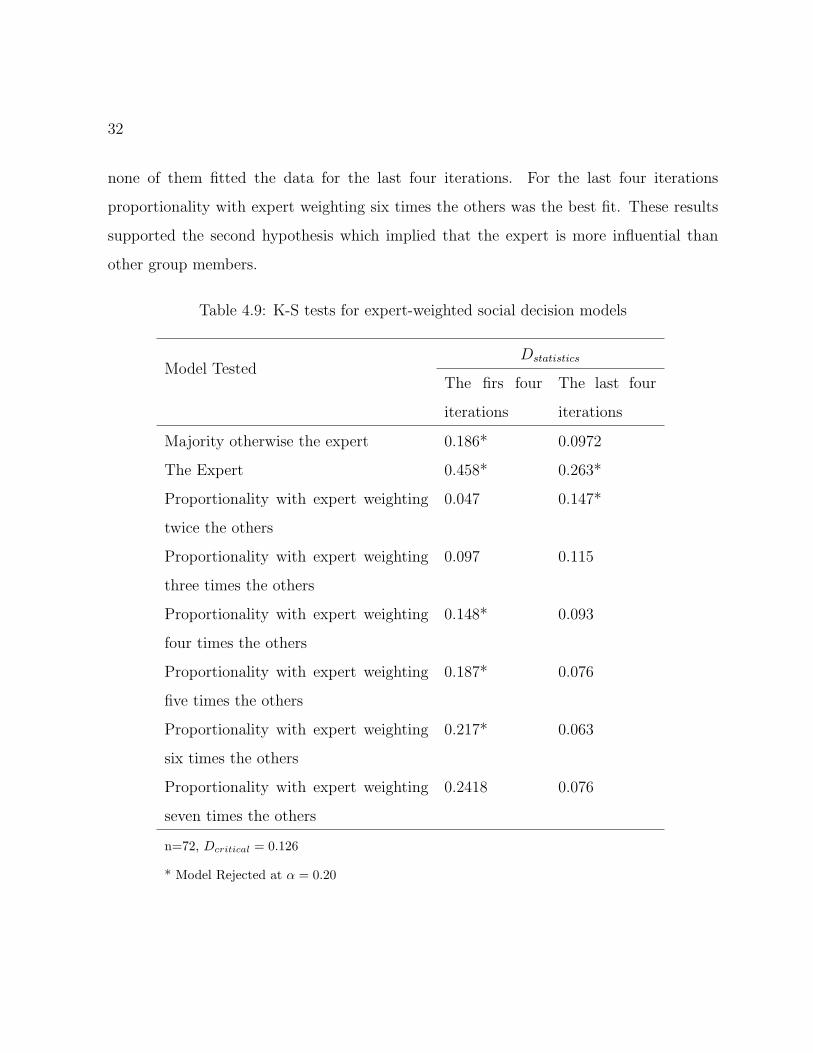
none of them fitted the data for the last four iterations. For the last four iterations
proportionality with expert weighting six times the others was the best fit. These results
supported the second hypothesis which implied that the expert is more influential than
other group members.
Table 4.9: K-S tests for expert-weighted social decision models
Model TestedDstatistics
The firs four
iterations
The last four
iterations
Majority otherwise the expert 0.186* 0.0972
The Expert 0.458* 0.263*
Proportionality with expert weighting
twice the others
0.047 0.147*
Proportionality with expert weighting
three times the others
0.097 0.115
Proportionality with expert weighting
four times the others
0.148* 0.093
Proportionality with expert weighting
five times the others
0.187* 0.076
Proportionality with expert weighting
six times the others
0.217* 0.063
Proportionality with expert weighting
seven times the others
0.2418 0.076
n=72, Dcritical = 0.126
* Model Rejected at α = 0.20
Results 33
4.3.3 Information Analysis
Although the expert was reinforced as being correct in most iterations (6 out of 8 itera-
tions), the answers chosen by other members were not under our control. Different answers
by non-expert members resulted in different scenarios, each providing different amount of
information regarding the expert. For example, compare the scenario in which one member
chooses the correct answer and other group members choose the same wrong answer with
another scenario in which all members select the correct answer. When the correct answer
is announced at the end of the iteration the amount of information conveyed regarding
the expertise level of each individual is not the same in the two scenarios. The correct
individual in the first scenario stands out more than the correct members in the second
scenario. Since only one person was correct in the first scenario and everyone else chose
the same wrong answer, it appears that finding the correct answer was difficult and, there-
fore, the correct person exhibits higher expertise. Whereas in the second scenario, since
all members selected the correct answer, it seems that finding the correct answer did not
require a high level of expertise.
To measure the information conveyed, a pointing system was defined based on the
scenario occurring in each iteration. Each group member received a positive or negative
point in each iteration for providing a correct or incorrect answer, respectively. The ab-
solute value of the point represents by how much the person stands out in the group and
is based on the scenario occurring in that iteration. In extreme scenarios of standing out
in which one person is correct and everyone else chooses the same wrong answer or one
person is wrong and everyone else chooses the same correct answer, the person is assigned
points 1 and -1, respectively. All other scenarios are ordered in order of standing out and
assigned points between -1 and 1, subjectively. Table 4.10 presents the points assigned
to each person in each scenario. The first column shows all possible scenarios and the
second presents the points assigned to each individual in that scenario. For example, (C,
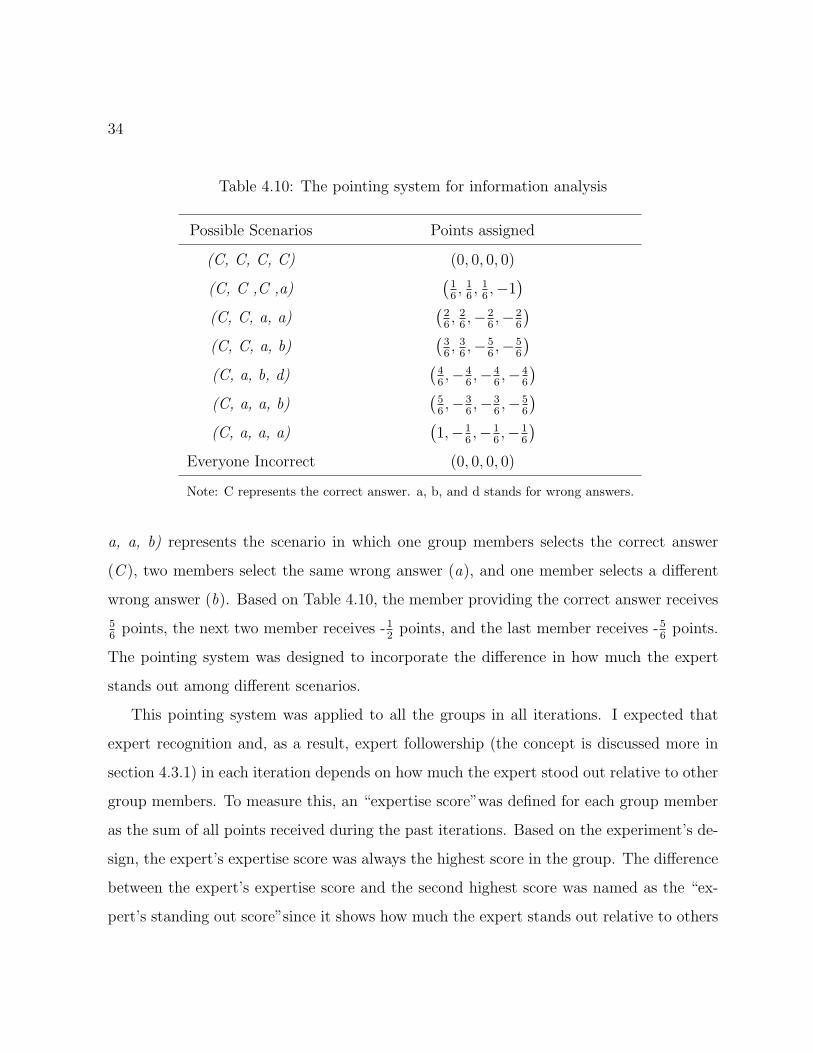
34
Table 4.10: The pointing system for information analysis
Possible Scenarios Points assigned
(C, C, C, C) (0, 0, 0, 0)
(C, C ,C ,a)(
16, 1
6, 1
6,−1
)(C, C, a, a)
(26, 2
6,−2
6,−2
6
)(C, C, a, b)
(36, 3
6,−5
6,−5
6
)(C, a, b, d)
(46,−4
6,−4
6,−4
6
)(C, a, a, b)
(56,−3
6,−3
6,−5
6
)(C, a, a, a)
(1,−1
6,−1
6,−1
6
)Everyone Incorrect (0, 0, 0, 0)
Note: C represents the correct answer. a, b, and d stands for wrong answers.
a, a, b) represents the scenario in which one group members selects the correct answer
(C ), two members select the same wrong answer (a), and one member selects a different
wrong answer (b). Based on Table 4.10, the member providing the correct answer receives
56
points, the next two member receives -12
points, and the last member receives -56
points.
The pointing system was designed to incorporate the difference in how much the expert
stands out among different scenarios.
This pointing system was applied to all the groups in all iterations. I expected that
expert recognition and, as a result, expert followership (the concept is discussed more in
section 4.3.1) in each iteration depends on how much the expert stood out relative to other
group members. To measure this, an “expertise score”was defined for each group member
as the sum of all points received during the past iterations. Based on the experiment’s de-
sign, the expert’s expertise score was always the highest score in the group. The difference
between the expert’s expertise score and the second highest score was named as the “ex-
pert’s standing out score”since it shows how much the expert stands out relative to others

Results 35
Figure 4.1: Expert standing out and followership
in the group. I predicted that the probability of the group choosing the expert’s choice as
the group choice would be higher when the expert’s standing out score was higher. The
first iteration was excluded from the analysis due to unavailability of expertise scores. Fig-
ure 4.1 displays the relationship between the expert’s standing out score at the beginning
of an iteration and the expert followership at the end of the iteration for all groups. As
the expert’s standing out score increased, expert followership was more frequent. As can
be seen in Figure 4.1, the groups in this study always chose the expert choice beyond a
threshold expert’s standing out score of 4.
A t test was also conducted to investigate whether the expert’s standing out score
differs between iterations that groups followed the expert and the ones that groups did not
follow the expert. My prediction was that the expert’s standing out score in iterations in
which expert followership equals one is greater than that of the iterations in which expert
followership equals zero. The result of the t test is summarized in Table 4.11. The t test
supported the prediction.

36
Table 4.11: t test- expert’s standing out score under different EF
Group Statistics
N Mean Std. Deviation Std. Error Mean
EF0 39 1.4662 .84642 .13554
EF1 87 2.0913 1.47896 .15856
Independent Samples Test
Levene’s Test
for Equality
of Variances
t-test for Equality of Means
Sig.(2-
tailed)
Mean
Difference
Std.
Error
Difference
95% Confidence
Interval of the
Difference
F t Sig. df Lower Upper
Equal variances
assumed
11.840 .001 -2.46 124 .015 -.62511 .25394 -1.12774 -.12248
Equal variances
not assumed
-2.99 116.6 .003 -.62511 .20859 -1.03823 -.21199
4.3.4 Expert Influence at the Individual Level
Sections 4.3.1, 4.3.2, and 4.3.3 discussed the expert influence on the group choice. However,
I predicted that the expert influences not only the group choice but also the individual
choices of the group members. Based on the survey results discussed in section 3.2, one
can assume that all choices have equal probability to be chosen at the individual level in all
eight questions. This means that the individual choices should be distributed evenly over
different choices. Moreover, there should not be a significant difference in the distribution

Results 37
of individual choices between the first and last four iterations. Thus, a significant difference
can be attributed to the effects of the expert on individual choices. I predicted that group
members try to understand and mimic the expert’s logic in answering the questions and,
therefore, in the last four iterations the individual choices would converge to some degree.
The number of unselected choices in the first and last four iteration were counted as a
measure of convergence. Having more unselected choices means that the individuals are
converging on some choices and their selections are not distributed evenly among all choices.
The result of the t test conducted is summarized in Table 4.12. The t test supported the
hypothesis indicating that the individuals convergence on the same answer in the last four
iterations was greater than that of the first four.
4.4 Other Results
This section presents the analysis on the questionnaire that individuals completed after
the experiment (Appendix G).
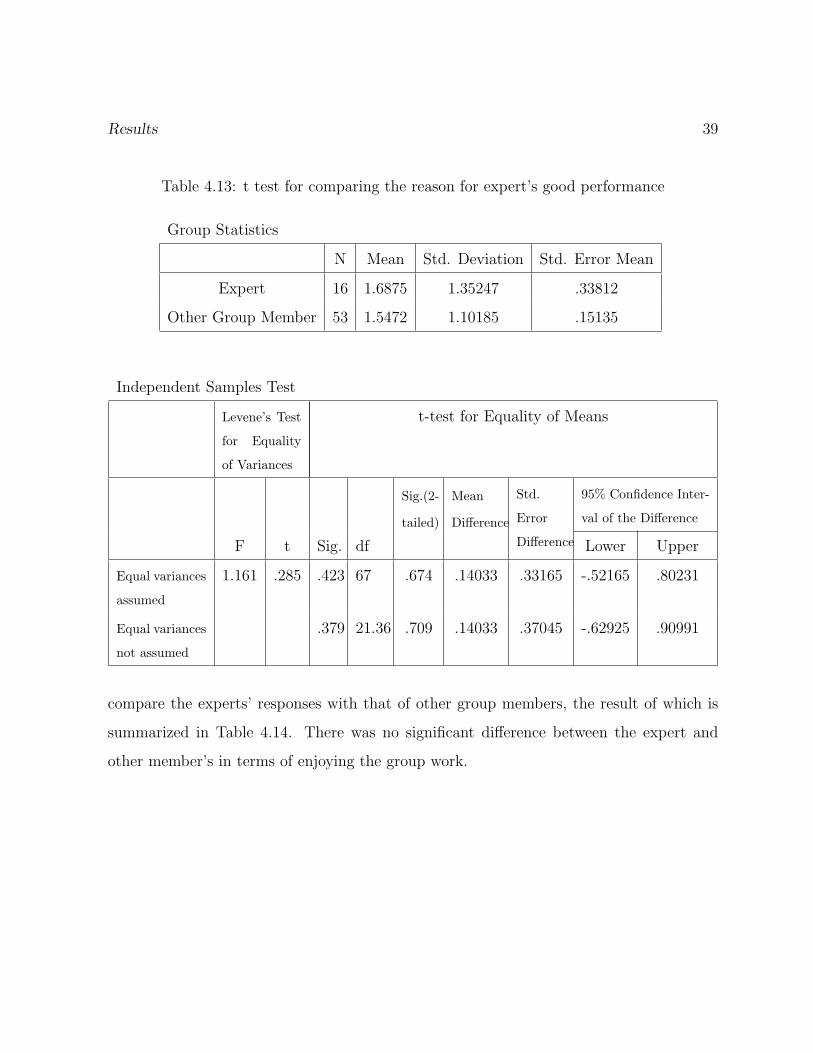
4.4.1 Reason for Expert’s Performance
All participants, including the expert, were asked in the questionnaire to indicate, on a
scale, whether the expert’s choice was based on ”pure luck” or ”good judgment”. Experts
were judging their own performance while other members were judging the expert. I
expected to see a difference between the answers provided by the experts and those provided
by other members. Therefore, a t test was conducted, the result of which is presented in
Table 4.13. As shown in Table 4.13, the difference was not significant and the hypothesis
is not supported.

38
Table 4.12: t test for comparing convergence in the first and last four iterations
Paired Samples Statistics
Mean N Std. Deviation Std. Error Mean
Unselected choices1 5.7778 18 1.21537 .28647
Unselected choices2 6.4444 18 1.46417 .34511
Paired Samples Correlations
N Correlation Sig.
Unselected choices1&18 .422 .081
Unselected choices2
Paired Samples Test
Paired Differences
t dfSig. (2-
tailed)MeanStd.
Deviation
Std.
Error
Mean
95% Confidence Inter-
val of the Difference
Lower Upper
Unselected choices1-
Unselected choices2
-.66667 1.45521 .34300 -1.39033 .05699 -1.944 17 .069
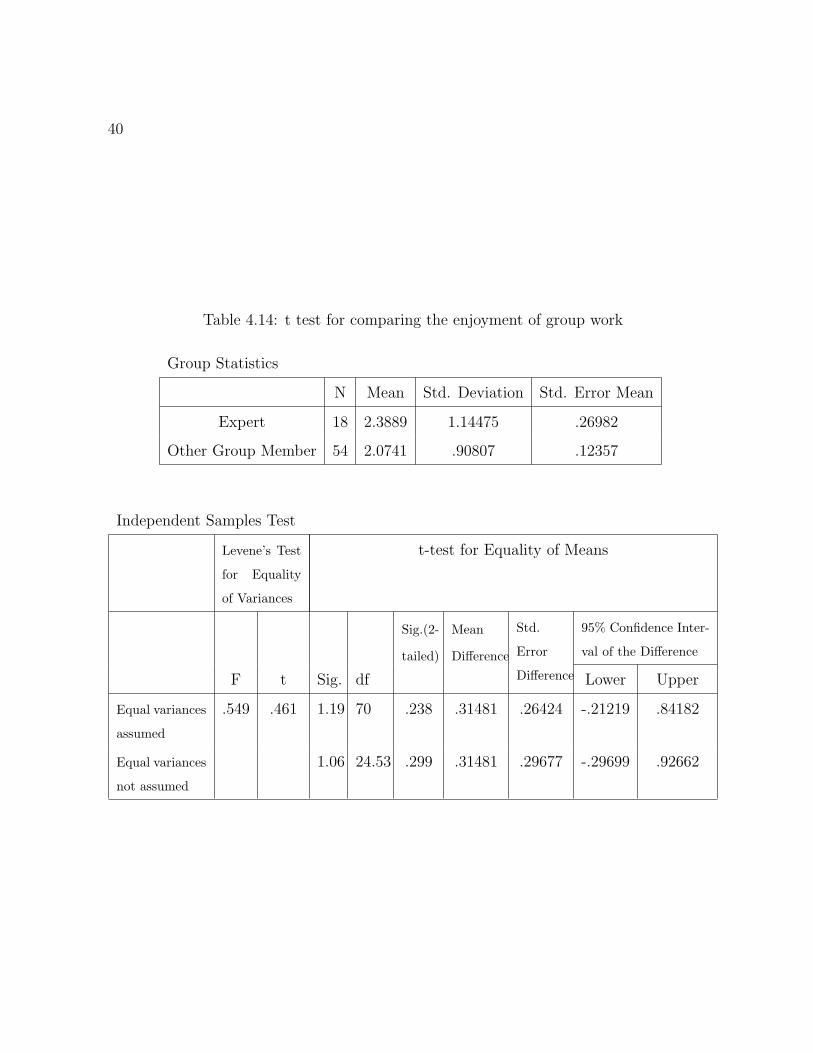
4.4.2 Enjoying Group work
Another question was whether there was any difference between the amount of enjoyment
that experts experience during the experiment and that of other members. Did being
correct most of the times result in more enjoyment from the group work? The questionnaire
asked if the group members enjoyed the group work. The participants could choose on a
scale of -3 to 3 ranging from ”Not at all” to ”Very much”. A t test was performed to
Results 39
Table 4.13: t test for comparing the reason for expert’s good performance
Group Statistics
N Mean Std. Deviation Std. Error Mean
Expert 16 1.6875 1.35247 .33812
Other Group Member 53 1.5472 1.10185 .15135
Independent Samples Test
Levene’s Test
for Equality
of Variances
t-test for Equality of Means
Sig.(2-
tailed)
Mean
Difference
Std.
Error
Difference
95% Confidence Inter-
val of the Difference
F t Sig. df Lower Upper
Equal variances
assumed
1.161 .285 .423 67 .674 .14033 .33165 -.52165 .80231
Equal variances
not assumed
.379 21.36 .709 .14033 .37045 -.62925 .90991
compare the experts’ responses with that of other group members, the result of which is
summarized in Table 4.14. There was no significant difference between the expert and
other member’s in terms of enjoying the group work.
40
Table 4.14: t test for comparing the enjoyment of group work
Group Statistics
N Mean Std. Deviation Std. Error Mean
Expert 18 2.3889 1.14475 .26982
Other Group Member 54 2.0741 .90807 .12357
Independent Samples Test
Levene’s Test
for Equality
of Variances
t-test for Equality of Means
Sig.(2-
tailed)
Mean
Difference
Std.
Error
Difference
95% Confidence Inter-
val of the Difference
F t Sig. df Lower Upper
Equal variances
assumed
.549 .461 1.19 70 .238 .31481 .26424 -.21219 .84182
Equal variances
not assumed
1.06 24.53 .299 .31481 .29677 -.29699 .92662
Chapter 5
Discussion and Conclusion
5.1 Discussion
This section discusses the results presented in Chapter 4 and additional observations from
the experiment.
5.1.1 Expert Recognition
As mentioned in Section 4.2, group members including the expert were successful in rec-
ognizing the expert. Furthermore, the group believed that the expert’s good performance
was more due to good judgment rather than luck, yet another evidence that group mem-
bers accepted the expert as someone with good performance. Although it seems that the
feedback system and the presentation of results on the board helped the group recognize
the expert, it is interesting that group members attributed the expert’s performance to
the good judgment of the expert. In addition, this result confirmed that the experiment
setting was appropriate and that group members did not suspect any manipulation. My
observation of the group discussions also support the face validity of the experiment.
41

42
5.1.2 Expert Influence
Data analysis in Chapter 4 supports the second hypothesis that the expert has more
influence on the decision making process than any other group member. In the first four
iterations the expert is identified gradually and, therefore, in the second four iterations the
group has already recognized the expert and, as a result, follows the expert. The influence
of the expert is seen in two different ways:
First, other group members try to understand the expert’s logic and apply it at the
individual level. I observed so many examples of this behavior in the group discussions,
i.e.,The group asked the expert about his/her reason for selecting the (correct) answer in
each iterations. The analysis presented in section 4.3.4 marginally supports this idea, as
well. Although the questions were designed such that all choices had equal probability to
be chosen at the individual level, the group’s convergence on the same answer increased
in the last four iterations indicating that group members were trying to understand and
apply the expert’s logic in answering the question. I believe that the convergence could
have been greater had the expert had a clearer and more understandable reason for his/her
choices. In some cases, the expert was not able to provide any reason for selecting an answer
when asked to do so by other group members. Thus, following the expert’s logic at the
individual level was not an easy task for the group. Since the group recognized and followed
the expert simultaneously in the last four iterations, one can conclude that the group was
trying to mimic the expert at the individual level. Certainly, further investigation is needed
to support this idea.
Second, regardless of being successful in understanding and applying the expert’s logic,
the groups followed the experts in their group choices. Several instances were observed
that the group trusted the expert’s choice even when the expert did not mention a certain
logic for his/her choice. Three different approaches applied to analyze the data confirmed
that the expert’s influence on the group decision making increased over iterations.

Discussion and Conclusion 43
The first approach compared expert followership in the first and last four iterations.
The t test presented in Table 4.1 indicates that expert followership in the last four iterations
were significantly higher than that of the first four, meaning that group members selected
the expert’s choice as their group choice more often when they recognized the expert.
The second approach, based on Table 4.8, revealed that the best decision scheme model
fitting the data set in the last four iterations was the proportionality model with expert
weighting six times the others and none of the standard decision scheme models was a
suitable fit to the data. Although, the exact number of six is not very reliable and might
change in different settings, comparing this model with the ones that fit the first four
iterations confirms that the influence of the expert increased substantially in the last four
iterations. Two standard and two expert-weighted decision scheme models fit the data set
for the first four iterations. The reason that expert-weighted models were a goof fit for the
data in the first four iterations is that the expert was emerging gradually over iterations.
So, the effect of the expert existed even in the first four iterations. The expert’s emergence
in the groups happened over time. A clear frontier that distinguishes between the time
that groups did not follow the expert and the time they did was not found. Moreover, the
expert recognition happened at different times in different groups based on the amount of
information conveyed regarding the expertise level of the expert (This concept is discussed
in Section 4.3.3).
The third approach used to analyze the data was information analysis. As discussed in
Section 4.3.3, the analysis showed that the amount of information conveyed to the group
regarding each individuals expertise level is important in recognizing and following the
expert. It is not only the expert’s performance that is important, rather it is the difference
between the expert’s performance and the second best performer in the group. For example,
if the expert was correct in eight out of eight iterations and other group members were
correct in seven, seven, and six iterations, there is no significant difference between the
expert and other members and, consequently, the group might not recognize anyone as

44
the expert. In contrast, assume the scenario in which the expert was correct in six out of
eight iterations while other group members were correct in one, two, and three iterations.
Although the expert was correct in fewer iterations in the latter scenario comparing to the
former, the expert stands out more and is recognized more often in the latter scenario.
5.1.3 Reason for Expert’s Performance
For the Expert’s good performance, the t test presented in Table 4.13 indicates that there
is no significant difference between the reason provided by the expert and the one by
other members. Both groups, experts and other group members, attribute the expert’s
performance to expert’s good judgment more than to pure luck. This result is analyzed in
two aspects: expert’s perception and other group members’ perception.
It is interesting that experts attributed their own performance to good judgment. It
seems that experts were successful in finding a logic for answering the question. Therefore,
the experts believed that it is not his luck but rather their good judgment that makes them
experts. Attribution theory can help in explaining the experts’ behavior in this matter.
This theory categorizes the way people attribute causes to events into two types: the
internal (dispositional) attribution and the external (positional) attribution. An internal
attribution assigns causality to factors within the person, e.g.,one’s intelligence. Whereas,
External attribution assigns causality to an outside factor, e.g.,the weather. In addition,
self serving attribution occurs when people want to claim responsibility for a success. If
something good happens to them or someone they like, they tend to see it as a result of
their own characteristics. In this study, when experts were asked to find a reason for their
good performance, based on the self serving attribution, they attributed it to the internal
factor, i.e.,their good judgment rather than the external factor, i.e.,luck.
Self serving attribution also declares that if something good happens to someone that
one like, one tend to see it as a result if the internal (dispositional) causes. This explains

Discussion and Conclusion 45
why other group members also attributed the expert’s good performance to the expert’s
good judgment. One might question the good relationship between the expert and other
group members. However, in the current study, the answers to Questions 4 and 5 of the
questionnaire (Appendices G and J) implicitly confirmed that there was a good relationship
between all the group members.
5.1.4 Enjoying Group work
The result of the t test presented in Table 4.14 indicated that there was no significant
difference between the experts’ enjoyment and other group members’ enjoyment from the
group work. At first glance, one might expect that the person with the best performance,
i.e.,the expert, should experience more enjoyment compared to other group members. But,
the analysis results did not support this expectation. My explanation of this result is as
follows. First, since the group also received bonus marks based on their group choice,
all members benefited when the group followed the expert in their group choice. So, the
satisfaction form finding the correct answer was not exclusive to the expert but shared by
other group members, as well. Second, as discussed further in section 5.1.5, the expert
experienced pressure from the group members to deliver the correct answer. This pressure
decreased the expert’s satisfaction from group work.
5.1.5 Other Observations
In addition to the results discussed in previous sections, other observations were made
during the experiment. This section discusses these observations that can be regarded as
starting points for future research.
First, most of the groups recognized the expert in the mid point discussion after the
fourth iteration. 75% of the recognized expert at this point were the actual experts. The
main reason for this fast expert recognition could be the direct feedback provided at the
46
end of each iteration and also the presentation of all results on the board. The purpose
of the mid point discussion was to find a strategy that helps the group improve their
performance. Most of the groups looked at the board during the mid point discussion
to see how well their group and each individual has performed. In a few groups expert
recognition happened even before the mid point discussions. It seems that in a vague tasks,
i.e.,one that the group has no clue about the answer and has no obvious way of finding
it, group members are desperately looking for a pattern or a person to follow. This might
have fostered the process of expert recognition. Certainly, further investigation is needed
to test this prediction.
Second, a common observation in most groups was that the experts experienced pressure
from other group members to deliver the correct answer. Group expectation from an
expert increased with the gradual recognition of the expert. The experts dealt with this
pressure in different ways. In some groups the experts needed more time to select their
individual choices after being recognized by the group compared to before. The experts
were clearly trying their best to choose the correct answer. In some other groups, as the
groups identified the experts and decided to follow the experts’ individual choices, the
experts tried to persuade them that they are not confident about their choices or in some
cases the experts changed their choices in favor of the majority during the discussion. One
might argue that there was a majority pressure on the expert. Although this might be
correct to some extent, it is not the main reason for the experts’ behavior because in this
case the majority did not put any effort into persuading the expert (minority). In fact the
majority was willing to select the expert’s choice due to the expert’s previous performance.
I believe the main reason for the experts’ behavior was that they did not want to be blamed
if the answer was wrong. In other words, the experts preferred to change their answers in
favor of the majority to distribute the blame among the majority if the answer was wrong.
Third, since the task assigned to groups was vague and no specific logic existed for
answering the questions, group members were seeking a pattern to answer the questions.

Discussion and Conclusion 47
Different groups examined different kind of patterns. Some groups analyzed the previous
questions and answers and found simple patterns, e.g.,a pattern suggesting that Canadians
are obsessed with money so they should choose the proverb that is somehow related to
money or the shortest proverb among the choices. In other cases, group members analyzed
the scenarios that happened before in their group. For example, they looked at whether
the majority was correct in previous iteration or whether a certain individual was correct.
In fact, this was the case that resulted in recognizing and, consequently, fallowing the
expert. Some groups also found meaningless patterns such as that the answers follow a
(e.g.,a b a b) pattern or that the correct answer is among the choices that have not been
chosen in previous questions (e.g.,one group member mentioned: ”choice b has not chosen
in last five questions so we have to choose it this time”). It seems that our mind is looking
for a pattern to make sense of things or answer questions. In some cases the pattern
is meaningful (e.g.,math problems) and in vague problems, such as ours, that our mind
is not successful in finding a reasonable pattern it ends up with less meaningful or even
meaningless patterns. Certainly, understanding this dynamic requires more research in the
area.
Finally, although a certain logic for answering the questions did not exist, the group
members, especially the experts, in most groups came up with different logics that they
believed were helping them in answering the questions. In some cases, they were so loyal
to their logic that they did not change their logic even after choosing the wrong answer
but rather they thought that they did not apply the logic correctly. For example, the
expert in one of the groups told the group: ” To pick the correct answer, I read all the
proverbs pretty quickly and then I pick the catchy one. You are thinking too much in to
the proverbs”. He did not suspect his logic even when he was wrong in the third iteration
rather he told everyone: ”I guess this time I thought about the proverbs longer than I
should”.

48
5.2 Research Contributions
This study contributes to the group decision making literature in the following ways:
• Emergence of the expert
In this study the expert emerges gradually by the performance feedbacks provided to
the group. Group members used the information generated by the feedback system
at the end of iterations to build their perception about the expertise level of each
group member. Comparing the expertise level of group members resulted in expert
recognition. This study attempted to capture this idea by using information analysis
that measured the expertise level of each group member at any point of the group
work based on the member’s performance in the current and previous iterations. This
methodology of analyzing the data is a novel contribution of the current study.
• Influence of the expert in a judgmental task
Another main contribution of this study is using a judgmental task instead of an
intellective task. Intellective tasks such as mathematical proofs possess objectively
correct answers that can be shown to be correct to other individuals having the same
conceptual system (Bonner 2000). In contrast, judgmental tasks either do not have
an objectively correct answer or it is not possible to demonstrate which answer is
correct. Therefore, it is harder for the expert to persuade other members to follow
him/her in a judgmental task. The group follows the expert not because they accept
his/her reasoning but rather because of the previous performance of the expert.
Another aspect that made this study unique is that although it benefited from the
characteristics of a judgmental task, the correct answer for the task was also an-
nounced that enabled the reinforcement of the expert. Therefore, on one hand, it
was impossible to demonstrate to other members why the correct answer was in fact

Discussion and Conclusion 49
correct and on the other hand, a correct answer existed for each question by which
the expert was reinforced.
5.3 Limitations of the Study
Our study has limitations that need to be addressed in the future. First, the number
of iterations and the time of the experiment were limited. Having eight iterations, the
experiment took about 90 minutes for each group. Certainly, interactions in a realistic
setting are occur in much longer time periods. Therefore, longer experiments would be
more revealing. This leads to the second limitation. Similar to most studies in the field,
the ad hoc groups of undergraduate students was used for this experiment. Moreover, the
number of groups in this experiment was 18. Additional replications of this experiment
would help achieve more reliable conclusions.
Third, the feedback system used in this study was very direct and quick which made
the expert recognition easier. However, feedbacks in realistic settings are more implicit and
with some delay. Since the time of the experiment was limited, delay could not be repli-
cated accurately. In addition, I believe that a direct feedback in shorter interactions is an
acceptable replicate of the real setting which has less direct feedback in longer interactions.
Fourth, the students were not assigned to groups randomly. Therefore, the groups
that participated in the study could be either newly formed (i.e.,students don’t know each
other), or already established (i.e.,students know each other and possibly have collaborated
before). Having previous working experience with some group members might have some
affects on individual’s perception regarding their expertise levels. Although, based on
observation, most of the group members were new to each other, it would be better to
control this factor in future experiments.
Finally, The experiment was designed such that a random person was reinforced as the
expert. Therefore, a correct answer did not exist and the answer provided to the group
50
as a feedback was fake and based on the expert’s choice (or random in two cases that
the expert was supposed to be wrong). This lead to the use of deception in the study.
Using deception helped in providing more control over the experiment. However, it would
certainly be better if deception can be avoided in future experiments.
5.4 Areas of Future Research
The current study explored some aspects of the expert emergence and influence in group
decision making with a judgmental tasks. But, at the same time it has raised many
questions that need to be addressed in the future.
First, the study showed that as soon as group members recognize the expert, the
expert’s influence on the decision making process increases and group members follow the
expert in their individual decision making. But, what if the task is changed after the
group recognized the expert? Would they still follow the expert in a completely different
subject? Or do they consider that being expert in one subject does not guarantee expertise
in another subject. How about the experts’ behavior? Do experts consider themselves as
an expert in the other subject, as well? To summarize, how much does expertise transfer
from one subject to another?
Second, in the current study being correct in 6 out of 8 iterations was enough to reinforce
someone as an expert. But, the study does not show to what extent one can reduce
the correctness rate or how quickly the group recognizes the expert. The observations
should that most groups recognized the expert in the mid point discussion. But, further
investigation is needed to answer this question. Clearly, the information analysis used in
section 4.3.3 would be helpful to answer this question.
Third, this study investigated the emergence of an expert in a group. However, another
interesting question would be: how long would it take to establish that the recognized
expert is no longer an expert? If feedbacks are given that the expert’s choice in no longer
Discussion and Conclusion 51
correct, how many iterations would it take for the group to change their mind about the
expert. What are the similarities and difference between recognizing someone as an expert
and deposing an expert?
Fourth, as mentioned in Section 5.3 the feedback system used in this study was direct
comparing to a realistic setting. Therefore, it merits to design a feedback system which is
not as explicit as the current one and then measure the expert recognition followed by the
expert’s influence in the group decision making.
Fifth, interestingly, I observed that experts experienced pressure from other group
members to deliver the correct answer. The pressure, mentioned briefly in Section 5.1.5,
affected the expert’s behavior and, subsequently, the group’s behavior. However, further
investigation is needed to understand the source of this pressure and how it affects the
expert’s and group’s behavior.
Finally, the task structure has a great effect on the result of this study. Using another
judgmental task will not necessarily give the same results. Therefore, to shed more light
on this subject, it is worth investigating it using different judgmental tasks and different
group settings.

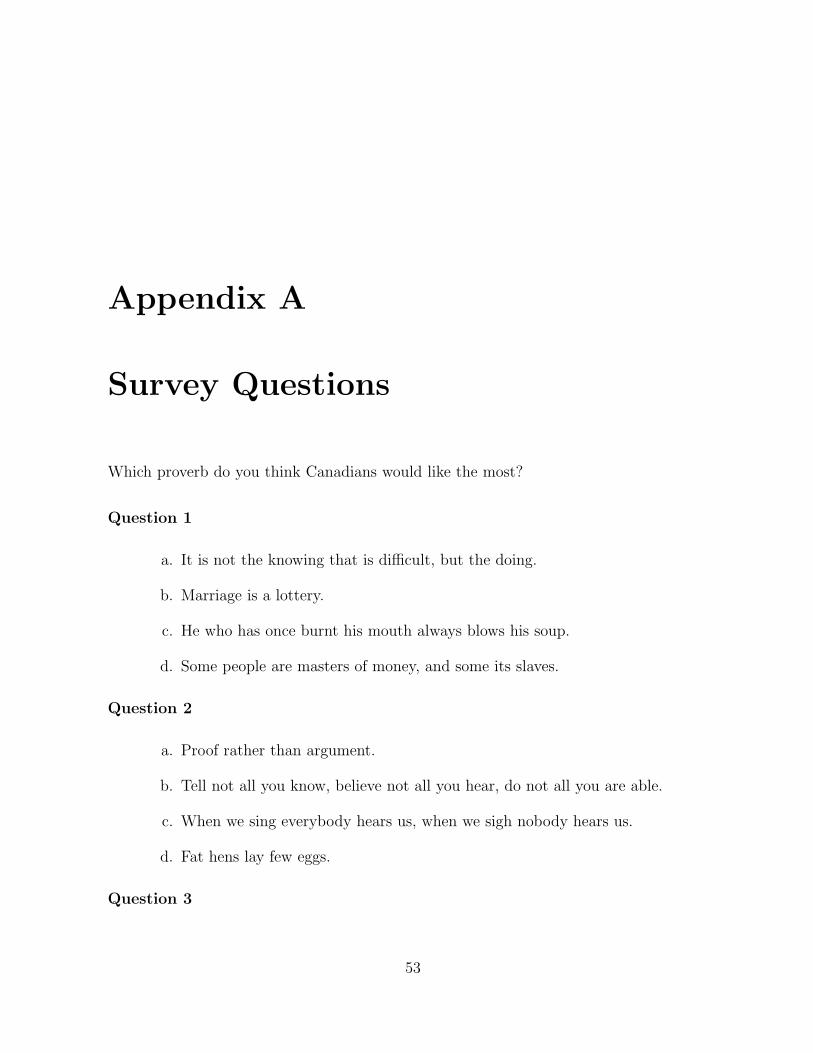
Appendix A
Survey Questions
Which proverb do you think Canadians would like the most?
Question 1
a. It is not the knowing that is difficult, but the doing.
b. Marriage is a lottery.
c. He who has once burnt his mouth always blows his soup.
d. Some people are masters of money, and some its slaves.
Question 2
a. Proof rather than argument.
b. Tell not all you know, believe not all you hear, do not all you are able.
c. When we sing everybody hears us, when we sigh nobody hears us.
d. Fat hens lay few eggs.
Question 3
53
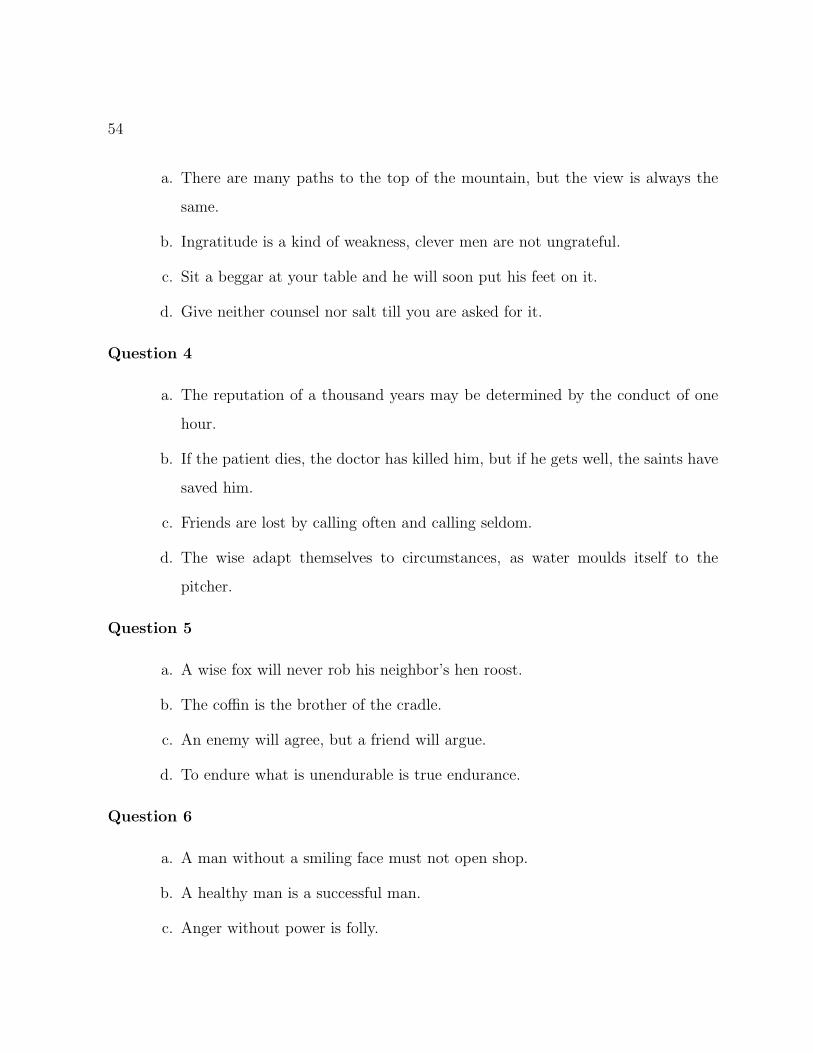
54
a. There are many paths to the top of the mountain, but the view is always the
same.
b. Ingratitude is a kind of weakness, clever men are not ungrateful.
c. Sit a beggar at your table and he will soon put his feet on it.
d. Give neither counsel nor salt till you are asked for it.
Question 4
a. The reputation of a thousand years may be determined by the conduct of one
hour.
b. If the patient dies, the doctor has killed him, but if he gets well, the saints have
saved him.
c. Friends are lost by calling often and calling seldom.
d. The wise adapt themselves to circumstances, as water moulds itself to the
pitcher.
Question 5
a. A wise fox will never rob his neighbor’s hen roost.
b. The coffin is the brother of the cradle.
c. An enemy will agree, but a friend will argue.
d. To endure what is unendurable is true endurance.
Question 6
a. A man without a smiling face must not open shop.
b. A healthy man is a successful man.
c. Anger without power is folly.
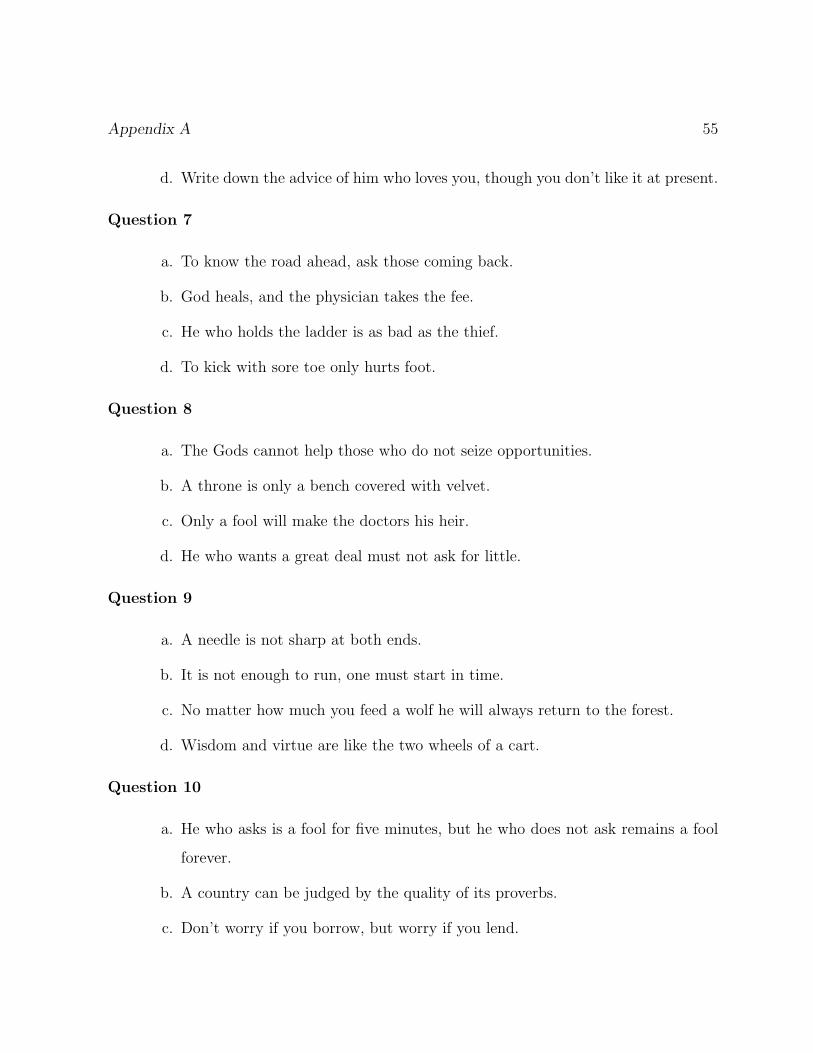
Appendix A 55
d. Write down the advice of him who loves you, though you don’t like it at present.
Question 7
a. To know the road ahead, ask those coming back.
b. God heals, and the physician takes the fee.
c. He who holds the ladder is as bad as the thief.
d. To kick with sore toe only hurts foot.
Question 8
a. The Gods cannot help those who do not seize opportunities.
b. A throne is only a bench covered with velvet.
c. Only a fool will make the doctors his heir.
d. He who wants a great deal must not ask for little.
Question 9
a. A needle is not sharp at both ends.
b. It is not enough to run, one must start in time.
c. No matter how much you feed a wolf he will always return to the forest.
d. Wisdom and virtue are like the two wheels of a cart.
Question 10
a. He who asks is a fool for five minutes, but he who does not ask remains a fool
forever.
b. A country can be judged by the quality of its proverbs.
c. Don’t worry if you borrow, but worry if you lend.

56
d. Have an open face but conceal your thoughts.
Question 11
a. With money you are a dragon; with no money, a worm.
b. Who begins too much accomplishes little.
c. Small children give you headache; big children heartache.
d. A single arrow is easily broken, but not ten in a bundle.
Question 12
a. Fortune is a woman; if you neglect her today do not expect to regain her to-
morrow.
b. Beware of a silent dog and still water.
c. As long as a child does not cry it does not matter what pleases it.
d. Everyone loves justice in the affairs of another.
Question 13
a. The pleasure of love lasts a moment, but the pain of love lasts a lifetime.
b. Happiness is not a horse, you cannot harness it.
c. Trouble rides a fast horse.
d. If you wish to learn the highest truths, begin with the alphabet.
Question 14
a. Learning is a treasure that will follow its owner everywhere.
b. Many who have gold in the house are looking for copper outside.
c. No pear falls into a shut mouth.
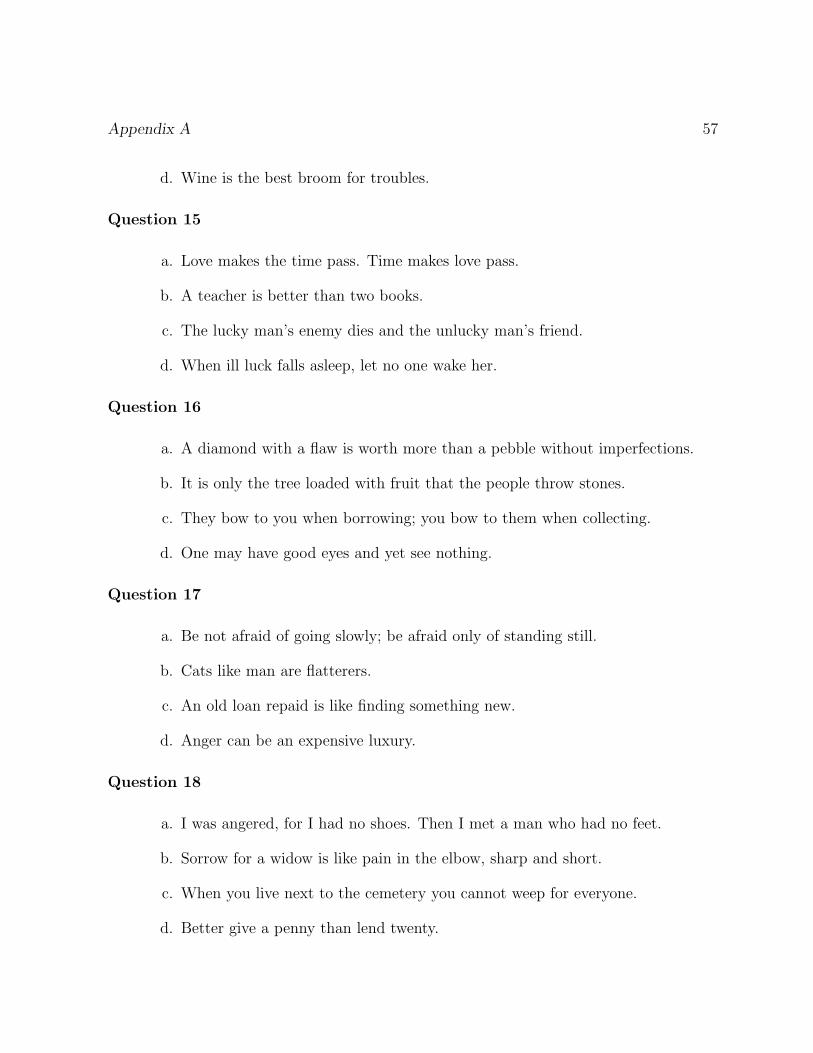
Appendix A 57
d. Wine is the best broom for troubles.
Question 15
a. Love makes the time pass. Time makes love pass.
b. A teacher is better than two books.
c. The lucky man’s enemy dies and the unlucky man’s friend.
d. When ill luck falls asleep, let no one wake her.
Question 16
a. A diamond with a flaw is worth more than a pebble without imperfections.
b. It is only the tree loaded with fruit that the people throw stones.
c. They bow to you when borrowing; you bow to them when collecting.
d. One may have good eyes and yet see nothing.
Question 17
a. Be not afraid of going slowly; be afraid only of standing still.
b. Cats like man are flatterers.
c. An old loan repaid is like finding something new.
d. Anger can be an expensive luxury.
Question 18
a. I was angered, for I had no shoes. Then I met a man who had no feet.
b. Sorrow for a widow is like pain in the elbow, sharp and short.
c. When you live next to the cemetery you cannot weep for everyone.
d. Better give a penny than lend twenty.

58
Question 19
a. Only he that has traveled the road knows where the holes are deep.
b. Love is the dawn of marriage, and marriage is the sunset of love.
c. Some people are masters of money, and some its slaves.
d. Tell not all you know, believe not all you hear, do not all you are able.
Question 20
a. The best soldiers are not warlike.
b. And old rat is a brave rat.
c. Write down the advice of him who loves you, though you don’t like it at present.
d. Many who have gold in the house are looking for copper outside.
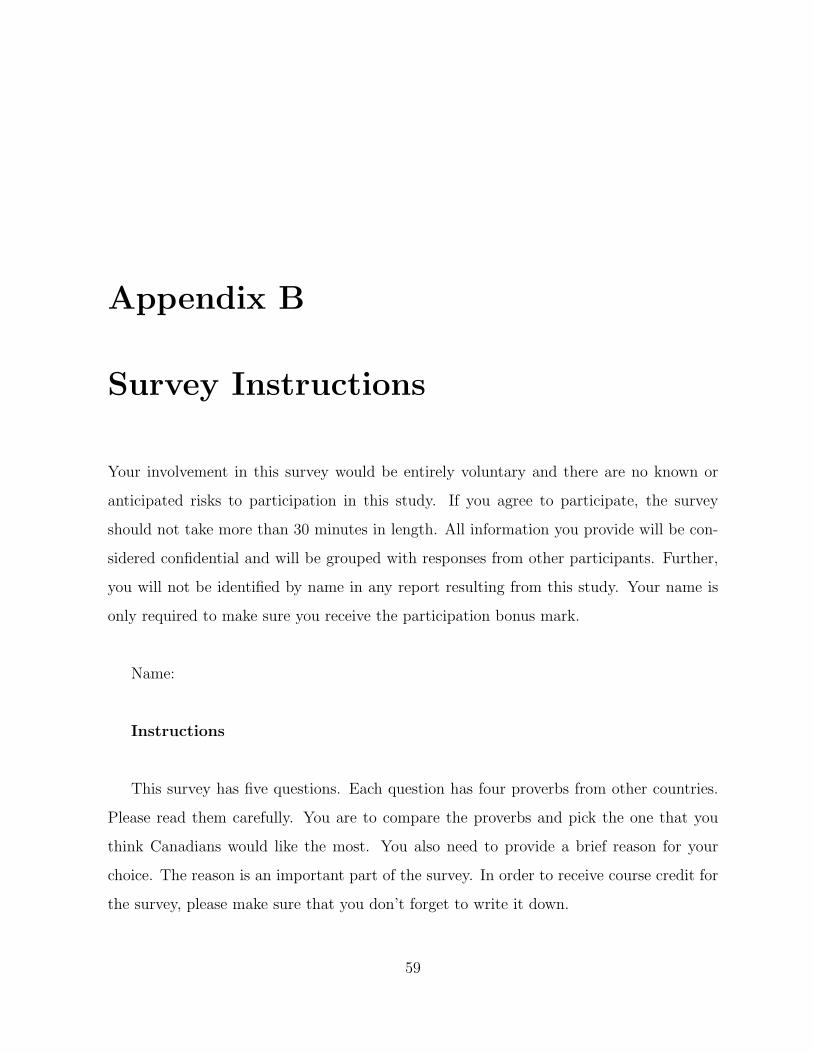
Appendix B
Survey Instructions
Your involvement in this survey would be entirely voluntary and there are no known or
anticipated risks to participation in this study. If you agree to participate, the survey
should not take more than 30 minutes in length. All information you provide will be con-
sidered confidential and will be grouped with responses from other participants. Further,
you will not be identified by name in any report resulting from this study. Your name is
only required to make sure you receive the participation bonus mark.
Name:
Instructions
This survey has five questions. Each question has four proverbs from other countries.
Please read them carefully. You are to compare the proverbs and pick the one that you
think Canadians would like the most. You also need to provide a brief reason for your
choice. The reason is an important part of the survey. In order to receive course credit for
the survey, please make sure that you don’t forget to write it down.
59

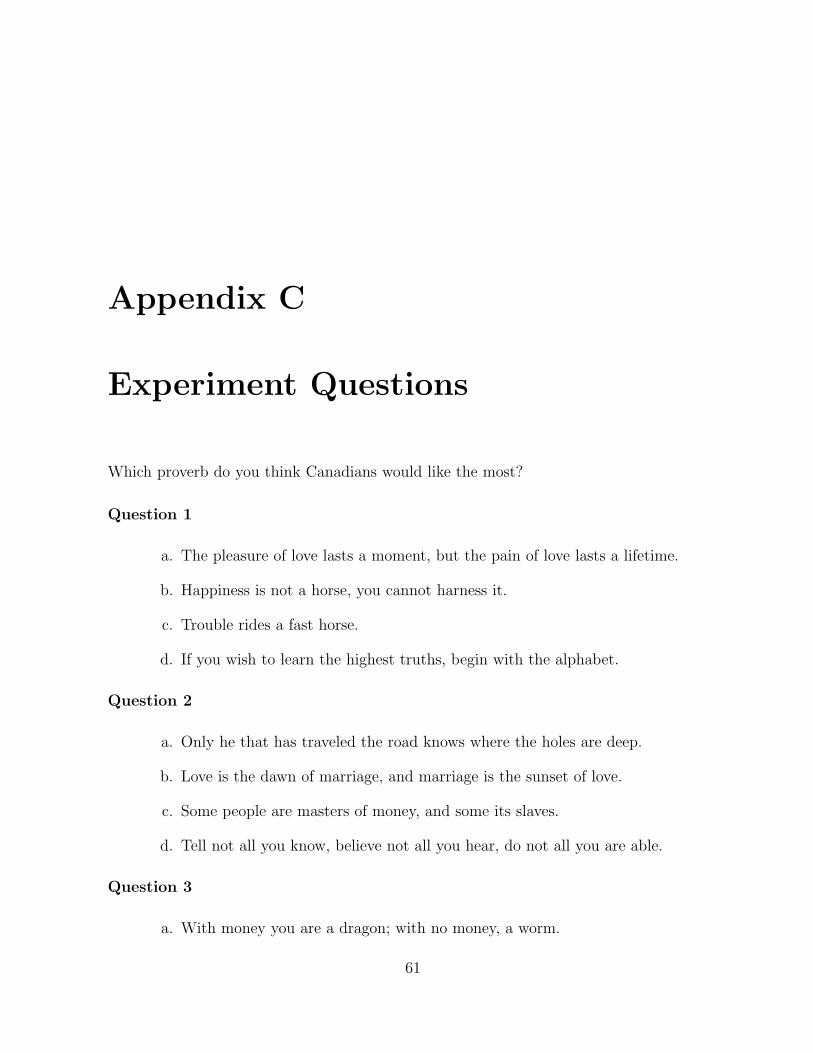
Appendix C
Experiment Questions
Which proverb do you think Canadians would like the most?
Question 1
a. The pleasure of love lasts a moment, but the pain of love lasts a lifetime.
b. Happiness is not a horse, you cannot harness it.
c. Trouble rides a fast horse.
d. If you wish to learn the highest truths, begin with the alphabet.
Question 2
a. Only he that has traveled the road knows where the holes are deep.
b. Love is the dawn of marriage, and marriage is the sunset of love.
c. Some people are masters of money, and some its slaves.
d. Tell not all you know, believe not all you hear, do not all you are able.
Question 3
a. With money you are a dragon; with no money, a worm.
61
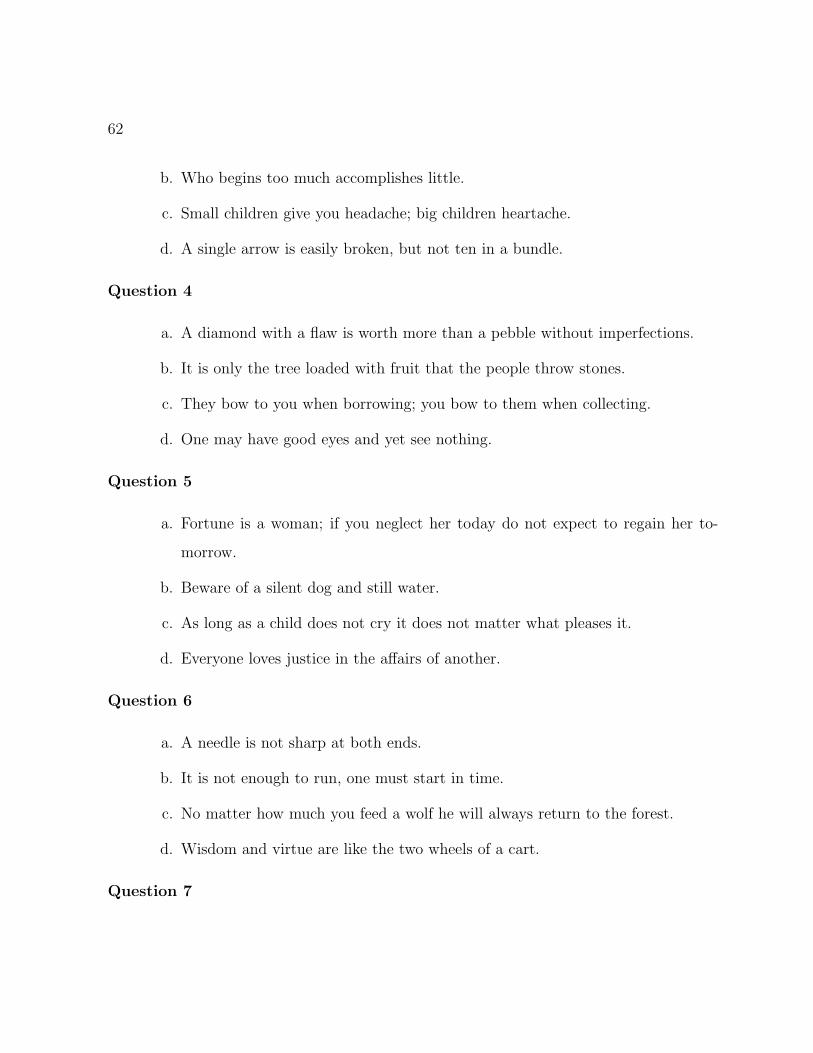
62
b. Who begins too much accomplishes little.
c. Small children give you headache; big children heartache.
d. A single arrow is easily broken, but not ten in a bundle.
Question 4
a. A diamond with a flaw is worth more than a pebble without imperfections.
b. It is only the tree loaded with fruit that the people throw stones.
c. They bow to you when borrowing; you bow to them when collecting.
d. One may have good eyes and yet see nothing.
Question 5
a. Fortune is a woman; if you neglect her today do not expect to regain her to-
morrow.
b. Beware of a silent dog and still water.
c. As long as a child does not cry it does not matter what pleases it.
d. Everyone loves justice in the affairs of another.
Question 6
a. A needle is not sharp at both ends.
b. It is not enough to run, one must start in time.
c. No matter how much you feed a wolf he will always return to the forest.
d. Wisdom and virtue are like the two wheels of a cart.
Question 7

Appendix C 63
a. The reputation of a thousand years may be determined by the conduct of one
hour.
b. If the patient dies, the doctor has killed him, but if he gets well, the saints have
saved him.
c. Friends are lost by calling often and calling seldom.
d. The wise adapt themselves to circumstances, as water moulds itself to the
pitcher.
Question 8
a. A wise fox will never rob his neighbor’s hen roost.
b. The coffin is the brother of the cradle.
c. An enemy will agree, but a friend will argue.
d. To endure what is unendurable is true endurance.

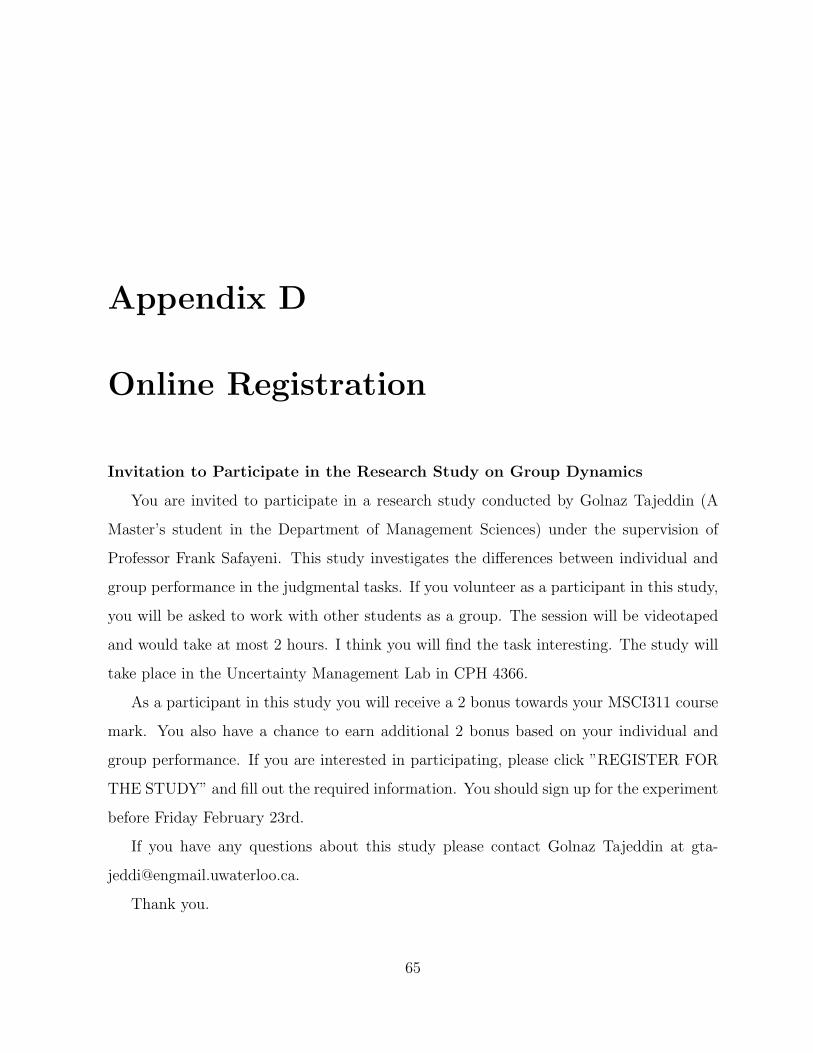
Appendix D
Online Registration
Invitation to Participate in the Research Study on Group Dynamics
You are invited to participate in a research study conducted by Golnaz Tajeddin (A
Master’s student in the Department of Management Sciences) under the supervision of
Professor Frank Safayeni. This study investigates the differences between individual and
group performance in the judgmental tasks. If you volunteer as a participant in this study,
you will be asked to work with other students as a group. The session will be videotaped
and would take at most 2 hours. I think you will find the task interesting. The study will
take place in the Uncertainty Management Lab in CPH 4366.
As a participant in this study you will receive a 2 bonus towards your MSCI311 course
mark. You also have a chance to earn additional 2 bonus based on your individual and
group performance. If you are interested in participating, please click ”REGISTER FOR
THE STUDY” and fill out the required information. You should sign up for the experiment
before Friday February 23rd.
If you have any questions about this study please contact Golnaz Tajeddin at gta-
Thank you.
65
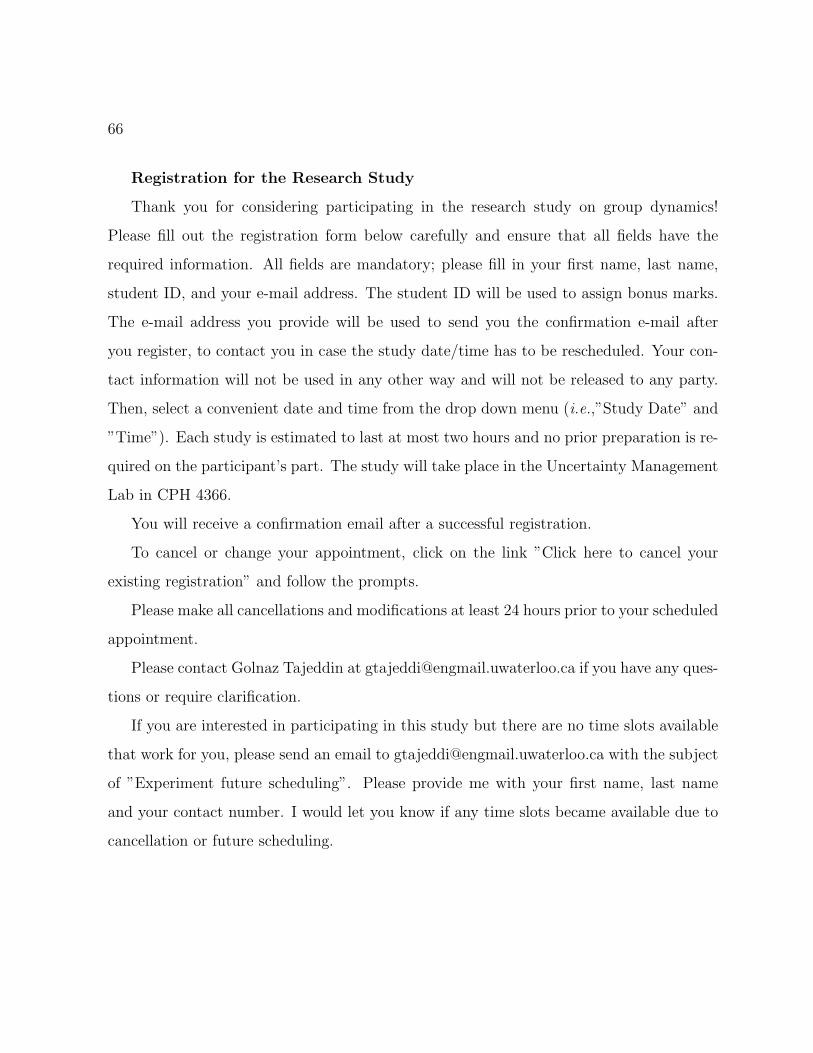
66
Registration for the Research Study
Thank you for considering participating in the research study on group dynamics!
Please fill out the registration form below carefully and ensure that all fields have the
required information. All fields are mandatory; please fill in your first name, last name,
student ID, and your e-mail address. The student ID will be used to assign bonus marks.
The e-mail address you provide will be used to send you the confirmation e-mail after
you register, to contact you in case the study date/time has to be rescheduled. Your con-
tact information will not be used in any other way and will not be released to any party.
Then, select a convenient date and time from the drop down menu (i.e.,”Study Date” and
”Time”). Each study is estimated to last at most two hours and no prior preparation is re-
quired on the participant’s part. The study will take place in the Uncertainty Management
Lab in CPH 4366.
You will receive a confirmation email after a successful registration.
To cancel or change your appointment, click on the link ”Click here to cancel your
existing registration” and follow the prompts.
Please make all cancellations and modifications at least 24 hours prior to your scheduled
appointment.
Please contact Golnaz Tajeddin at [email protected] if you have any ques-
tions or require clarification.
If you are interested in participating in this study but there are no time slots available
that work for you, please send an email to [email protected] with the subject
of ”Experiment future scheduling”. Please provide me with your first name, last name
and your contact number. I would let you know if any time slots became available due to
cancellation or future scheduling.
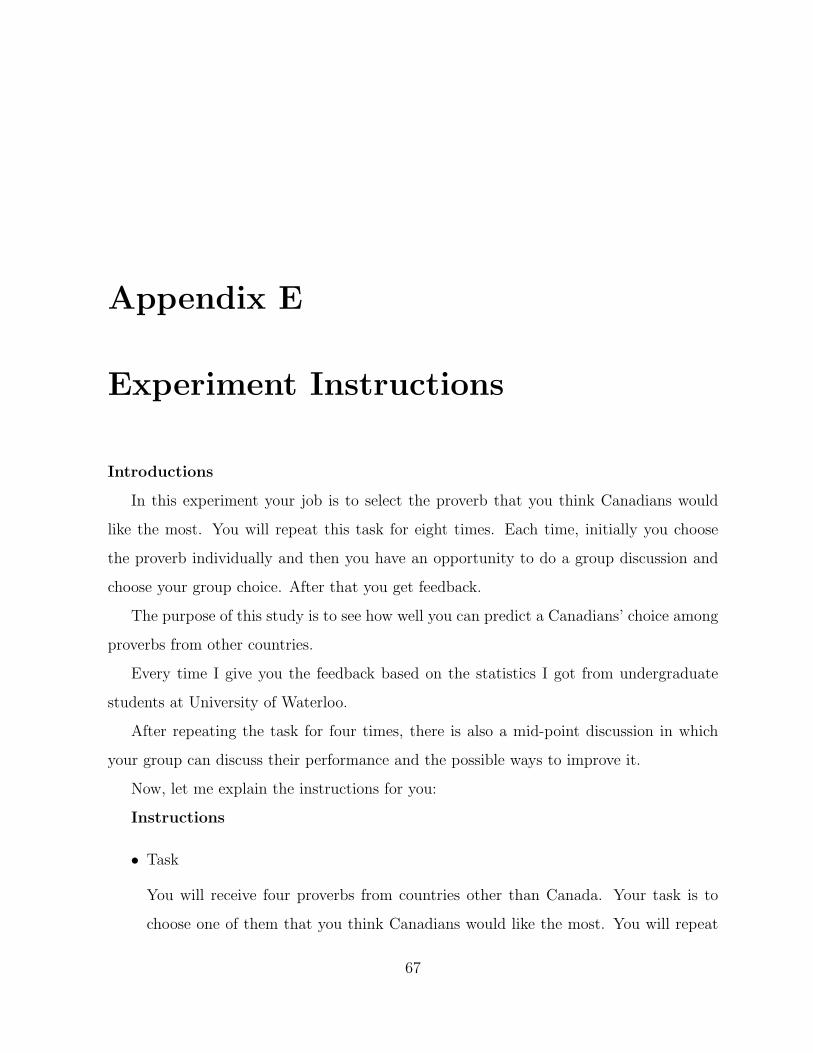
Appendix E
Experiment Instructions
Introductions
In this experiment your job is to select the proverb that you think Canadians would
like the most. You will repeat this task for eight times. Each time, initially you choose
the proverb individually and then you have an opportunity to do a group discussion and
choose your group choice. After that you get feedback.
The purpose of this study is to see how well you can predict a Canadians’ choice among
proverbs from other countries.
Every time I give you the feedback based on the statistics I got from undergraduate
students at University of Waterloo.
After repeating the task for four times, there is also a mid-point discussion in which
your group can discuss their performance and the possible ways to improve it.
Now, let me explain the instructions for you:
Instructions
• Task
You will receive four proverbs from countries other than Canada. Your task is to
choose one of them that you think Canadians would like the most. You will repeat
67

68
this task for eight times. Each time you will receive a new set of four proverbs.
The task consists of two parts: individual part and group part.
In the individual part you should choose one proverb that you think Canadians would
like the most and write your choice a,b,c ord down on the piece of paper, fold the
paper and give it to me after you are finished. You shouldn’t talk to any of your
group members during this part.
After all of you have finished your individual part, your group should discuss what
would be the best choice for the group and come up with the group choice that all
of you agree, unanimous.
After you announce your group choice, you will receive a feedback on the correct
answer. The correct answer is based on the statistical preference of undergraduate
students from University of Waterloo.
• Mid-point discussion
After finishing the first four iterations, you would get 5 minutes to discuss your
performance and ways in which you could potentially improve your prediction.
• Bonus Marks
Now, let me tell you about the bonus marks you can get: By participating in all the
eight iterations you will earn two bonus marks. You can earn up to two additional
bonus marks based on your individual and group performance:
– Individual Performance:
You will get an additional 0.5 bonus mark if your individual answer is correct in
at least 2 of the first four iterations (before mid-point discussion) and another
0.5 mark for being correct in at least 3 of the last four iterations.
– Group performance:

Appendix E 69
All the members of the group will earn an additional 0.5 bonus mark if the
group choice is correct in at least 2 of the first four iterations and another 0.5
mark for being correct in 3 of the last four iterations.


Appendix F
Results Table
Individual Choice
Question Blue Green Red Yellow Group Choice Correct Answer
1
2
3
4
5
6
7
8
71

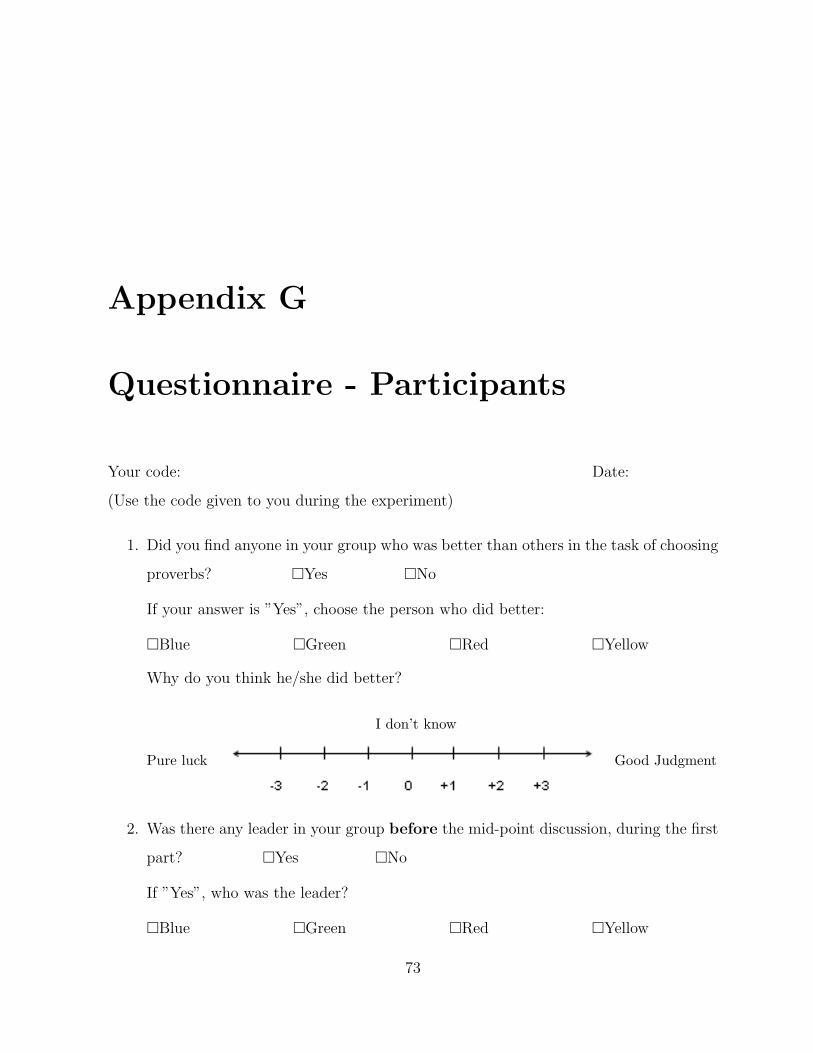
Appendix G
Questionnaire - Participants
Your code: Date:
(Use the code given to you during the experiment)
1. Did you find anyone in your group who was better than others in the task of choosing
proverbs? �Yes �No
If your answer is ”Yes”, choose the person who did better:
�Blue �Green �Red �Yellow
Why do you think he/she did better?
I don’t know
Pure luck Good Judgment
2. Was there any leader in your group before the mid-point discussion, during the first
part? �Yes �No
If ”Yes”, who was the leader?
�Blue �Green �Red �Yellow
73

74
3. Was there any leader in your group after the mid-point discussion, during the first
part? �Yes �No
If ”Yes”, who was the leader?
�Blue �Green �Red �Yellow
4. Did you enjoy working with your group members?
Indifference
Not at all Very much
5. If you were asked to participate in another group experiment, are you willing to work
with the same group?
�Yes �No
6. Do you feel your performance got better as the experiment went along?
�Yes �No

Appendix H
Questionnaire - Observers
Date:
1. Did you find anyone in the group who was better than others in the task of choosing
proverbs? �Yes �No
If your answer is ”Yes”, choose the person who did better:
�Blue �Green �Red �Yellow
Why do you think he/she did better?
I don’t know
Pure luck Good Judgment
2. Was there any leader in the group before the mid-point discussion, during the first
part? �Yes �No
If ”Yes”, who was the leader?
�Blue �Green �Red �Yellow
75
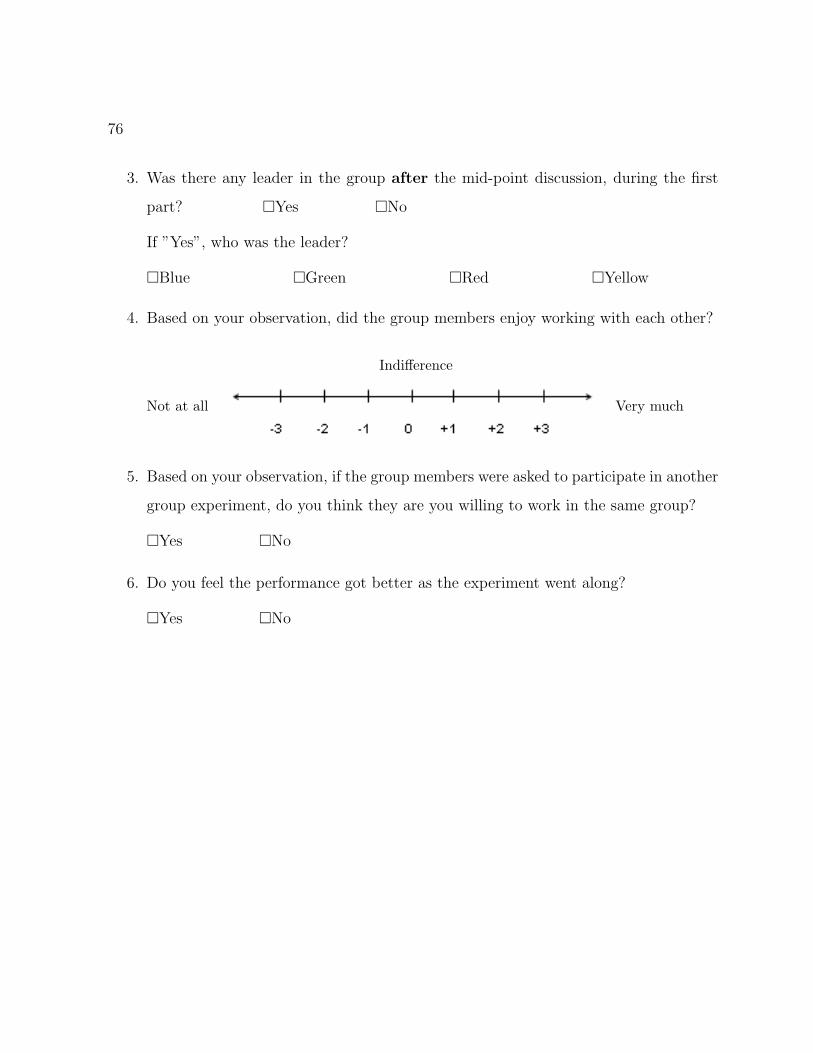
76
3. Was there any leader in the group after the mid-point discussion, during the first
part? �Yes �No
If ”Yes”, who was the leader?
�Blue �Green �Red �Yellow
4. Based on your observation, did the group members enjoy working with each other?
Indifference
Not at all Very much
5. Based on your observation, if the group members were asked to participate in another
group experiment, do you think they are you willing to work in the same group?
�Yes �No
6. Do you feel the performance got better as the experiment went along?
�Yes �No

Appendix I
Details of All Group Experiments
* The individual chosen as an expert in the group
Individual Choice Group Correct
Group Number Question Blue Green Red Yellow Choice Answer
Group 1 1 a a d b* d b
2 c a a c c c
3 a d b b d c
4 d b d a d a
5 d c c b b b
6 a b c b b b
7 c a d a a a
8 d a c c c d
Group 2 1 a a* a a a a
2 c d c c c d
3 d d b d d a
4 a a b d a a
Continued on next page
77

78
Table I.1 – continued from previous page
Individual Choice Group Correct
Group Number Question Blue Green Red Yellow Choice Answer
5 a d a d a d
6 b d d d d d
7 d d d d d d
8 d a d d d b
Group 3 1 a a a b* a b
2 a c a a c a
3 b a d d b a
4 d d c b a b
5 a a b b a b
6 d d c d d d
7 d a d d d d
8 d d a a a c
Group 4 1 c a a d* d d
2 d c c a a a
3 d d b d d b
4 c d a a a a
5 d c a a a a
6 d b b b b b
7 a a a d a d
8 d d a d d c
Group 5 1 b a* d b b a
2 c c a a c c
Continued on next page
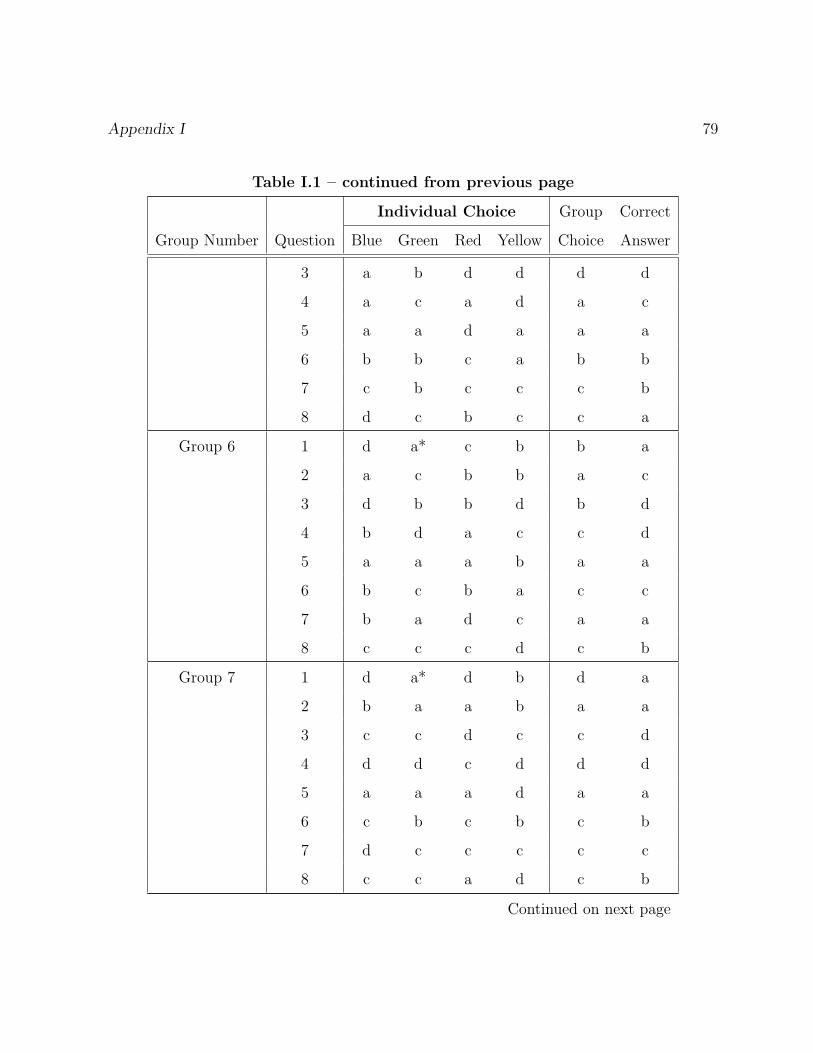
Appendix I 79
Table I.1 – continued from previous page
Individual Choice Group Correct
Group Number Question Blue Green Red Yellow Choice Answer
3 a b d d d d
4 a c a d a c
5 a a d a a a
6 b b c a b b
7 c b c c c b
8 d c b c c a
Group 6 1 d a* c b b a
2 a c b b a c
3 d b b d b d
4 b d a c c d
5 a a a b a a
6 b c b a c c
7 b a d c a a
8 c c c d c b
Group 7 1 d a* d b d a
2 b a a b a a
3 c c d c c d
4 d d c d d d
5 a a a d a a
6 c b c b c b
7 d c c c c c
8 c c a d c b
Continued on next page

80
Table I.1 – continued from previous page
Individual Choice Group Correct
Group Number Question Blue Green Red Yellow Choice Answer
Group 8 1 a d* a a a d
2 d b c a a b
3 d d a d d a
4 d a d a d a
5 a a a a a a
6 d d d d d d
7 d d c b d d
8 c c d c d a
Group 9 1 d* a a a a d
2 c a c c c c
3 c d b d b b
4 d b a c d d
5 a b a a a a
6 b b b d b b
7 a b a c a a
8 c d b d d a
Group 10 1 a a c* a a c
2 a a d c d d
3 d b b a b d
4 d d d d d d
5 c a a d d a
6 b b c d b c
Continued on next page

Appendix I 81
Table I.1 – continued from previous page
Individual Choice Group Correct
Group Number Question Blue Green Red Yellow Choice Answer
7 d b a b a a
8 c c d d d a
Group 11 1 a* b d c a a
2 c c b c c c
3 d b d a d b
4 d a a a a d
5 d a a b a d
6 c c d d c c
7 a b d b a a
8 a b c c a d
Group 12 1 d* b c a d d
2 b a a c a b
3 d d a d d a
4 b c d d a b
5 c a d d c c
6 d c b b d d
7 a a b a a a
8 c c c d c d
Group 13 1 a* c b d b a
2 c c a a c c
3 d d b d d b
4 a a a d a a
Continued on next page

82
Table I.1 – continued from previous page
Individual Choice Group Correct
Group Number Question Blue Green Red Yellow Choice Answer
5 a a d a a a
6 c b b d b c
7 b a a d b b
8 c d a d c d
Group 14 1 d d a* b d a
2 c a c a c c
3 a d b b b d
4 a d a d d a
5 a a a d a a
6 b a d d d d
7 a c c d c c
8 c c b c c d
Group 15 1 a* d b d a a
2 c c d c c c
3 b c c d c c
4 a d a d a a
5 d b a b b b
6 b a b b b b
7 c c c a c c
8 c c c c c c
Group 16 1 c d b c* d c
2 a c a b a b
Continued on next page
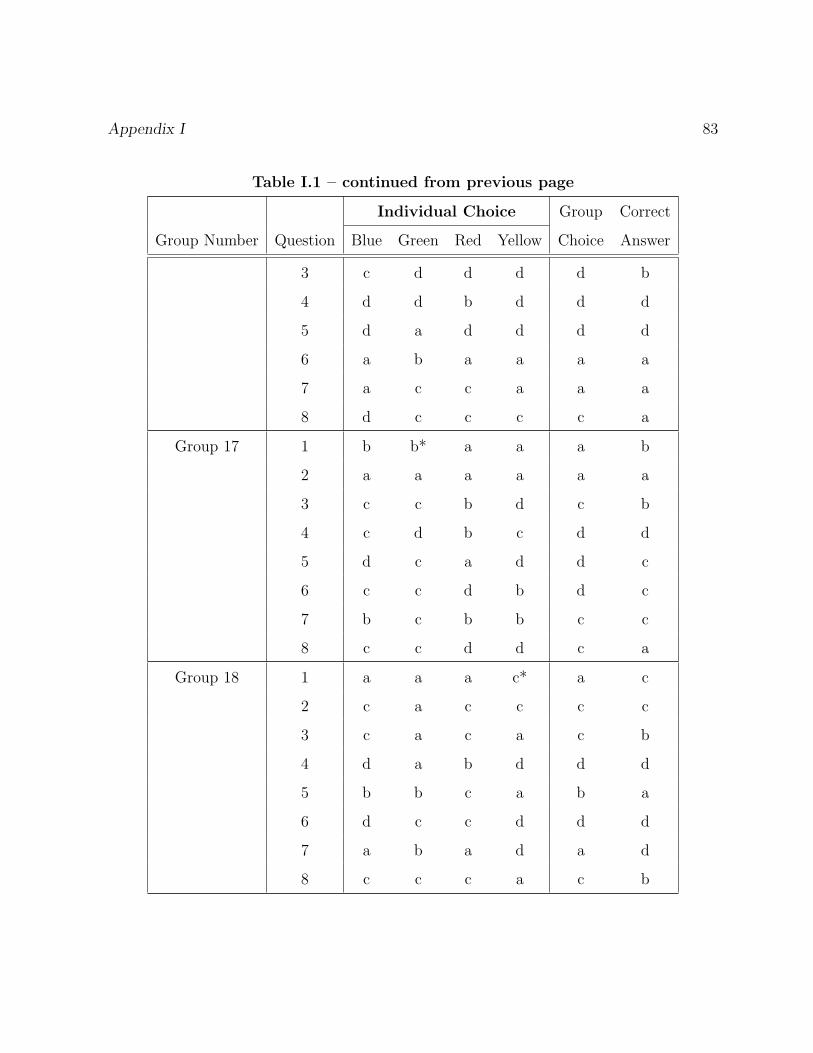
Appendix I 83
Table I.1 – continued from previous page
Individual Choice Group Correct
Group Number Question Blue Green Red Yellow Choice Answer
3 c d d d d b
4 d d b d d d
5 d a d d d d
6 a b a a a a
7 a c c a a a
8 d c c c c a
Group 17 1 b b* a a a b
2 a a a a a a
3 c c b d c b
4 c d b c d d
5 d c a d d c
6 c c d b d c
7 b c b b c c
8 c c d d c a
Group 18 1 a a a c* a c
2 c a c c c c
3 c a c a c b
4 d a b d d d
5 b b c a b a
6 d c c d d d
7 a b a d a d
8 c c c a c b


Appendix J
The Result of Questionnaires in
Detail
The questions of the questionnaire for group members and observers are presented in
Appendix G and Appendix H, respectively. The answers to this questions are coded as
follows:
Yes=1, No=0 (For questions 1, 2, 3, 5, and 6)
Expert=1, Any group member other than expert=2 (For questions 1a, 2a, and 3a)
the number chosen on the measure (For Questions 1b and 4)
Table J.1: Summary of questionnaire completed by group
members excluding experts
Group Question
Number 1 1a 1b 2 2a 3 3a 4 5 6
1 1 1 2 1 1 1 1 3 1 1
1 1 2 0 1 1 3 1 0
Continued on next page
85
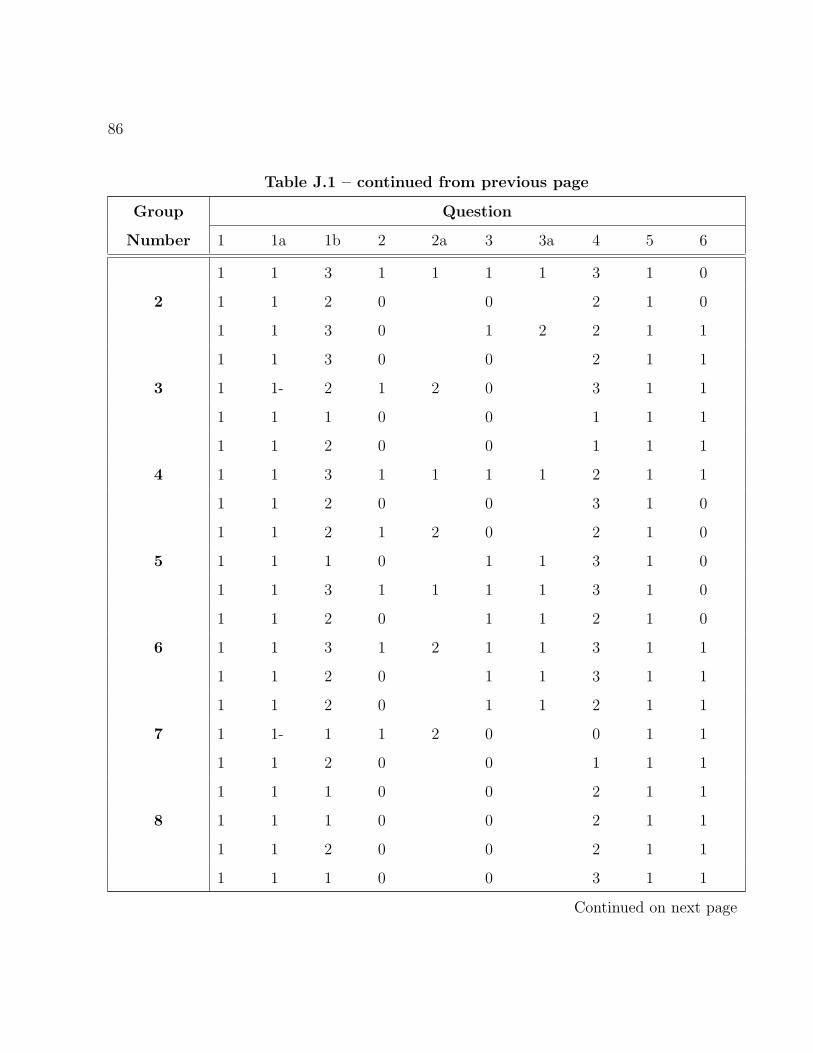
86
Table J.1 – continued from previous page
Group Question
Number 1 1a 1b 2 2a 3 3a 4 5 6
1 1 3 1 1 1 1 3 1 0
2 1 1 2 0 0 2 1 0
1 1 3 0 1 2 2 1 1
1 1 3 0 0 2 1 1
3 1 1- 2 1 2 0 3 1 1
1 1 1 0 0 1 1 1
1 1 2 0 0 1 1 1
4 1 1 3 1 1 1 1 2 1 1
1 1 2 0 0 3 1 0
1 1 2 1 2 0 2 1 0
5 1 1 1 0 1 1 3 1 0
1 1 3 1 1 1 1 3 1 0
1 1 2 0 1 1 2 1 0
6 1 1 3 1 2 1 1 3 1 1
1 1 2 0 1 1 3 1 1
1 1 2 0 1 1 2 1 1
7 1 1- 1 1 2 0 0 1 1
1 1 2 0 0 1 1 1
1 1 1 0 0 2 1 1
8 1 1 1 0 0 2 1 1
1 1 2 0 0 2 1 1
1 1 1 0 0 3 1 1
Continued on next page

Appendix J 87
Table J.1 – continued from previous page
Group Question
Number 1 1a 1b 2 2a 3 3a 4 5 6
9 1 1 2 1 1 0 2 1 1
1 1 0 0 0 1 1 0
1 1 2 0 0 3 1 0
10 1 1 2 0 1 1 2 1 0
1 1 2 0 0 3 1 0
1 1 2 0 0 2 1 0
11 1 1 2 0 0 3 1 0
1 1 1 0 0 1 1 0
1 1 2 0 0 2 1 0
12 1 1 3 0 0 3 1 1
1 1 2 0 0 2 1 1
1 1 2 0 1 2 3 1 0
13 1 1 0 0 1 2 3 1 1
1 1- 2 1 1 1 1 0 1 0
1 1 1 0 1 1 1 1 1
14 1 1 2 0 0 2 1 1
0 1 2 0 1 1 0
1 1 1 0 0 0 1 0
15 1 1 1 0 0 3 1 1
1 1 1 0 0 3 1 0
1 1 2 1 1 0 1 1 1
16 1 1 2 1 1 1 1 2 1 0
Continued on next page
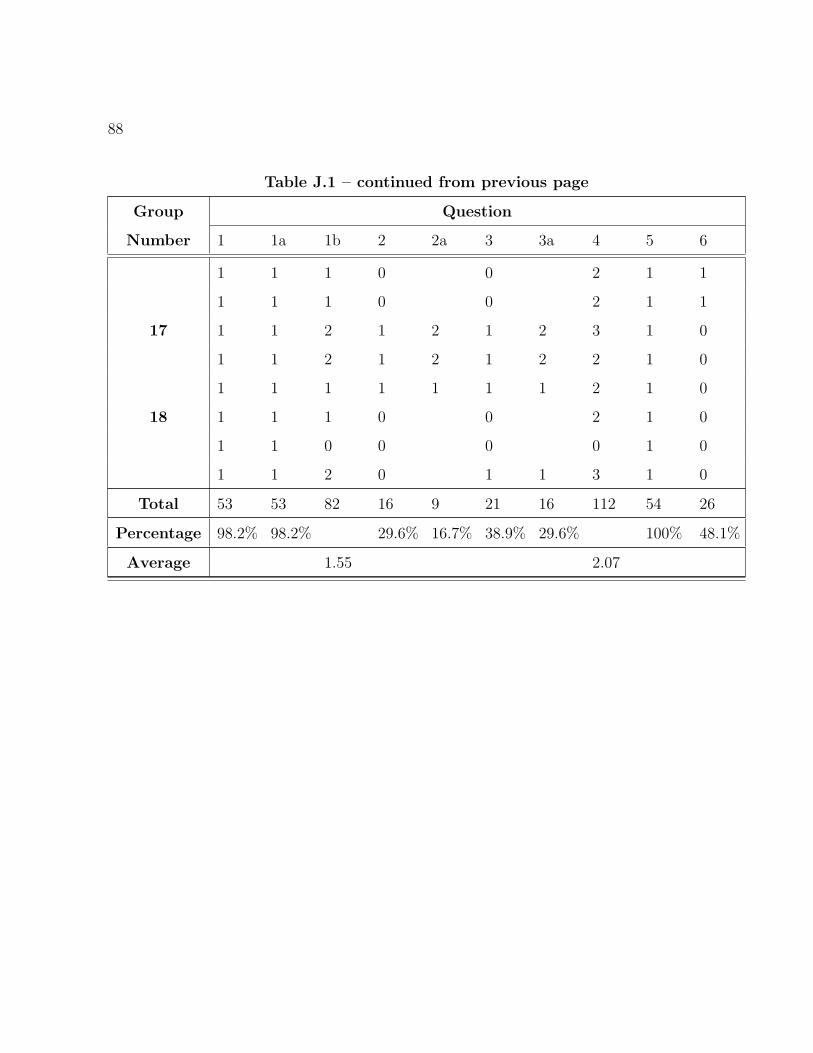
88
Table J.1 – continued from previous page
Group Question
Number 1 1a 1b 2 2a 3 3a 4 5 6
1 1 1 0 0 2 1 1
1 1 1 0 0 2 1 1
17 1 1 2 1 2 1 2 3 1 0
1 1 2 1 2 1 2 2 1 0
1 1 1 1 1 1 1 2 1 0
18 1 1 1 0 0 2 1 0
1 1 0 0 0 0 1 0
1 1 2 0 1 1 3 1 0
Total 53 53 82 16 9 21 16 112 54 26
Percentage 98.2% 98.2% 29.6% 16.7% 38.9% 29.6% 100% 48.1%
Average 1.55 2.07
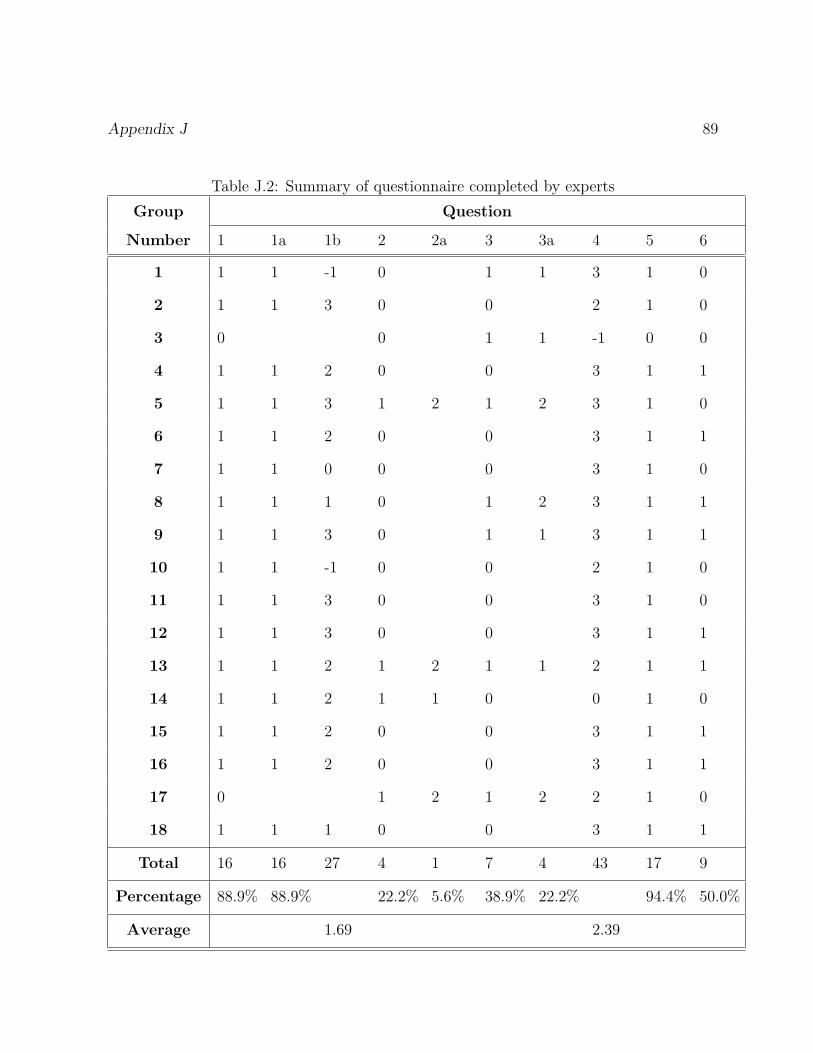
Appendix J 89
Table J.2: Summary of questionnaire completed by experts
Group Question
Number 1 1a 1b 2 2a 3 3a 4 5 6
1 1 1 -1 0 1 1 3 1 0
2 1 1 3 0 0 2 1 0
3 0 0 1 1 -1 0 0
4 1 1 2 0 0 3 1 1
5 1 1 3 1 2 1 2 3 1 0
6 1 1 2 0 0 3 1 1
7 1 1 0 0 0 3 1 0
8 1 1 1 0 1 2 3 1 1
9 1 1 3 0 1 1 3 1 1
10 1 1 -1 0 0 2 1 0
11 1 1 3 0 0 3 1 0
12 1 1 3 0 0 3 1 1
13 1 1 2 1 2 1 1 2 1 1
14 1 1 2 1 1 0 0 1 0
15 1 1 2 0 0 3 1 1
16 1 1 2 0 0 3 1 1
17 0 1 2 1 2 2 1 0
18 1 1 1 0 0 3 1 1
Total 16 16 27 4 1 7 4 43 17 9
Percentage 88.9% 88.9% 22.2% 5.6% 38.9% 22.2% 94.4% 50.0%
Average 1.69 2.39
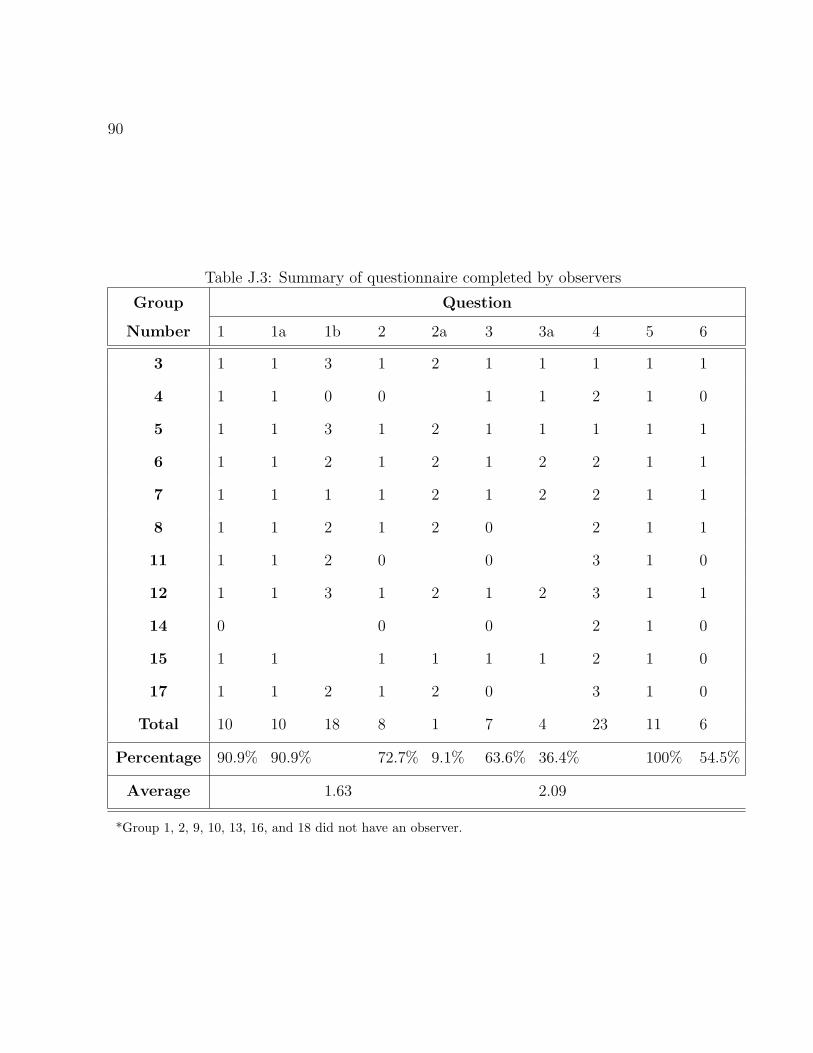
90
Table J.3: Summary of questionnaire completed by observers
Group Question
Number 1 1a 1b 2 2a 3 3a 4 5 6
3 1 1 3 1 2 1 1 1 1 1
4 1 1 0 0 1 1 2 1 0
5 1 1 3 1 2 1 1 1 1 1
6 1 1 2 1 2 1 2 2 1 1
7 1 1 1 1 2 1 2 2 1 1
8 1 1 2 1 2 0 2 1 1
11 1 1 2 0 0 3 1 0
12 1 1 3 1 2 1 2 3 1 1
14 0 0 0 2 1 0
15 1 1 1 1 1 1 2 1 0
17 1 1 2 1 2 0 3 1 0
Total 10 10 18 8 1 7 4 23 11 6
Percentage 90.9% 90.9% 72.7% 9.1% 63.6% 36.4% 100% 54.5%
Average 1.63 2.09
*Group 1, 2, 9, 10, 13, 16, and 18 did not have an observer.

Bibliography
Bonner, Bryan L. 2000. The effects of extroversion on influence in ambiguous group task.
Small Group Research 31(2) 225–244.
Bonner, Bryan L. 2004. Expertise in group problem solving: recognition, social combina-
tion, and performance. Group Dynamics: Theory, Research, and Practice 8(4) 227–290.
Bonner, Bryan L., Michael R. Baumann, Reeshad S. Dalal. 2002. The effects of mem-
ber expertise on group decision-making and performance. Organizational Behavior and
Human Decision Process 88 719–736.
Bottger, P.C. 1984. Expertise and air time as basis of actual and perceived influence
in problem solving groups. Organizational Behavior and Human Decision Process 69
214–221.
Davis, James H. 1969. Group Performance. Addison Wesley, New York.
Davis, James H. 1973. Group decision and social interaction: a theory of social decision
schemes. Psychological Review 80(2) 97–125.
Einhorn, H. J., R. M. Hogarth, E. Klempner. 1997. Quality of group judgment. Psycho-
logical Bulletin 84 158–172.
Forsyth, Donelson R. 2006. Group Dynamics . 4th ed. Thomson Wadsworth, Belmont, CA.
91

92
Gersick, Connie J. G. 1988. Time and transition in work teams: Toward a new model of
group development. Academy of Management Journal 31(1) 9–41.
Henry, Rebecca A. 1993. Group judgment accuracy: Reliability and validity of post-
discussion confidence judgment. Organizational Behavior and human decision Process
51 11–27.
Henry, Rebecca A. 1995. Improving group judgment accuracy: Information sharing and
determining the best member. Organizational Behavior and Human Decision Process
62(2) 190–197.
Henry, Rebecca A., Stefani L. Yorges Oriel J. Strickland, Deborah Ladd. 1996. Helping
groups determine their most accurate member: The role of outcome feedback. Journal
of Applied Social Psychology 26(13) 1153–1170.
Laughlin, Patrick R. 1980. Social combination processes of cooperative problem-solving
groups on verbal intellective tasks. Fishbein M., ed., Progress in social psychology .
Hillsdale, NJ: Erlbaum, 127–155.
Laughlin, Patrick R., Bryan L. Bonner. 1999. Collective induction: Effects of multiple
hypotheses and multiple evidence in two problem domains. Journal of Personality and
Social Psychology 77 1163–1172.
Laughlin, Patrick R., Bryan L. Bonner, T. William Altermatt. 1999. Effectiveness of
positive hypothesis testing in inductive and deductive rule learning. Organizational
Behavior and Human Decision Processes 77(2) 130–146.
Laughlin, Patrick R., Alan L. Ellis. 1986. Demonstrability and social combination processes
on mathematical intellective tasks. Journal of Experimental Social Psychology 61(3) 50–
67.
Bibliography 93
Laughlin, Patrick R., Erin C. Hatch, Jonathan S. Silver, Lee Boh. 2006. Groups perform
better than the best individuals on letters to numbers problems: Effects of group size.
Journal of Personality and Social Psychology 90(4) 644–651.
Laughlin, Patrick R., Scott W. Vanderstoep, Andrea B. Hollingshead. 1991. Collective
versus individual induction: Recognition of truth, rejection of error, and collective in-
formation processing. Journal of Personality and Social Psychology 61 50–67.
Laughlin, Patrick R., Megan L. Zander, Erica M. Knievel, Tiong K. Tang. 2003. Groups
perform better than the best individuals on letters to numbers problems:informative
equations and effective strategies. Journal of Personality and Social Psychology 85(4)
684–694.
Libby, Robert, Ken T. Trotman, Ian Zimmer. 1987. Member variation, recognition of
expertise, and group performance. Journal of Applied Psychology 72(1) 81–87.
Littlepage, Glenn, William Robinson, Kelly Reddington. 1997. Effects of task experience
and group experience on group performance, member ability, and recognition of exper-
tise. Organizational Behavior and Human Decision Process 69(2) 133–147.
Littlepage, Glenn E., Amy L. Mueller. 1997. Reccognition and utilization of expertise in
problem-solving groups: Expert characteristics and behavior. Group Dynamics: Theory,
Research and Practice 1(4) 324–328.
Lorge, I., H. Slomon. 1955. Two models of group behavior in solution of eureka-type
problems. Psychometrika 20 139–148.
McGrath, J.E. 1984. Groups: Interaction and performance. Englewood Cliffs, NJ: Prentice
Hall.
94
O’Leary-Kelly, A. M. 1998. The influence of group feedback on individual group member
response. G. R. Ferries et al., ed., Research in Personnel and human resources manage-
ment . Brookfield, VT: Ashgate, 225–285.
Restle, F., James H. Davis. 1962. Success and speed of problem solving by individuals and
groups. Psychological Review 69 520–536.
Stasser, G., B. Dietz-Uhler. 2001. Collective choice, judgment, and problem solving. Black-
well handbook of social psychology: Group processes 31–55Malden, MA:blackwell.
Stasser, Garold. 1999. A primer of social decision scheme theory: Models of group influence,
competitive model testing, and prospective model. Organizational Behavior and Human
Decision Process 80(1) 3–20.
Stewart, Dennis D., Garold Stasser. 1995. Expert role assignment and information sam-
pling during collective recall and decision making. Journal of Personality and Social
Psychology 69(4) 619–628.
Wegner, D.M. 1986. Transactive memory: A contemporary analysis of the group mind.
B. Mullen, G.R. Goethals, eds., Theories of group behavior . Springer-Verlag, New York,
185–208.
Yetton, P. W., P. C. Bottger. 1982. Individual versus group problem solving: an empirical
test of a best-member strategy. Organizational Behavior and Human decision Process .


