EMIS: Creating Efficiency through Effective Energy Information Tracking, Analysis and Optimization
Jessica Granderson, PhD Guanjing Lin, PhD, Erin Hult, PhD Lawrence Berkeley National Laboratory
2014 Better Buildings Summit, May 7,2014
Outline
2
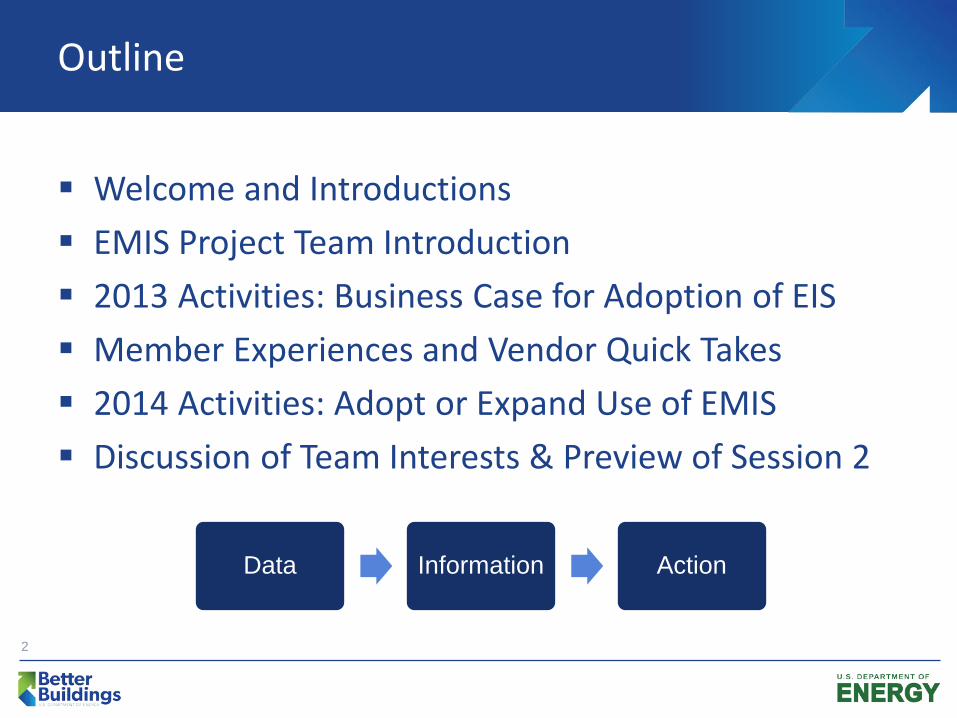
Data Information Action
Welcome and Introductions EMIS Project Team Introduction 2013 Activities: Business Case for Adoption of EIS Member Experiences and Vendor Quick Takes 2014 Activities: Adopt or Expand Use of EMIS Discussion of Team Interests & Preview of Session 2

Introductions Around the Room
3

EMIS Project Team Introduction
EMIS: broad family of tools and services used to manage building energy use
Benchmarking and utility tracking tools, energy information systems, fault detection and diagnostic systems, building automation systems
EIS: whole building or portfolio-level energy tracking designed to identify opportunities to improve building operational efficiency
Software tools to collect, display, analyze building energy use
4
Grounding Definitions

5
Energy Information System (EIS)
Building automation system (BAS)
Fault Detection and Diagnosis Tool
Benchmarking and Monthly Utility Bill
Analysis

BBA EMIS Project Team Members
Arlington County, Virginia Best Buy Boston Market City of Boston City of Cleveland, Ohio City of Milwaukee, Wisconsin City of West Palm Beach, Florida Food Lion Glenborough U.S. General Services
Administration Hospital Corporation of America Legacy Health System Kauai County, Hawaii New York-Presbyterian Hospital
6
PetSmart Prudential Financial, Inc. Staples Summa Health System Tishman Speyer Properties Tulane University Ulta University of Maryland Medical Center University of Pittsburgh Medical
Center Verizon Wendy's Quality Supply Chain Co-op Whole Foods Market Yum! Brands

2013 Project Team Activities
1. EMIS characterization framework Lack of standard terminology, difficulty distinguishing
offerings, Established terminology framework of EMIS technologies
Convergence of terms between research and practice, e.g., CEE Whole Buildings Committee, PECI, LBNL, others
Vetted with 35+ stakeholders: industry, users, researchers Data inputs, resolution, frequency of use, key applications, ‘also-
known-as’, representative commercial offerings
7
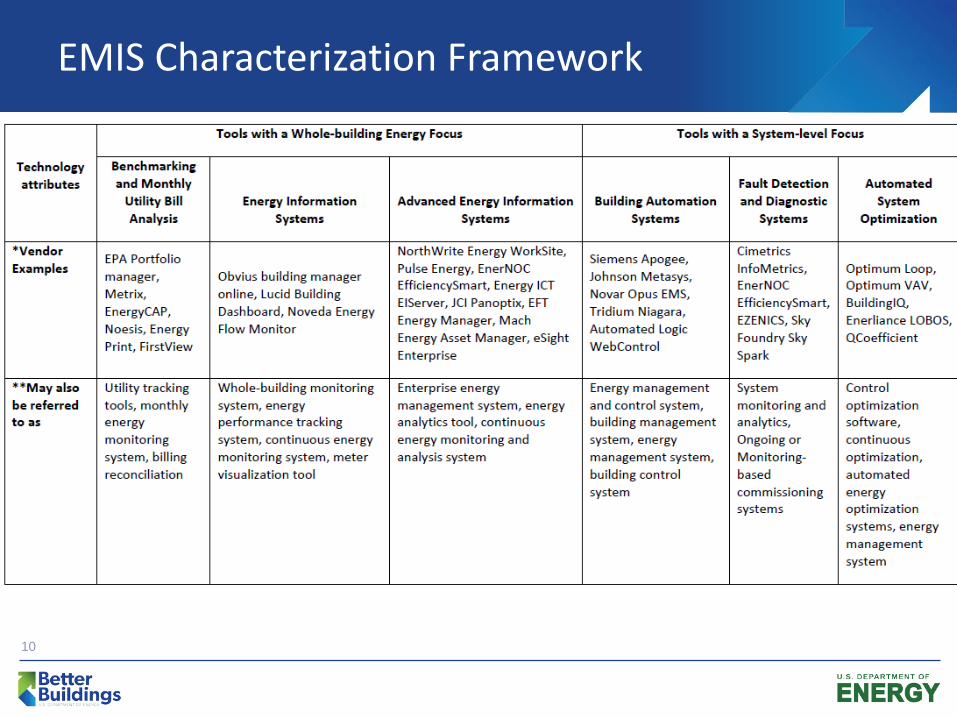
EMIS Characterization Framework
8
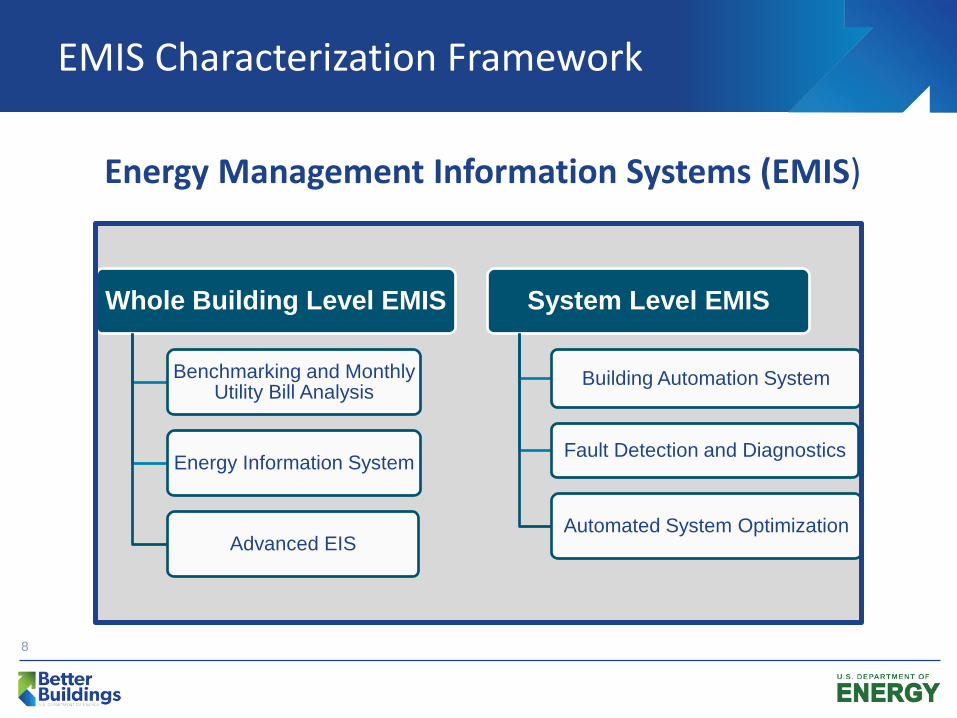
Whole Building Level EMIS
Benchmarking and Monthly Utility Bill Analysis
Energy Information System
Advanced EIS
System Level EMIS
Building Automation System
Fault Detection and Diagnostics
Automated System Optimization
Energy Management Information Systems (EMIS)
EMIS Characterization Framework
9
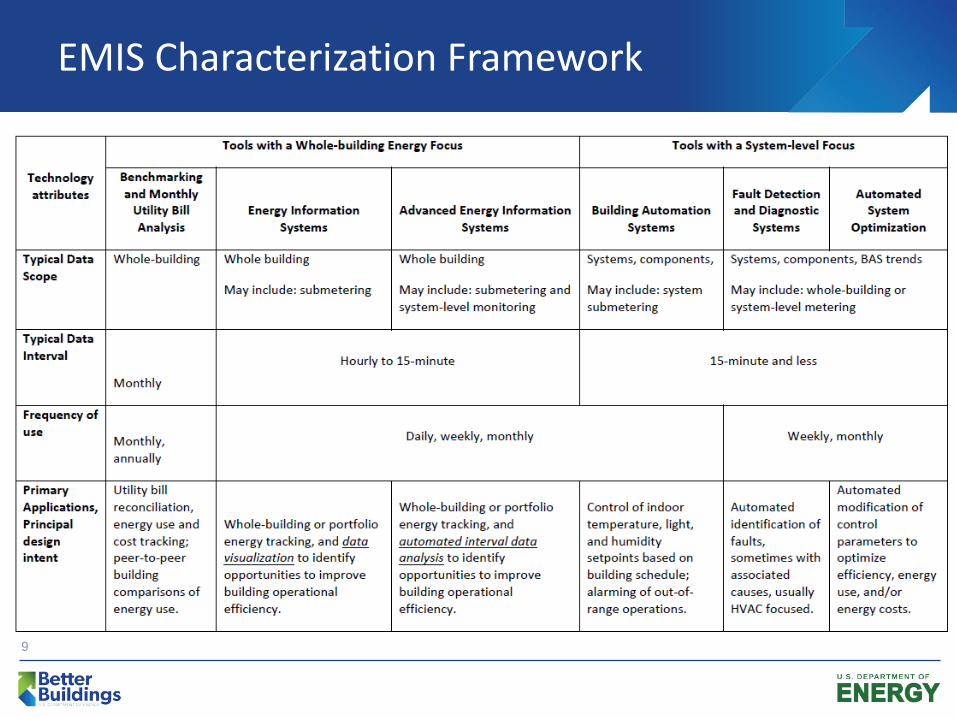
EMIS Characterization Framework
10
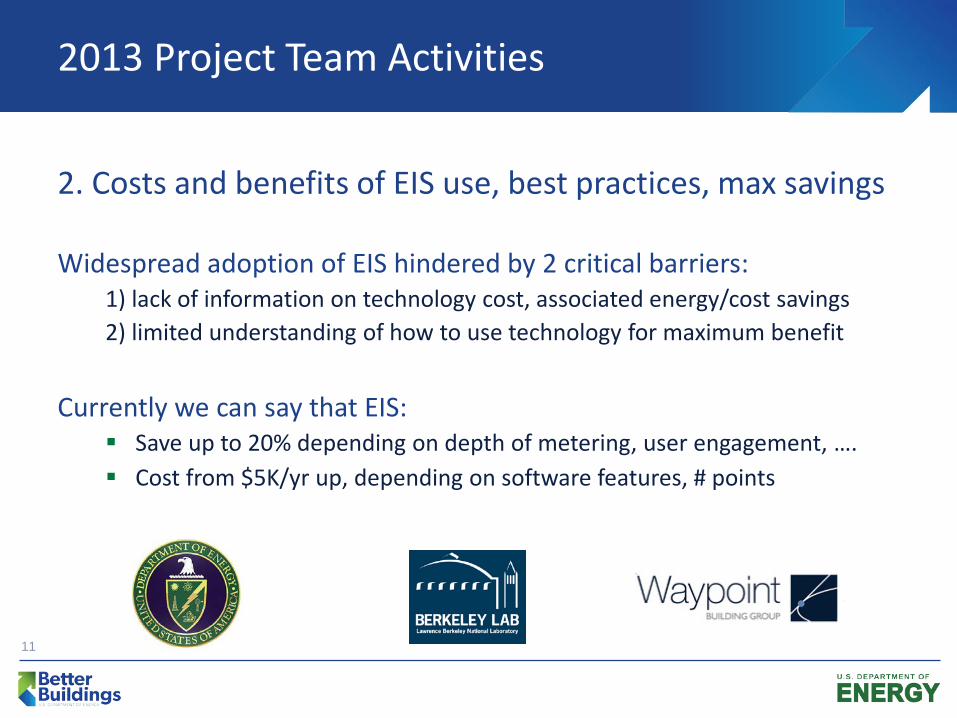
2013 Project Team Activities
2. Costs and benefits of EIS use, best practices, max savings
Widespread adoption of EIS hindered by 2 critical barriers: 1) lack of information on technology cost, associated energy/cost savings 2) limited understanding of how to use technology for maximum benefit
Currently we can say that EIS:
Save up to 20% depending on depth of metering, user engagement, …. Cost from $5K/yr up, depending on software features, # points
11
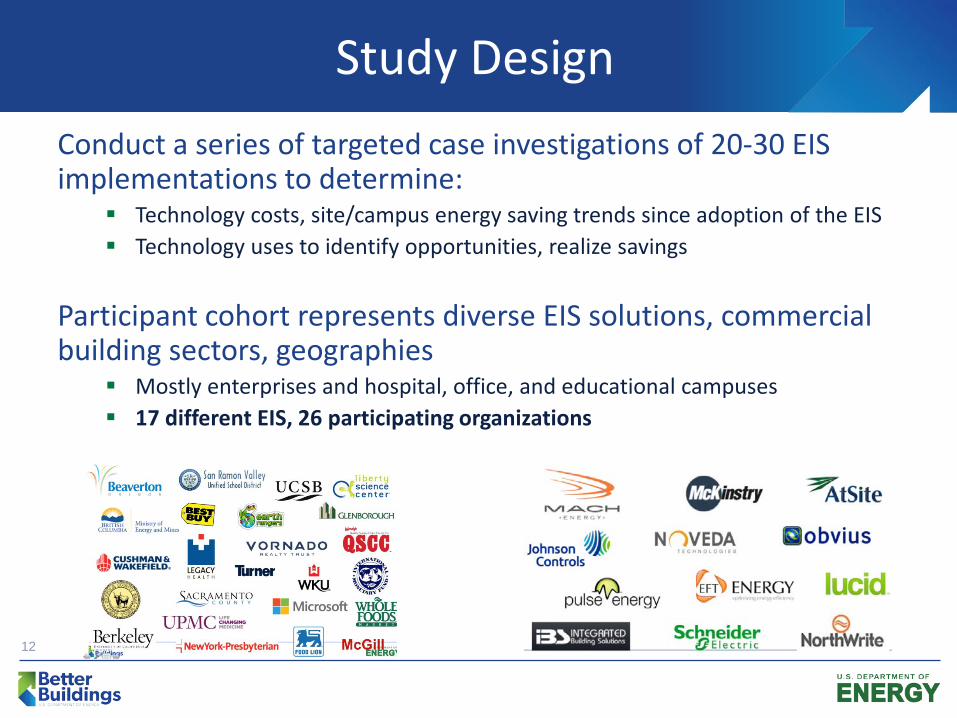
Study Design Conduct a series of targeted case investigations of 20-30 EIS implementations to determine:
Technology costs, site/campus energy saving trends since adoption of the EIS Technology uses to identify opportunities, realize savings
Participant cohort represents diverse EIS solutions, commercial building sectors, geographies
Mostly enterprises and hospital, office, and educational campuses 17 different EIS, 26 participating organizations
12
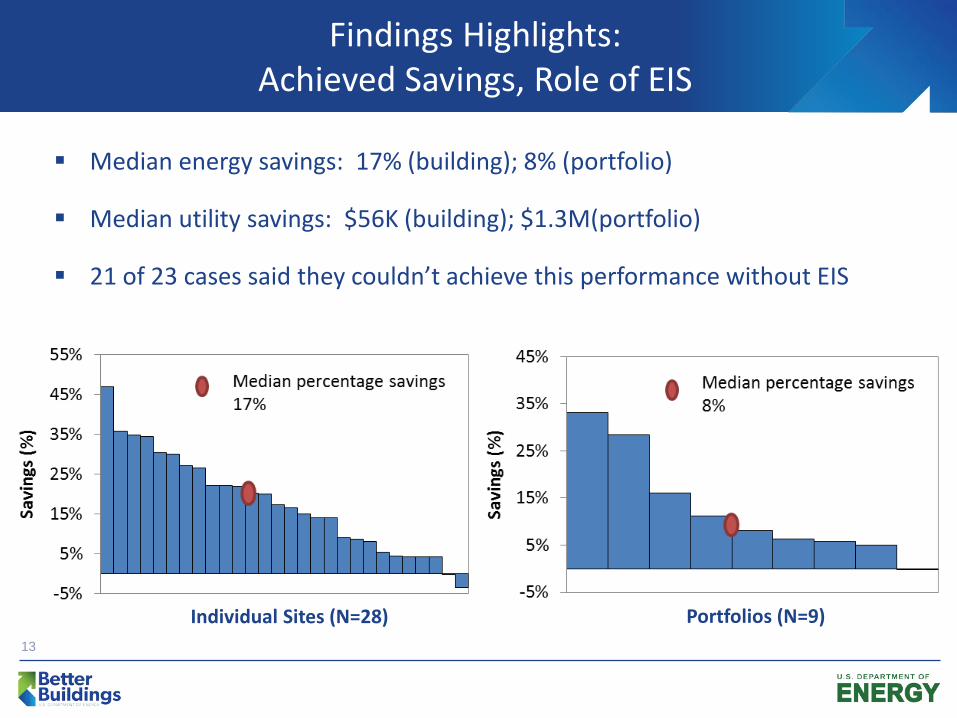
Findings Highlights: Achieved Savings, Role of EIS
Median energy savings: 17% (building); 8% (portfolio)
Median utility savings: $56K (building); $1.3M(portfolio)
21 of 23 cases said they couldn’t achieve this performance without EIS
13
Individual Sites (N=28) Portfolios (N=9)
Findings Highlights: Key Factors Associated with Greater Energy Savings
Most associated with deeper energy savings: Extent of efficiency projects Median energy savings 5% (compared with buildings that had low
extent of EE projects)
Initial EUI
Next strongest factors: Depth of metering Years of EIS installation
14
Findings Highlights: EIS Benefits
Most frequently cited benefits of EIS included: Identification of operational efficiency opportunities
Scheduling, faults and anomalies, changes in load profile Ability to track performance, compare to self and others Monitoring of peak load and managing demand charges Utility billing validation Data for other custom analyses Information to ground and set energy goals
15
“To realize savings you have to provide tools to enable people to measure their success - you
can’t put a price tag on that.”
“Operators ended up considering it like a game… Everybody in the building got excited,
and realized how powerful the tool was, and that it would really be used to save”
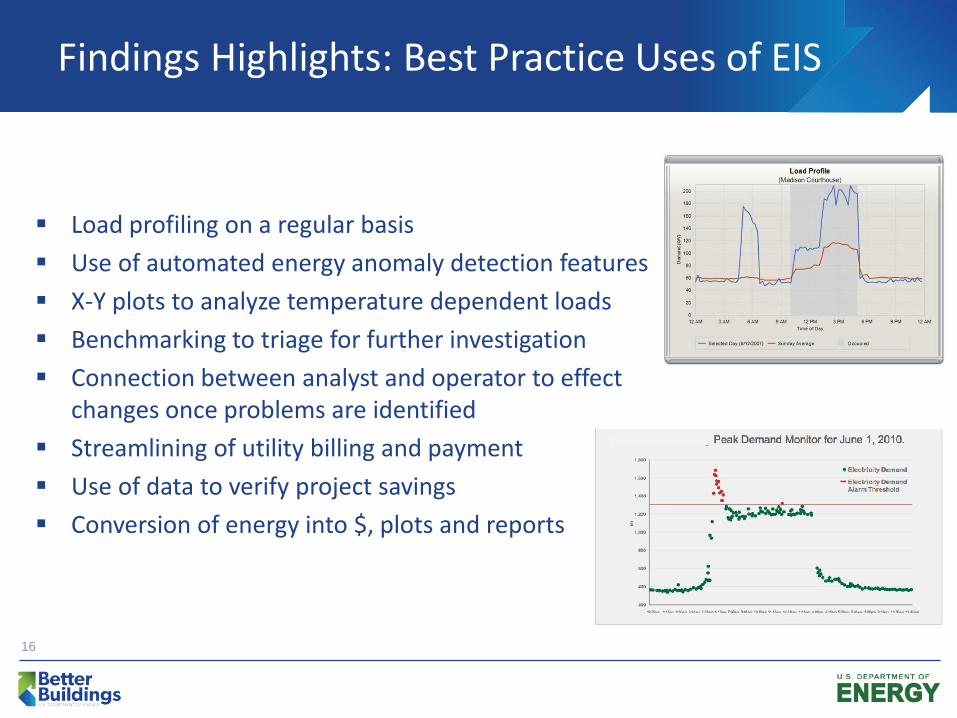
Findings Highlights: Best Practice Uses of EIS
Load profiling on a regular basis Use of automated energy anomaly detection features X-Y plots to analyze temperature dependent loads Benchmarking to triage for further investigation Connection between analyst and operator to effect
changes once problems are identified Streamlining of utility billing and payment Use of data to verify project savings Conversion of energy into $, plots and reports
16
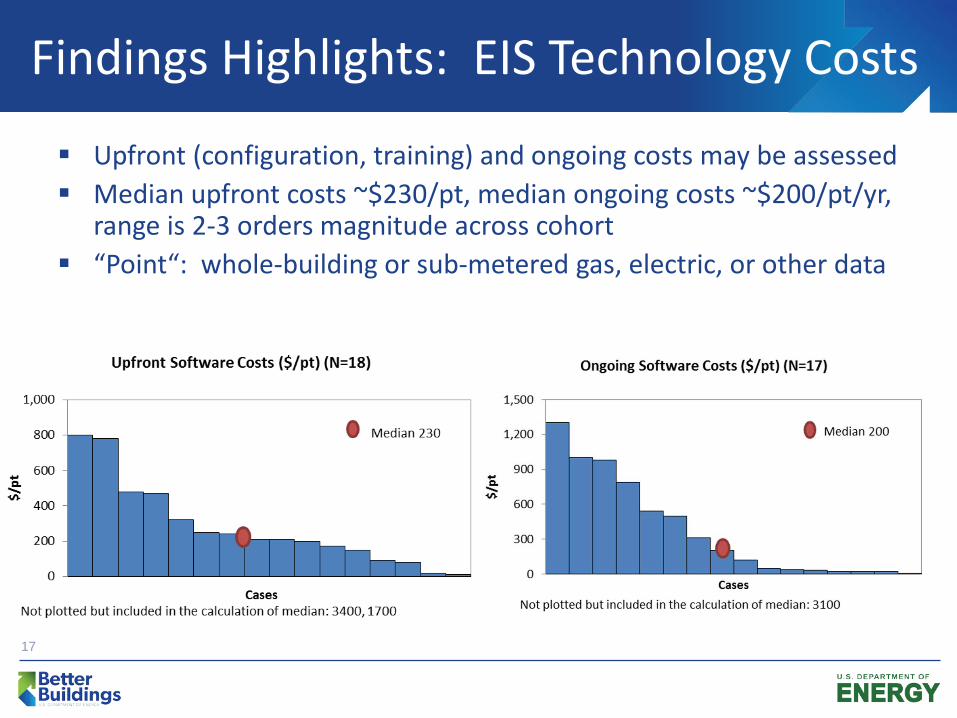
Findings Highlights: EIS Technology Costs
Upfront (configuration, training) and ongoing costs may be assessed Median upfront costs ~$230/pt, median ongoing costs ~$200/pt/yr,
range is 2-3 orders magnitude across cohort “Point“: whole-building or sub-metered gas, electric, or other data
17
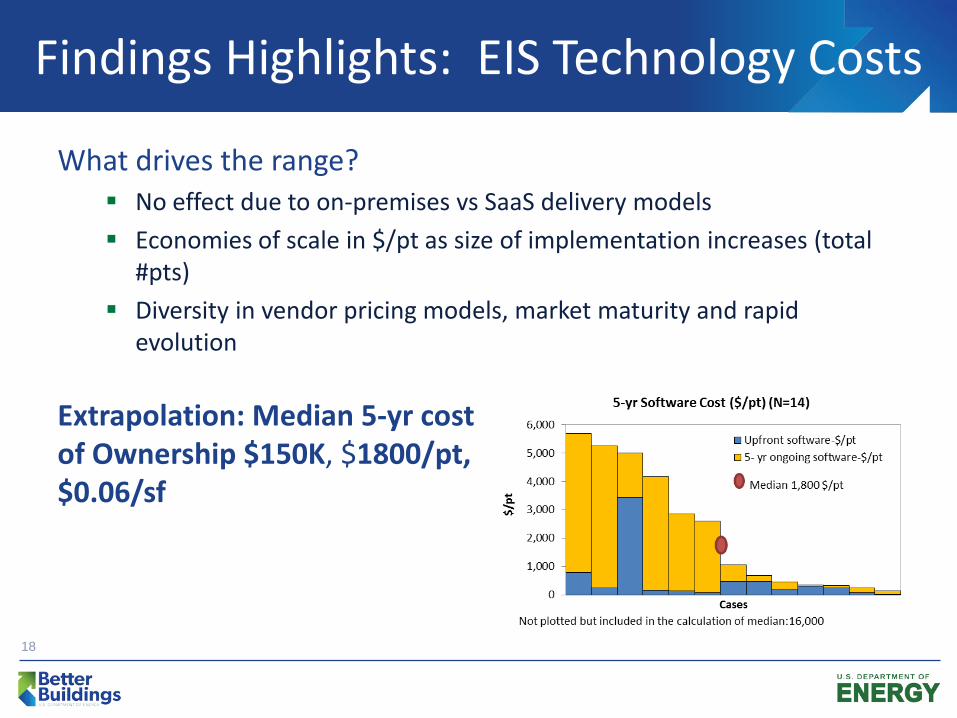
Findings Highlights: EIS Technology Costs
What drives the range? No effect due to on-premises vs SaaS delivery models Economies of scale in $/pt as size of implementation increases (total
#pts) Diversity in vendor pricing models, market maturity and rapid
evolution
18
Extrapolation: Median 5-yr cost of Ownership $150K, $1800/pt, $0.06/sf
Findings Highlights: Payback Period
“Does a car mechanic quantify the value of their tools?”
2 cases self-reported payback, and for 2 cases the R&D team was able to calculate a payback based on data collected
Payback < 2 years in 3 of 4 case instances, within the range reported in the literature Case 1: 3.4 year payback for 2 buildings, 4.3 for another Case 2: 1.2 years for full campus deployment Case 3: <1 month due to non-energy savings, streamlining of
personnel bill payment Case 4: <2 months
19
Member Experiences and Vendor Quick Takes with EMIS
20
Project Team Member Experiences
Technologies implemented Goals motivating implementation Top energy management practices the technology
has enabled 1 lesson learned that you’d like to share with others
21
~3 members, 3-5 minutes each
Vendor Perspectives
Key technology advancements in last 3-5 years Critical industry challenges in next 3-5 years 2 questions you’d ask the membership, project team
or laboratories
22
~3 vendors, 3-5 minutes each
2014 Project Team Activities
2014 Activity for BBA Members: Implement or expand the use of EMIS in your organization
Resources to support this activity Crash course to successful EMIS use, with ‘Cliff’s notes’ synthesis of existing
guides, handbooks, case studies, specifications
Regional guide to utility EMIS incentives to offset first costs
Product overviews and guest logins – EMIS of highest interest to members
Procurement support materials to facilitate an owner-driven spec, bid, selection process analogous to other building technologies
23
Crash Course
24
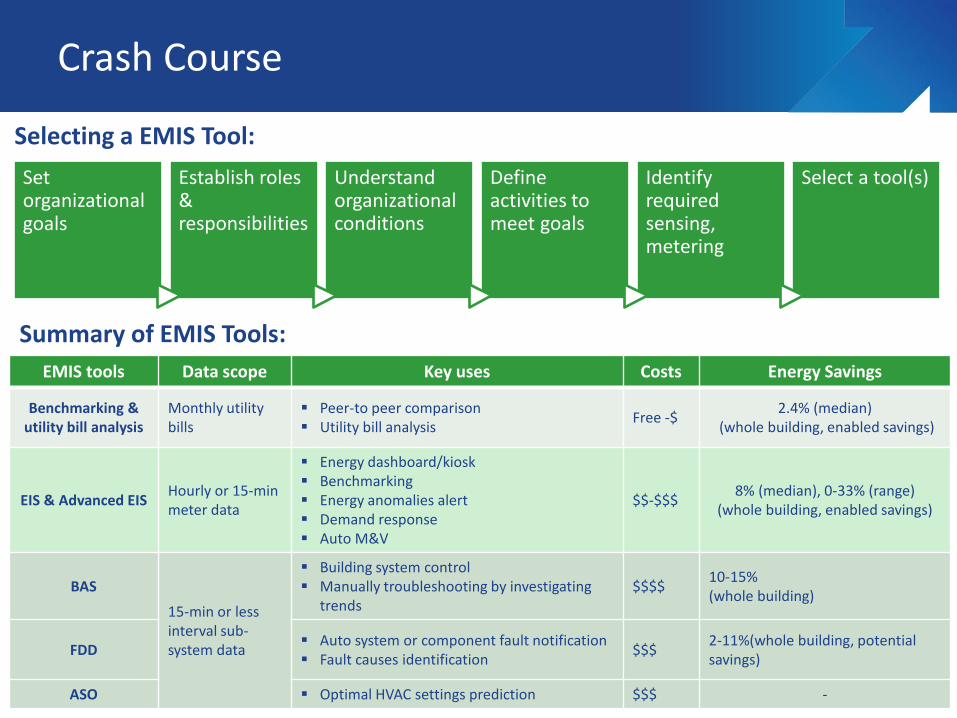
Selecting a EMIS Tool:
EMIS tools Data scope Key uses Costs Energy Savings
Benchmarking & utility bill analysis
Monthly utility bills
Peer-to peer comparison Utility bill analysis Free -$ 2.4% (median)
(whole building, enabled savings)
EIS & Advanced EIS Hourly or 15-min meter data
Energy dashboard/kiosk Benchmarking Energy anomalies alert Demand response Auto M&V
$$-$$$ 8% (median), 0-33% (range) (whole building, enabled savings)
BAS
15-min or less interval sub-system data
Building system control Manually troubleshooting by investigating
trends $$$$ 10-15%
(whole building)
FDD Auto system or component fault notification Fault causes identification $$$ 2-11%(whole building, potential
savings)
ASO Optimal HVAC settings prediction $$$ -
Summary of EMIS Tools:
Set organizational goals
Establish roles & responsibilities
Understand organizational conditions
Define activities to meet goals
Identify required sensing, metering
Select a tool(s)
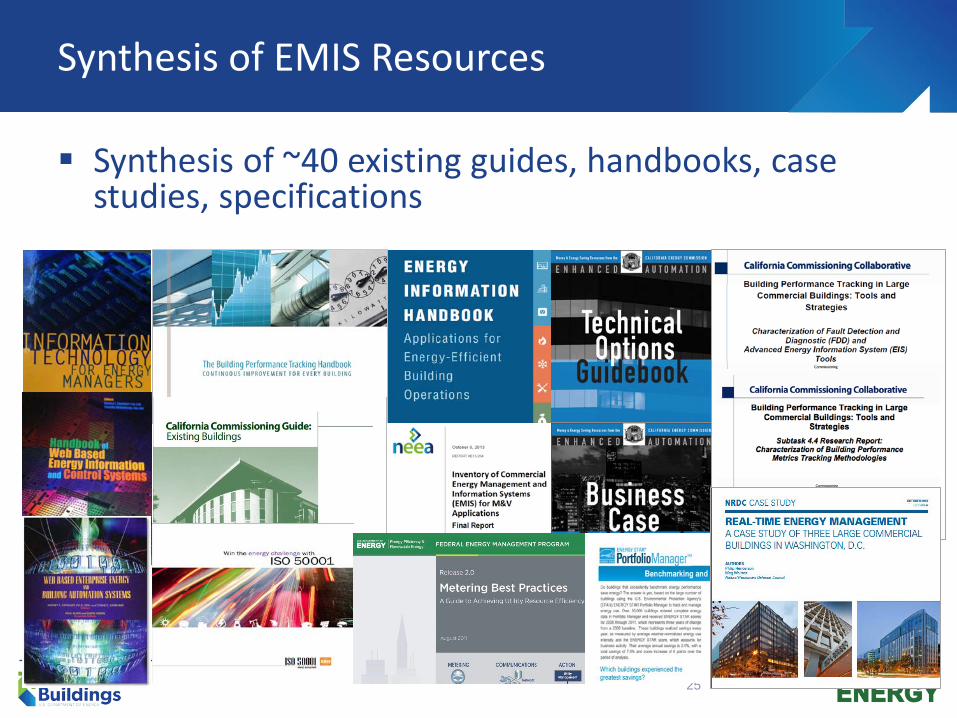
Synthesis of EMIS Resources
Synthesis of ~40 existing guides, handbooks, case studies, specifications
25
Synthesis of EMIS Resources
26
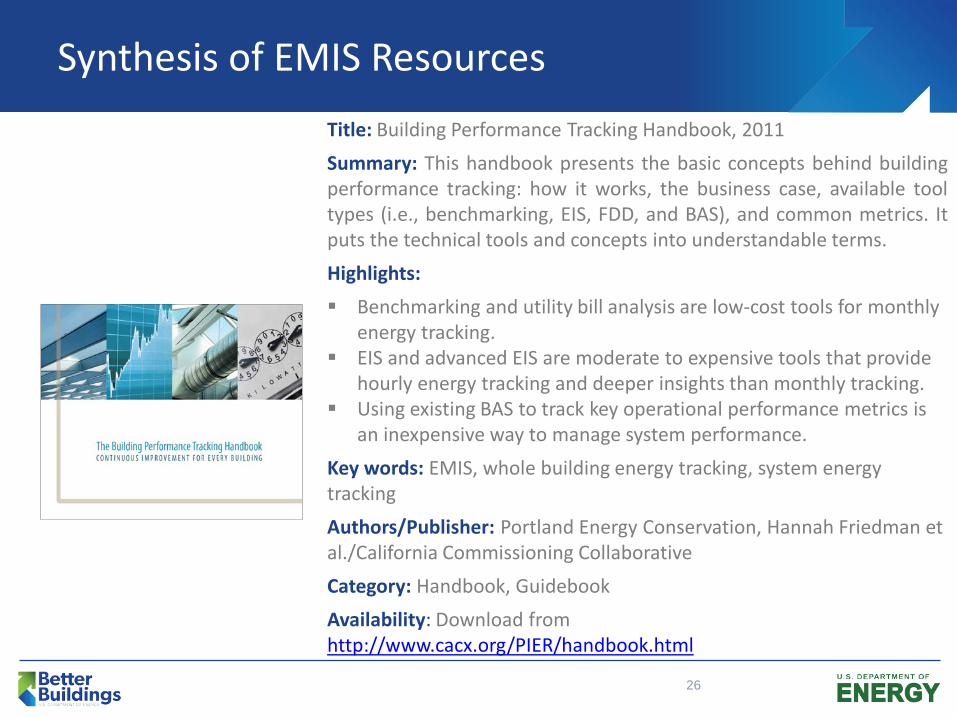
Title: Building Performance Tracking Handbook, 2011 Summary: This handbook presents the basic concepts behind building performance tracking: how it works, the business case, available tool types (i.e., benchmarking, EIS, FDD, and BAS), and common metrics. It puts the technical tools and concepts into understandable terms. Highlights: Benchmarking and utility bill analysis are low-cost tools for monthly
energy tracking. EIS and advanced EIS are moderate to expensive tools that provide
hourly energy tracking and deeper insights than monthly tracking. Using existing BAS to track key operational performance metrics is
an inexpensive way to manage system performance. Key words: EMIS, whole building energy tracking, system energy tracking Authors/Publisher: Portland Energy Conservation, Hannah Friedman et al./California Commissioning Collaborative Category: Handbook, Guidebook Availability: Download from http://www.cacx.org/PIER/handbook.html
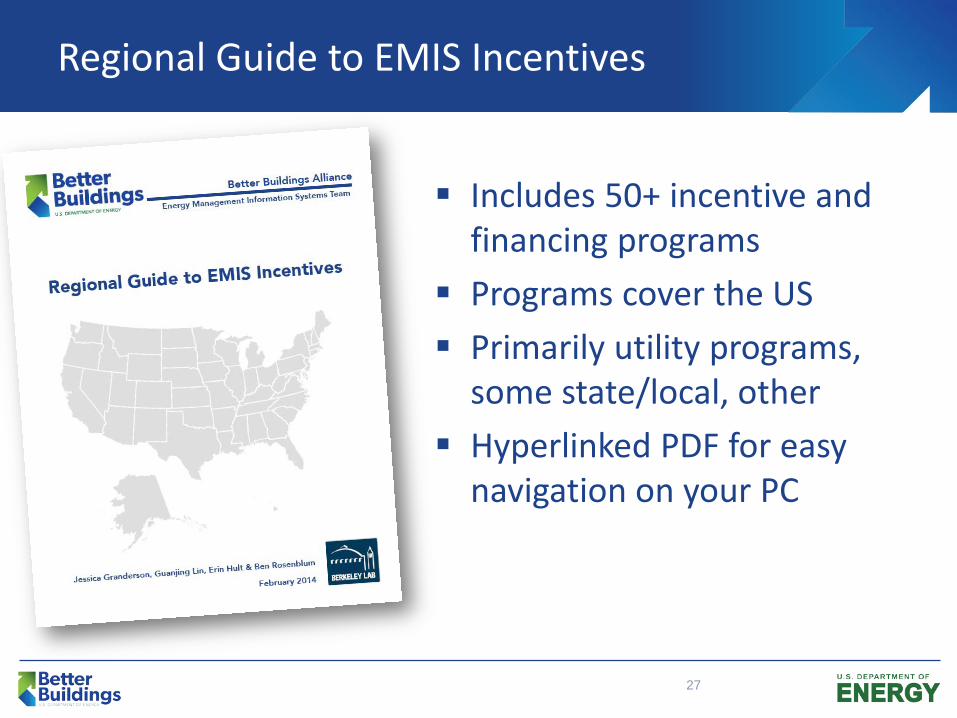
Regional Guide to EMIS Incentives
Includes 50+ incentive and financing programs
Programs cover the US Primarily utility programs,
some state/local, other Hyperlinked PDF for easy
navigation on your PC
27
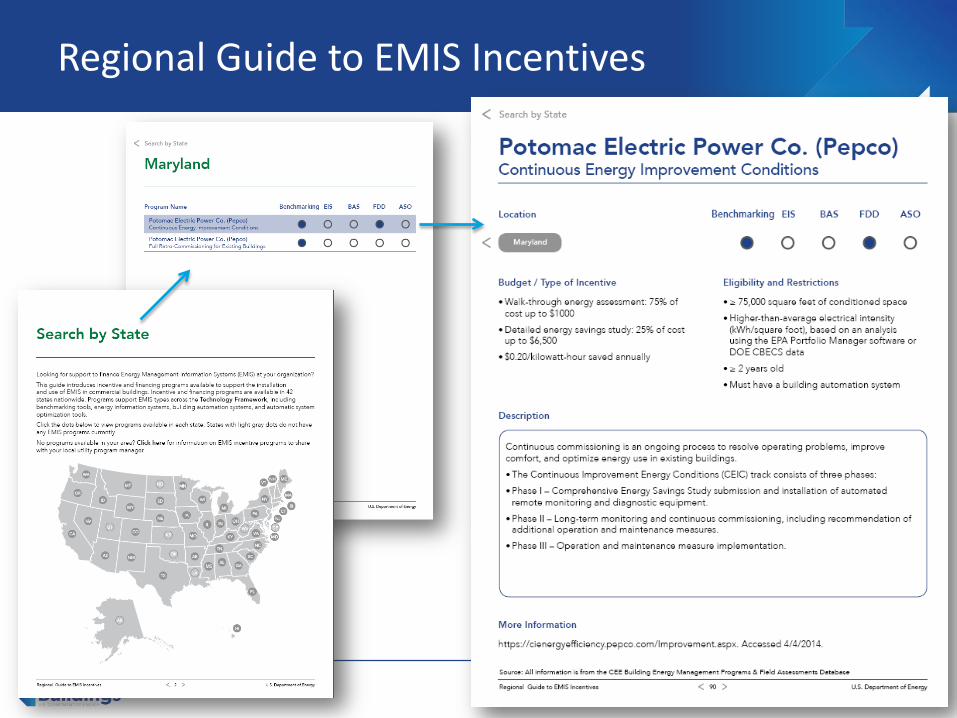
Regional Guide to EMIS Incentives
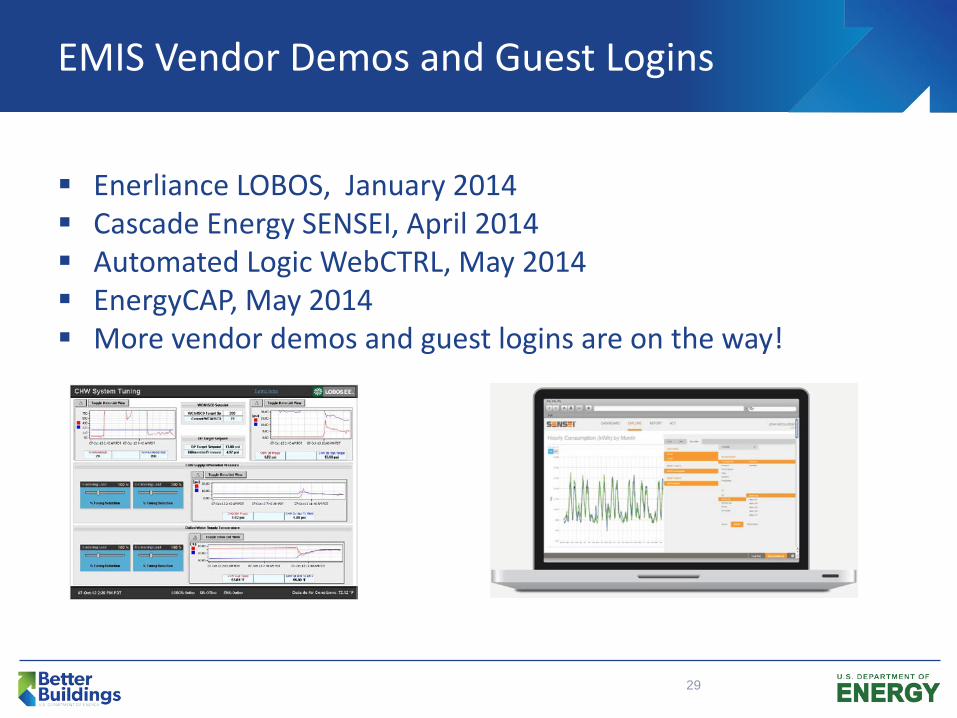
EMIS Vendor Demos and Guest Logins
Enerliance LOBOS, January 2014 Cascade Energy SENSEI, April 2014 Automated Logic WebCTRL, May 2014 EnergyCAP, May 2014 More vendor demos and guest logins are on the way!
29
Next Steps in Development
EMIS product overviews and guest logins Develop EIS procurement support materials Work with members to : Identify opportunities for expanded/new EMIS use Implement technologies Track impacts
Identify FY15 focus areas at BBA summit Continue integration of BBA resources and outcomes
with CBERD Monitoring and Benchmarking tasks Specifications, info on costs and benefits, common industry partners
30
Discussion: Member Needs, Potential Team Activities
31
What are critical member challenges in the proactive use of data?
What new knowledge is needed? What activities best support learning from one
another?
2nd EMIS Team Session (2:30pm): Critical member challenges Discussion of future Project Team activities
Next Session
32
Afternoon session will focus on needs and next year’s activities
THANK YOU
eere.energy.gov/betterbuildingsalliance/EMIS eis.lbl.gov
33
Jessica Granderson [email protected]
510.486.6792

34

EMIS: Creating Efficiency through Effective Energy Information Tracking, Analysis and Optimization
Jessica Granderson, PhD Guanjing Lin, PhD, Erin Hult, PhD Lawrence Berkeley National Laboratory
2014 Better Buildings Summit, May 7,2014
Outline
36
Data Information Action
Welcome and Introductions EMIS Project Team Introduction, Recap of Last Session’s Themes Critical Member Challenges Group Discussion

Introductions Around the Room
37
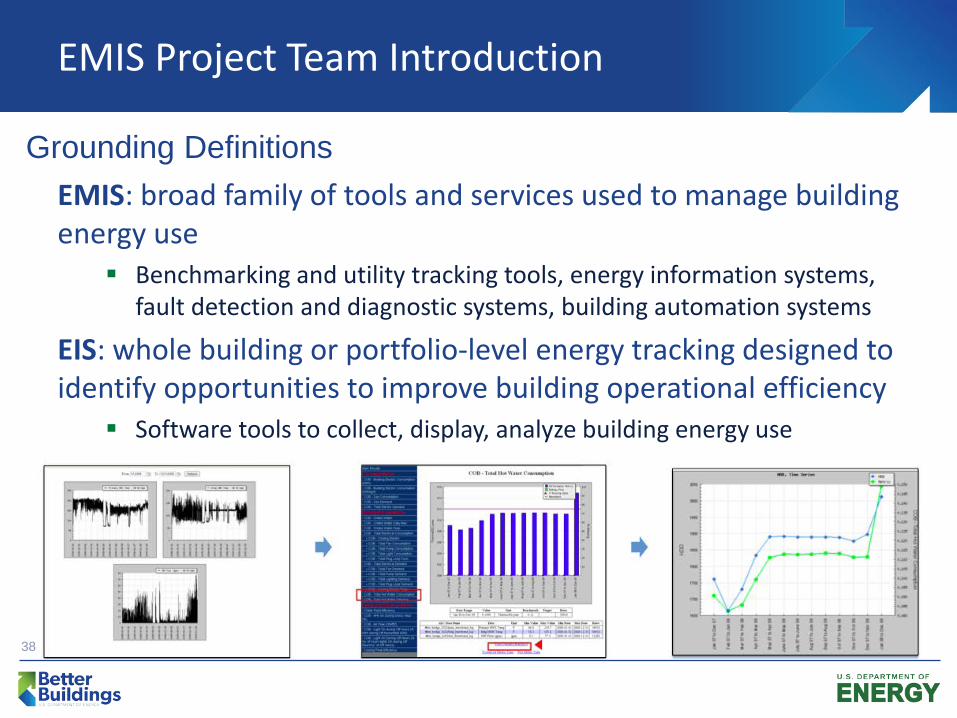
EMIS Project Team Introduction
EMIS: broad family of tools and services used to manage building energy use
Benchmarking and utility tracking tools, energy information systems, fault detection and diagnostic systems, building automation systems
EIS: whole building or portfolio-level energy tracking designed to identify opportunities to improve building operational efficiency
Software tools to collect, display, analyze building energy use
38
Grounding Definitions
39
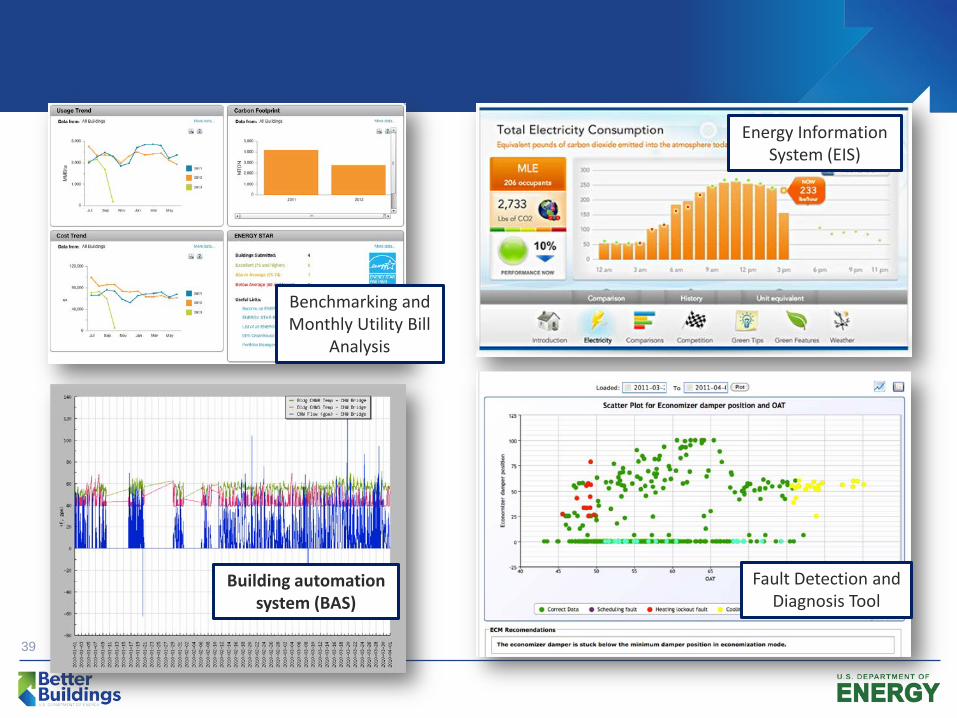
Energy Information System (EIS)
Building automation system (BAS)
Fault Detection and Diagnosis Tool
Benchmarking and Monthly Utility Bill
Analysis
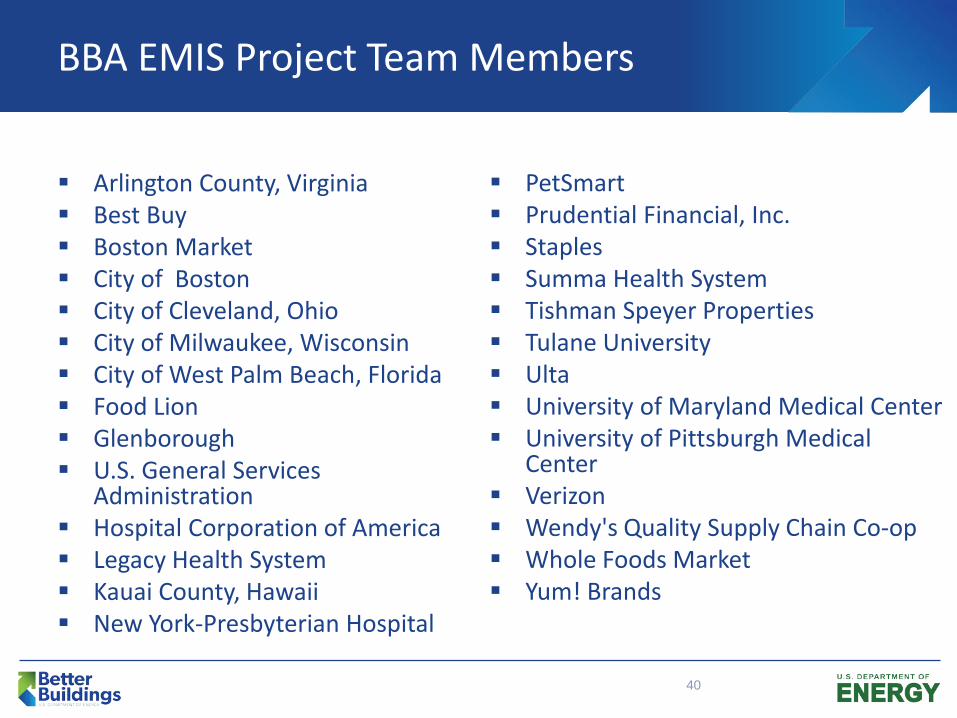
BBA EMIS Project Team Members
Arlington County, Virginia Best Buy Boston Market City of Boston City of Cleveland, Ohio City of Milwaukee, Wisconsin City of West Palm Beach, Florida Food Lion Glenborough U.S. General Services
Administration Hospital Corporation of America Legacy Health System Kauai County, Hawaii New York-Presbyterian Hospital
40
PetSmart Prudential Financial, Inc. Staples Summa Health System Tishman Speyer Properties Tulane University Ulta University of Maryland Medical Center University of Pittsburgh Medical
Center Verizon Wendy's Quality Supply Chain Co-op Whole Foods Market Yum! Brands
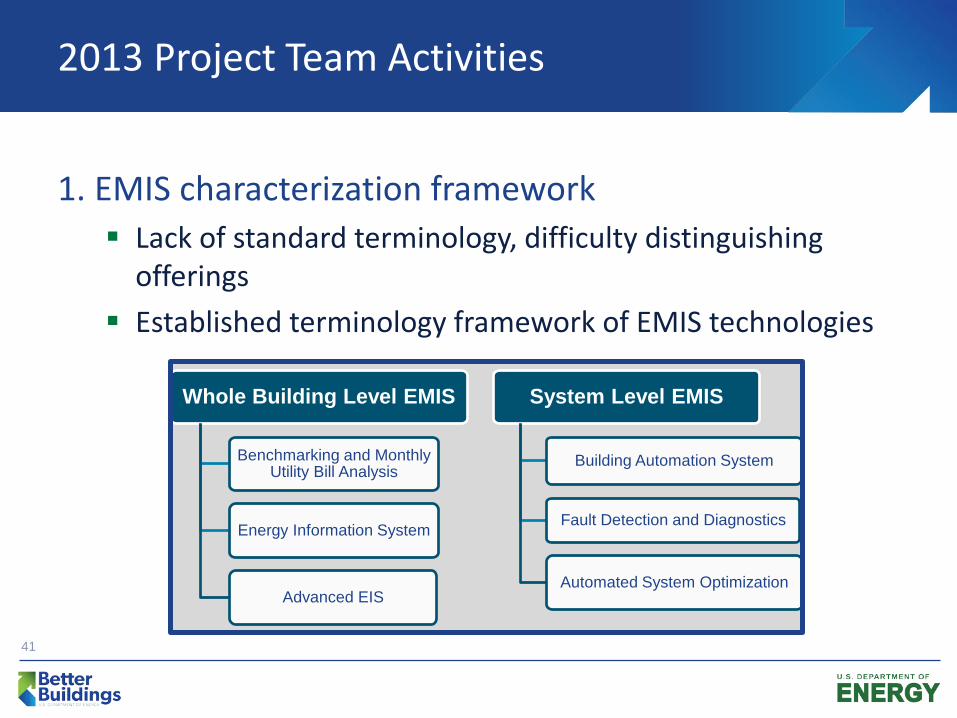
2013 Project Team Activities
1. EMIS characterization framework Lack of standard terminology, difficulty distinguishing
offerings Established terminology framework of EMIS technologies
41
Whole Building Level EMIS
Benchmarking and Monthly Utility Bill Analysis
Energy Information System
Advanced EIS
System Level EMIS
Building Automation System
Fault Detection and Diagnostics
Automated System Optimization
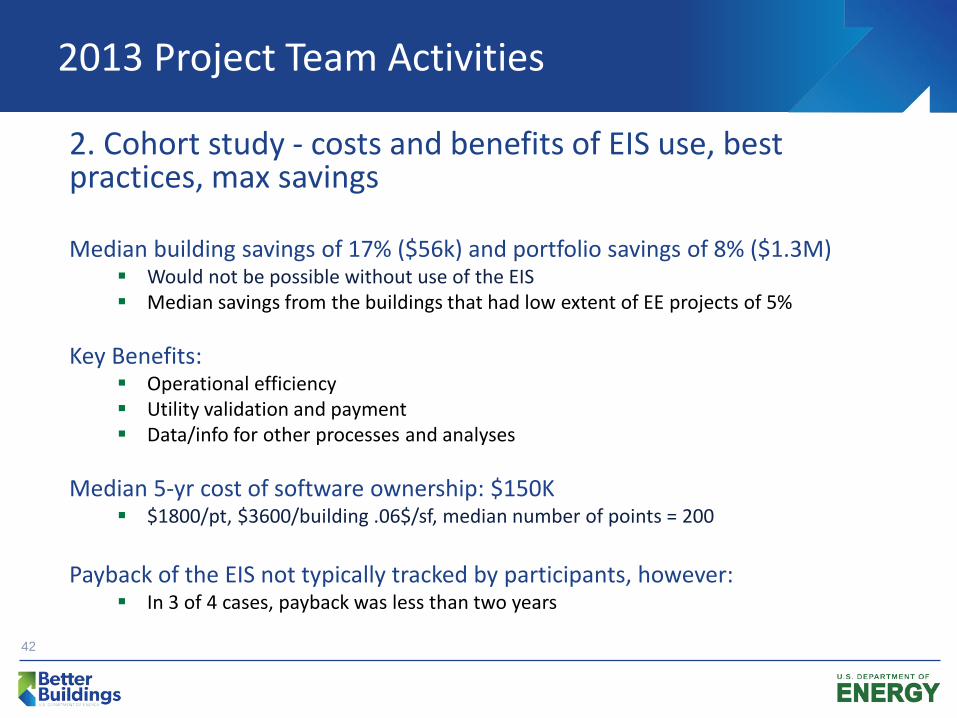
2013 Project Team Activities
2. Cohort study - costs and benefits of EIS use, best practices, max savings Median building savings of 17% ($56k) and portfolio savings of 8% ($1.3M)
Would not be possible without use of the EIS Median savings from the buildings that had low extent of EE projects of 5%
Key Benefits:
Operational efficiency Utility validation and payment Data/info for other processes and analyses
Median 5-yr cost of software ownership: $150K
$1800/pt, $3600/building .06$/sf, median number of points = 200
Payback of the EIS not typically tracked by participants, however: In 3 of 4 cases, payback was less than two years
42
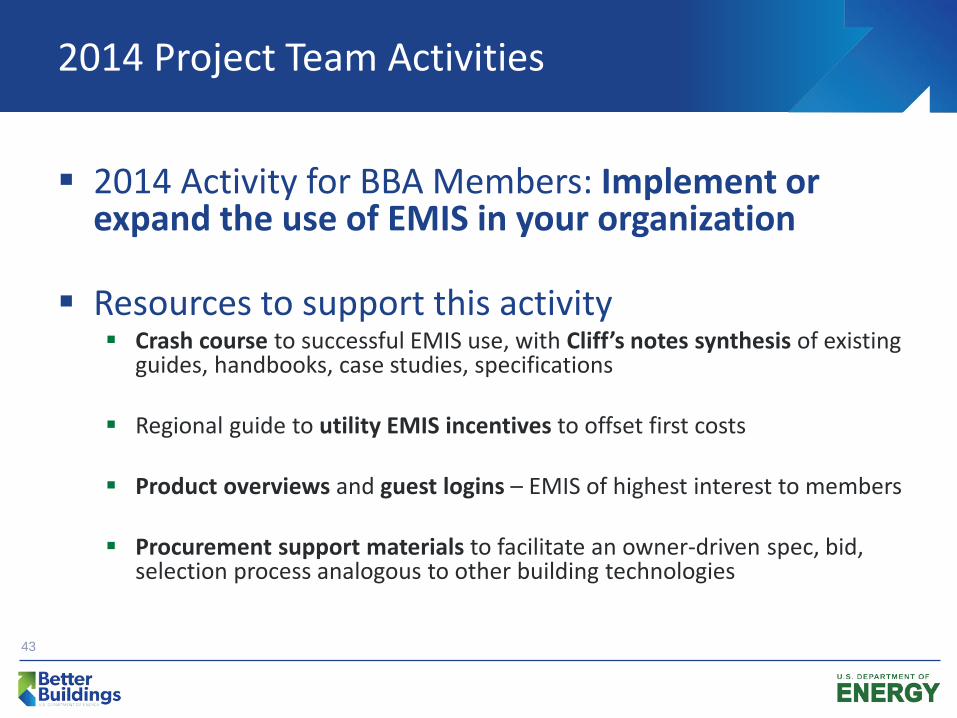
2014 Project Team Activities
2014 Activity for BBA Members: Implement or expand the use of EMIS in your organization
Resources to support this activity Crash course to successful EMIS use, with Cliff’s notes synthesis of existing
guides, handbooks, case studies, specifications
Regional guide to utility EMIS incentives to offset first costs
Product overviews and guest logins – EMIS of highest interest to members
Procurement support materials to facilitate an owner-driven spec, bid, selection process analogous to other building technologies
43
Critical Member Challenges in the Proactive Use of Energy Data
44
Recap of morning themes
Quick summary of outcomes from morning quick takes and discussion
45
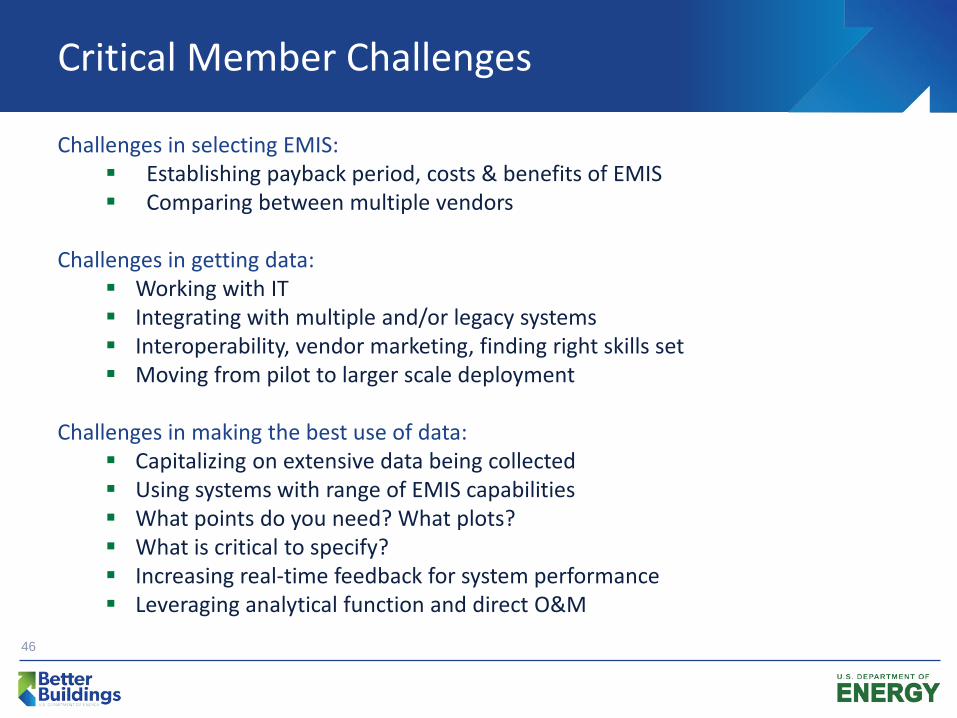
Critical Member Challenges
Challenges in selecting EMIS: Establishing payback period, costs & benefits of EMIS Comparing between multiple vendors
Challenges in getting data:
Working with IT Integrating with multiple and/or legacy systems Interoperability, vendor marketing, finding right skills set Moving from pilot to larger scale deployment
Challenges in making the best use of data:
Capitalizing on extensive data being collected Using systems with range of EMIS capabilities What points do you need? What plots? What is critical to specify? Increasing real-time feedback for system performance Leveraging analytical function and direct O&M
46

Group Discussion
47
Discussion of Future Project Team Focus Areas, Membership Needs
How can BBA members, the laboratories, and industry better collaborate to increase technology effectiveness and adoption?
How can we deliver value as a project team? What activities would best support learning from one another? What new knowledge is needed?
Critical focus areas based on discussion in the last and this session? 48
Discussion of Future Project Team Focus Areas, Membership Needs
What projects would you want to see?
Identify most critical data points, associated EMIS plots/metrics/ EMIS selection and deployment: Compare EMIS tools side by side,
including in-house & SaaS deployment options Automation of project tracking/M&V, making the case to Finance Integration, getting data Finding the right skills set, collaborating with IT; Deployment assistance, design of continuous energy mgt and
tracking processes, what to monitor and display based on goals Overviews of EMIS of interest, vendor demos National by-region overview of utility programs to support EMIS
implementation projects 49
We welcome your participation EMIS Project Team Activities! Please sign up!
Synthesis of EMIS resources EMIS incentive guide Overview of EMIS products (ongoing) Procurement supporting materials for EIS Next project team meeting: May 30, 1-2pm EST
Demonstration of EnergyCAP, guest login
Contact: Jessica Granderson, [email protected], 510.486.6792 Your BBA account managers
THANK YOU
eere.energy.gov/betterbuildingsalliance/EMIS eis.lbl.gov
51


