
148ENABLING THE BUSINESS OF AGRICULTURE 2016 COUNTRY TABLES
The team collected data in 40 countries in the following 11 areas: seed, fertilizer, machinery, finance,
markets, transport, land, information and communications technology (ICT), water, livestock and
environmental sustainability. Six of the topics were chosen for scoring and are presented in this
section.
COUNTRY TABLES

BANGLADESH SOUTH ASIALOWER MIDDLE INCOME
SEED70.8
FERTILIZER52.8
MACHINERY38.1
FINANCE60.1
MARKETS80.4
TRANSPORT60.7
SEED∆ Seed registration (0–100)Procedures (number)Time (days)Cost in US$ (% income per capita)∆ Seed development and certification (0–100)
FERTILIZER∆ Fertilizer registration (0–100)Procedures (number)Time (days)Cost in US$ (% income per capita)∂ Fertilizer quality control (0–100)◊ Fertilizer import requirements (0–100)Cost to register as an importer of fertilizer in US$ (% income per capita)Cost to obtain an import permit for fertilizer in US$ (% income per capita)
MACHINERY∆ Tractor dealer requirements (0–100)∂ Tractor standards and safety (0–100)◊ Tractor import requirements (0–100)Cost to register as an importer of tractors in US$ (% income per capita)Cost to obtain an import permit for tractors in US$ (% income per capita)
FINANCE∆ Microfinance institutions (0–100)∆ Credit unions (0–100)∆ Agent banking (0–100)∆ Electronic money (0–100)∆ Warehouse receipts (0–100)
MARKETS∆ Production and sales (0–100)∂ Plant protection (0–100)Export documents per shipment (number)Time to prepare export documents (days)Cost of export documents in US$ (% income per capita)Trader licensing and membership requirements (number)Cost of licenses and membership in US$ (% income per capita)
TRANSPORT∆ Truck licenses (0–100)Time to obtain company license (days)Cost to obtain company license in US$ (% income per capita)Validity of company license (years)Time to obtain truck permit (days)Cost to obtain truck permit in US$ (% income per capita)Validity of truck permit (years)Cost to obtain vehicle technical inspection in US$ (% income per capita)Validity of vehicle inspection (years)◊ Cross-border transportation (0–100)
OPERATIONS (∆)60.6
QUALITY CONTROL (∂)51.7
TRADE (◊)55.7
The operations score is an average of seed, fertilizer, machinery, finance, markets and transport indicator scores indicated with a ∆. The quality control score is an average of seed, fertilizer, machinery and markets indicator scores indicated with a ∂. The trade score is an average of fertilizer, machinery and transport indicator scores indicated with a ◊.
70.884.4
2a
3a
0.0a
57.1
52.845.0
7951
702.6 (65.1)66.746.7
238.2 (22.1)0
38.137.513.363.3
238.2 (22.1)446.6 (41.3)
60.157.160.0100
25.058.3
80.485.775.0
11
6.0 (0.6)0
N/A
60.764.3N/AN/AN/A3.5
30.0 (2.8)3
10.7 (1.0)1
57.1
a. Registration is not available for maize varieties. Private companies can, at their discretion and at no cost, list maize varieties in the national catalogue. This is what the procedures and time capture.
149

BOLIVIA LATIN AMERICA & CARIBBEANLOWER MIDDLE INCOME
SEED84.4
FERTILIZER63.3
MACHINERY38.3
FINANCE65.3
MARKETS81.3
TRANSPORT67.9
OPERATIONS (∆)59.8
QUALITY CONTROL (∂)56.4
TRADE (◊)74.9
The operations score is an average of seed, fertilizer, machinery, finance, markets and transport indicator scores indicated with a ∆. The quality control score is an average of seed, fertilizer, machinery and markets indicator scores indicated with a ∂. The trade score is an average of fertilizer, machinery and transport indicator scores indicated with a ◊.
84.481.3
5517
711.3 (25.1)87.5
63.320.0N/Aa
N/Aa
N/Aa
10070.0
0No data
38.325.0
6.783.3
0N/A
65.366.793.3
091.775.0
81.3100
62.512
54.0 (1.9)0
N/A
67.964.3N/AN/AN/A4.5
10.0 (0.4)1
10 (0.4)1
71.4
a. The private sector is not required to register fertilizer.
SEED∆ Seed registration (0–100)Procedures (number)Time (days)Cost in US$ (% income per capita)∆ Seed development and certification (0–100)
FERTILIZER∆ Fertilizer registration (0–100)Procedures (number)Time (days)Cost in US$ (% income per capita)∂ Fertilizer quality control (0–100)◊ Fertilizer import requirements (0–100)Cost to register as an importer of fertilizer in US$ (% income per capita)Cost to obtain an import permit for fertilizer in US$ (% income per capita)
MACHINERY∆ Tractor dealer requirements (0–100)∂ Tractor standards and safety (0–100)◊ Tractor import requirements (0–100)Cost to register as an importer of tractors in US$ (% income per capita)Cost to obtain an import permit for tractors in US$ (% income per capita)
FINANCE∆ Microfinance institutions (0–100)∆ Credit unions (0–100)∆ Agent banking (0–100)∆ Electronic money (0–100)∆ Warehouse receipts (0–100)
MARKETS∆ Production and sales (0–100)∂ Plant protection (0–100)Export documents per shipment (number)Time to prepare export documents (days)Cost of export documents in US$ (% income per capita)Trader licensing and membership requirements (number)Cost of licenses and membership in US$ (% income per capita)
TRANSPORT∆ Truck licenses (0–100)Time to obtain company license (days)Cost to obtain company license in US$ (% income per capita)Validity of company license (years)Time to obtain truck permit (days)Cost to obtain truck permit in US$ (% income per capita)Validity of truck permit (years)Cost to obtain vehicle technical inspection in US$ (% income per capita)Validity of vehicle inspection (years)◊ Cross-border transportation (0–100)
150

BOSNIA AND HERZEGOVINA EUROPE & CENTRAL ASIAUPPER MIDDLE INCOME
SEED42.0
FERTILIZER94.4
MACHINERY44.0
FINANCE18.1
MARKETS93.8
TRANSPORT71.4
OPERATIONS (∆)61.5
QUALITY CONTROL (∂)71.8
TRADE (◊)73.8
The operations score is an average of seed, fertilizer, machinery, finance, markets and transport indicator scores indicated with a ∆. The quality control score is an average of seed, fertilizer, machinery and markets indicator scores indicated with a ∂. The trade score is an average of fertilizer, machinery and transport indicator scores indicated with a ◊.
42.012.5
No practiceNo practiceNo practice
71.4
94.4100
231
23.3 (0.5)100
83.30
N/A
44.037.527.866.7N/A
N/Aa
18.1N/A b
0N/A b
054.2
93.8100
87.511
26.7 (0.6)0
N/A
71.471.4
60266.7 (5.6)
1030
33.3 (0.7)10
60.0 (1.3)1
71.4
a. 10% of customs value. b. Upper-middle-income countries are not measured under the microfinance institutions indicator and agent banking indicator.
SEED∆ Seed registration (0–100)Procedures (number)Time (days)Cost in US$ (% income per capita)∆ Seed development and certification (0–100)
FERTILIZER∆ Fertilizer registration (0–100)Procedures (number)Time (days)Cost in US$ (% income per capita)∂ Fertilizer quality control (0–100)◊ Fertilizer import requirements (0–100)Cost to register as an importer of fertilizer in US$ (% income per capita)Cost to obtain an import permit for fertilizer in US$ (% income per capita)
MACHINERY∆ Tractor dealer requirements (0–100)∂ Tractor standards and safety (0–100)◊ Tractor import requirements (0–100)Cost to register as an importer of tractors in US$ (% income per capita)Cost to obtain an import permit for tractors in US$ (% income per capita)
FINANCE∆ Microfinance institutions (0–100)∆ Credit unions (0–100)∆ Agent banking (0–100)∆ Electronic money (0–100)∆ Warehouse receipts (0–100)
MARKETS∆ Production and sales (0–100)∂ Plant protection (0–100)Export documents per shipment (number)Time to prepare export documents (days)Cost of export documents in US$ (% income per capita)Trader licensing and membership requirements (number)Cost of licenses and membership in US$ (% income per capita)
TRANSPORT∆ Truck licenses (0–100)Time to obtain company license (days)Cost to obtain company license in US$ (% income per capita)Validity of company license (years)Time to obtain truck permit (days)Cost to obtain truck permit in US$ (% income per capita)Validity of truck permit (years)Cost to obtain vehicle technical inspection in US$ (% income per capita)Validity of vehicle inspection (years)◊ Cross-border transportation (0–100)
151

BURKINA FASO SUB-SAHARAN AFRICALOW INCOME
SEED54.2
FERTILIZER43.9
MACHINERY40.6
FINANCE37.2
MARKETS58.9
TRANSPORT60.7
OPERATIONS (∆)45.3
QUALITY CONTROL (∂)32.8
TRADE (◊)71.3
The operations score is an average of seed, fertilizer, machinery, finance, markets and transport indicator scores indicated with a ∆. The quality control score is an average of seed, fertilizer, machinery and markets indicator scores indicated with a ∂. The trade score is an average of fertilizer, machinery and transport indicator scores indicated with a ◊.
54.265.6
No practiceNo practiceNo practice
42.9
43.90
N/Aa
N/Aa
N/Aa
66.765.0
2.0 (0.3)2.0 (0.3)
40.637.5
6.777.5
30.4 (4.3)2.0 (0.3)
37.242.960.0
083.3
0
58.992.925.0
22
19.2 (2.7)0
N/A
60.750.0N/AN/AN/A
121.0 (3.0)
0.587.0 (12.3)
0.571.4
a. The private sector is not required to register fertilizer.
SEED∆ Seed registration (0–100)Procedures (number)Time (days)Cost in US$ (% income per capita)∆ Seed development and certification (0–100)
FERTILIZER∆ Fertilizer registration (0–100)Procedures (number)Time (days)Cost in US$ (% income per capita)∂ Fertilizer quality control (0–100)◊ Fertilizer import requirements (0–100)Cost to register as an importer of fertilizer in US$ (% income per capita)Cost to obtain an import permit for fertilizer in US$ (% income per capita)
MACHINERY∆ Tractor dealer requirements (0–100)∂ Tractor standards and safety (0–100)◊ Tractor import requirements (0–100)Cost to register as an importer of tractors in US$ (% income per capita)Cost to obtain an import permit for tractors in US$ (% income per capita)
FINANCE∆ Microfinance institutions (0–100)∆ Credit unions (0–100)∆ Agent banking (0–100)∆ Electronic money (0–100)∆ Warehouse receipts (0–100)
MARKETS∆ Production and sales (0–100)∂ Plant protection (0–100)Export documents per shipment (number)Time to prepare export documents (days)Cost of export documents in US$ (% income per capita)Trader licensing and membership requirements (number)Cost of licenses and membership in US$ (% income per capita)
TRANSPORT∆ Truck licenses (0–100)Time to obtain company license (days)Cost to obtain company license in US$ (% income per capita)Validity of company license (years)Time to obtain truck permit (days)Cost to obtain truck permit in US$ (% income per capita)Validity of truck permit (years)Cost to obtain vehicle technical inspection in US$ (% income per capita)Validity of vehicle inspection (years)◊ Cross-border transportation (0–100)
152
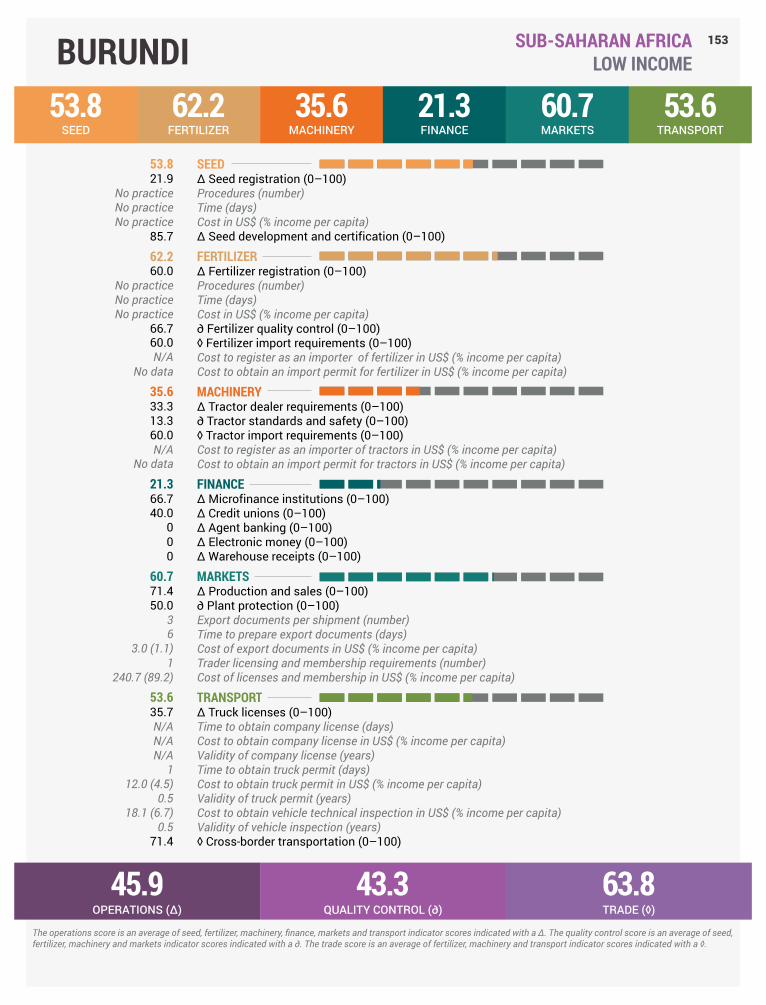
BURUNDI SUB-SAHARAN AFRICALOW INCOME
SEED53.8
FERTILIZER62.2
MACHINERY35.6
FINANCE21.3
MARKETS60.7
TRANSPORT53.6
OPERATIONS (∆)45.9
QUALITY CONTROL (∂)43.3
TRADE (◊)63.8
The operations score is an average of seed, fertilizer, machinery, finance, markets and transport indicator scores indicated with a ∆. The quality control score is an average of seed, fertilizer, machinery and markets indicator scores indicated with a ∂. The trade score is an average of fertilizer, machinery and transport indicator scores indicated with a ◊.
53.821.9
No practiceNo practiceNo practice
85.7
62.260.0
No practiceNo practiceNo practice
66.760.0N/A
No data
35.633.313.360.0N/A
No data
21.366.740.0
000
60.771.450.0
36
3.0 (1.1)1
240.7 (89.2)
53.635.7N/AN/AN/A
112.0 (4.5)
0.518.1 (6.7)
0.571.4
SEED∆ Seed registration (0–100)Procedures (number)Time (days)Cost in US$ (% income per capita)∆ Seed development and certification (0–100)
FERTILIZER∆ Fertilizer registration (0–100)Procedures (number)Time (days)Cost in US$ (% income per capita)∂ Fertilizer quality control (0–100)◊ Fertilizer import requirements (0–100)Cost to register as an importer of fertilizer in US$ (% income per capita)Cost to obtain an import permit for fertilizer in US$ (% income per capita)
MACHINERY∆ Tractor dealer requirements (0–100)∂ Tractor standards and safety (0–100)◊ Tractor import requirements (0–100)Cost to register as an importer of tractors in US$ (% income per capita)Cost to obtain an import permit for tractors in US$ (% income per capita)
FINANCE∆ Microfinance institutions (0–100)∆ Credit unions (0–100)∆ Agent banking (0–100)∆ Electronic money (0–100)∆ Warehouse receipts (0–100)
MARKETS∆ Production and sales (0–100)∂ Plant protection (0–100)Export documents per shipment (number)Time to prepare export documents (days)Cost of export documents in US$ (% income per capita)Trader licensing and membership requirements (number)Cost of licenses and membership in US$ (% income per capita)
TRANSPORT∆ Truck licenses (0–100)Time to obtain company license (days)Cost to obtain company license in US$ (% income per capita)Validity of company license (years)Time to obtain truck permit (days)Cost to obtain truck permit in US$ (% income per capita)Validity of truck permit (years)Cost to obtain vehicle technical inspection in US$ (% income per capita)Validity of vehicle inspection (years)◊ Cross-border transportation (0–100)
153

CAMBODIA EAST ASIA & PACIFICLOW INCOME
SEED68.8
FERTILIZER57.2
MACHINERY26.5
FINANCE32.0
MARKETS67.9
TRANSPORT57.1
OPERATIONS (∆)49.1
QUALITY CONTROL (∂)41.1
TRADE (◊)61.3
The operations score is an average of seed, fertilizer, machinery, finance, markets and transport indicator scores indicated with a ∆. The quality control score is an average of seed, fertilizer, machinery and markets indicator scores indicated with a ∂. The trade score is an average of fertilizer, machinery and transport indicator scores indicated with a ◊.
68.837.5
6407
187.0 (18.5)100
57.245.0
3No data a
506.5 (50.1)66.760.0
No dataNo data
26.56.36.7
66.7N/AN/A
32.085.7
074.3
00
67.985.750.0
37
86.6 (8.6)0
N/A
57.157.1
10365.2 (36.2)
23.5
11.0 (1.1)1
26.8 (2.7)1
57.1
a. No data on application for registration, but approval by committee takes 56 days.
SEED∆ Seed registration (0–100)Procedures (number)Time (days)Cost in US$ (% income per capita)∆ Seed development and certification (0–100)
FERTILIZER∆ Fertilizer registration (0–100)Procedures (number)Time (days)Cost in US$ (% income per capita)∂ Fertilizer quality control (0–100)◊ Fertilizer import requirements (0–100)Cost to register as an importer of fertilizer in US$ (% income per capita)Cost to obtain an import permit for fertilizer in US$ (% income per capita)
MACHINERY∆ Tractor dealer requirements (0–100)∂ Tractor standards and safety (0–100)◊ Tractor import requirements (0–100)Cost to register as an importer of tractors in US$ (% income per capita)Cost to obtain an import permit for tractors in US$ (% income per capita)
FINANCE∆ Microfinance institutions (0–100)∆ Credit unions (0–100)∆ Agent banking (0–100)∆ Electronic money (0–100)∆ Warehouse receipts (0–100)
MARKETS∆ Production and sales (0–100)∂ Plant protection (0–100)Export documents per shipment (number)Time to prepare export documents (days)Cost of export documents in US$ (% income per capita)Trader licensing and membership requirements (number)Cost of licenses and membership in US$ (% income per capita)
TRANSPORT∆ Truck licenses (0–100)Time to obtain company license (days)Cost to obtain company license in US$ (% income per capita)Validity of company license (years)Time to obtain truck permit (days)Cost to obtain truck permit in US$ (% income per capita)Validity of truck permit (years)Cost to obtain vehicle technical inspection in US$ (% income per capita)Validity of vehicle inspection (years)◊ Cross-border transportation (0–100)
154
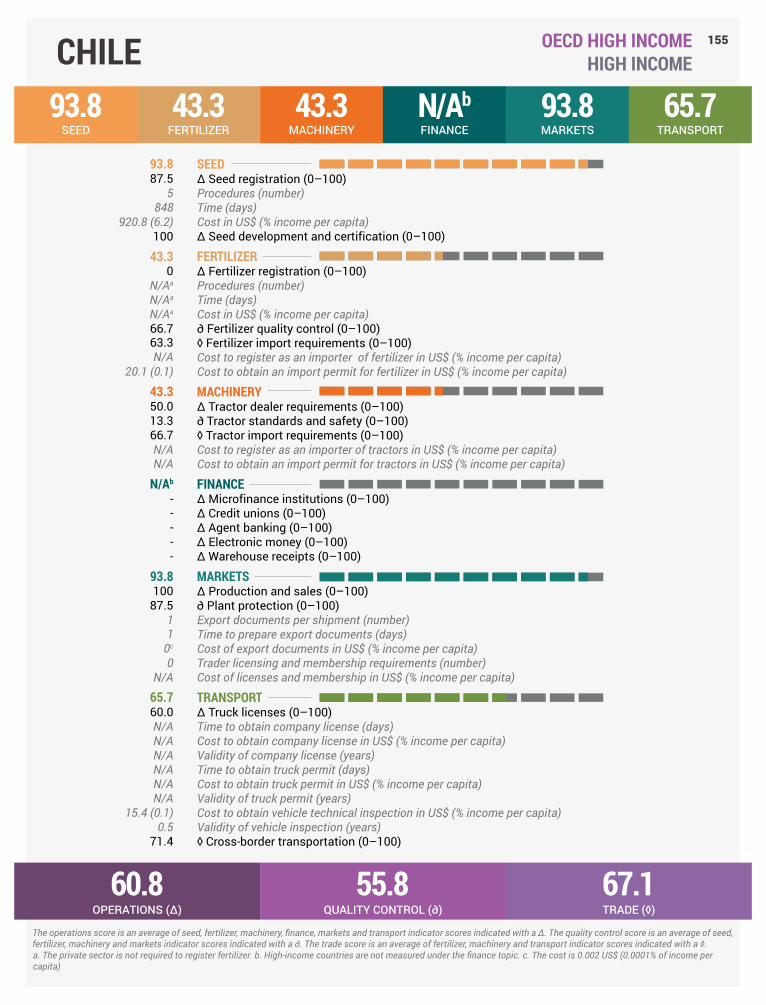
CHILE OECD HIGH INCOMEHIGH INCOME
SEED93.8
FERTILIZER43.3
MACHINERY43.3
FINANCEN/Ab
MARKETS93.8
TRANSPORT65.7
OPERATIONS (∆)60.8
QUALITY CONTROL (∂)55.8
TRADE (◊)67.1
The operations score is an average of seed, fertilizer, machinery, finance, markets and transport indicator scores indicated with a ∆. The quality control score is an average of seed, fertilizer, machinery and markets indicator scores indicated with a ∂. The trade score is an average of fertilizer, machinery and transport indicator scores indicated with a ◊.
93.887.5
5848
920.8 (6.2)100
43.30
N/Aa
N/Aa
N/Aa
66.763.3N/A
20.1 (0.1)
43.350.013.366.7N/AN/A
N/Ab
-----
93.8100
87.511
0c
0N/A
65.760.0N/AN/AN/AN/AN/AN/A
15.4 (0.1)0.5
71.4
a. The private sector is not required to register fertilizer. b. High-income countries are not measured under the finance topic. c. The cost is 0.002 US$ (0.0001% of income percapita)
SEED∆ Seed registration (0–100)Procedures (number)Time (days)Cost in US$ (% income per capita)∆ Seed development and certification (0–100)
FERTILIZER∆ Fertilizer registration (0–100)Procedures (number)Time (days)Cost in US$ (% income per capita)∂ Fertilizer quality control (0–100)◊ Fertilizer import requirements (0–100)Cost to register as an importer of fertilizer in US$ (% income per capita)Cost to obtain an import permit for fertilizer in US$ (% income per capita)
MACHINERY∆ Tractor dealer requirements (0–100)∂ Tractor standards and safety (0–100)◊ Tractor import requirements (0–100)Cost to register as an importer of tractors in US$ (% income per capita)Cost to obtain an import permit for tractors in US$ (% income per capita)
FINANCE∆ Microfinance institutions (0–100)∆ Credit unions (0–100)∆ Agent banking (0–100)∆ Electronic money (0–100)∆ Warehouse receipts (0–100)
MARKETS∆ Production and sales (0–100)∂ Plant protection (0–100)Export documents per shipment (number)Time to prepare export documents (days)Cost of export documents in US$ (% income per capita)Trader licensing and membership requirements (number)Cost of licenses and membership in US$ (% income per capita)
TRANSPORT∆ Truck licenses (0–100)Time to obtain company license (days)Cost to obtain company license in US$ (% income per capita)Validity of company license (years)Time to obtain truck permit (days)Cost to obtain truck permit in US$ (% income per capita)Validity of truck permit (years)Cost to obtain vehicle technical inspection in US$ (% income per capita)Validity of vehicle inspection (years)◊ Cross-border transportation (0–100)
155

COLOMBIA LATIN AMERICA & CARIBBEANUPPER MIDDLE INCOME
SEED75.0
FERTILIZER91.1
MACHINERY50.0
FINANCE89.4
MARKETS93.8
TRANSPORT78.6
OPERATIONS (∆)84.3
QUALITY CONTROL (∂)66.9
TRADE (◊)75.2
The operations score is an average of seed, fertilizer, machinery, finance, markets and transport indicator scores indicated with a ∆. The quality control score is an average of seed, fertilizer, machinery and markets indicator scores indicated with a ∂. The trade score is an average of fertilizer, machinery and transport indicator scores indicated with a ◊.
75.050.0
5591
4,526.4 (58.2)100
91.1100
348
No data100
73.30
31.3 (0.4)
50.070.013.366.7
No dataN/A
89.4N/Aa
93.3N/Aa
91.783.3
93.8100
87.524
No data b
10
78.671.4
57268 (3.4)
Indefinite c
N/AN/AN/A
156.4 (2.0)2
85.7
a. Upper-middle-income countries are not measured under the microfinance institutions indicator and agent banking indicator. b. The cost of document 1 (phytosanitary certificate) is $33.9 (0.4% of income per capita). The cost of document 2 (quality certificate) could not be obtained. c. Has to be validated every year.
SEED∆ Seed registration (0–100)Procedures (number)Time (days)Cost in US$ (% income per capita)∆ Seed development and certification (0–100)
FERTILIZER∆ Fertilizer registration (0–100)Procedures (number)Time (days)Cost in US$ (% income per capita)∂ Fertilizer quality control (0–100)◊ Fertilizer import requirements (0–100)Cost to register as an importer of fertilizer in US$ (% income per capita)Cost to obtain an import permit for fertilizer in US$ (% income per capita)
MACHINERY∆ Tractor dealer requirements (0–100)∂ Tractor standards and safety (0–100)◊ Tractor import requirements (0–100)Cost to register as an importer of tractors in US$ (% income per capita)Cost to obtain an import permit for tractors in US$ (% income per capita)
FINANCE∆ Microfinance institutions (0–100)∆ Credit unions (0–100)∆ Agent banking (0–100)∆ Electronic money (0–100)∆ Warehouse receipts (0–100)
MARKETS∆ Production and sales (0–100)∂ Plant protection (0–100)Export documents per shipment (number)Time to prepare export documents (days)Cost of export documents in US$ (% income per capita)Trader licensing and membership requirements (number)Cost of licenses and membership in US$ (% income per capita)
TRANSPORT∆ Truck licenses (0–100)Time to obtain company license (days)Cost to obtain company license in US$ (% income per capita)Validity of company license (years)Time to obtain truck permit (days)Cost to obtain truck permit in US$ (% income per capita)Validity of truck permit (years)Cost to obtain vehicle technical inspection in US$ (% income per capita)Validity of vehicle inspection (years)◊ Cross-border transportation (0–100)
156
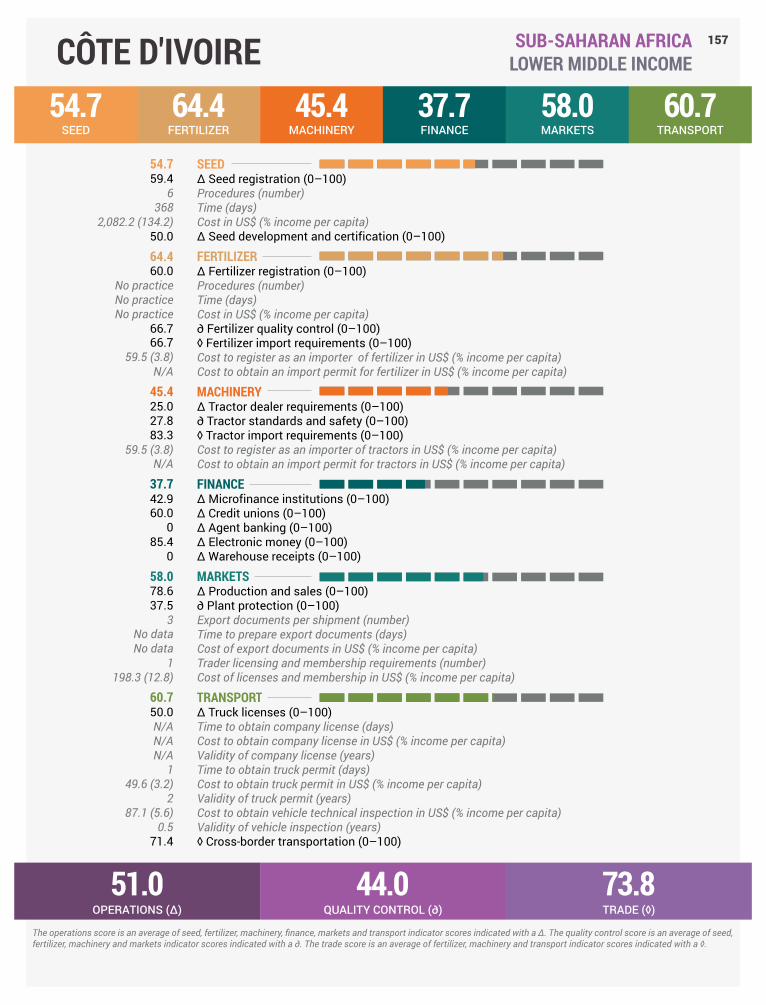
CÔTE D'IVOIRE SUB-SAHARAN AFRICALOWER MIDDLE INCOME
SEED54.7
FERTILIZER64.4
MACHINERY45.4
FINANCE37.7
MARKETS58.0
TRANSPORT60.7
OPERATIONS (∆)51.0
QUALITY CONTROL (∂)44.0
TRADE (◊)73.8
The operations score is an average of seed, fertilizer, machinery, finance, markets and transport indicator scores indicated with a ∆. The quality control score is an average of seed, fertilizer, machinery and markets indicator scores indicated with a ∂. The trade score is an average of fertilizer, machinery and transport indicator scores indicated with a ◊.
54.759.4
6368
2,082.2 (134.2)50.0
64.460.0
No practiceNo practiceNo practice
66.766.7
59.5 (3.8)N/A
45.425.027.883.3
59.5 (3.8)N/A
37.742.960.0
085.4
0
58.078.637.5
3No dataNo data
1198.3 (12.8)
60.750.0N/AN/AN/A
149.6 (3.2)
287.1 (5.6)
0.571.4
SEED∆ Seed registration (0–100)Procedures (number)Time (days)Cost in US$ (% income per capita)∆ Seed development and certification (0–100)
FERTILIZER∆ Fertilizer registration (0–100)Procedures (number)Time (days)Cost in US$ (% income per capita)∂ Fertilizer quality control (0–100)◊ Fertilizer import requirements (0–100)Cost to register as an importer of fertilizer in US$ (% income per capita)Cost to obtain an import permit for fertilizer in US$ (% income per capita)
MACHINERY∆ Tractor dealer requirements (0–100)∂ Tractor standards and safety (0–100)◊ Tractor import requirements (0–100)Cost to register as an importer of tractors in US$ (% income per capita)Cost to obtain an import permit for tractors in US$ (% income per capita)
FINANCE∆ Microfinance institutions (0–100)∆ Credit unions (0–100)∆ Agent banking (0–100)∆ Electronic money (0–100)∆ Warehouse receipts (0–100)
MARKETS∆ Production and sales (0–100)∂ Plant protection (0–100)Export documents per shipment (number)Time to prepare export documents (days)Cost of export documents in US$ (% income per capita)Trader licensing and membership requirements (number)Cost of licenses and membership in US$ (% income per capita)
TRANSPORT∆ Truck licenses (0–100)Time to obtain company license (days)Cost to obtain company license in US$ (% income per capita)Validity of company license (years)Time to obtain truck permit (days)Cost to obtain truck permit in US$ (% income per capita)Validity of truck permit (years)Cost to obtain vehicle technical inspection in US$ (% income per capita)Validity of vehicle inspection (years)◊ Cross-border transportation (0–100)
157

DENMARK OECD HIGH INCOMEHIGH INCOME
SEED87.5
FERTILIZER82.2
MACHINERY80.7
FINANCEN/Aa
MARKETS85.7
TRANSPORT100
OPERATIONS (∆)85.1
QUALITY CONTROL (∂)85.2
TRADE (◊)88.9
The operations score is an average of seed, fertilizer, machinery, finance, markets and transport indicator scores indicated with a ∆. The quality control score is an average of seed, fertilizer, machinery and markets indicator scores indicated with a ∂. The trade score is an average of fertilizer, machinery and transport indicator scores indicated with a ◊.
87.587.5
6690
4,640.5 (7.6)87.5
82.280.0
231
267.7 (0.4)83.383.3N/AN/A
80.786.772.283.3N/AN/A
N/Aa
-----
85.771.4100
0001
667.5 (1.1)
100100
270
10N/AN/AN/A
190.5 (0.3)1
100
a. High-income countries are not measured under the finance topic.
SEED∆ Seed registration (0–100)Procedures (number)Time (days)Cost in US$ (% income per capita)∆ Seed development and certification (0–100)
FERTILIZER∆ Fertilizer registration (0–100)Procedures (number)Time (days)Cost in US$ (% income per capita)∂ Fertilizer quality control (0–100)◊ Fertilizer import requirements (0–100)Cost to register as an importer of fertilizer in US$ (% income per capita)Cost to obtain an import permit for fertilizer in US$ (% income per capita)
MACHINERY∆ Tractor dealer requirements (0–100)∂ Tractor standards and safety (0–100)◊ Tractor import requirements (0–100)Cost to register as an importer of tractors in US$ (% income per capita)Cost to obtain an import permit for tractors in US$ (% income per capita)
FINANCE∆ Microfinance institutions (0–100)∆ Credit unions (0–100)∆ Agent banking (0–100)∆ Electronic money (0–100)∆ Warehouse receipts (0–100)
MARKETS∆ Production and sales (0–100)∂ Plant protection (0–100)Export documents per shipment (number)Time to prepare export documents (days)Cost of export documents in US$ (% income per capita)Trader licensing and membership requirements (number)Cost of licenses and membership in US$ (% income per capita)
TRANSPORT∆ Truck licenses (0–100)Time to obtain company license (days)Cost to obtain company license in US$ (% income per capita)Validity of company license (years)Time to obtain truck permit (days)Cost to obtain truck permit in US$ (% income per capita)Validity of truck permit (years)Cost to obtain vehicle technical inspection in US$ (% income per capita)Validity of vehicle inspection (years)◊ Cross-border transportation (0–100)
158

ETHIOPIA SUB-SAHARAN AFRICALOW INCOME
SEED58.9
FERTILIZER34.4
MACHINERY28.5
FINANCE59.8
MARKETS55.4
TRANSPORT52.4
OPERATIONS (∆)50.9
QUALITY CONTROL (∂)32.8
TRADE (◊)39.8
The operations score is an average of seed, fertilizer, machinery, finance, markets and transport indicator scores indicated with a ∆. The quality control score is an average of seed, fertilizer, machinery and markets indicator scores indicated with a ∂. The trade score is an average of fertilizer, machinery and transport indicator scores indicated with a ◊.
58.975.0
4620
488.9 (88.9)42.9
34.420.0N/Aa
N/Aa
N/Aa
66.716.7N/AN/A
28.518.8
6.760.0
15.3 (2.8)5.2 (0.9)
59.847.660.091.4
0100
55.485.725.0
3No data b
80.9 (14.7)1
9.0 (1.6)
52.461.9
134.6 (6.3)
1N/AN/AN/A
19.4 (3.5)1
42.9
a. The private sector is not required to register fertilizer. b. The time to obtain document 1 (phytosanitary certificate) is 1 day, and the time to obtain document 3 (fumigation certificate) is 1 day. The time to obtain document 2 (quality certificate) could not be obtained.
SEED∆ Seed registration (0–100)Procedures (number)Time (days)Cost in US$ (% income per capita)∆ Seed development and certification (0–100)
FERTILIZER∆ Fertilizer registration (0–100)Procedures (number)Time (days)Cost in US$ (% income per capita)∂ Fertilizer quality control (0–100)◊ Fertilizer import requirements (0–100)Cost to register as an importer of fertilizer in US$ (% income per capita)Cost to obtain an import permit for fertilizer in US$ (% income per capita)
MACHINERY∆ Tractor dealer requirements (0–100)∂ Tractor standards and safety (0–100)◊ Tractor import requirements (0–100)Cost to register as an importer of tractors in US$ (% income per capita)Cost to obtain an import permit for tractors in US$ (% income per capita)
FINANCE∆ Microfinance institutions (0–100)∆ Credit unions (0–100)∆ Agent banking (0–100)∆ Electronic money (0–100)∆ Warehouse receipts (0–100)
MARKETS∆ Production and sales (0–100)∂ Plant protection (0–100)Export documents per shipment (number)Time to prepare export documents (days)Cost of export documents in US$ (% income per capita)Trader licensing and membership requirements (number)Cost of licenses and membership in US$ (% income per capita)
TRANSPORT∆ Truck licenses (0–100)Time to obtain company license (days)Cost to obtain company license in US$ (% income per capita)Validity of company license (years)Time to obtain truck permit (days)Cost to obtain truck permit in US$ (% income per capita)Validity of truck permit (years)Cost to obtain vehicle technical inspection in US$ (% income per capita)Validity of vehicle inspection (years)◊ Cross-border transportation (0–100)
159

GEORGIA EUROPE & CENTRAL ASIALOWER MIDDLE INCOME
SEED75.0
FERTILIZER68.9
MACHINERY44.4
FINANCE37.7
MARKETS86.6
TRANSPORT65.7
OPERATIONS (∆)63.6
QUALITY CONTROL (∂)56.9
TRADE (◊)68.3
The operations score is an average of seed, fertilizer, machinery, finance, markets and transport indicator scores indicated with a ∆. The quality control score is an average of seed, fertilizer, machinery and markets indicator scores indicated with a ∂. The trade score is an average of fertilizer, machinery and transport indicator scores indicated with a ◊.
75.062.5
6534
No data87.5
68.990.0
5765
260.6 (7.0)50.066.7N/AN/A
44.433.333.366.7N/AN/A
37.70
80.00
50.058.3
86.685.787.5
25
95.6 (2.6)0
N/A
65.760.0N/AN/AN/AN/AN/AN/AN/AN/A
71.4
SEED∆ Seed registration (0–100)Procedures (number)Time (days)Cost in US$ (% income per capita)∆ Seed development and certification (0–100)
FERTILIZER∆ Fertilizer registration (0–100)Procedures (number)Time (days)Cost in US$ (% income per capita)∂ Fertilizer quality control (0–100)◊ Fertilizer import requirements (0–100)Cost to register as an importer of fertilizer in US$ (% income per capita)Cost to obtain an import permit for fertilizer in US$ (% income per capita)
MACHINERY∆ Tractor dealer requirements (0–100)∂ Tractor standards and safety (0–100)◊ Tractor import requirements (0–100)Cost to register as an importer of tractors in US$ (% income per capita)Cost to obtain an import permit for tractors in US$ (% income per capita)
FINANCE∆ Microfinance institutions (0–100)∆ Credit unions (0–100)∆ Agent banking (0–100)∆ Electronic money (0–100)∆ Warehouse receipts (0–100)
MARKETS∆ Production and sales (0–100)∂ Plant protection (0–100)Export documents per shipment (number)Time to prepare export documents (days)Cost of export documents in US$ (% income per capita)Trader licensing and membership requirements (number)Cost of licenses and membership in US$ (% income per capita)
TRANSPORT∆ Truck licenses (0–100)Time to obtain company license (days)Cost to obtain company license in US$ (% income per capita)Validity of company license (years)Time to obtain truck permit (days)Cost to obtain truck permit in US$ (% income per capita)Validity of truck permit (years)Cost to obtain vehicle technical inspection in US$ (% income per capita)Validity of vehicle inspection (years)◊ Cross-border transportation (0–100)
160
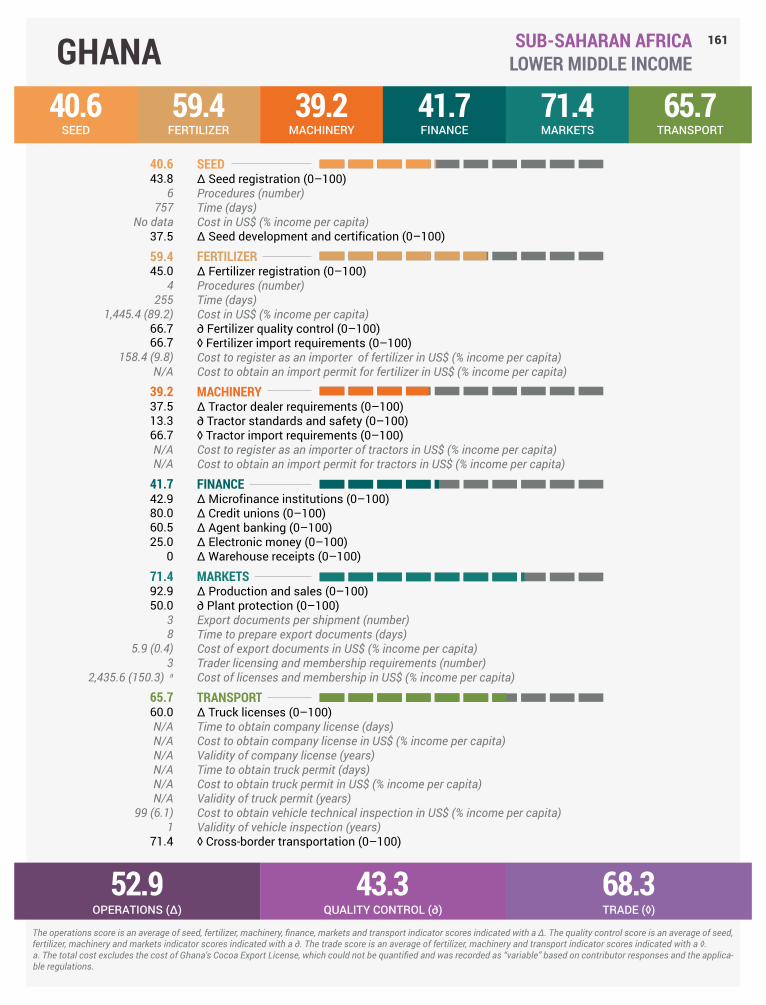
GHANA SUB-SAHARAN AFRICALOWER MIDDLE INCOME
SEED40.6
FERTILIZER59.4
MACHINERY39.2
FINANCE41.7
MARKETS71.4
TRANSPORT65.7
OPERATIONS (∆)52.9
QUALITY CONTROL (∂)43.3
TRADE (◊)68.3
The operations score is an average of seed, fertilizer, machinery, finance, markets and transport indicator scores indicated with a ∆. The quality control score is an average of seed, fertilizer, machinery and markets indicator scores indicated with a ∂. The trade score is an average of fertilizer, machinery and transport indicator scores indicated with a ◊.
40.643.8
6757
No data37.5
59.445.0
4255
1,445.4 (89.2)66.766.7
158.4 (9.8)N/A
39.237.513.366.7N/AN/A
41.742.980.060.525.0
0
71.492.950.0
38
5.9 (0.4)3
2,435.6 (150.3) a
65.760.0N/AN/AN/AN/AN/AN/A
99 (6.1)1
71.4
a. The total cost excludes the cost of Ghana’s Cocoa Export License, which could not be quantified and was recorded as “variable” based on contributor responses and the applica-ble regulations.
SEED∆ Seed registration (0–100)Procedures (number)Time (days)Cost in US$ (% income per capita)∆ Seed development and certification (0–100)
FERTILIZER∆ Fertilizer registration (0–100)Procedures (number)Time (days)Cost in US$ (% income per capita)∂ Fertilizer quality control (0–100)◊ Fertilizer import requirements (0–100)Cost to register as an importer of fertilizer in US$ (% income per capita)Cost to obtain an import permit for fertilizer in US$ (% income per capita)
MACHINERY∆ Tractor dealer requirements (0–100)∂ Tractor standards and safety (0–100)◊ Tractor import requirements (0–100)Cost to register as an importer of tractors in US$ (% income per capita)Cost to obtain an import permit for tractors in US$ (% income per capita)
FINANCE∆ Microfinance institutions (0–100)∆ Credit unions (0–100)∆ Agent banking (0–100)∆ Electronic money (0–100)∆ Warehouse receipts (0–100)
MARKETS∆ Production and sales (0–100)∂ Plant protection (0–100)Export documents per shipment (number)Time to prepare export documents (days)Cost of export documents in US$ (% income per capita)Trader licensing and membership requirements (number)Cost of licenses and membership in US$ (% income per capita)
TRANSPORT∆ Truck licenses (0–100)Time to obtain company license (days)Cost to obtain company license in US$ (% income per capita)Validity of company license (years)Time to obtain truck permit (days)Cost to obtain truck permit in US$ (% income per capita)Validity of truck permit (years)Cost to obtain vehicle technical inspection in US$ (% income per capita)Validity of vehicle inspection (years)◊ Cross-border transportation (0–100)
161

GREECE OECD HIGH INCOMEHIGH INCOME
SEED73.4
FERTILIZER93.3
MACHINERY74.6
FINANCEN/Aa
MARKETS90.2
TRANSPORT92.9
OPERATIONS (∆)87.2
QUALITY CONTROL (∂)86.9
TRADE (◊)82.2
The operations score is an average of seed, fertilizer, machinery, finance, markets and transport indicator scores indicated with a ∆. The quality control score is an average of seed, fertilizer, machinery and markets indicator scores indicated with a ∂. The trade score is an average of fertilizer, machinery and transport indicator scores indicated with a ◊.
73.446.9
6729
1,911.4 (8.7)100
93.3100
7211
1,282.4 (5.8)100
80.0N/A
135.0 (0.6)
74.683.873.366.7N/AN/A
N/Aa
-----
90.292.987.5
0001
809.9 (3.7)
92.985.7
60674.9 (3.1)
10N/AN/AN/A
141.7 (0.6)1
100
a. High-income countries are not measured under the finance topic.
SEED∆ Seed registration (0–100)Procedures (number)Time (days)Cost in US$ (% income per capita)∆ Seed development and certification (0–100)
FERTILIZER∆ Fertilizer registration (0–100)Procedures (number)Time (days)Cost in US$ (% income per capita)∂ Fertilizer quality control (0–100)◊ Fertilizer import requirements (0–100)Cost to register as an importer of fertilizer in US$ (% income per capita)Cost to obtain an import permit for fertilizer in US$ (% income per capita)
MACHINERY∆ Tractor dealer requirements (0–100)∂ Tractor standards and safety (0–100)◊ Tractor import requirements (0–100)Cost to register as an importer of tractors in US$ (% income per capita)Cost to obtain an import permit for tractors in US$ (% income per capita)
FINANCE∆ Microfinance institutions (0–100)∆ Credit unions (0–100)∆ Agent banking (0–100)∆ Electronic money (0–100)∆ Warehouse receipts (0–100)
MARKETS∆ Production and sales (0–100)∂ Plant protection (0–100)Export documents per shipment (number)Time to prepare export documents (days)Cost of export documents in US$ (% income per capita)Trader licensing and membership requirements (number)Cost of licenses and membership in US$ (% income per capita)
TRANSPORT∆ Truck licenses (0–100)Time to obtain company license (days)Cost to obtain company license in US$ (% income per capita)Validity of company license (years)Time to obtain truck permit (days)Cost to obtain truck permit in US$ (% income per capita)Validity of truck permit (years)Cost to obtain vehicle technical inspection in US$ (% income per capita)Validity of vehicle inspection (years)◊ Cross-border transportation (0–100)
162

GUATEMALA LATIN AMERICA & CARIBBEANLOWER MIDDLE INCOME
SEED71.0
FERTILIZER66.9
MACHINERY40.6
FINANCE46.3
MARKETS86.6
TRANSPORT72.9
OPERATIONS (∆)53.8
QUALITY CONTROL (∂)66.9
TRADE (◊)78.3
The operations score is an average of seed, fertilizer, machinery, finance, markets and transport indicator scores indicated with a ∆. The quality control score is an average of seed, fertilizer, machinery and markets indicator scores indicated with a ∂. The trade score is an average of fertilizer, machinery and transport indicator scores indicated with a ◊.
71.056.3
4166
67.5 (2.0)85.7
66.935.0
2105
12.5 (0.4)100
65.8No dataNo data
40.625.013.383.3
622.6 (18.1)N/A
46.30
40.091.425.075.0
86.685.787.5
11
6.3 (0.2)0
N/A
72.960.0N/AN/AN/AN/AN/AN/A
100 (2.9)1
85.7
SEED∆ Seed registration (0–100)Procedures (number)Time (days)Cost in US$ (% income per capita)∆ Seed development and certification (0–100)
FERTILIZER∆ Fertilizer registration (0–100)Procedures (number)Time (days)Cost in US$ (% income per capita)∂ Fertilizer quality control (0–100)◊ Fertilizer import requirements (0–100)Cost to register as an importer of fertilizer in US$ (% income per capita)Cost to obtain an import permit for fertilizer in US$ (% income per capita)
MACHINERY∆ Tractor dealer requirements (0–100)∂ Tractor standards and safety (0–100)◊ Tractor import requirements (0–100)Cost to register as an importer of tractors in US$ (% income per capita)Cost to obtain an import permit for tractors in US$ (% income per capita)
FINANCE∆ Microfinance institutions (0–100)∆ Credit unions (0–100)∆ Agent banking (0–100)∆ Electronic money (0–100)∆ Warehouse receipts (0–100)
MARKETS∆ Production and sales (0–100)∂ Plant protection (0–100)Export documents per shipment (number)Time to prepare export documents (days)Cost of export documents in US$ (% income per capita)Trader licensing and membership requirements (number)Cost of licenses and membership in US$ (% income per capita)
TRANSPORT∆ Truck licenses (0–100)Time to obtain company license (days)Cost to obtain company license in US$ (% income per capita)Validity of company license (years)Time to obtain truck permit (days)Cost to obtain truck permit in US$ (% income per capita)Validity of truck permit (years)Cost to obtain vehicle technical inspection in US$ (% income per capita)Validity of vehicle inspection (years)◊ Cross-border transportation (0–100)
163

JORDAN MIDDLE EAST & NORTH AFRICAUPPER MIDDLE INCOME
SEED71.0
FERTILIZER67.8
MACHINERY42.1
FINANCE21.7
MARKETS83.9
TRANSPORT66.7
OPERATIONS (∆)58.9
QUALITY CONTROL (∂)51.7
TRADE (◊)71.6
The operations score is an average of seed, fertilizer, machinery, finance, markets and transport indicator scores indicated with a ∆. The quality control score is an average of seed, fertilizer, machinery and markets indicator scores indicated with a ∂. The trade score is an average of fertilizer, machinery and transport indicator scores indicated with a ◊.
71.056.3
No practiceNo practiceNo practice
85.7
67.870.0
336
15.0 (0.3) a
66.766.7
13.6 (0.3)13.6 (0.3)
42.136.313.376.7
13.6 (0.3)13.6 (0.3)
21.7N/A b
40.0N/A b
25.00
83.992.975.0
11
2.7 (0.1)0
N/A
66.761.9
3203.3 (3.9)
11
521.7 (10.1)1
40.7 (0.8)1
71.4
a. Cost of application for registration is $15, but cost of lab report is unknown. Approval by the National Committee is free. b. Upper-middle-income countries are not measured under the microfinance institutions indicator and agent banking indicator.
SEED∆ Seed registration (0–100)Procedures (number)Time (days)Cost in US$ (% income per capita)∆ Seed development and certification (0–100)
FERTILIZER∆ Fertilizer registration (0–100)Procedures (number)Time (days)Cost in US$ (% income per capita)∂ Fertilizer quality control (0–100)◊ Fertilizer import requirements (0–100)Cost to register as an importer of fertilizer in US$ (% income per capita)Cost to obtain an import permit for fertilizer in US$ (% income per capita)
MACHINERY∆ Tractor dealer requirements (0–100)∂ Tractor standards and safety (0–100)◊ Tractor import requirements (0–100)Cost to register as an importer of tractors in US$ (% income per capita)Cost to obtain an import permit for tractors in US$ (% income per capita)
FINANCE∆ Microfinance institutions (0–100)∆ Credit unions (0–100)∆ Agent banking (0–100)∆ Electronic money (0–100)∆ Warehouse receipts (0–100)
MARKETS∆ Production and sales (0–100)∂ Plant protection (0–100)Export documents per shipment (number)Time to prepare export documents (days)Cost of export documents in US$ (% income per capita)Trader licensing and membership requirements (number)Cost of licenses and membership in US$ (% income per capita)
TRANSPORT∆ Truck licenses (0–100)Time to obtain company license (days)Cost to obtain company license in US$ (% income per capita)Validity of company license (years)Time to obtain truck permit (days)Cost to obtain truck permit in US$ (% income per capita)Validity of truck permit (years)Cost to obtain vehicle technical inspection in US$ (% income per capita)Validity of vehicle inspection (years)◊ Cross-border transportation (0–100)
164

KENYA SUB-SAHARAN AFRICALOWER MIDDLE INCOME
SEED90.6
FERTILIZER50.0
MACHINERY57.2
FINANCE72.9
MARKETS50.9
TRANSPORT75.0
OPERATIONS (∆)58.3
QUALITY CONTROL (∂)55.1
TRADE (◊)73.8
The operations score is an average of seed, fertilizer, machinery, finance, markets and transport indicator scores indicated with a ∆. The quality control score is an average of seed, fertilizer, machinery and markets indicator scores indicated with a ∂. The trade score is an average of fertilizer, machinery and transport indicator scores indicated with a ◊.
90.693.8
6321
1,798.5 (140.5)87.5
50.00
N/Aa
N/Aa
N/Aa
66.783.3
327.0 (25.5)N/A
57.243.861.166.7N/AN/A
72.990.586.787.1100
0
50.964.337.5
46
130.8 (10.2) b
21,602.3 (125.2)
75.078.6N/AN/AN/A
132.7 (2.6)
110.9 (0.9)
171.4
a. The private sector is not required to register fertilizer. b. The total cost excludes the cost of document 4 (export release order), which requires payment of an ad valorem levy (1% of ex-warehouse price for tea exports sold at the tea auction).
SEED∆ Seed registration (0–100)Procedures (number)Time (days)Cost in US$ (% income per capita)∆ Seed development and certification (0–100)
FERTILIZER∆ Fertilizer registration (0–100)Procedures (number)Time (days)Cost in US$ (% income per capita)∂ Fertilizer quality control (0–100)◊ Fertilizer import requirements (0–100)Cost to register as an importer of fertilizer in US$ (% income per capita)Cost to obtain an import permit for fertilizer in US$ (% income per capita)
MACHINERY∆ Tractor dealer requirements (0–100)∂ Tractor standards and safety (0–100)◊ Tractor import requirements (0–100)Cost to register as an importer of tractors in US$ (% income per capita)Cost to obtain an import permit for tractors in US$ (% income per capita)
FINANCE∆ Microfinance institutions (0–100)∆ Credit unions (0–100)∆ Agent banking (0–100)∆ Electronic money (0–100)∆ Warehouse receipts (0–100)
MARKETS∆ Production and sales (0–100)∂ Plant protection (0–100)Export documents per shipment (number)Time to prepare export documents (days)Cost of export documents in US$ (% income per capita)Trader licensing and membership requirements (number)Cost of licenses and membership in US$ (% income per capita)
TRANSPORT∆ Truck licenses (0–100)Time to obtain company license (days)Cost to obtain company license in US$ (% income per capita)Validity of company license (years)Time to obtain truck permit (days)Cost to obtain truck permit in US$ (% income per capita)Validity of truck permit (years)Cost to obtain vehicle technical inspection in US$ (% income per capita)Validity of vehicle inspection (years)◊ Cross-border transportation (0–100)
165

KYRGYZ REPUBLIC EUROPE & CENTRAL ASIALOWER MIDDLE INCOME
SEED48.9
FERTILIZER63.9
MACHINERY63.9
FINANCE79.8
MARKETS80.4
TRANSPORT72.9
OPERATIONS (∆)70.7
QUALITY CONTROL (∂)52.8
TRADE (◊)78.6
The operations score is an average of seed, fertilizer, machinery, finance, markets and transport indicator scores indicated with a ∆. The quality control score is an average of seed, fertilizer, machinery and markets indicator scores indicated with a ∂. The trade score is an average of fertilizer, machinery and transport indicator scores indicated with a ◊.
48.940.6
5970
2,850.7 (228.1)57.1
63.975.0
5730
277.9 (22.2)50.066.7N/AN/A
63.975.033.383.3N/AN/A
79.861.9100
91.487.558.3
80.485.775.0
12
10.1 (0.8)0
N/A
72.960.0N/AN/AN/AN/AN/AN/A
12.4 (1.0)1
85.7
SEED∆ Seed registration (0–100)Procedures (number)Time (days)Cost in US$ (% income per capita)∆ Seed development and certification (0–100)
FERTILIZER∆ Fertilizer registration (0–100)Procedures (number)Time (days)Cost in US$ (% income per capita)∂ Fertilizer quality control (0–100)◊ Fertilizer import requirements (0–100)Cost to register as an importer of fertilizer in US$ (% income per capita)Cost to obtain an import permit for fertilizer in US$ (% income per capita)
MACHINERY∆ Tractor dealer requirements (0–100)∂ Tractor standards and safety (0–100)◊ Tractor import requirements (0–100)Cost to register as an importer of tractors in US$ (% income per capita)Cost to obtain an import permit for tractors in US$ (% income per capita)
FINANCE∆ Microfinance institutions (0–100)∆ Credit unions (0–100)∆ Agent banking (0–100)∆ Electronic money (0–100)∆ Warehouse receipts (0–100)
MARKETS∆ Production and sales (0–100)∂ Plant protection (0–100)Export documents per shipment (number)Time to prepare export documents (days)Cost of export documents in US$ (% income per capita)Trader licensing and membership requirements (number)Cost of licenses and membership in US$ (% income per capita)
TRANSPORT∆ Truck licenses (0–100)Time to obtain company license (days)Cost to obtain company license in US$ (% income per capita)Validity of company license (years)Time to obtain truck permit (days)Cost to obtain truck permit in US$ (% income per capita)Validity of truck permit (years)Cost to obtain vehicle technical inspection in US$ (% income per capita)Validity of vehicle inspection (years)◊ Cross-border transportation (0–100)
166

LAO PDR EAST ASIA & PACIFICLOWER MIDDLE INCOME
SEED45.5
FERTILIZER60.6
MACHINERY20.0
FINANCE34.3
MARKETS83.9
TRANSPORT69.0
OPERATIONS (∆)47.4
QUALITY CONTROL (∂)55.0
TRADE (◊)59.4
The operations score is an average of seed, fertilizer, machinery, finance, markets and transport indicator scores indicated with a ∆. The quality control score is an average of seed, fertilizer, machinery and markets indicator scores indicated with a ∂. The trade score is an average of fertilizer, machinery and transport indicator scores indicated with a ◊.
45.562.5
No practiceNo practiceNo practice
28.6
60.645.0
4No data7.9 (0.5)
83.353.3N/A
3.1 (0.2)
20.00
6.753.3N/A
1.2 (0.1)
34.366.780.0
025.0
0
83.992.975.0
23
151.0 (9.4)0
N/A
69.066.7
3024.4 (1.5)
17
67.2 (4.2)1
2.4 (0.2)1
71.4
SEED∆ Seed registration (0–100)Procedures (number)Time (days)Cost in US$ (% income per capita)∆ Seed development and certification (0–100)
FERTILIZER∆ Fertilizer registration (0–100)Procedures (number)Time (days)Cost in US$ (% income per capita)∂ Fertilizer quality control (0–100)◊ Fertilizer import requirements (0–100)Cost to register as an importer of fertilizer in US$ (% income per capita)Cost to obtain an import permit for fertilizer in US$ (% income per capita)
MACHINERY∆ Tractor dealer requirements (0–100)∂ Tractor standards and safety (0–100)◊ Tractor import requirements (0–100)Cost to register as an importer of tractors in US$ (% income per capita)Cost to obtain an import permit for tractors in US$ (% income per capita)
FINANCE∆ Microfinance institutions (0–100)∆ Credit unions (0–100)∆ Agent banking (0–100)∆ Electronic money (0–100)∆ Warehouse receipts (0–100)
MARKETS∆ Production and sales (0–100)∂ Plant protection (0–100)Export documents per shipment (number)Time to prepare export documents (days)Cost of export documents in US$ (% income per capita)Trader licensing and membership requirements (number)Cost of licenses and membership in US$ (% income per capita)
TRANSPORT∆ Truck licenses (0–100)Time to obtain company license (days)Cost to obtain company license in US$ (% income per capita)Validity of company license (years)Time to obtain truck permit (days)Cost to obtain truck permit in US$ (% income per capita)Validity of truck permit (years)Cost to obtain vehicle technical inspection in US$ (% income per capita)Validity of vehicle inspection (years)◊ Cross-border transportation (0–100)
167

MALI SUB-SAHARAN AFRICALOW INCOME
SEED56.0
FERTILIZER71.1
MACHINERY27.8
FINANCE37.2
MARKETS55.4
TRANSPORT67.9
OPERATIONS (∆)53.9
QUALITY CONTROL (∂)32.8
TRADE (◊)71.6
The operations score is an average of seed, fertilizer, machinery, finance, markets and transport indicator scores indicated with a ∆. The quality control score is an average of seed, fertilizer, machinery and markets indicator scores indicated with a ∂. The trade score is an average of fertilizer, machinery and transport indicator scores indicated with a ◊.
56.040.6
No practiceNo practiceNo practice
71.4
71.180.0
490
No data66.766.7
03.0 (0.4)
27.80
6.776.7
03.0 (0.4)
37.242.960.0
083.3
0
55.485.725.0
13
19.8 (2.7)0
N/A
67.964.3N/AN/AN/A
331.6 (4.4)
134.6 (4.8)
0.571.4
SEED∆ Seed registration (0–100)Procedures (number)Time (days)Cost in US$ (% income per capita)∆ Seed development and certification (0–100)
FERTILIZER∆ Fertilizer registration (0–100)Procedures (number)Time (days)Cost in US$ (% income per capita)∂ Fertilizer quality control (0–100)◊ Fertilizer import requirements (0–100)Cost to register as an importer of fertilizer in US$ (% income per capita)Cost to obtain an import permit for fertilizer in US$ (% income per capita)
MACHINERY∆ Tractor dealer requirements (0–100)∂ Tractor standards and safety (0–100)◊ Tractor import requirements (0–100)Cost to register as an importer of tractors in US$ (% income per capita)Cost to obtain an import permit for tractors in US$ (% income per capita)
FINANCE∆ Microfinance institutions (0–100)∆ Credit unions (0–100)∆ Agent banking (0–100)∆ Electronic money (0–100)∆ Warehouse receipts (0–100)
MARKETS∆ Production and sales (0–100)∂ Plant protection (0–100)Export documents per shipment (number)Time to prepare export documents (days)Cost of export documents in US$ (% income per capita)Trader licensing and membership requirements (number)Cost of licenses and membership in US$ (% income per capita)
TRANSPORT∆ Truck licenses (0–100)Time to obtain company license (days)Cost to obtain company license in US$ (% income per capita)Validity of company license (years)Time to obtain truck permit (days)Cost to obtain truck permit in US$ (% income per capita)Validity of truck permit (years)Cost to obtain vehicle technical inspection in US$ (% income per capita)Validity of vehicle inspection (years)◊ Cross-border transportation (0–100)
168

MOROCCO MIDDLE EAST & NORTH AFRICALOWER MIDDLE INCOME
SEED85.9
FERTILIZER50.4
MACHINERY52.0
FINANCE0
MARKETS72.3
TRANSPORT60.7
OPERATIONS (∆)45.5
QUALITY CONTROL (∂)67.1
TRADE (◊)61.6
The operations score is an average of seed, fertilizer, machinery, finance, markets and transport indicator scores indicated with a ∆. The quality control score is an average of seed, fertilizer, machinery and markets indicator scores indicated with a ∂. The trade score is an average of fertilizer, machinery and transport indicator scores indicated with a ◊.
85.971.9
6585
469.9 (15.6)100
50.40
N/Aa
N/Aa
N/Aa
94.456.7N/A
0
52.055.044.456.7N/A
0
000000
72.382.162.5
2No data b
No data c
2No data
60.750.0
30
Indefinite d
N/AN/AN/A
47 (1.6)1
71.4
a. The private sector is not required to register fertilizer. b. The time to obtain document 1 (phytosanitary certificate) is 3 days. The time to obtain document 2 (inspection certificate) could not be obtained. c. The cost of document 1 (phytosanitary certificate) is $17.6 (0.6% of income per capita). The cost of document 2 (inspection certificate) could not be obtained. d. License is revoked if any of the pre-requirements are not fullfiled.
SEED∆ Seed registration (0–100)Procedures (number)Time (days)Cost in US$ (% income per capita)∆ Seed development and certification (0–100)
FERTILIZER∆ Fertilizer registration (0–100)Procedures (number)Time (days)Cost in US$ (% income per capita)∂ Fertilizer quality control (0–100)◊ Fertilizer import requirements (0–100)Cost to register as an importer of fertilizer in US$ (% income per capita)Cost to obtain an import permit for fertilizer in US$ (% income per capita)
MACHINERY∆ Tractor dealer requirements (0–100)∂ Tractor standards and safety (0–100)◊ Tractor import requirements (0–100)Cost to register as an importer of tractors in US$ (% income per capita)Cost to obtain an import permit for tractors in US$ (% income per capita)
FINANCE∆ Microfinance institutions (0–100)∆ Credit unions (0–100)∆ Agent banking (0–100)∆ Electronic money (0–100)∆ Warehouse receipts (0–100)
MARKETS∆ Production and sales (0–100)∂ Plant protection (0–100)Export documents per shipment (number)Time to prepare export documents (days)Cost of export documents in US$ (% income per capita)Trader licensing and membership requirements (number)Cost of licenses and membership in US$ (% income per capita)
TRANSPORT∆ Truck licenses (0–100)Time to obtain company license (days)Cost to obtain company license in US$ (% income per capita)Validity of company license (years)Time to obtain truck permit (days)Cost to obtain truck permit in US$ (% income per capita)Validity of truck permit (years)Cost to obtain vehicle technical inspection in US$ (% income per capita)Validity of vehicle inspection (years)◊ Cross-border transportation (0–100)
169

MOZAMBIQUE SUB-SAHARAN AFRICALOW INCOME
SEED90.6
FERTILIZER46.1
MACHINERY42.5
FINANCE29.8
MARKETS83.9
TRANSPORT60.7
OPERATIONS (∆)57.5
QUALITY CONTROL (∂)43.9
TRADE (◊)66.3
The operations score is an average of seed, fertilizer, machinery, finance, markets and transport indicator scores indicated with a ∆. The quality control score is an average of seed, fertilizer, machinery and markets indicator scores indicated with a ∂. The trade score is an average of fertilizer, machinery and transport indicator scores indicated with a ◊.
90.681.3
7582
500.0 (79.4)100
46.130.0
No practiceNo practiceNo practice
50.058.3
200.0 (31.7)81.6 (13)
42.537.5
6.783.3
5548.1 (880.6)N/A
29.857.166.7
025.0
0
83.992.975.0
12
13.4 (2.1)0
N/A
60.764.3N/AN/AN/A2.5
130.5 (20.7)5
34.4 (5.5)0.5
57.1
SEED∆ Seed registration (0–100)Procedures (number)Time (days)Cost in US$ (% income per capita)∆ Seed development and certification (0–100)
FERTILIZER∆ Fertilizer registration (0–100)Procedures (number)Time (days)Cost in US$ (% income per capita)∂ Fertilizer quality control (0–100)◊ Fertilizer import requirements (0–100)Cost to register as an importer of fertilizer in US$ (% income per capita)Cost to obtain an import permit for fertilizer in US$ (% income per capita)
MACHINERY∆ Tractor dealer requirements (0–100)∂ Tractor standards and safety (0–100)◊ Tractor import requirements (0–100)Cost to register as an importer of tractors in US$ (% income per capita)Cost to obtain an import permit for tractors in US$ (% income per capita)
FINANCE∆ Microfinance institutions (0–100)∆ Credit unions (0–100)∆ Agent banking (0–100)∆ Electronic money (0–100)∆ Warehouse receipts (0–100)
MARKETS∆ Production and sales (0–100)∂ Plant protection (0–100)Export documents per shipment (number)Time to prepare export documents (days)Cost of export documents in US$ (% income per capita)Trader licensing and membership requirements (number)Cost of licenses and membership in US$ (% income per capita)
TRANSPORT∆ Truck licenses (0–100)Time to obtain company license (days)Cost to obtain company license in US$ (% income per capita)Validity of company license (years)Time to obtain truck permit (days)Cost to obtain truck permit in US$ (% income per capita)Validity of truck permit (years)Cost to obtain vehicle technical inspection in US$ (% income per capita)Validity of vehicle inspection (years)◊ Cross-border transportation (0–100)
170

MYANMAR EAST ASIA & PACIFICLOWER MIDDLE INCOME
SEED53.6
FERTILIZER61.9
MACHINERY21.4
FINANCE24.6
MARKETS42.0
TRANSPORT22.6
OPERATIONS (∆)37.6
QUALITY CONTROL (∂)39.7
TRADE (◊)37.5
The operations score is an average of seed, fertilizer, machinery, finance, markets and transport indicator scores indicated with a ∆. The quality control score is an average of seed, fertilizer, machinery and markets indicator scores indicated with a ∂. The trade score is an average of fertilizer, machinery and transport indicator scores indicated with a ◊.
53.650.0
6306
445.1 (35.1)57.1
61.945.0
342
122.4 (9.6)100
40.855.6 (4.4)55.6 (4.4)
21.40
6.757.5
11.1 (0.9)55.6 (4.4)
24.642.980.0
000
42.071.412.5
24
20.3 (1.6)0
N/A
22.631.0N/AN/AN/A11.5
2.2 (0.2)1
51.7 (4.1)1
14.3
SEED∆ Seed registration (0–100)Procedures (number)Time (days)Cost in US$ (% income per capita)∆ Seed development and certification (0–100)
FERTILIZER∆ Fertilizer registration (0–100)Procedures (number)Time (days)Cost in US$ (% income per capita)∂ Fertilizer quality control (0–100)◊ Fertilizer import requirements (0–100)Cost to register as an importer of fertilizer in US$ (% income per capita)Cost to obtain an import permit for fertilizer in US$ (% income per capita)
MACHINERY∆ Tractor dealer requirements (0–100)∂ Tractor standards and safety (0–100)◊ Tractor import requirements (0–100)Cost to register as an importer of tractors in US$ (% income per capita)Cost to obtain an import permit for tractors in US$ (% income per capita)
FINANCE∆ Microfinance institutions (0–100)∆ Credit unions (0–100)∆ Agent banking (0–100)∆ Electronic money (0–100)∆ Warehouse receipts (0–100)
MARKETS∆ Production and sales (0–100)∂ Plant protection (0–100)Export documents per shipment (number)Time to prepare export documents (days)Cost of export documents in US$ (% income per capita)Trader licensing and membership requirements (number)Cost of licenses and membership in US$ (% income per capita)
TRANSPORT∆ Truck licenses (0–100)Time to obtain company license (days)Cost to obtain company license in US$ (% income per capita)Validity of company license (years)Time to obtain truck permit (days)Cost to obtain truck permit in US$ (% income per capita)Validity of truck permit (years)Cost to obtain vehicle technical inspection in US$ (% income per capita)Validity of vehicle inspection (years)◊ Cross-border transportation (0–100)
171

NEPAL SOUTH ASIALOW INCOME
SEED55.8
FERTILIZER57.2
MACHINERY21.0
FINANCE50.0
MARKETS81.3
TRANSPORT44.0
OPERATIONS (∆)50.4
QUALITY CONTROL (∂)45.3
TRADE (◊)51.0
The operations score is an average of seed, fertilizer, machinery, finance, markets and transport indicator scores indicated with a ∆. The quality control score is an average of seed, fertilizer, machinery and markets indicator scores indicated with a ∂. The trade score is an average of fertilizer, machinery and transport indicator scores indicated with a ◊.
55.868.8
5611
042.9
57.245.0
31125
49.4 (6.8)66.760.0
083.9 (11.5)
21.06.36.7
50.0N/AN/A
50.057.193.374.325.0
0
81.3100
62.522
5.3 (0.7)0
N/A
44.045.2N/AN/AN/A
2303.7 (41.6)
0.31.0 (0.1)
0.542.9
SEED∆ Seed registration (0–100)Procedures (number)Time (days)Cost in US$ (% income per capita)∆ Seed development and certification (0–100)
FERTILIZER∆ Fertilizer registration (0–100)Procedures (number)Time (days)Cost in US$ (% income per capita)∂ Fertilizer quality control (0–100)◊ Fertilizer import requirements (0–100)Cost to register as an importer of fertilizer in US$ (% income per capita)Cost to obtain an import permit for fertilizer in US$ (% income per capita)
MACHINERY∆ Tractor dealer requirements (0–100)∂ Tractor standards and safety (0–100)◊ Tractor import requirements (0–100)Cost to register as an importer of tractors in US$ (% income per capita)Cost to obtain an import permit for tractors in US$ (% income per capita)
FINANCE∆ Microfinance institutions (0–100)∆ Credit unions (0–100)∆ Agent banking (0–100)∆ Electronic money (0–100)∆ Warehouse receipts (0–100)
MARKETS∆ Production and sales (0–100)∂ Plant protection (0–100)Export documents per shipment (number)Time to prepare export documents (days)Cost of export documents in US$ (% income per capita)Trader licensing and membership requirements (number)Cost of licenses and membership in US$ (% income per capita)
TRANSPORT∆ Truck licenses (0–100)Time to obtain company license (days)Cost to obtain company license in US$ (% income per capita)Validity of company license (years)Time to obtain truck permit (days)Cost to obtain truck permit in US$ (% income per capita)Validity of truck permit (years)Cost to obtain vehicle technical inspection in US$ (% income per capita)Validity of vehicle inspection (years)◊ Cross-border transportation (0–100)
172

NICARAGUA LATIN AMERICA & CARIBBEANLOWER MIDDLE INCOME
SEED54.9
FERTILIZER64.4
MACHINERY41.5
FINANCE31.2
MARKETS67.0
TRANSPORT75.0
OPERATIONS (∆)48.0
QUALITY CONTROL (∂)58.6
TRADE (◊)74.7
The operations score is an average of seed, fertilizer, machinery, finance, markets and transport indicator scores indicated with a ∆. The quality control score is an average of seed, fertilizer, machinery and markets indicator scores indicated with a ∂. The trade score is an average of fertilizer, machinery and transport indicator scores indicated with a ◊.
54.981.3
6650
15,265.0 (834.2)28.6
64.435.0
230
1,600.0 (87.4)100
58.350.0 (2.7)25.0 (1.4)
41.531.313.380.0
0No data
31.20
60.00
25.070.8
67.071.462.5
22
28.9 (1.6)10
75.064.3N/AN/AN/A7.5
94.3 (5.2)5
12.1 (0.7)0.5
85.7
SEED∆ Seed registration (0–100)Procedures (number)Time (days)Cost in US$ (% income per capita)∆ Seed development and certification (0–100)
FERTILIZER∆ Fertilizer registration (0–100)Procedures (number)Time (days)Cost in US$ (% income per capita)∂ Fertilizer quality control (0–100)◊ Fertilizer import requirements (0–100)Cost to register as an importer of fertilizer in US$ (% income per capita)Cost to obtain an import permit for fertilizer in US$ (% income per capita)
MACHINERY∆ Tractor dealer requirements (0–100)∂ Tractor standards and safety (0–100)◊ Tractor import requirements (0–100)Cost to register as an importer of tractors in US$ (% income per capita)Cost to obtain an import permit for tractors in US$ (% income per capita)
FINANCE∆ Microfinance institutions (0–100)∆ Credit unions (0–100)∆ Agent banking (0–100)∆ Electronic money (0–100)∆ Warehouse receipts (0–100)
MARKETS∆ Production and sales (0–100)∂ Plant protection (0–100)Export documents per shipment (number)Time to prepare export documents (days)Cost of export documents in US$ (% income per capita)Trader licensing and membership requirements (number)Cost of licenses and membership in US$ (% income per capita)
TRANSPORT∆ Truck licenses (0–100)Time to obtain company license (days)Cost to obtain company license in US$ (% income per capita)Validity of company license (years)Time to obtain truck permit (days)Cost to obtain truck permit in US$ (% income per capita)Validity of truck permit (years)Cost to obtain vehicle technical inspection in US$ (% income per capita)Validity of vehicle inspection (years)◊ Cross-border transportation (0–100)
173

NIGER SUB-SAHARAN AFRICALOW INCOME
SEED43.8
FERTILIZER42.2
MACHINERY24.4
FINANCE36.8
MARKETS54.5
TRANSPORT60.7
OPERATIONS (∆)33.7
QUALITY CONTROL (∂)36.9
TRADE (◊)66.0
The operations score is an average of seed, fertilizer, machinery, finance, markets and transport indicator scores indicated with a ∆. The quality control score is an average of seed, fertilizer, machinery and markets indicator scores indicated with a ∂. The trade score is an average of fertilizer, machinery and transport indicator scores indicated with a ◊.
43.837.5
No practiceNo practiceNo practice
50.0
42.20
N/Aa
N/Aa
N/Aa
66.760.0N/A
39.9 (9.3)
24.40
6.766.7N/AN/A
36.842.960.0
081.3
0
54.571.437.5
13
10 (2.3)0
N/A
60.750.0N/AN/AN/A
139.9 (9.3)
0.50.3 (0.1)
0.571.4
a. The private sector is not required to register fertilizer.
SEED∆ Seed registration (0–100)Procedures (number)Time (days)Cost in US$ (% income per capita)∆ Seed development and certification (0–100)
FERTILIZER∆ Fertilizer registration (0–100)Procedures (number)Time (days)Cost in US$ (% income per capita)∂ Fertilizer quality control (0–100)◊ Fertilizer import requirements (0–100)Cost to register as an importer of fertilizer in US$ (% income per capita)Cost to obtain an import permit for fertilizer in US$ (% income per capita)
MACHINERY∆ Tractor dealer requirements (0–100)∂ Tractor standards and safety (0–100)◊ Tractor import requirements (0–100)Cost to register as an importer of tractors in US$ (% income per capita)Cost to obtain an import permit for tractors in US$ (% income per capita)
FINANCE∆ Microfinance institutions (0–100)∆ Credit unions (0–100)∆ Agent banking (0–100)∆ Electronic money (0–100)∆ Warehouse receipts (0–100)
MARKETS∆ Production and sales (0–100)∂ Plant protection (0–100)Export documents per shipment (number)Time to prepare export documents (days)Cost of export documents in US$ (% income per capita)Trader licensing and membership requirements (number)Cost of licenses and membership in US$ (% income per capita)
TRANSPORT∆ Truck licenses (0–100)Time to obtain company license (days)Cost to obtain company license in US$ (% income per capita)Validity of company license (years)Time to obtain truck permit (days)Cost to obtain truck permit in US$ (% income per capita)Validity of truck permit (years)Cost to obtain vehicle technical inspection in US$ (% income per capita)Validity of vehicle inspection (years)◊ Cross-border transportation (0–100)
174

PHILIPPINES EAST ASIA & PACIFICLOWER MIDDLE INCOME
SEED92.2
FERTILIZER57.2
MACHINERY68.7
FINANCE72.6
MARKETS52.7
TRANSPORT65.5
OPERATIONS (∆)68.5
QUALITY CONTROL (∂)58.8
TRADE (◊)63.8
The operations score is an average of seed, fertilizer, machinery, finance, markets and transport indicator scores indicated with a ∆. The quality control score is an average of seed, fertilizer, machinery and markets indicator scores indicated with a ∂. The trade score is an average of fertilizer, machinery and transport indicator scores indicated with a ◊.
92.284.4
6 a
571 a
0.0 a
100
57.265.0
3114
108.9 (6.0) b
66.740.0
No dataNo data
68.753.872.280.0
1200 (34.9)N/A c
72.685.7100
089.687.5
52.767.937.5
23
97.3 (2.8)1
113.5 (3.3)
65.559.5235
136.1 (4)5 d
N/AN/AN/A
12.8 (0.4)1
71.4
a. Registration is not mandatory, therefore we do not account for non-mandatory costs. b. The cost of application for registration and field testing is $108.9 but there is no data on the lab reports. c. 10–20% of import value. d. Licenses can be issued with varying validity from a minimum of 1 year up to a maximum of 5 years.
SEED∆ Seed registration (0–100)Procedures (number)Time (days)Cost in US$ (% income per capita)∆ Seed development and certification (0–100)
FERTILIZER∆ Fertilizer registration (0–100)Procedures (number)Time (days)Cost in US$ (% income per capita)∂ Fertilizer quality control (0–100)◊ Fertilizer import requirements (0–100)Cost to register as an importer of fertilizer in US$ (% income per capita)Cost to obtain an import permit for fertilizer in US$ (% income per capita)
MACHINERY∆ Tractor dealer requirements (0–100)∂ Tractor standards and safety (0–100)◊ Tractor import requirements (0–100)Cost to register as an importer of tractors in US$ (% income per capita)Cost to obtain an import permit for tractors in US$ (% income per capita)
FINANCE∆ Microfinance institutions (0–100)∆ Credit unions (0–100)∆ Agent banking (0–100)∆ Electronic money (0–100)∆ Warehouse receipts (0–100)
MARKETS∆ Production and sales (0–100)∂ Plant protection (0–100)Export documents per shipment (number)Time to prepare export documents (days)Cost of export documents in US$ (% income per capita)Trader licensing and membership requirements (number)Cost of licenses and membership in US$ (% income per capita)
TRANSPORT∆ Truck licenses (0–100)Time to obtain company license (days)Cost to obtain company license in US$ (% income per capita)Validity of company license (years)Time to obtain truck permit (days)Cost to obtain truck permit in US$ (% income per capita)Validity of truck permit (years)Cost to obtain vehicle technical inspection in US$ (% income per capita)Validity of vehicle inspection (years)◊ Cross-border transportation (0–100)
175
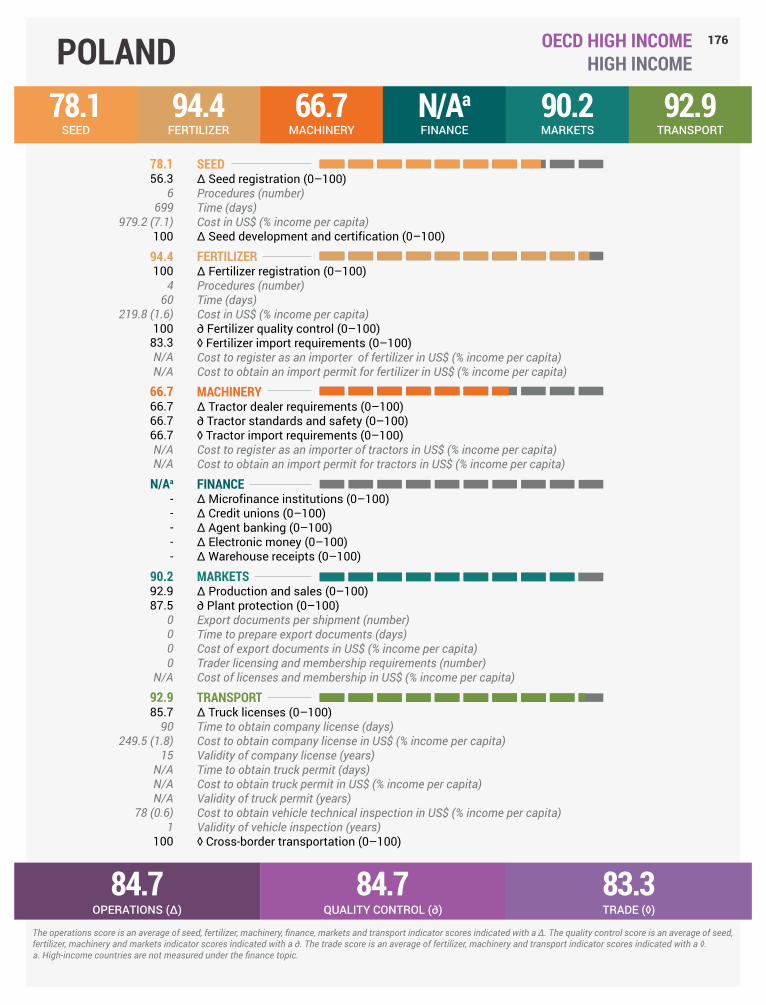
POLAND OECD HIGH INCOMEHIGH INCOME
SEED78.1
FERTILIZER94.4
MACHINERY66.7
FINANCEN/Aa
MARKETS90.2
TRANSPORT92.9
OPERATIONS (∆)84.7
QUALITY CONTROL (∂)84.7
TRADE (◊)83.3
The operations score is an average of seed, fertilizer, machinery, finance, markets and transport indicator scores indicated with a ∆. The quality control score is an average of seed, fertilizer, machinery and markets indicator scores indicated with a ∂. The trade score is an average of fertilizer, machinery and transport indicator scores indicated with a ◊.
78.156.3
6699
979.2 (7.1)100
94.4100
460
219.8 (1.6)100
83.3N/AN/A
66.766.766.766.7N/AN/A
N/Aa
-----
90.292.987.5
0000
N/A
92.985.7
90249.5 (1.8)
15N/AN/AN/A
78 (0.6)1
100
a. High-income countries are not measured under the finance topic.
SEED∆ Seed registration (0–100)Procedures (number)Time (days)Cost in US$ (% income per capita)∆ Seed development and certification (0–100)
FERTILIZER∆ Fertilizer registration (0–100)Procedures (number)Time (days)Cost in US$ (% income per capita)∂ Fertilizer quality control (0–100)◊ Fertilizer import requirements (0–100)Cost to register as an importer of fertilizer in US$ (% income per capita)Cost to obtain an import permit for fertilizer in US$ (% income per capita)
MACHINERY∆ Tractor dealer requirements (0–100)∂ Tractor standards and safety (0–100)◊ Tractor import requirements (0–100)Cost to register as an importer of tractors in US$ (% income per capita)Cost to obtain an import permit for tractors in US$ (% income per capita)
FINANCE∆ Microfinance institutions (0–100)∆ Credit unions (0–100)∆ Agent banking (0–100)∆ Electronic money (0–100)∆ Warehouse receipts (0–100)
MARKETS∆ Production and sales (0–100)∂ Plant protection (0–100)Export documents per shipment (number)Time to prepare export documents (days)Cost of export documents in US$ (% income per capita)Trader licensing and membership requirements (number)Cost of licenses and membership in US$ (% income per capita)
TRANSPORT∆ Truck licenses (0–100)Time to obtain company license (days)Cost to obtain company license in US$ (% income per capita)Validity of company license (years)Time to obtain truck permit (days)Cost to obtain truck permit in US$ (% income per capita)Validity of truck permit (years)Cost to obtain vehicle technical inspection in US$ (% income per capita)Validity of vehicle inspection (years)◊ Cross-border transportation (0–100)
176

RUSSIAN FEDERATION EUROPE & CENTRAL ASIAHIGH INCOME
SEED67.0
FERTILIZER67.6
MACHINERY64.7
FINANCEN/Ab
MARKETS80.4
TRANSPORT65.7
OPERATIONS (∆)68.8
QUALITY CONTROL (∂)71.3
TRADE (◊)66.0
The operations score is an average of seed, fertilizer, machinery, finance, markets and transport indicator scores indicated with a ∆. The quality control score is an average of seed, fertilizer, machinery and markets indicator scores indicated with a ∂. The trade score is an average of fertilizer, machinery and transport indicator scores indicated with a ◊.
67.062.5
5716
0a
71.4
67.675.0
5424
9,059.9 (68.6)61.166.7N/AN/A
64.756.377.860.0N/A
168.3 (1.3)
N/Ab
-----
80.485.775.0
412
33.4 (0.3)0
N/A
65.760.0N/AN/AN/AN/AN/AN/A
34.6 (0.3)1
71.4
a. Registering up to five varieties in a year is free of charge. b. High-income countries are not measured under the finance topic.
SEED∆ Seed registration (0–100)Procedures (number)Time (days)Cost in US$ (% income per capita)∆ Seed development and certification (0–100)
FERTILIZER∆ Fertilizer registration (0–100)Procedures (number)Time (days)Cost in US$ (% income per capita)∂ Fertilizer quality control (0–100)◊ Fertilizer import requirements (0–100)Cost to register as an importer of fertilizer in US$ (% income per capita)Cost to obtain an import permit for fertilizer in US$ (% income per capita)
MACHINERY∆ Tractor dealer requirements (0–100)∂ Tractor standards and safety (0–100)◊ Tractor import requirements (0–100)Cost to register as an importer of tractors in US$ (% income per capita)Cost to obtain an import permit for tractors in US$ (% income per capita)
FINANCE∆ Microfinance institutions (0–100)∆ Credit unions (0–100)∆ Agent banking (0–100)∆ Electronic money (0–100)∆ Warehouse receipts (0–100)
MARKETS∆ Production and sales (0–100)∂ Plant protection (0–100)Export documents per shipment (number)Time to prepare export documents (days)Cost of export documents in US$ (% income per capita)Trader licensing and membership requirements (number)Cost of licenses and membership in US$ (% income per capita)
TRANSPORT∆ Truck licenses (0–100)Time to obtain company license (days)Cost to obtain company license in US$ (% income per capita)Validity of company license (years)Time to obtain truck permit (days)Cost to obtain truck permit in US$ (% income per capita)Validity of truck permit (years)Cost to obtain vehicle technical inspection in US$ (% income per capita)Validity of vehicle inspection (years)◊ Cross-border transportation (0–100)
177

RWANDA SUB-SAHARAN AFRICALOW INCOME
SEED27.7
FERTILIZER61.7
MACHINERY41.1
FINANCE59.1
MARKETS56.3
TRANSPORT71.4
OPERATIONS (∆)56.1
QUALITY CONTROL (∂)37.5
TRADE (◊)67.1
The operations score is an average of seed, fertilizer, machinery, finance, markets and transport indicator scores indicated with a ∆. The quality control score is an average of seed, fertilizer, machinery and markets indicator scores indicated with a ∂. The trade score is an average of fertilizer, machinery and transport indicator scores indicated with a ◊.
27.712.5
No practiceNo practiceNo practice
42.9
61.745.0
5No data
14.9 (2.3)66.773.3
29.8 (4.6)0
41.133.333.356.7N/A
0
59.161.973.387.172.9
0
56.3100
12.51
No data a
0.3 (0.0)1
1,602.3 (246.5)
71.471.4
7158.5 (24.4)
1N/AN/AN/A
29.8 (4.6)1
71.4
a. The time to obtain document 1 (phytosanitary certificate) is 2 days. The time to obtain document 2 (quality certificate) could not be obtained.
SEED∆ Seed registration (0–100)Procedures (number)Time (days)Cost in US$ (% income per capita)∆ Seed development and certification (0–100)
FERTILIZER∆ Fertilizer registration (0–100)Procedures (number)Time (days)Cost in US$ (% income per capita)∂ Fertilizer quality control (0–100)◊ Fertilizer import requirements (0–100)Cost to register as an importer of fertilizer in US$ (% income per capita)Cost to obtain an import permit for fertilizer in US$ (% income per capita)
MACHINERY∆ Tractor dealer requirements (0–100)∂ Tractor standards and safety (0–100)◊ Tractor import requirements (0–100)Cost to register as an importer of tractors in US$ (% income per capita)Cost to obtain an import permit for tractors in US$ (% income per capita)
FINANCE∆ Microfinance institutions (0–100)∆ Credit unions (0–100)∆ Agent banking (0–100)∆ Electronic money (0–100)∆ Warehouse receipts (0–100)
MARKETS∆ Production and sales (0–100)∂ Plant protection (0–100)Export documents per shipment (number)Time to prepare export documents (days)Cost of export documents in US$ (% income per capita)Trader licensing and membership requirements (number)Cost of licenses and membership in US$ (% income per capita)
TRANSPORT∆ Truck licenses (0–100)Time to obtain company license (days)Cost to obtain company license in US$ (% income per capita)Validity of company license (years)Time to obtain truck permit (days)Cost to obtain truck permit in US$ (% income per capita)Validity of truck permit (years)Cost to obtain vehicle technical inspection in US$ (% income per capita)Validity of vehicle inspection (years)◊ Cross-border transportation (0–100)
178
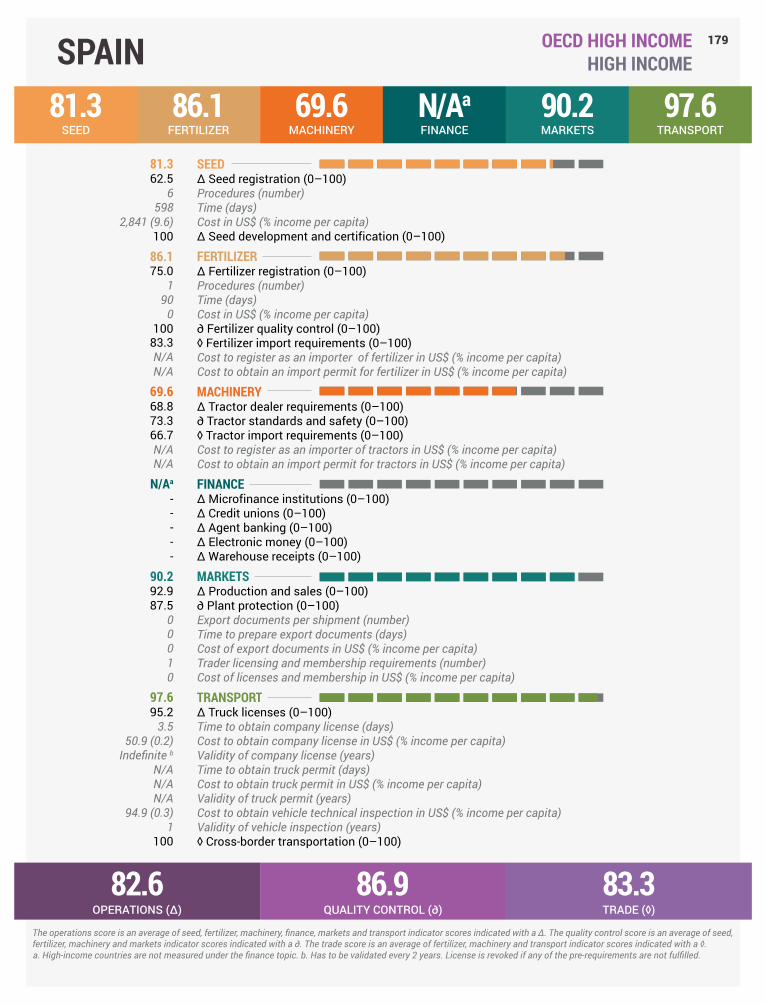
SPAIN OECD HIGH INCOMEHIGH INCOME
SEED81.3
FERTILIZER86.1
MACHINERY69.6
FINANCEN/Aa
MARKETS90.2
TRANSPORT97.6
OPERATIONS (∆)82.6
QUALITY CONTROL (∂)86.9
TRADE (◊)83.3
The operations score is an average of seed, fertilizer, machinery, finance, markets and transport indicator scores indicated with a ∆. The quality control score is an average of seed, fertilizer, machinery and markets indicator scores indicated with a ∂. The trade score is an average of fertilizer, machinery and transport indicator scores indicated with a ◊.
81.362.5
6598
2,841 (9.6)100
86.175.0
190
0100
83.3N/AN/A
69.668.873.366.7N/AN/A
N/Aa
-----
90.292.987.5
00010
97.695.2
3.550.9 (0.2)
Indefinite b
N/AN/AN/A
94.9 (0.3)1
100
a. High-income countries are not measured under the finance topic. b. Has to be validated every 2 years. License is revoked if any of the pre-requirements are not fulfilled.
SEED∆ Seed registration (0–100)Procedures (number)Time (days)Cost in US$ (% income per capita)∆ Seed development and certification (0–100)
FERTILIZER∆ Fertilizer registration (0–100)Procedures (number)Time (days)Cost in US$ (% income per capita)∂ Fertilizer quality control (0–100)◊ Fertilizer import requirements (0–100)Cost to register as an importer of fertilizer in US$ (% income per capita)Cost to obtain an import permit for fertilizer in US$ (% income per capita)
MACHINERY∆ Tractor dealer requirements (0–100)∂ Tractor standards and safety (0–100)◊ Tractor import requirements (0–100)Cost to register as an importer of tractors in US$ (% income per capita)Cost to obtain an import permit for tractors in US$ (% income per capita)
FINANCE∆ Microfinance institutions (0–100)∆ Credit unions (0–100)∆ Agent banking (0–100)∆ Electronic money (0–100)∆ Warehouse receipts (0–100)
MARKETS∆ Production and sales (0–100)∂ Plant protection (0–100)Export documents per shipment (number)Time to prepare export documents (days)Cost of export documents in US$ (% income per capita)Trader licensing and membership requirements (number)Cost of licenses and membership in US$ (% income per capita)
TRANSPORT∆ Truck licenses (0–100)Time to obtain company license (days)Cost to obtain company license in US$ (% income per capita)Validity of company license (years)Time to obtain truck permit (days)Cost to obtain truck permit in US$ (% income per capita)Validity of truck permit (years)Cost to obtain vehicle technical inspection in US$ (% income per capita)Validity of vehicle inspection (years)◊ Cross-border transportation (0–100)
179

SRI LANKA SOUTH ASIALOWER MIDDLE INCOME
SEED53.6
FERTILIZER72.2
MACHINERY40.1
FINANCE30.3
MARKETS41.1
TRANSPORT36.9
OPERATIONS (∆)52.3
QUALITY CONTROL (∂)45.0
TRADE (◊)42.8
The operations score is an average of seed, fertilizer, machinery, finance, markets and transport indicator scores indicated with a ∆. The quality control score is an average of seed, fertilizer, machinery and markets indicator scores indicated with a ∂. The trade score is an average of fertilizer, machinery and transport indicator scores indicated with a ◊.
53.650.0
4298
057.1
72.280.0
3187
73.5 (2.2)83.353.3
147.0 (4.3)0
40.118.826.775.0
7.4 (0.2)N/A
30.30
60.00
91.70
41.157.125.0
34
273.2 (8)2
222 (6.5)
36.973.8N/AN/AN/A1.5
101.1 (3.0)1
15.1 (0.4)10
SEED∆ Seed registration (0–100)Procedures (number)Time (days)Cost in US$ (% income per capita)∆ Seed development and certification (0–100)
FERTILIZER∆ Fertilizer registration (0–100)Procedures (number)Time (days)Cost in US$ (% income per capita)∂ Fertilizer quality control (0–100)◊ Fertilizer import requirements (0–100)Cost to register as an importer of fertilizer in US$ (% income per capita)Cost to obtain an import permit for fertilizer in US$ (% income per capita)
MACHINERY∆ Tractor dealer requirements (0–100)∂ Tractor standards and safety (0–100)◊ Tractor import requirements (0–100)Cost to register as an importer of tractors in US$ (% income per capita)Cost to obtain an import permit for tractors in US$ (% income per capita)
FINANCE∆ Microfinance institutions (0–100)∆ Credit unions (0–100)∆ Agent banking (0–100)∆ Electronic money (0–100)∆ Warehouse receipts (0–100)
MARKETS∆ Production and sales (0–100)∂ Plant protection (0–100)Export documents per shipment (number)Time to prepare export documents (days)Cost of export documents in US$ (% income per capita)Trader licensing and membership requirements (number)Cost of licenses and membership in US$ (% income per capita)
TRANSPORT∆ Truck licenses (0–100)Time to obtain company license (days)Cost to obtain company license in US$ (% income per capita)Validity of company license (years)Time to obtain truck permit (days)Cost to obtain truck permit in US$ (% income per capita)Validity of truck permit (years)Cost to obtain vehicle technical inspection in US$ (% income per capita)Validity of vehicle inspection (years)◊ Cross-border transportation (0–100)
180

SUDAN SUB-SAHARAN AFRICALOWER MIDDLE INCOME
SEED76.6
FERTILIZER63.3
MACHINERY45.9
FINANCE27.1
MARKETS61.6
TRANSPORT65.7
OPERATIONS (∆)63.2
QUALITY CONTROL (∂)49.5
TRADE (◊)52.7
The operations score is an average of seed, fertilizer, machinery, finance, markets and transport indicator scores indicated with a ∆. The quality control score is an average of seed, fertilizer, machinery and markets indicator scores indicated with a ∂. The trade score is an average of fertilizer, machinery and transport indicator scores indicated with a ◊.
76.653.1
5654
12,554.3 (721.5)100
63.380.0
429
65.9 (3.8)66.743.3
82.4 (4.7)33.0 (1.9)
45.950.044.443.3
82.4 (4.7)33.0 (1.9)
27.185.7
00
50.00
61.685.737.5
2No data a
41.9 (2.4)0
N/A
65.760.0N/AN/AN/AN/AN/AN/A
205.9 (11.8)1
71.4
a. The time to obtain document 1 (phytosanitary certificate) is 7 days. The time to obtain document 2 (fumigation certificate) could not be obtained.
SEED∆ Seed registration (0–100)Procedures (number)Time (days)Cost in US$ (% income per capita)∆ Seed development and certification (0–100)
FERTILIZER∆ Fertilizer registration (0–100)Procedures (number)Time (days)Cost in US$ (% income per capita)∂ Fertilizer quality control (0–100)◊ Fertilizer import requirements (0–100)Cost to register as an importer of fertilizer in US$ (% income per capita)Cost to obtain an import permit for fertilizer in US$ (% income per capita)
MACHINERY∆ Tractor dealer requirements (0–100)∂ Tractor standards and safety (0–100)◊ Tractor import requirements (0–100)Cost to register as an importer of tractors in US$ (% income per capita)Cost to obtain an import permit for tractors in US$ (% income per capita)
FINANCE∆ Microfinance institutions (0–100)∆ Credit unions (0–100)∆ Agent banking (0–100)∆ Electronic money (0–100)∆ Warehouse receipts (0–100)
MARKETS∆ Production and sales (0–100)∂ Plant protection (0–100)Export documents per shipment (number)Time to prepare export documents (days)Cost of export documents in US$ (% income per capita)Trader licensing and membership requirements (number)Cost of licenses and membership in US$ (% income per capita)
TRANSPORT∆ Truck licenses (0–100)Time to obtain company license (days)Cost to obtain company license in US$ (% income per capita)Validity of company license (years)Time to obtain truck permit (days)Cost to obtain truck permit in US$ (% income per capita)Validity of truck permit (years)Cost to obtain vehicle technical inspection in US$ (% income per capita)Validity of vehicle inspection (years)◊ Cross-border transportation (0–100)
181

TAJIKISTAN EUROPE & CENTRAL ASIALOWER MIDDLE INCOME
SEED56.7
FERTILIZER40.6
MACHINERY47.8
FINANCE32.0
MARKETS74.1
TRANSPORT78.6
OPERATIONS (∆)60.9
QUALITY CONTROL (∂)29.7
TRADE (◊)68.3
The operations score is an average of seed, fertilizer, machinery, finance, markets and transport indicator scores indicated with a ∆. The quality control score is an average of seed, fertilizer, machinery and markets indicator scores indicated with a ∂. The trade score is an average of fertilizer, machinery and transport indicator scores indicated with a ◊.
56.756.3
No dataNo dataNo data
57.1
40.655.0
No dataNo dataNo data
0a
66.7N/AN/A
47.850.026.766.7N/AN/A
32.095.240.0
025.0
0
74.185.762.5
26
62.9 (5.9)0
N/A
78.685.7
30111.0 (10.5)
5.0 b
N/AN/AN/A
138.8 (13.1)1
71.4
a. According to the Law On Production and Safe Use of Pesticides and Agrochemicals (03/07/2012), quality control is not regulated. b. Not less than 5 years.
SEED∆ Seed registration (0–100)Procedures (number)Time (days)Cost in US$ (% income per capita)∆ Seed development and certification (0–100)
FERTILIZER∆ Fertilizer registration (0–100)Procedures (number)Time (days)Cost in US$ (% income per capita)∂ Fertilizer quality control (0–100)◊ Fertilizer import requirements (0–100)Cost to register as an importer of fertilizer in US$ (% income per capita)Cost to obtain an import permit for fertilizer in US$ (% income per capita)
MACHINERY∆ Tractor dealer requirements (0–100)∂ Tractor standards and safety (0–100)◊ Tractor import requirements (0–100)Cost to register as an importer of tractors in US$ (% income per capita)Cost to obtain an import permit for tractors in US$ (% income per capita)
FINANCE∆ Microfinance institutions (0–100)∆ Credit unions (0–100)∆ Agent banking (0–100)∆ Electronic money (0–100)∆ Warehouse receipts (0–100)
MARKETS∆ Production and sales (0–100)∂ Plant protection (0–100)Export documents per shipment (number)Time to prepare export documents (days)Cost of export documents in US$ (% income per capita)Trader licensing and membership requirements (number)Cost of licenses and membership in US$ (% income per capita)
TRANSPORT∆ Truck licenses (0–100)Time to obtain company license (days)Cost to obtain company license in US$ (% income per capita)Validity of company license (years)Time to obtain truck permit (days)Cost to obtain truck permit in US$ (% income per capita)Validity of truck permit (years)Cost to obtain vehicle technical inspection in US$ (% income per capita)Validity of vehicle inspection (years)◊ Cross-border transportation (0–100)
182

TANZANIA SUB-SAHARAN AFRICALOW INCOME
SEED71.9
FERTILIZER75.0
MACHINERY51.4
FINANCE74.2
MARKETS54.5
TRANSPORT67.9
OPERATIONS (∆)63.2
QUALITY CONTROL (∂)56.9
TRADE (◊)73.3
The operations score is an average of seed, fertilizer, machinery, finance, markets and transport indicator scores indicated with a ∆. The quality control score is an average of seed, fertilizer, machinery and markets indicator scores indicated with a ∂. The trade score is an average of fertilizer, machinery and transport indicator scores indicated with a ◊.
71.956.3
6333
652.1 (70.1)87.5
75.060.0
5578.5
9,899.5 (1,064.5)100
65.0No dataNo data
51.437.533.383.3N/AN/A
74.271.4100
87.125.087.5
54.571.437.5
413
39 (4.2) a
1No data
67.964.3N/AN/AN/A
347.4 (5.1)
129.6 (3.2)
171.4
a. The total cost excludes the cost of document 3 (radioactivity analysis certificate), which is approximately 0.3% of the FOB value of the goods exported.
SEED∆ Seed registration (0–100)Procedures (number)Time (days)Cost in US$ (% income per capita)∆ Seed development and certification (0–100)
FERTILIZER∆ Fertilizer registration (0–100)Procedures (number)Time (days)Cost in US$ (% income per capita)∂ Fertilizer quality control (0–100)◊ Fertilizer import requirements (0–100)Cost to register as an importer of fertilizer in US$ (% income per capita)Cost to obtain an import permit for fertilizer in US$ (% income per capita)
MACHINERY∆ Tractor dealer requirements (0–100)∂ Tractor standards and safety (0–100)◊ Tractor import requirements (0–100)Cost to register as an importer of tractors in US$ (% income per capita)Cost to obtain an import permit for tractors in US$ (% income per capita)
FINANCE∆ Microfinance institutions (0–100)∆ Credit unions (0–100)∆ Agent banking (0–100)∆ Electronic money (0–100)∆ Warehouse receipts (0–100)
MARKETS∆ Production and sales (0–100)∂ Plant protection (0–100)Export documents per shipment (number)Time to prepare export documents (days)Cost of export documents in US$ (% income per capita)Trader licensing and membership requirements (number)Cost of licenses and membership in US$ (% income per capita)
TRANSPORT∆ Truck licenses (0–100)Time to obtain company license (days)Cost to obtain company license in US$ (% income per capita)Validity of company license (years)Time to obtain truck permit (days)Cost to obtain truck permit in US$ (% income per capita)Validity of truck permit (years)Cost to obtain vehicle technical inspection in US$ (% income per capita)Validity of vehicle inspection (years)◊ Cross-border transportation (0–100)
183

TURKEY EUROPE & CENTRAL ASIAUPPER MIDDLE INCOME
SEED76.6
FERTILIZER66.7
MACHINERY54.3
FINANCE79.7
MARKETS69.6
TRANSPORT83.3
OPERATIONS (∆)69.6
QUALITY CONTROL (∂)58.3
TRADE (◊)77.5
The operations score is an average of seed, fertilizer, machinery, finance, markets and transport indicator scores indicated with a ∆. The quality control score is an average of seed, fertilizer, machinery and markets indicator scores indicated with a ∂. The trade score is an average of fertilizer, machinery and transport indicator scores indicated with a ◊.
76.678.1
6646
3,367.3 (31.0)75
66.770.0
350
180.7 (1.7)50.080.0
No dataNo data
54.346.350.066.7N/AN/A
79.7N/A a
60.0N/A a
79.2100
69.664.375.0
33
19 (0.2)10
83.381.0
44280.5 (39.5)
5N/AN/AN/A
142.7 (1.3)1
85.7
a. Upper-middle-income countries are not measured under the microfinance institutions indicator and agent banking indicator.
SEED∆ Seed registration (0–100)Procedures (number)Time (days)Cost in US$ (% income per capita)∆ Seed development and certification (0–100)
FERTILIZER∆ Fertilizer registration (0–100)Procedures (number)Time (days)Cost in US$ (% income per capita)∂ Fertilizer quality control (0–100)◊ Fertilizer import requirements (0–100)Cost to register as an importer of fertilizer in US$ (% income per capita)Cost to obtain an import permit for fertilizer in US$ (% income per capita)
MACHINERY∆ Tractor dealer requirements (0–100)∂ Tractor standards and safety (0–100)◊ Tractor import requirements (0–100)Cost to register as an importer of tractors in US$ (% income per capita)Cost to obtain an import permit for tractors in US$ (% income per capita)
FINANCE∆ Microfinance institutions (0–100)∆ Credit unions (0–100)∆ Agent banking (0–100)∆ Electronic money (0–100)∆ Warehouse receipts (0–100)
MARKETS∆ Production and sales (0–100)∂ Plant protection (0–100)Export documents per shipment (number)Time to prepare export documents (days)Cost of export documents in US$ (% income per capita)Trader licensing and membership requirements (number)Cost of licenses and membership in US$ (% income per capita)
TRANSPORT∆ Truck licenses (0–100)Time to obtain company license (days)Cost to obtain company license in US$ (% income per capita)Validity of company license (years)Time to obtain truck permit (days)Cost to obtain truck permit in US$ (% income per capita)Validity of truck permit (years)Cost to obtain vehicle technical inspection in US$ (% income per capita)Validity of vehicle inspection (years)◊ Cross-border transportation (0–100)
184

UGANDA SUB-SAHARAN AFRICALOW INCOME
SEED44.2
FERTILIZER56.4
MACHINERY51.0
FINANCE46.3
MARKETS58.9
TRANSPORT75.0
OPERATIONS (∆)60.5
QUALITY CONTROL (∂)35.0
TRADE (◊)70.8
The operations score is an average of seed, fertilizer, machinery, finance, markets and transport indicator scores indicated with a ∆. The quality control score is an average of seed, fertilizer, machinery and markets indicator scores indicated with a ∂. The trade score is an average of fertilizer, machinery and transport indicator scores indicated with a ◊.
44.231.3
5523
0a
57.1
56.445.0
5691
1,708.9 (258.9)66.757.5
379.8 (57.5)0
51.056.313.383.3N/AN/A
46.366.740.0
025.0100
58.992.925.0
4No dataNo data
1569.6 (86.3)
7578.6N/AN/AN/A
141.8 (6.3)
176 (11.5)
171.4
a. In practice, the National Agriculture Research Organization (NARD), which is in charge of registration , has not been charging fees for these procedures.
SEED∆ Seed registration (0–100)Procedures (number)Time (days)Cost in US$ (% income per capita)∆ Seed development and certification (0–100)
FERTILIZER∆ Fertilizer registration (0–100)Procedures (number)Time (days)Cost in US$ (% income per capita)∂ Fertilizer quality control (0–100)◊ Fertilizer import requirements (0–100)Cost to register as an importer of fertilizer in US$ (% income per capita)Cost to obtain an import permit for fertilizer in US$ (% income per capita)
MACHINERY∆ Tractor dealer requirements (0–100)∂ Tractor standards and safety (0–100)◊ Tractor import requirements (0–100)Cost to register as an importer of tractors in US$ (% income per capita)Cost to obtain an import permit for tractors in US$ (% income per capita)
FINANCE∆ Microfinance institutions (0–100)∆ Credit unions (0–100)∆ Agent banking (0–100)∆ Electronic money (0–100)∆ Warehouse receipts (0–100)
MARKETS∆ Production and sales (0–100)∂ Plant protection (0–100)Export documents per shipment (number)Time to prepare export documents (days)Cost of export documents in US$ (% income per capita)Trader licensing and membership requirements (number)Cost of licenses and membership in US$ (% income per capita)
TRANSPORT∆ Truck licenses (0–100)Time to obtain company license (days)Cost to obtain company license in US$ (% income per capita)Validity of company license (years)Time to obtain truck permit (days)Cost to obtain truck permit in US$ (% income per capita)Validity of truck permit (years)Cost to obtain vehicle technical inspection in US$ (% income per capita)Validity of vehicle inspection (years)◊ Cross-border transportation (0–100)
185

UKRAINE EUROPE & CENTRAL ASIALOWER MIDDLE INCOME
SEED74.1
FERTILIZER80.6
MACHINERY62.7
FINANCE41.6
MARKETS86.6
TRANSPORT65.7
OPERATIONS (∆)63.4
QUALITY CONTROL (∂)88.4
TRADE (◊)68.3
The operations score is an average of seed, fertilizer, machinery, finance, markets and transport indicator scores indicated with a ∆. The quality control score is an average of seed, fertilizer, machinery and markets indicator scores indicated with a ∂. The trade score is an average of fertilizer, machinery and transport indicator scores indicated with a ◊.
74.162.5
6714
1,136.4 (31.9)85.7
80.675.0
5325
25,537.2 (717.3)100
66.7N/AN/A
62.743.877.866.7N/AN/A
41.60
40.042.925.0100
86.685.787.5
35
31.2 (0.9)0
N/A
65.760.0N/AN/AN/AN/AN/AN/A
39.3 (1.1)1
71.4
SEED∆ Seed registration (0–100)Procedures (number)Time (days)Cost in US$ (% income per capita)∆ Seed development and certification (0–100)
FERTILIZER∆ Fertilizer registration (0–100)Procedures (number)Time (days)Cost in US$ (% income per capita)∂ Fertilizer quality control (0–100)◊ Fertilizer import requirements (0–100)Cost to register as an importer of fertilizer in US$ (% income per capita)Cost to obtain an import permit for fertilizer in US$ (% income per capita)
MACHINERY∆ Tractor dealer requirements (0–100)∂ Tractor standards and safety (0–100)◊ Tractor import requirements (0–100)Cost to register as an importer of tractors in US$ (% income per capita)Cost to obtain an import permit for tractors in US$ (% income per capita)
FINANCE∆ Microfinance institutions (0–100)∆ Credit unions (0–100)∆ Agent banking (0–100)∆ Electronic money (0–100)∆ Warehouse receipts (0–100)
MARKETS∆ Production and sales (0–100)∂ Plant protection (0–100)Export documents per shipment (number)Time to prepare export documents (days)Cost of export documents in US$ (% income per capita)Trader licensing and membership requirements (number)Cost of licenses and membership in US$ (% income per capita)
TRANSPORT∆ Truck licenses (0–100)Time to obtain company license (days)Cost to obtain company license in US$ (% income per capita)Validity of company license (years)Time to obtain truck permit (days)Cost to obtain truck permit in US$ (% income per capita)Validity of truck permit (years)Cost to obtain vehicle technical inspection in US$ (% income per capita)Validity of vehicle inspection (years)◊ Cross-border transportation (0–100)
186

VIETNAM EAST ASIA & PACIFICLOWER MIDDLE INCOME
SEED62.5
FERTILIZER70.0
MACHINERY24.4
FINANCE45.3
MARKETS80.4
TRANSPORT54.8
OPERATIONS (∆)55.7
QUALITY CONTROL (∂)60.6
TRADE (◊)48.4
The operations score is an average of seed, fertilizer, machinery, finance, markets and transport indicator scores indicated with a ∆. The quality control score is an average of seed, fertilizer, machinery and markets indicator scores indicated with a ∂. The trade score is an average of fertilizer, machinery and transport indicator scores indicated with a ◊.
62.562.5
6901
8,050.8 (426.0)62.5
70.060.0
315
50.0 (2.6)100
50.0N/A
20.0 (1.1)
24.40
6.766.7N/AN/A
45.371.480.0
075.0
0
80.485.775.0
23
38.5 (2.0)10
54.881.0
39.2 (0.5)
7N/AN/AN/A
16.1 (0.9)0.5
28.6
SEED∆ Seed registration (0–100)Procedures (number)Time (days)Cost in US$ (% income per capita)∆ Seed development and certification (0–100)
FERTILIZER∆ Fertilizer registration (0–100)Procedures (number)Time (days)Cost in US$ (% income per capita)∂ Fertilizer quality control (0–100)◊ Fertilizer import requirements (0–100)Cost to register as an importer of fertilizer in US$ (% income per capita)Cost to obtain an import permit for fertilizer in US$ (% income per capita)
MACHINERY∆ Tractor dealer requirements (0–100)∂ Tractor standards and safety (0–100)◊ Tractor import requirements (0–100)Cost to register as an importer of tractors in US$ (% income per capita)Cost to obtain an import permit for tractors in US$ (% income per capita)
FINANCE∆ Microfinance institutions (0–100)∆ Credit unions (0–100)∆ Agent banking (0–100)∆ Electronic money (0–100)∆ Warehouse receipts (0–100)
MARKETS∆ Production and sales (0–100)∂ Plant protection (0–100)Export documents per shipment (number)Time to prepare export documents (days)Cost of export documents in US$ (% income per capita)Trader licensing and membership requirements (number)Cost of licenses and membership in US$ (% income per capita)
TRANSPORT∆ Truck licenses (0–100)Time to obtain company license (days)Cost to obtain company license in US$ (% income per capita)Validity of company license (years)Time to obtain truck permit (days)Cost to obtain truck permit in US$ (% income per capita)Validity of truck permit (years)Cost to obtain vehicle technical inspection in US$ (% income per capita)Validity of vehicle inspection (years)◊ Cross-border transportation (0–100)
187

ZAMBIA SUB-SAHARAN AFRICALOWER MIDDLE INCOME
SEED70.3
FERTILIZER56.7
MACHINERY39.2
FINANCE51.3
MARKETS61.6
TRANSPORT67.9
OPERATIONS (∆)55.8
QUALITY CONTROL (∂)39.2
TRADE (◊)71.9
The operations score is an average of seed, fertilizer, machinery, finance, markets and transport indicator scores indicated with a ∆. The quality control score is an average of seed, fertilizer, machinery and markets indicator scores indicated with a ∂. The trade score is an average of fertilizer, machinery and transport indicator scores indicated with a ◊.
70.353.1
5544
1,045.0 (59.4)87.5
56.740.0
4211
4,249.8 (241.5)66.763.3
0183.0 (10.4)
39.237.513.366.7N/AN/A
51.366.740.0
050.0100
61.685.737.5
511
190.6 (10.8)0
N/A
67.950.0N/AN/AN/A
9017.6 (1.0)
15.2 (0.3)
185.7
SEED∆ Seed registration (0–100)Procedures (number)Time (days)Cost in US$ (% income per capita)∆ Seed development and certification (0–100)
FERTILIZER∆ Fertilizer registration (0–100)Procedures (number)Time (days)Cost in US$ (% income per capita)∂ Fertilizer quality control (0–100)◊ Fertilizer import requirements (0–100)Cost to register as an importer of fertilizer in US$ (% income per capita)Cost to obtain an import permit for fertilizer in US$ (% income per capita)
MACHINERY∆ Tractor dealer requirements (0–100)∂ Tractor standards and safety (0–100)◊ Tractor import requirements (0–100)Cost to register as an importer of tractors in US$ (% income per capita)Cost to obtain an import permit for tractors in US$ (% income per capita)
FINANCE∆ Microfinance institutions (0–100)∆ Credit unions (0–100)∆ Agent banking (0–100)∆ Electronic money (0–100)∆ Warehouse receipts (0–100)
MARKETS∆ Production and sales (0–100)∂ Plant protection (0–100)Export documents per shipment (number)Time to prepare export documents (days)Cost of export documents in US$ (% income per capita)Trader licensing and membership requirements (number)Cost of licenses and membership in US$ (% income per capita)
TRANSPORT∆ Truck licenses (0–100)Time to obtain company license (days)Cost to obtain company license in US$ (% income per capita)Validity of company license (years)Time to obtain truck permit (days)Cost to obtain truck permit in US$ (% income per capita)Validity of truck permit (years)Cost to obtain vehicle technical inspection in US$ (% income per capita)Validity of vehicle inspection (years)◊ Cross-border transportation (0–100)
188


