
ENERGY EFFICIENCYENERGY EFFICIENCYIN MANUFACTURINGIN MANUFACTURING
MALTA

Department of Industrial Electrical Power ConversionFaculty of Engineering – University of Malta
Energy Efficient Electric Motor Energy Efficient Electric Motor Systems for the Systems for the
Manufacturing IndustryManufacturing Industry
Key Experts: Prof. Ing. C. Spiteri-
Staines
Co-Supervisors: Dr. Cedric Caruana
Researcher: Mr. Peter Spiteri
Industrial Partners : Playmobil
Toly Products
Andrews Feeds
Department of Industrial Electrical Power Conversion, University of Malta
IntroductionIntroduction
• It is estimated that motor driven systems account for around 65% of the electricity consumed by the European industry.
• 1.5% improvement in the motors’ efficiency implies a reduction of 1% energy consumption in the European industry.
• The more efficient use of energy in the manufacturing industry has become a key factor for the industrial organisations to maintain a competitive edge.

Department of Industrial Electrical Power Conversion, University of Malta
Aims of ProjectAims of Project
• The objective is to facilitate the adoption of energy saving measures on electric motors by the Maltese industry.
• Carry out an extensive Data gathering exercise on Energy Usage and Patterns of Electrical Motor Systems in various local industries
• The project will deliver a tool which will allow organisations to evaluate alternative options of reducing their electric motors’ energy consumption.
• Benefits derived from project:– Knowledge on energy savings mechanisms for manufacturing
industry– Additional benefits: reduced heat dissipation and lower
maintenance costs.
Department of Industrial Electrical Power Conversion, University of Malta
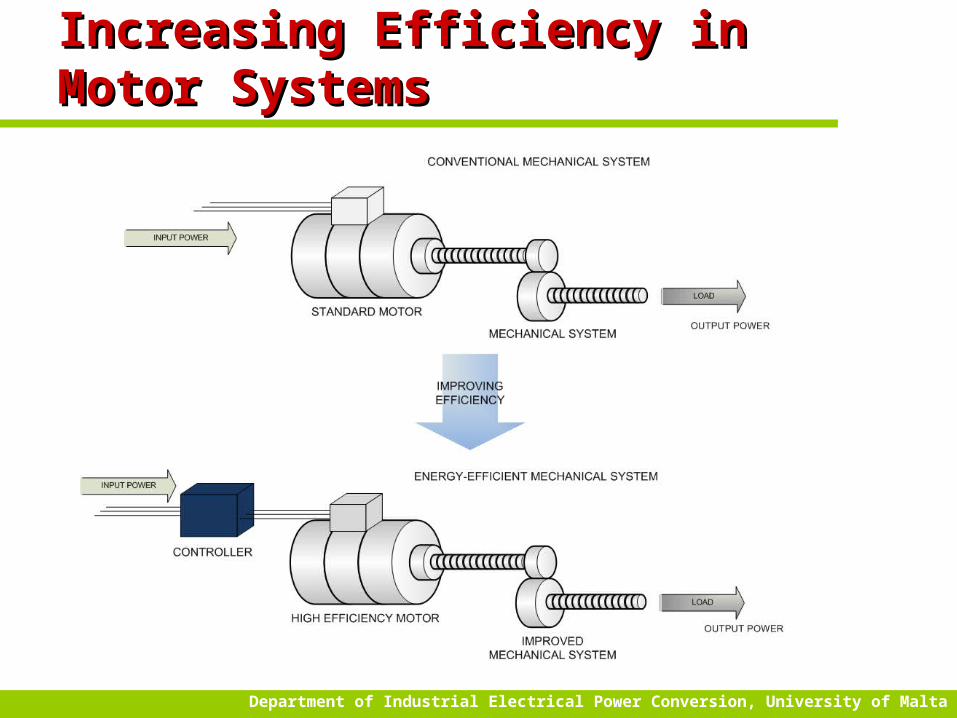
Increasing Efficiency in Motor Increasing Efficiency in Motor SystemsSystems

Department of Industrial Electrical Power Conversion, University of Malta
IE Motor Efficiency IE Motor Efficiency StandardsStandards
The new standard introduces also IE4 (super premium efficiency), a future level above IE3, but IE4 products are not yet commercially available.
6
50Hz Motors

Department of Industrial Electrical Power Conversion, University of Malta
Comparing Old & New Efficiency Comparing Old & New Efficiency StandardsStandards
• Old Standards EFF1, EFF2 and EFF 3
• New Standards: IE1 – Standard Efficiency (comparable to EFF2)IE2 – High Efficiency (comparable to EFF1)
IE3 – Premium Efficiency

Department of Industrial Electrical Power Conversion, University of Malta
How to minimise losses in Motor How to minimise losses in Motor Driven SystemsDriven Systems
• Replace Old Motor by HEM
• Use a Motor Energy Controller (only certain applications as we will see)
• Use a Variable Speed Drive (inverter)
Study carried out by South Carolina Energy Office

Department of Industrial Electrical Power Conversion, University of Malta
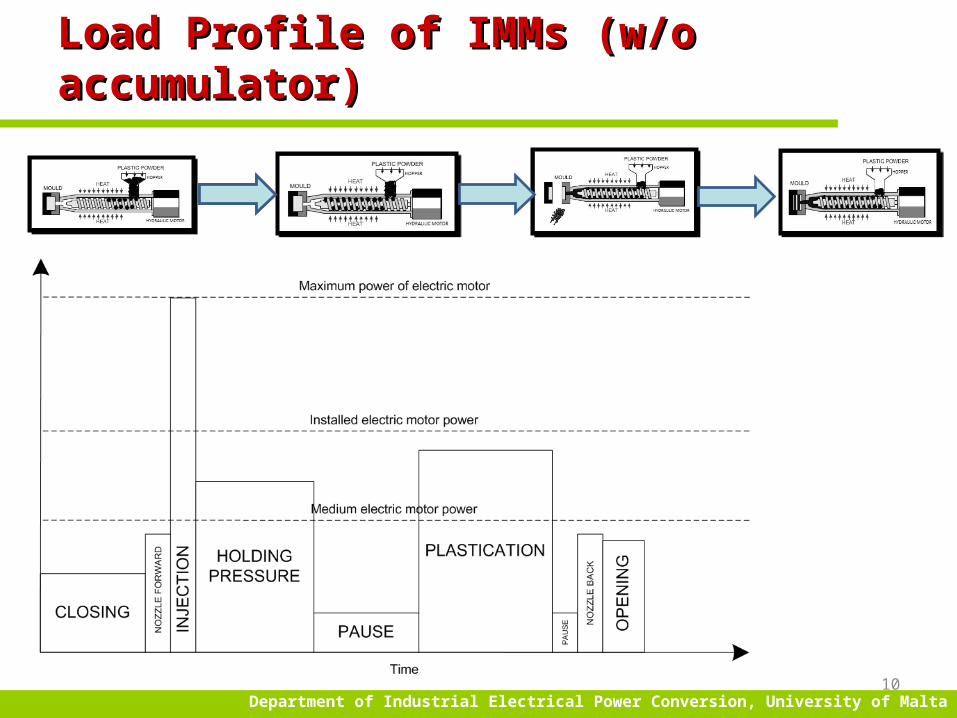
Check Load Profile of MachineCheck Load Profile of Machine
• Low Load means Low Efficiency and Low Power Factor
Try to use a motor close to its rated power, do not overrate without scope!!!
Department of Industrial Electrical Power Conversion, University of Malta
Load Profile of IMMs (w/o accumulator)Load Profile of IMMs (w/o accumulator)
10

Department of Industrial Electrical Power Conversion, University of Malta
Motor Systems Selected for StudyMotor Systems Selected for Study
IMM typeMotor rating (kW)
No. of hrs / yr (ave.)
Accum. ColourClamping
Force (kN)
K 60/S 3C 30 4002 Yes 3-colour 600
K 60/S 2C 22 4247 Yes 2-colour 600
K 60-256/S 2C 30 N/A Yes 2-colour* 600
BA 1500 22 6000 No 1-colour 1500
BA 2000 30 6000 No 1-colour 2000
Motor applicationMotor rating (kW)
Quantity
Mixer 30 1
Conveyer 4 31
Elevator 7.5 11
Cuber 55, 75, 90 8
The study consisted of:• Injection Mould
Machines and• other motor driven
systems such as elevators, conveyers, mixers and cubers,
at partner premises.
Department of Industrial Electrical Power Conversion, University of Malta
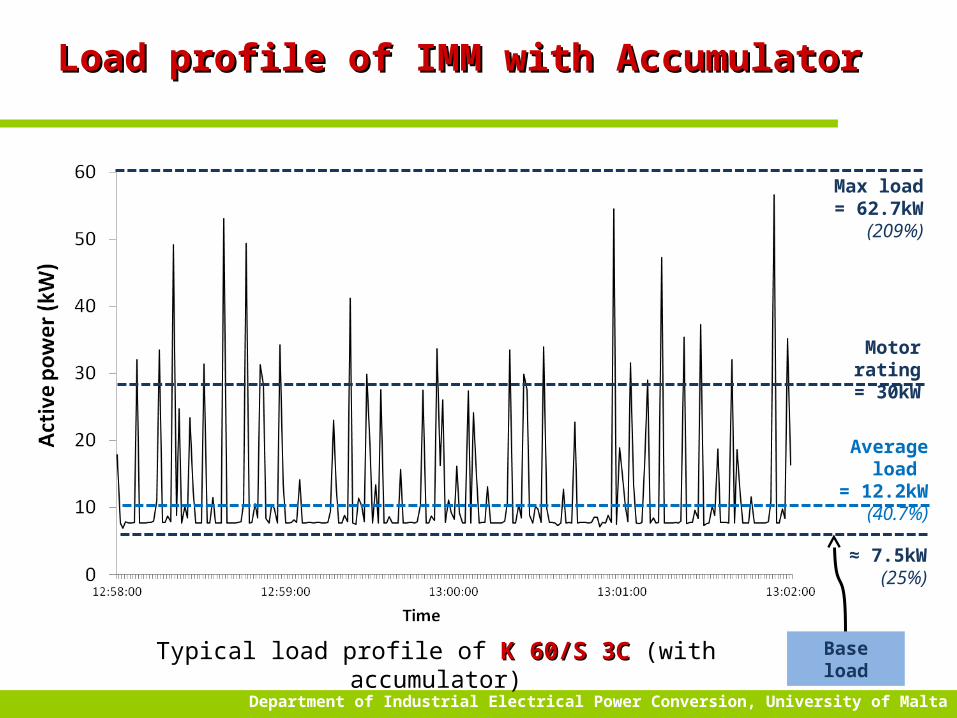
Load profile of Load profile of IMM with AccumulatorIMM with Accumulator
Base load
≈ 7.5kW (25%)
Motor rating= 30kW
Average load = 12.2kW
(40.7%)
Max load= 62.7kW
(209%)
Typical load profile of K 60/S 3CK 60/S 3C (with accumulator)
Department of Industrial Electrical Power Conversion, University of Malta
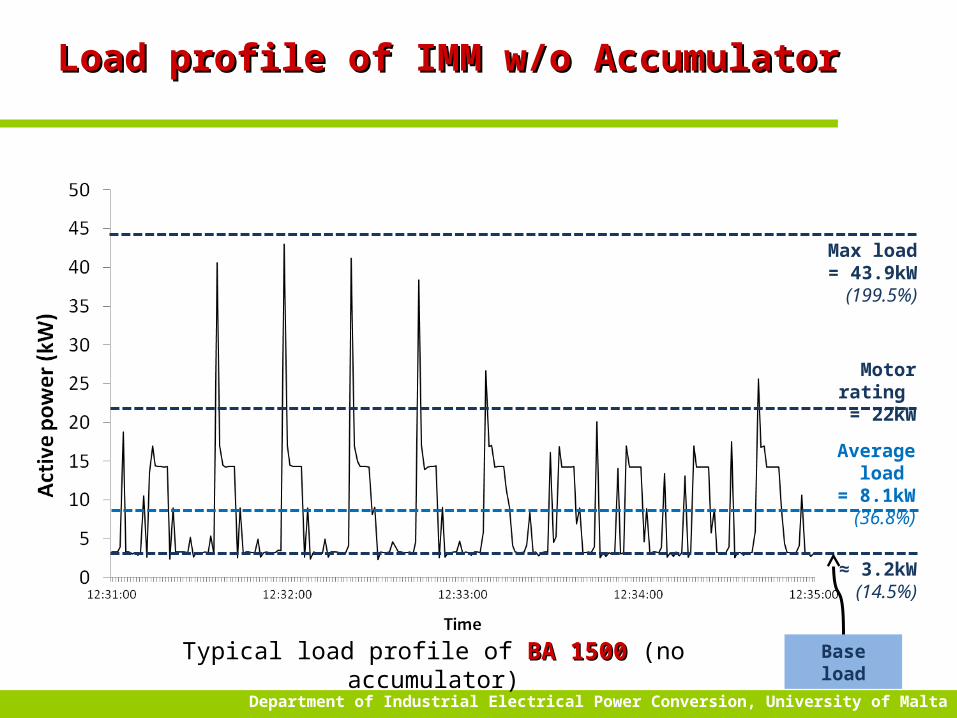
Load profile of Load profile of IMM w/o AccumulatorIMM w/o Accumulator
Base load
≈ 3.2kW(14.5%)
Motor rating = 22kW
Average load = 8.1kW (36.8%)
Typical load profile of BA 1500BA 1500 (no accumulator)
Max load= 43.9kW(199.5%)
Department of Industrial Electrical Power Conversion, University of Malta
Analysis of InjeAnalysis of Injecction Mould Machinestion Mould Machines
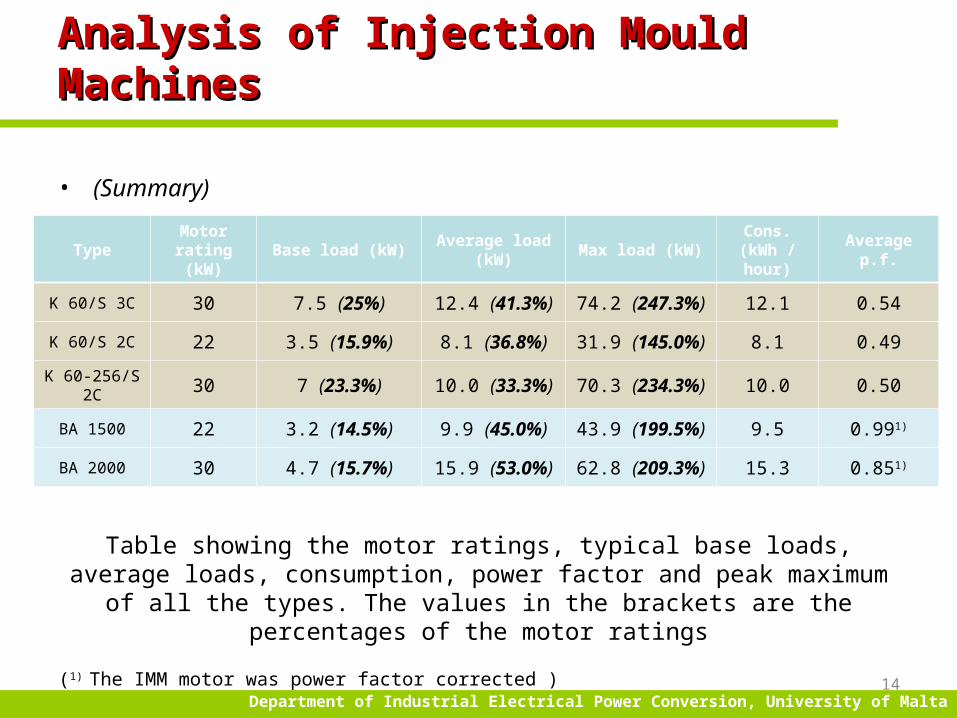
• (Summary)
TypeMotor
rating (kW)Base load (kW)
Average load (kW)
Max load (kW)Cons. (kWh / hour)
Average p.f.
K 60/S 3C 30 7.5 (25%) 12.4 (41.3%) 74.2 (247.3%) 12.1 0.54
K 60/S 2C 22 3.5 (15.9%) 8.1 (36.8%) 31.9 (145.0%) 8.1 0.49
K 60-256/S 2C 30 7 (23.3%) 10.0 (33.3%) 70.3 (234.3%) 10.0 0.50
BA 1500 22 3.2 (14.5%) 9.9 (45.0%) 43.9 (199.5%) 9.5 0.991)
BA 2000 30 4.7 (15.7%) 15.9 (53.0%) 62.8 (209.3%) 15.3 0.851)
14
Table showing the motor ratings, typical base loads, average loads, consumption, power factor and peak maximum of all the types. The values in the brackets are the
percentages of the motor ratings
(1) The IMM motor was power factor corrected )

Department of Industrial Electrical Power Conversion, University of Malta
AnalysisAnalysis –– K 60/S 3CK 60/S 3C
Mot
or ra
ting
= 30
kW
26.3%
Mainly due to base load
Electric’s motor percentage time vs the power level

Department of Industrial Electrical Power Conversion, University of Malta
AnalysisAnalysis – K 60/S 3C– K 60/S 3C
16
Mot
or ra
ting
= 30
kW
46.1% Mainly due to base load
Energy consumption vs the power level

Department of Industrial Electrical Power Conversion, University of Malta
Analysis Analysis – BA 1500– BA 1500
Mot
or ra
ting
= 22
kW
14.7% 63.7%
Mainly due to base load
Mainly due to holding pressure
Electric’s motor percentage time vs the power level

Department of Industrial Electrical Power Conversion, University of Malta
Analysis Analysis – BA – BA 15150000
Mot
or ra
ting
= 22
kW
22%
41%
Mainly due to base load
Mainly due to holding pressure
Energy consumption vs the power level

Department of Industrial Electrical Power Conversion, University of Malta
Analysis – Main MixerAnalysis – Main Mixer
Motor at low load = 4.2kW (14%)
Motor rating= 30kW
Motor on load= 18.5kW (61.7%)
Average load= 14.2kW (47.3%)
Mot
or
ratin
g =
30kW
at low load
at high load
13.4% 60.2%
at low load at high
load
68.1%
8.0%
Mot
or
ratin
g =
30kW
Department of Industrial Electrical Power Conversion, University of Malta
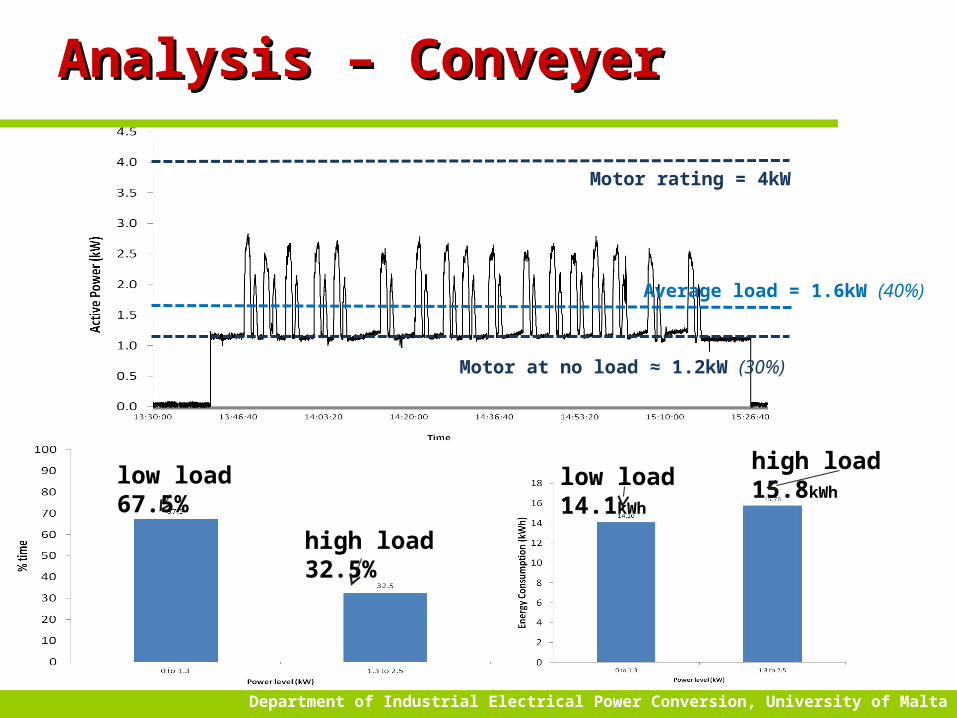
Analysis – ConveyerAnalysis – Conveyer
Motor rating = 4kW
Motor at no load ≈ 1.2kW (30%)
Average load = 1.6kW (40%)
low load 67.5%
high load 32.5%
low load 14.1kWhhigh load 15.8kWh
Department of Industrial Electrical Power Conversion, University of Malta
Simulated and Experimental Simulated and Experimental determination of Energy Savingsdetermination of Energy Savings
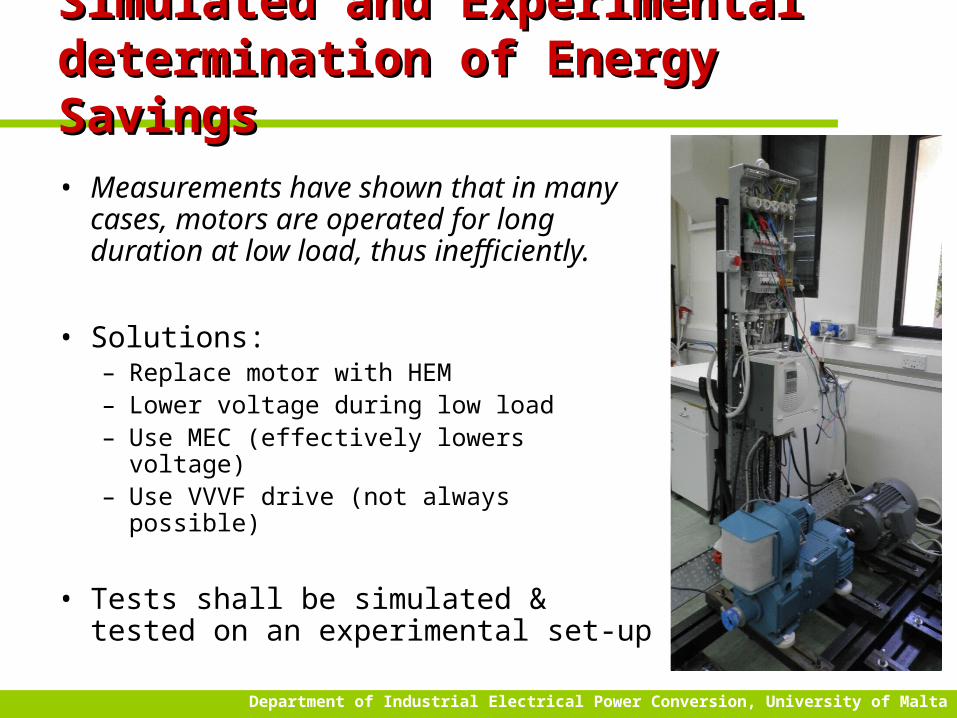
• Measurements have shown that in many cases, motors are operated for long duration at low load, thus inefficiently.
• Solutions:– Replace motor with HEM– Lower voltage during low load– Use MEC (effectively lowers voltage)– Use VVVF drive (not always possible)
• Tests shall be simulated & tested on an experimental set-up
Department of Industrial Electrical Power Conversion, University of Malta
Simulation of Low Load with Simulation of Low Load with decrease in Voltagedecrease in Voltage
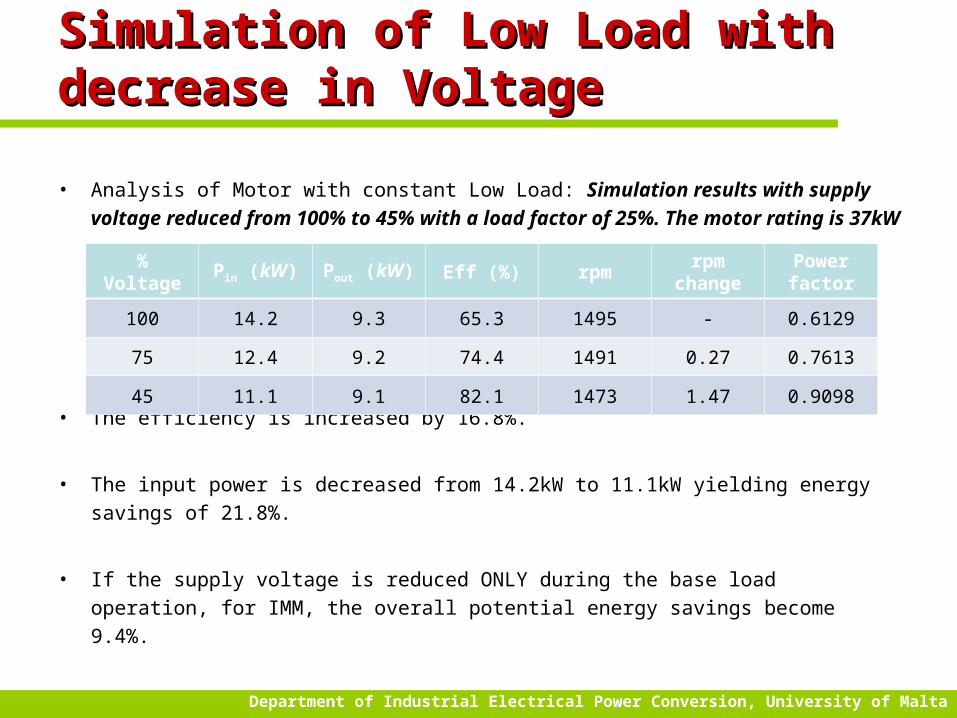
• Analysis of Motor with constant Low Load: Simulation results with supply voltage
reduced from 100% to 45% with a load factor of 25%. The motor rating is 37kW
• The efficiency is increased by 16.8%.
• The input power is decreased from 14.2kW to 11.1kW yielding energy savings of
21.8%.
• If the supply voltage is reduced ONLY during the base load operation, for IMM, the
overall potential energy savings become 9.4%.
% Voltage Pin (kW) Pout (kW) Eff (%) rpmrpm
changePower factor
100 14.2 9.3 65.3 1495 - 0.6129
75 12.4 9.2 74.4 1491 0.27 0.7613
45 11.1 9.1 82.1 1473 1.47 0.9098

Department of Industrial Electrical Power Conversion, University of Malta
Analysis of Lower Voltage Concept Analysis of Lower Voltage Concept to Motor Readingsto Motor Readings
Machine Load factor (%)Base load only
energy savings (%)Overall potential
energy savings (%)
K 60/S 3C 25 20.7 8.8
K 60/S 2C 16 30.0 8.1
K 60-256/S 2C 25 20.7 11.7
BA 1500 15 31.1 5.3
BA 2000 16 30.0 3.5
Machine Load factor (%)Low load only
energy savings (%)Overall potential
energy savings (%)
Elevator 16 29.0 12.1
Cuber 83 - 3.6
Main mixer14 34.8
7.562 7.0
Conveyer 30 15.8 7.5

Department of Industrial Electrical Power Conversion, University of Malta
Transient Response of MEC (Lab Rig)Transient Response of MEC (Lab Rig)
• One of the main challenges is due to the relatively short times at which the motor
operates at the base loads.
– occurences of operation at base load are a lot however the timings are very critical.
– MEC needs to react rapidly to regulate the supply voltage on the motor according to
operation.
0 1 2 3 4 5 6 7 8 9 100
100
200
300
400
500
600
Time (sec)
Input pow
er
(W)
The variation in active power with MEC (OFF to ON)
MEC switched ON

Department of Industrial Electrical Power Conversion, University of Malta
Further WorkFurther Work
• Emulation of Actual Load Profiles on Laboratory Test Rig.
• Verification of Energy Saving Mechanisms (HEM and MEC) on industrial premises
• Development of Motor Energy Saving Tool (MEST).– Software tool to guide organisations’ personnel
(possibly non-technical) to improve efficiency in motor driven systems

Department of Industrial Electrical Power ConversionFaculty of Engineering – University of Malta
Increasing Energy Efficiency Increasing Energy Efficiency during Reliability Testing of during Reliability Testing of
EquipmentEquipmentthrough Grid‐connected Load through Grid‐connected Load
UnitsUnitsKey Experts: Dr. Maurice Apap
Co-Supervisors: Prof. C. Spiteri Staines & Prof. J. Cilia
Researchers: Mr. Francarl Galea
Industrial Partners : Abertax
Delta (Malta)

Department of Industrial Electrical Power Conversion, University of Malta
IntroductionIntroduction
• Manufacturing Cycle
• Testing of each product must take place before reaching the market and the
customer.
• Testing of certain products leads to high energy consumption.
• power supply full load burn-in test usually last for a minimum of 24
hours. (can exceed 400,000kWhr yearly.)
• batteries testing is carried out by cycling.

Department of Industrial Electrical Power Conversion, University of Malta
AimsAims
• This project is targeted at increasing the efficiency during testing of
manufactured electrical equipment: namely, DC Power Supplies and
Battery Banks.
• Currently Electrical Energy consumed
during testing is ‘wasted’ (as heat) in
Active Loads.
• The aim of this project is to REDIRECT
the Electrical Energy used during testing
back to the Electrical Supply.
• 70% energy saving is predicted.

Department of Industrial Electrical Power Conversion, University of Malta
System DescriptionSystem Description
• The Regenerative Active Load
shall be made up of:
• DC-DC Converter Design.
• Grid Connected Inverter.
• The Regenerative Active Load
was designed to operate over a
wide input range of Voltages and
Currents to support different types
of DC Supply Equipment.
Input Voltage 30 – 300V
Max Input Current 25A
Max Input Power 1000W
Output Voltage 200V
Max Output Current <5A
Max Output Power <1000W
Switching Freq. 75kHz
DC/DC Converter Specs
DUT
H.F.DC to DCConverter
MainsSupply
Grid Connected
Inverter

Department of Industrial Electrical Power Conversion, University of Malta
DC/DC Converter TopologyDC/DC Converter Topology
• Out of many topologies studied, the isolated Ćuk topology was selected on the following criteria:
• Low input and output current ripples• can ‘step up’ & ‘step down’ the input voltage• Bipolar current flowing into the transformer (full utilisation)• Saturation of the transformer is not possible• Total isolation of input from output• Transformer’s turns’ ratio can be used to set duty cycle range.
D
DNVV ino
1
Department of Industrial Electrical Power Conversion, University of Malta
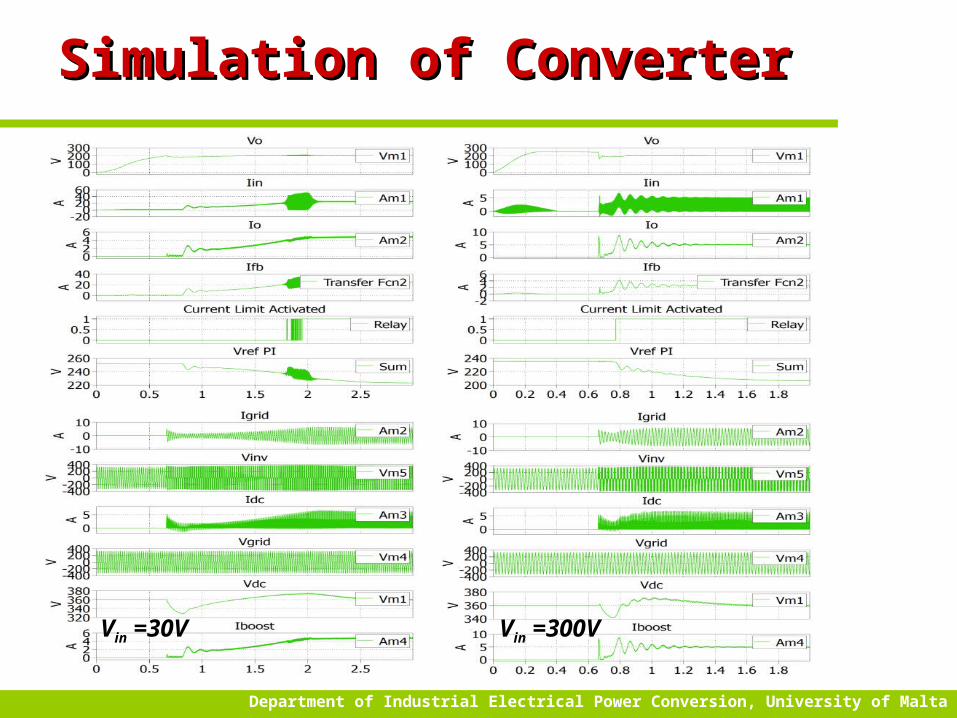
Simulation of ConverterSimulation of Converter
Vin =30V Vin =300V

Department of Industrial Electrical Power Conversion, University of Malta
Converter Components Design Converter Components Design
Magnetic Components
Gate Drivers
Power Semiconductors
Analogue Control CircuitSnubbers
ProtectionCircuit

Department of Industrial Electrical Power Conversion, University of Malta
System TestingSystem Testing
The built DC-DC converter was tested and the following issues were checked:
• Components were monitored for overheating
• Monitoring of voltage overshoots during switching transients (to verify
operation within the maximum device ratings).
• Verification that current and voltage ripples were within design limits
• Operation over expected RANGE of output voltage and output current
for the designed input voltage range
• Efficiency was measured for various operating conditions

Department of Industrial Electrical Power Conversion, University of Malta
Regeneration of Electrical EnergyRegeneration of Electrical Energy
• For REDIRECTION of testing
energy to the Mains supply:
• The DC-DC converter was
interfaced to a standard off-the-
shelf Grid-connected Inverter
• The DUT was tested for various
operating points (input voltage and
power) and the energy used was
transferred via the DC-DC, into the
grid-connected inverter, and back
to the mains supply.
DUT
H.F.DC to DCConverter
MainsSupply
Grid Connected
Inverter

Department of Industrial Electrical Power Conversion, University of Malta
Results - Measurement of EfficiencyResults - Measurement of Efficiency
35

Department of Industrial Electrical Power Conversion, University of Malta
Results – Burn-In Test (800W, 200V Results – Burn-In Test (800W, 200V Power Supply)Power Supply)
• Experimental tests show that 78% less energy was used to burn-in test SM400AR-4
(4.9kWh instead of 20kWh in 24 hours).
36
• The overall Active Load
system operates at an
efficiency of 85%.
• Efficiencies of the DC-
DC converter & grid-
inverter were 95% and
89% respectively.
Department of Industrial Electrical Power Conversion, University of Malta
ConclusionsConclusions
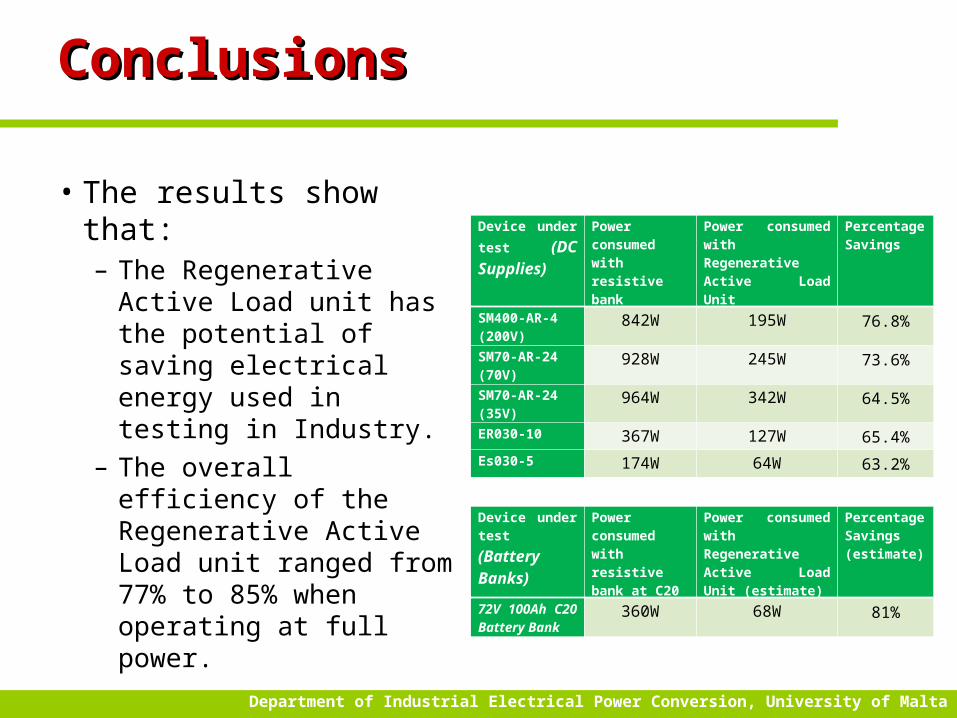
• The results show that:– The Regenerative
Active Load unit has the potential of saving electrical energy used in testing in Industry.
– The overall efficiency of the Regenerative Active Load unit ranged from 77% to 85% when operating at full power.
Device under
test (DC Supplies)
Power consumed with resistive bank
Power consumed with Regenerative Active Load Unit
Percentage Savings
SM400-AR-4 (200V)
842W 195W 76.8%
SM70-AR-24 (70V)
928W 245W 73.6%
SM70-AR-24 (35V)
964W 342W 64.5%
ER030-10 367W 127W 65.4%
Es030-5 174W 64W 63.2%
Device under
test (Battery Banks)
Power consumed with resistive bank at C20
Power consumed with Regenerative Active Load Unit (estimate)
Percentage Savings (estimate)
72V 100Ah C20 Battery Bank
360W 68W 81%

Department of Industrial Electrical Power Conversion, University of Malta
Further WorkFurther Work
Input Voltage 30V – 600V
Max Input Current 50A
Max Input Power 2000W
Output Voltage 400V
• To operate system with a wider range of electrical DC supply
equipment, modular converters will have to be employed.
• This shall require that modular converters be connected in
parallel or in series depending on the input voltage requirements.
• Simulation showed successful
parallel and series operation.
• A method of interleaved
switching will be applied to
obtain a further reduction in the
current ripple.

Department of Industrial Electrical Power Conversion, University of Malta
Thank you for your attentionThank you for your attention
MALTA


