
Copyright © 2000, A.W. Etchells, R.K.Grenville & R.D. LaRocheAll rights reserved.
ENGG 199 Reacting FlowsSpring 2006
Lecture 3Mixing and Chemical Reactions

ENGG 199 Lecture 3 Slide 2Copyright © 2000, A.W. Etchells, R.K.Grenville & R.D. LaRoche All rights reserved
Review of Ideal Chemical Reactors
Reference: Chemical Reaction Engineering by O. LevenspielIdeal Batch Reactor
Ideal Plug Flow Reactor
Ideal Continuous Stirred Tank Reactor
Ideal Semi-Batch Reactor
Consider component A to be limiting reactant, we can define concentration of A, CA, in terms of conversion, XA
AAA
A
AAAAAA
dXCdC
inresultsatingdifferenti
N
NNXwhereXCC
0
0
00 1

ENGG 199 Lecture 3 Slide 3Copyright © 2000, A.W. Etchells, R.K.Grenville & R.D. LaRoche All rights reserved
Ideal Batch Reactor
AssumptionReactor contents uniformly mixed
AX
A
AA
t
AA
AAAA
AA
Vr
dXNdtt
egratingintandgrearrangindt
dXN
dt
XNd
dt
dNVr
dt
dNVr
onaccumulatireactionbyncedisappearaoutputinput
000
00 1
00
A
A
A C
CA
AX
A
AA
A
AA
A
AA
r
dC
r
dXCt
C
dCdXand
C
CX
systemsdensityttanconsFor
000
00
1liquidofvolumeV
AofconversionX
AofmolesN
liquidofvolume
AofmolesC
A
A
A
ENGG 199 Lecture 3 Slide 4Copyright © 2000, A.W. Etchells, R.K.Grenville & R.D. LaRoche All rights reserved
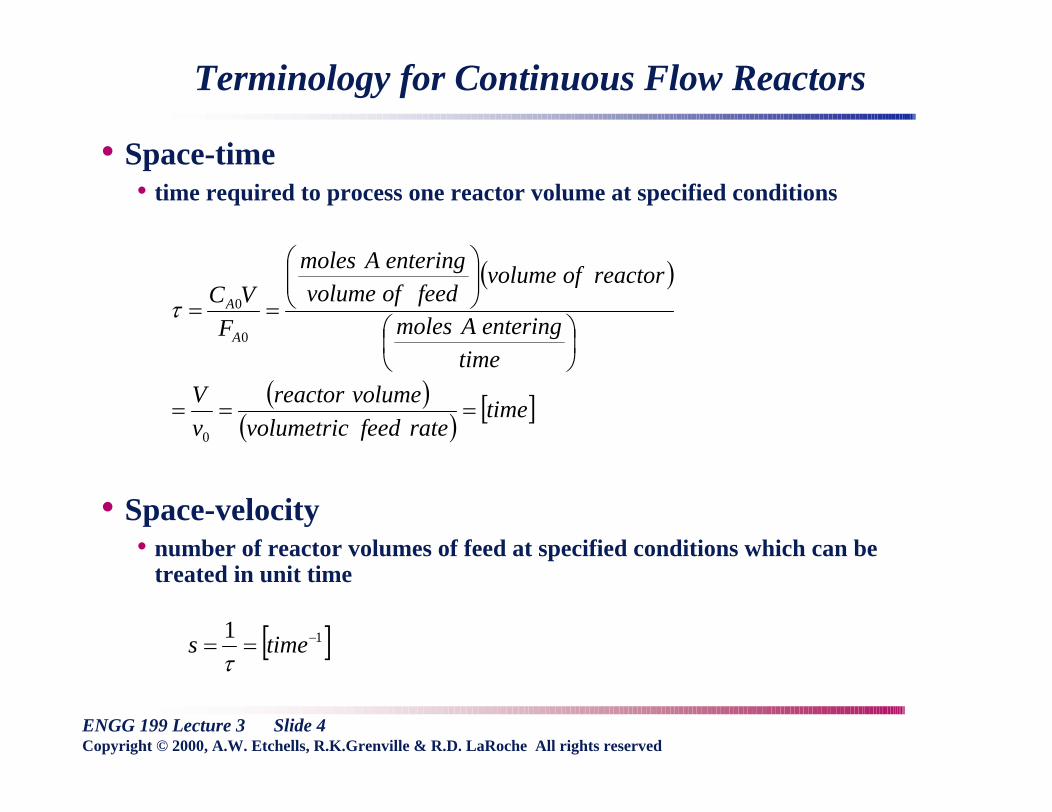
Terminology for Continuous Flow Reactors
Space-timetime required to process one reactor volume at specified conditions
Space-velocitynumber of reactor volumes of feed at specified conditions which can be treated in unit time
timeratefeedvolumetric
volumereactor
v
V
time
enteringAmoles
reactorofvolumefeedofvolume
enteringAmoles
F
VC
A
A
0
0
0
11times
ENGG 199 Lecture 3 Slide 5Copyright © 2000, A.W. Etchells, R.K.Grenville & R.D. LaRoche All rights reserved
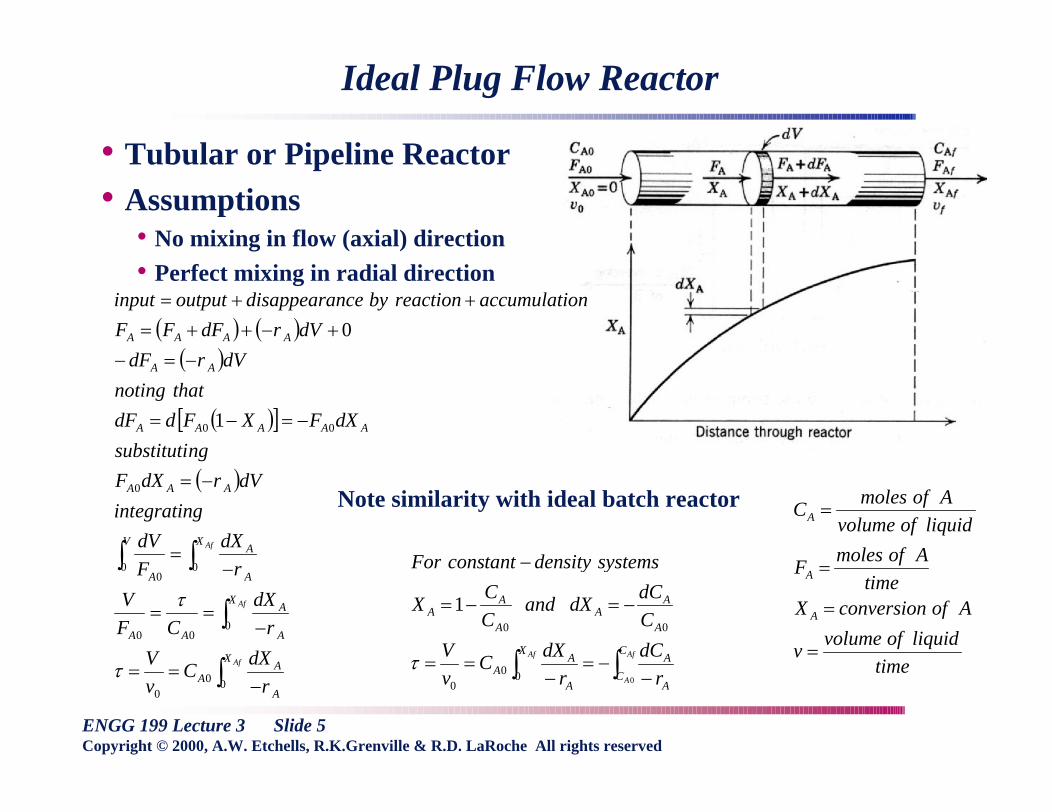
Ideal Plug Flow Reactor
Tubular or Pipeline ReactorAssumptions
No mixing in flow (axial) direction
Perfect mixing in radial direction
Af
Af
Af
X
A
AA
X
A
A
AA
X
A
AV
A
AAA
AAAAA
AA
AAAA
r
dXC
v
V
r
dX
CF
V
r
dX
F
dV
egratingint
dVrdXF
ngsubstituti
dXFXFddF
thatnoting
dVrdF
dVrdFFF
onaccumulatireactionbyncedisappearaoutputinput
000
000
000
0
00 1
0
time
liquidofvolumev
AofconversionXtime
AofmolesF
liquidofvolume
AofmolesC
A
A
A
Af
A
Af C
CA
AX
A
AA
A
AA
A
AA
r
dC
r
dXC
v
V
C
dCdXand
C
CX
systemsdensityttanconsFor
0000
00
1
Note similarity with ideal batch reactor

ENGG 199 Lecture 3 Slide 6Copyright © 2000, A.W. Etchells, R.K.Grenville & R.D. LaRoche All rights reserved
Ideal Continuous Stirred Tank Reactor (CSTR)
CSTR, C-Star, Back-mixed, Mixed-Flow ReactorAssumptions
Reactor contents uniformly mixed
Exit conditions same as reactor conditions
Step change from inlet to outlet conditions
A
AA
A
A
A
A
AA
AAAA
AAA
r
XC
v
V
F
VC
r
X
CF
V
VrXFF
VrFF
naccumlatioreactionbyncedisappearaoutputinput
0
00
0
00
00
0
1
0
A
AA
A
AA
A
AA
r
CC
r
XC
v
V
C
CX
systemsdensityttanconsFor
00
0
0
1

ENGG 199 Lecture 3 Slide 7Copyright © 2000, A.W. Etchells, R.K.Grenville & R.D. LaRoche All rights reserved
Semi-Batch Reactor
Commonly used for specialty chemicalsReactor loaded with one reactant (component A)Add other reactant over time (component B)Called starved feed by chemists
CB is now a more complex function of time
t C
BiB
B
BB
Bi
Bi
Bi
BBBi
B
Cr
dCdtt
dt
VdCVr
VC
F
VCthatnote
systemsdensityttanconsdt
VdCVrF
0 0
)(0
A
A
C
CA
At
AA
r
dCdtt
systemsdensityttanconsdt
VdCVr
onaccumulatireactionbyncedisappearaoutputinput
00
)(00
ENGG 199 Lecture 3 Slide 8Copyright © 2000, A.W. Etchells, R.K.Grenville & R.D. LaRoche All rights reserved
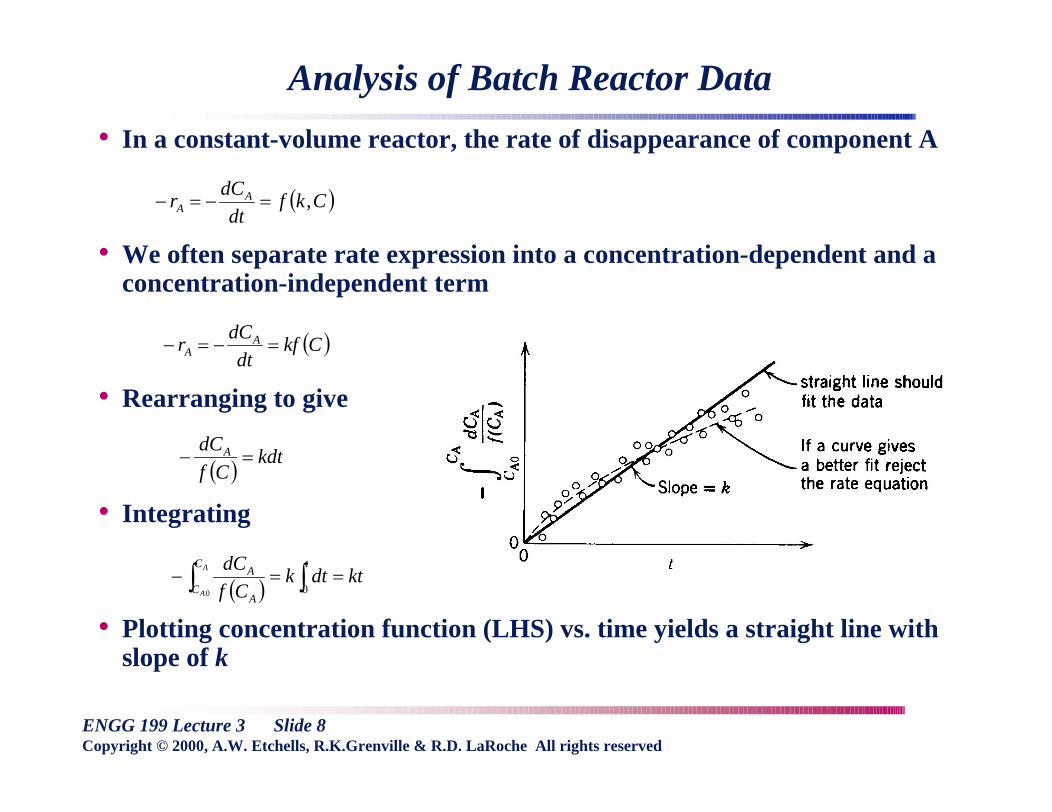
Analysis of Batch Reactor Data
In a constant-volume reactor, the rate of disappearance of component A
We often separate rate expression into a concentration-dependent and a concentration-independent term
Rearranging to give
Integrating
Plotting concentration function (LHS) vs. time yields a straight line with slope of k
Ckfdt
dCr A
A ,
Ckfdt
dCr A
A
kdtCf
dCA
tC
CA
A ktdtkCf
dCA
A 00
ENGG 199 Lecture 3 Slide 9Copyright © 2000, A.W. Etchells, R.K.Grenville & R.D. LaRoche All rights reserved
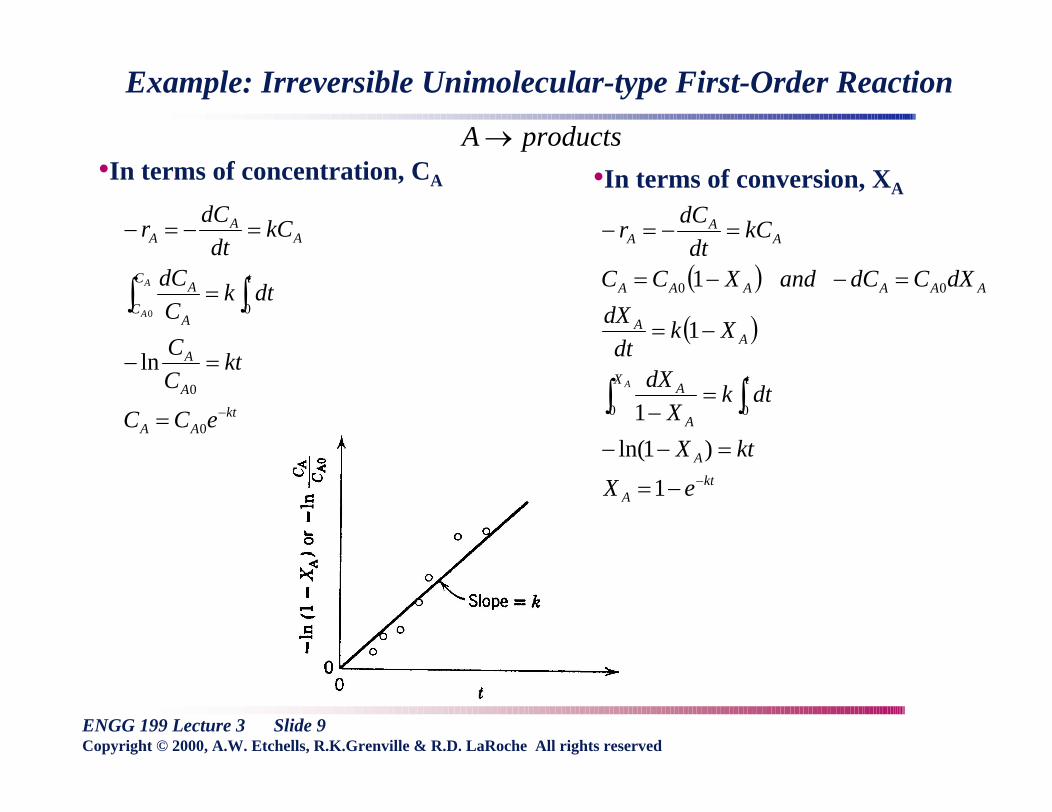
Example: Irreversible Unimolecular-type First-Order Reaction
productsA
ktAA
A
A
tC
CA
A
AA
A
eCC
ktC
C
dtkC
dC
kCdt
dCr
A
A
0
0
0
ln
0
ktA
A
tX
A
A
AA
AAAAAA
AA
A
eX
ktX
dtkX
dX
Xkdt
dX
dXCdCandXCC
kCdt
dCr
A
1
)1ln(
1
1
1
00
00
In terms of concentration, CA In terms of conversion, XA

ENGG 199 Lecture 3 Slide 10Copyright © 2000, A.W. Etchells, R.K.Grenville & R.D. LaRoche All rights reserved
Recap of Ideal Reactor Types
Ideal Batch ReactorReactor contents uniformly mixed
Ideal Plug Flow ReactorNo mixing in flow (axial) direction
Perfect mixing in radial direction
Ideal Continuous Stirred Tank ReactorReactor contents uniformly mixed
Exit conditions same as reactor conditions
Step change from inlet to outlet conditions

ENGG 199 Lecture 3 Slide 11Copyright © 2000, A.W. Etchells, R.K.Grenville & R.D. LaRoche All rights reserved
Assumptions for Reactor Design
Assume that vessel contents are perfectly mixed .
If reaction is slow relative to rate of mixing this is true:Vessel will be homogeneous before reaction takes off.
Reaction rate will be determined by average composition.
Even in semi-batch or continuous reactors.
What if reaction is fast compared to mixing rate?
No problem if reaction is non-competitive:
No undesirable by-products.
D
C
B
A

ENGG 199 Lecture 3 Slide 12Copyright © 2000, A.W. Etchells, R.K.Grenville & R.D. LaRoche All rights reserved
Competitive Reactions
Many valuable chemical reactions are competitive:
Example:Want to make mononitro toluene.
Dinitro toluene is a possible by-product.
So is trinitro toluene (or TNT)!!
If reaction rate is faster than rate of mixing:Concentration gradients determine selectivity (yield of product and by-products).
High concentration of B at feed point.
Reaction is over within a few cm of feed point.
W
B
P
P
B
A
W
C
A
P
B
A

ENGG 199 Lecture 3 Slide 13Copyright © 2000, A.W. Etchells, R.K.Grenville & R.D. LaRoche All rights reserved
Mixing on the Micro-scale
A + B
P
P + B
W
Well mixed on the micro-scale:
Poorly mixed on the micro-scale:
ENGG 199 Lecture 3 Slide 14Copyright © 2000, A.W. Etchells, R.K.Grenville & R.D. LaRoche All rights reserved
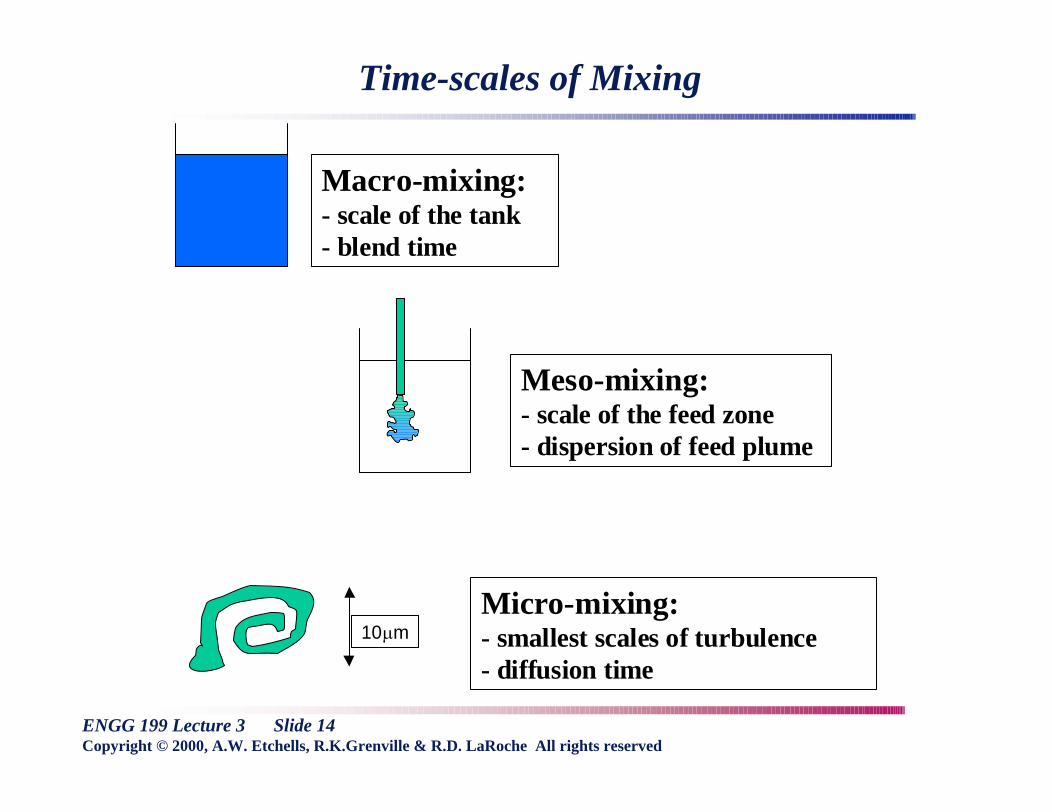
Time-scales of Mixing
Macro-mixing:- scale of the tank- blend time
Meso-mixing:- scale of the feed zone- dispersion of feed plume
Micro-mixing:- smallest scales of turbulence- diffusion time
10 m

ENGG 199 Lecture 3 Slide 15Copyright © 2000, A.W. Etchells, R.K.Grenville & R.D. LaRoche All rights reserved
Macro-Mixing
Macro-mixing Time:Time for vessel contents to become homogeneous after addition of tracer .
Important for design of CSTR s - Ratio of Blend to Residence Time and validity of Perfect Back-Mixing assumption.
Correlation for prediction of Blend Time:
Important time-scale for slow reactions (tR > 10 secs):Want blend time to be shorter than reaction time.
By how much?
2
3/195
40.5D
T
NPo

ENGG 199 Lecture 3 Slide 16Copyright © 2000, A.W. Etchells, R.K.Grenville & R.D. LaRoche All rights reserved
Micro-Mixing
Micro-mixing Time (Bourne et al.):Time for turbulent eddy to shrink from 12 lK to lK.
Called Engulfment Time (eddy containing A engulfs eddy of B).
As engulfment occurs (shrinking in x and y directions), eddy deforms (stretches in z direction).
Shrinkage in x and y directions increases concentration gradients increasing rate of diffusion of A and B.
Hence: Eddy-Deformation-Diffusion (EDD) Model.
Engulfment is rate limiting step:
2/12/1
31.172ln
121E
tE

ENGG 199 Lecture 3 Slide 17Copyright © 2000, A.W. Etchells, R.K.Grenville & R.D. LaRoche All rights reserved
Meso-Mixing
Meso-mixing Time (Bourne et al.):Semi-batch or continuous reactor - adding B to A.
Time for plume of B to be dispersed in A by local turbulence.
More complicated than micro-mixing:Time is dependent on local mixing conditions and feed rate of B.
Two definitions:
3/13/12
3/43/122
U
qLt
DU
q
DU
qt BC
CB
T
BD

ENGG 199 Lecture 3 Slide 18Copyright © 2000, A.W. Etchells, R.K.Grenville & R.D. LaRoche All rights reserved
Meso-Mixing
Turbulent diffusivity:
Velocity of bulk flow past feed point:
Meso-mixing includes dilution effect (want high Q):
What is more important; generation of turbulence or flow?
3/43/13/1)( DllluDT
TIPQQ
SWEPT
UND
NDN
A
QU 4
42
3
Q
q
U
qt BB
D

ENGG 199 Lecture 3 Slide 19Copyright © 2000, A.W. Etchells, R.K.Grenville & R.D. LaRoche All rights reserved
Meso-Mixing/ Micromixing
Important for anti-solvent addition crystallization processMeso-mixing Time (Bourne et al.):
Semi-batch or continuous reactor - adding B to ATime for plume of B to be dispersed in A by local turbulence.
Time is dependent on local mixing conditions and feed rate of B
Important to identify the rate limiting step for successful scale-up
Micromixing refers to the smallest scales of mixing that can affect particle size
Multi-environment Mixing Models incorporating models such as IEM (Interaction by exchange with the mean)Improved prediction of product selectivity, crystal size and associated properties

ENGG 199 Lecture 3 Slide 20Copyright © 2000, A.W. Etchells, R.K.Grenville & R.D. LaRoche All rights reserved
Meso-Mixing
More complicated than micro-mixing:Time is dependent on local mixing (turbulence and flow) conditions and feed rate of B
Keep Damkohler number constant on scale-up
Corrsin meso-mixing time
)( raten dissipatio turbulent theis
)(point feed past theity bulk veloc theis
)( rate feedreactant theis
where
2
32
3
3/1
sm
smU
smB
q
U
qt BC
Reference: G.K. Patterson, E.L. Paul, S.M. Kresta, A.W. Etchells III, Mixing and Chemical Reactions, Chapter 13 in the Handbook of Industrial Mixing, edited by E.L. Paul, V.A. Atimo-Obeng, S.M. Kresta, John Wiley & Sons, 2003
mixBRE tCkDa 0
ENGG 199 Lecture 3 Slide 21Copyright © 2000, A.W. Etchells, R.K.Grenville & R.D. LaRoche All rights reserved
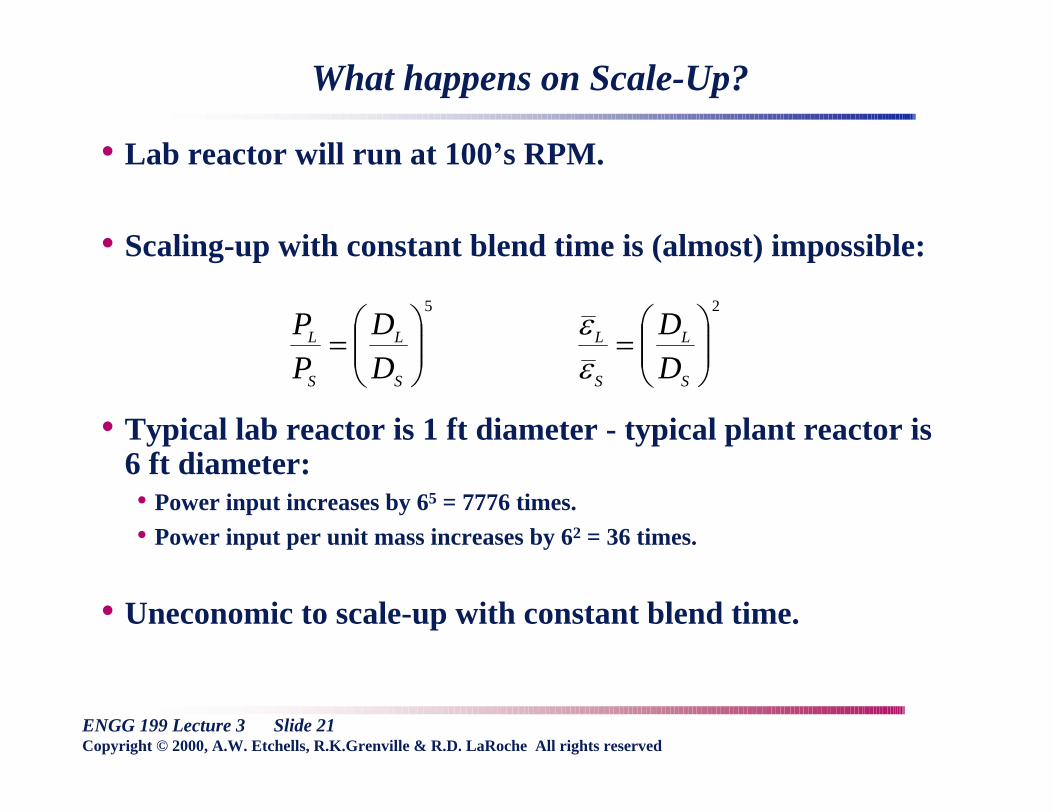
What happens on Scale-Up?
Lab reactor will run at 100 s RPM.
Scaling-up with constant blend time is (almost) impossible:
Typical lab reactor is 1 ft diameter - typical plant reactor is 6 ft diameter:
Power input increases by 65 = 7776 times.
Power input per unit mass increases by 62 = 36 times.
Uneconomic to scale-up with constant blend time.
25
S
L
S
L
S
L
S
L
D
D
D
D
P
P

ENGG 199 Lecture 3 Slide 22Copyright © 2000, A.W. Etchells, R.K.Grenville & R.D. LaRoche All rights reserved
Scaling-Up Fast Chemical Reactions
For competitive reactions ONLY!
Scale-up at constant power input per unit mass:Blend time will get longer.
Outcome of fast chemical reaction is determined by local mixing conditions at feed point:
Determined by the local mixing rate.
The local energy dissipation rate.
Conditions in bulk of vessel are unimportant.
What factors affect the design of the mixing system (impeller and feed method become important) for a fast, competitive chemical reaction?

ENGG 199 Lecture 3 Slide 23Copyright © 2000, A.W. Etchells, R.K.Grenville & R.D. LaRoche All rights reserved
Damkohler Number
Damkohler Number is ratio of reaction rate to mixing rate.
Since reaction rate is fast all B will be consumed close to feed point.
Reaction rate will be determined by concentration at which B is fed to reaction (NOT vessel averaged concentration).
Increase mixing rate, smaller Damkohler No.
Controlling mechanism may change from micro- to meso-mixing.
DBRDEBRE tCkDatCkDa 00
:or

ENGG 199 Lecture 3 Slide 24Copyright © 2000, A.W. Etchells, R.K.Grenville & R.D. LaRoche All rights reserved
Typical plot of Waste vs. Damkohler No.
ENGG 199 Lecture 3 Slide 25Copyright © 2000, A.W. Etchells, R.K.Grenville & R.D. LaRoche All rights reserved
Effect of Feed Location
Feed at location of highest mixing and energy dissipation rate:
Into the impeller zone.
Effect has been well characterized and reported.
Care must be taken in the mechanical design of the pipe:Flow induced vibration.
Fatigue failures.
What happens if feed of B shuts off?Will reactor contents migrate into feed pipe?
May have to feed above liquid surface for safety reasons.

ENGG 199 Lecture 3 Slide 26Copyright © 2000, A.W. Etchells, R.K.Grenville & R.D. LaRoche All rights reserved
Selectivity versus Feed Location
Location B makes6 - 8 x more waste thanLocations A or D.

ENGG 199 Lecture 3 Slide 27Copyright © 2000, A.W. Etchells, R.K.Grenville & R.D. LaRoche All rights reserved
Effect of Impeller Type
So far, have compared impellers in terms of vessel average power input per unit mass - affects blend time.
When compared at the same average PPM, some impellers have higher PPM in the impeller zone than others.
Define ratio of maximum energy dissipation rate (or PPM) to vessel average, K:
Measure K for various impeller types and geometries.
KMAX

ENGG 199 Lecture 3 Slide 28Copyright © 2000, A.W. Etchells, R.K.Grenville & R.D. LaRoche All rights reserved
Results from Zhou & Kresta (U of Alberta)
For T / 3 impellers @ T / 3 off-bottom clearance with standard baffles:Pitched blade turbine: K = 38.3
Hydrofoil: K = 26.5
Rushton turbine: K = 47.7
For T / 2 impellers @ T / 2 off-bottom clearance with standard baffles:Pitched blade turbine: K = 18.4
Hydrofoil: K = 19.2
Rushton turbine: K = 20.7
For T / 4 impellers @ T / 2 off-bottom clearance with standard baffles:Pitched blade turbine: K = 79.0
Hydrofoil: K = 46.3
Rushton turbine: K = 90.6

ENGG 199 Lecture 3 Slide 29Copyright © 2000, A.W. Etchells, R.K.Grenville & R.D. LaRoche All rights reserved
Conclusion
An impeller which is considered efficient for blending will have a large diameter relative to the vessel.
An impeller which is considered efficient for micro-mixing applications will have a small diameter.
Need to define and understand mixing requirements!!
Need to consider other aspects of reactor design in determining best impeller type:
May need several mixing operations (blending and micro-mixing).
Especially Heat Transfer.

ENGG 199 Lecture 3 Slide 30Copyright © 2000, A.W. Etchells, R.K.Grenville & R.D. LaRoche All rights reserved
Effect of Feed Rate
At low feed rates, micro-mixing controls:Engulfment of small-scale eddies.
Feed jet is dispersed quickly.
As feed rate, qB, increases mechanism changes:Dispersion of feed jet takes longer than engulfment.
Change in mechanism.
A critical feed time (or feed rate) can be identified:t > tCRIT Micro-mixing controls.
t < tCRIT Meso-mixing controls.

ENGG 199 Lecture 3 Slide 31Copyright © 2000, A.W. Etchells, R.K.Grenville & R.D. LaRoche All rights reserved
Selectivity versus Feed Time

ENGG 199 Lecture 3 Slide 32Copyright © 2000, A.W. Etchells, R.K.Grenville & R.D. LaRoche All rights reserved
Scale-Up Problem
Operation of lab reactors:High power input per unit mass.
Short blend time.
Slow feed rate.
Operation of plant reactors:Can operate at same power input per unit mass.
Longer blend time.
Same micro-mixing time.
Feed rate determined by productivity (batches per day):Lab may be micro-mixing controlled.
Plant will probably be meso-mixing controlled.

ENGG 199 Lecture 3 Slide 33Copyright © 2000, A.W. Etchells, R.K.Grenville & R.D. LaRoche All rights reserved
Best Place to Operate
The most cost effective operation will be at the knee of the curve:
At the boundary between meso- and micro-mixing control.
Increasing power input does not increase yield:Yield is determined by kinetics to the right of the knee.
Slow down feed rate (increase feed time):Not acceptable.
Feed rate determined by productivity requirements.
qB is local feed rate:If total feed rate increases - consider multiple feed points.

ENGG 199 Lecture 3 Slide 34Copyright © 2000, A.W. Etchells, R.K.Grenville & R.D. LaRoche All rights reserved
In Industry .
Often do not know kinetics.
Sometimes do not even know mechanism.
Can make estimates of mixing rates.
If speed of chemistry does not change (constant temperature and concentrations):
Constant Mixing Rate = Constant Da
Scale-up keeping appropriate mixing rate constant.


