
ENGINEERING SYMBOLOGY, PRINTS, AND DRAWINGS
Module 2
Engineering Fluid Diagrams and Prints

Module 2: Engineering Fluid Diagrams and Prints
i
TABLE OF CONTENTS
LIST OF FIGURES ......................................................................................................... ii
LIST OF TABLES .......................................................................................................... iii
REFERENCES .............................................................................................................. iv
OBJECTIVES ................................................................................................................. v
ENGINEERING FLUIDS DIAGRAMS AND PRINTS ..................................................... 1
Symbology .......................................................................................................... 2
Valve Symbols .................................................................................................... 3
Valve Actuators .................................................................................................. 4
Control Valve Designations ................................................................................ 6
Piping Systems ................................................................................................... 7
Instrumentation ................................................................................................... 8
Sensing Devices and Detectors ......................................................................... 10
Modifiers and Transmitters ................................................................................ 11
Indicators and Recorders ................................................................................... 12
Controllers ......................................................................................................... 12
Examples of Simple Instrument Loops .............................................................. 13
Components ...................................................................................................... 13
Miscellaneous P&ID Symbols ............................................................................ 15
Summary ........................................................................................................... 15
READING ENGINEERING P&IDs ................................................................................ 16
Standards and Conventions for Valve Status .................................................... 16
Summary ........................................................................................................... 17
P&ID PRINT READING EXAMPLE .............................................................................. 18
Example ............................................................................................................. 18
Summary ........................................................................................................... 22
FLUID POWER P&IDs ................................................................................................ 23
Fluid Power Diagrams and Schematics ............................................................ 23
Pumps .............................................................................................................. 23
Reservoirs ........................................................................................................ 24
Actuator ............................................................................................................ 24
Piping ............................................................................................................... 26
Valves ............................................................................................................... 27
Reading Fluid Power Diagrams ........................................................................ 30
Types of Fluid Power Diagrams ........................................................................ 33
Summary .......................................................................................................... 35

Module 2: Engineering Fluid Diagrams and Prints
ii
LIST OF FIGURES
Figure 1 Valve Symbols ................................................................................................ 3
Figure 2 Valve Actuator Symbols .................................................................................. 4
Figure 3 Remotely Controlled Valve .............................................................................. 4
Figure 4 Level Control Valve ......................................................................................... 5
Figure 5 Control Valves with Valve Positioners ............................................................. 6
Figure 6 Control Valve Designations ............................................................................. 6
Figure 7 Piping Symbols ............................................................................................... 7
Figure 8 More Piping Symbols ...................................................................................... 8
Figure 9 Detector and Sensing Device Symbols ......................................................... 10
Figure 10 Transmitters and Instruments ...................................................................... 11
Figure 11 Indicators and Recorders ............................................................................ 12
Figure 12 Controllers ................................................................................................... 12
Figure 13 Signal Conditioners ..................................................................................... 12
Figure 14 Instrumentation System Examples .............................................................. 13
Figure 15 Symbols for Major Components .................................................................. 14
Figure 16 Miscellaneous Symbols ............................................................................... 15
Figure 17 Valve Status Symbols ................................................................................. 16
Figure 18 Exercise P&ID ............................................................................................. 19
Figure 19 Fluid Power Pump and Compressor Symbols ............................................. 23
Figure 20 Fluid Power Reservoir Symbols .................................................................. 24
Figure 21 Symbols for Linear Actuators ...................................................................... 25
Figure 22 Symbols for Rotary Actuators ...................................................................... 26
Figure 23 Fluid Power Line Symbols ........................................................................... 26
Figure 24 Valve Operation .......................................................................................... 27
Figure 25 Valve Symbol Development ........................................................................ 28
Figure 26 Fluid Power Valve Symbols ......................................................................... 29
Figure 27 Simple Hydraulic Power System ................................................................. 30
Figure 28 Line Diagram of Figure 27 ........................................................................... 30
Figure 29 Typical Fluid Power Diagram ...................................................................... 31
Figure 30 Pictorial Fluid Power Diagram ..................................................................... 33
Figure 31 Cutaway Fluid Power Diagram .................................................................... 34
Figure 32 Schematic Fluid Power Diagram ................................................................. 34

Module 2: Engineering Fluid Diagrams and Prints
iii
LIST OF TABLES
Table 1 Instrument Identifiers ........................................................................................ 9

Module 2: Engineering Fluid Diagrams and Prints
iv
REFERENCES
ASME Y14.5-2009, Dimensioning and Tolerancing.
IEEE Std 315-1975 (Reaffirmed 1993), Graphic Symbols for Electrical and
Electronic Diagrams.
Gasperini, Richard E., Digital Troubleshooting, Movonics Company; Los Altos,
California, 1976.
Jensen - Helsel, Engineering Drawing and Design, 7th Ed., McGraw-Hill Book
Company, New York (August 15, 2007).
Lenk, John D., Handbook of Logic Circuits, Reston Publishing Company, Reston,
Virginia, 1972.
Wickes, William E., Logic Design with Integrated Circuits, John Wiley & Sons,
Inc, 1968.
Naval Auxiliary Machinery United States Naval Institute, Annapolis, Maryland,
1951.
TPC Training Systems, Reading Schematics and Symbols, Technical Publishing
Company, Barrington, Illinois, 1974.
Arnell, Alvin, Standard Graphical Symbols, McGraw-Hill Book Company, 1963.
George Masche, Systems Summary of a Westinghouse Pressurized Water
Reactor, Westinghouse Electric Corporation, 1971.
Smith-Zappe, Valve Selection Handbook, 5th Ed., Gulf Publishing Company,
Houston, Texas, December 2003.

Module 2: Engineering Fluid Diagrams and Prints
v
TERMINAL OBJECTIVE
1.0 Given an engineering print, READ and INTERPRET facility engineering Piping and Instrument Drawings.
ENABLING OBJECTIVES
1.1 IDENTIFY the symbols used on engineering P&IDs for the following types of
valves:
a. Globe valve g. Relief valve
b. Gate valve h. Rupture disk
c. Ball valve i. Three-way valve
d. Check valve j. Four-way valve
e. Stop check valve k. Throttle (needle) valve
f. Butterfly valve l. Pressure regulator
1.2 IDENTIFY the symbols used on engineering P&IDs for the following types of
valve operators:
a. Diaphragm valve operator
b. Motor valve operator
c. Solenoid valve operator
d. Piston (hydraulic) valve operator
e. Hand (manual) valve operator
f. Reach-rod valve operator
1.3 IDENTIFY the symbols used on engineering P&IDs for educators and ejectors.
1.4 IDENTIFY the symbols used on engineering P&IDs for the following lines:
a . Process
b . Pneumatic
c . Hydraulic
d . Inert gas
e . Instrument signal (electrical)
f . Instrument capillary
g . Electrical

Module 2: Engineering Fluid Diagrams and Prints
vi
ENABLING OBJECTIVES (cont.)
1.5 IDENTIFY the symbols used on engineering P&IDs for the following basic types
of instrumentation:
a. Differential pressure cell
b. Temperature element
c. Venturi
d. Orifice
e. Rotometer
f. Conductivity or salinity cell
g. Radiation detector
1.6 IDENTIFY the symbols used on engineering P&IDs to denote the location, either local or board mounted, of instruments, indicators, and controllers.
1.7 IDENTIFY the symbols used on engineering P&IDs for the following types of instrument signal controllers and modifiers:
a. Proportional
b. Proportional-integral
c. Proportional-integral-differential
d. Square root extractors
1.8 IDENTIFY the symbols used on engineering P&IDs for the following types of system components:
a. Centrifugal pumps
b. Positive displacement pumps
c. Heat exchangers
d. Compressors
e. Fans
f. Tanks
g. Filters/strainers

Module 2: Engineering Fluid Diagrams and Prints
vii
ENABLING OBJECTIVES (cont.)
1.9 STATE how the following valve conditions are depicted on an engineering P&ID:
a. Open valve
b. Closed valve
c. Throttled valve
d. Combination valves (3- or 4-way valve)
e. Locked-closed valve
f . Locked-open valve
g. Fail-open valve
h. Fail-closed valve
i . Fail-as-is valve
1.10 Given an engineering P&ID, IDENTIFY components and DETERMINE the
flowpath(s) for a given valve lineup.
1.11 IDENTIFY the symbols used on engineering fluid power drawings for the
following components:
a . Pump
b . Compressor
c . Reservoir
d . Actuators
e . Piping and piping junctions
f . Valves
1.12 Given a fluid power type drawing, DETERMINE the operation or resultant action
of the stated component when hydraulic pressure is applied/removed.

Module 2: Engineering Fluid Diagrams and Prints
Page 1
ENGINEERING FLUIDS DIAGRAMS AND PRINTS
To read and understand engineering fluid diagrams and prints, usually referred to as P&IDs, an individual must be familiar with the basic symbols.
EO 1.1 IDENTIFY the symbols used on engineering P&IDs for the following types
of valves:
a. Globe valve g. Relief valve
b. Gate valve h. Rupture disk
c. Ball valve i. Three-way valve
d. Check valve j. Four-way valve
e. Stop check valve k. Throttle (needle) valve
f. Butterfly valve l. Pressure regulator
EO 1.2 IDENTIFY the symbols used on engineering P&IDs for the following types
of valve operators:
a. Diaphragm valve operator
b. Motor valve operator
c. Solenoid valve operator
d. Piston (hydraulic) valve operator
e. Hand (manual) valve operator
f. Reach rod valve operator
EO 1.3 IDENTIFY the symbols used on engineering P&IDs for educators and
ejectors.
EO 1.4 IDENTIFY the symbols used on engineering P&IDs for the following lines:
a. Process e. Instrument signal (electrical)
b. Pneumatic f. Instrument capillary
c. Hydraulic g. Electrical
d. Inert gas

Module 2: Engineering Fluid Diagrams and Prints
Page 2
EO 1.5 IDENTIFY the symbols used on engineering P&IDs for the following basic
types of instrumentation:
a. Differential pressure cell e. Rotometer
b. Temperature element f. Conductivity or
c. Venturi salinity cell
d. Orifice g. Radiation detector
EO 1.6 IDENTIFY the symbols used on engineering P&IDs to denote the location,
either local or board mounted, of instruments, indicators, and controllers.
EO 1.7 IDENTIFY the symbols used on engineering P&IDs for the following types
of instrument signal modifiers:
a. Proportional
b. Proportional-integral
c. Proportional-integral-differential
d. Square root extractors
EO 1.8 IDENTIFY the symbols used on engineering P&IDs for the following types
of system components:
a. Centrifugal pumps e. Fans
b. Positive displacement pumps f. Tanks
c. Heat exchangers g. Filters/strainers
d. Compressors
Symbology
To read and interpret piping and instrument drawings (P&IDs), the reader must learn the
meaning of the symbols. This chapter discusses the common symbols that are used to
depict fluid system components. When the symbology is mastered, the reader will be
able to interpret most P&IDs.
The reader should note that this chapter is only representative of fluid system
symbology, rather than being all-inclusive. The symbols presented herein are those
most commonly used in engineering P&IDs. The reader may expand his or her
knowledge by obtaining and studying the appropriate drafting standards used at his or
her facility.

Module 2: Engineering Fluid Diagrams and Prints
Page 3
Valve Symbols
Valves are used to control the direction, flow rate, and pressure of fluids. Figure 1
shows the symbols that depict the major valve types.
It should be noted that globe and gate valves will often be depicted by the same valve
symbol. In such cases, information concerning the valve type may be conveyed by the
component identification number or by the notes and legend section of the drawing;
however, in many instances even that may not hold true.
Figure 1 Valve Symbols

Module 2: Engineering Fluid Diagrams and Prints
Page 4
Valve Actuators
Some valves are provided with actuators to allow remote operation, to increase
mechanical advantage, or both. Figure 2 shows the symbols for the common valve
actuators. Note that although each is shown attached to a gate valve, an actuator can
be attached to any type of valve body. If no actuator is shown on a valve symbol, it may
be assumed the valve is equipped only with a handwheel for manual operation.
Figure 2 Valve Actuator Symbols
The combination of a valve and an actuator is commonly called a control valve. Control
valves are symbolized by combining the appropriate valve symbol and actuator symbol,
as illustrated in Figure 2. Control valves can be configured in many different ways. The
most commonly found configurations are to manually control the actuator from a remote
operating station, to automatically control the actuator from an instrument, or both.
In many cases, remote control of a valve is
accomplished by using an intermediate, small
control valve to operate the actuator of the process
control valve. The intermediate control valve is
placed in the line supplying motive force to the
process control valve, as shown in Figure 3. In this
example, air to the process air-operated control
valve is controlled by the solenoid-operated, 3-way
valve in the air supply line. The 3-way valve may
supply air to the control valve's diaphragm or vent
the diaphragm to the atmosphere.
Figure 3 Remotely Controlled Valve

Module 2: Engineering Fluid Diagrams and Prints
Page 5
Note that the symbols alone in Figure 3 do not provide the reader with enough
information to determine whether applying air pressure to the diaphragm opens or
closes the process control valve, or whether energizing the solenoid pressurizes or
vents the diaphragm. Further, Figure 3 is incomplete in that it does not show the
electrical portion of the valve control system nor does it identify the source of the motive
force (compressed air). Although Figure 3 informs the reader of the types of mechanical
components in the control system and how they interconnect, it does not provide
enough information to determine how those components react to a control signal.
Control valves operated by an instrument signal are symbolized in the same manner as
those shown previously, except the output of the controlling instrument goes to the
valve actuator. Figure 4 shows a level instrument (designated "LC") that controls the
level in the tank by positioning an air-operated diaphragm control valve. Again, note that
Figure 4 does not contain enough information to enable the reader to determine how the
control valve responds to a change in level.
Figure 4 Level Control Valve
An additional aspect of some control valves is a valve positioner, which allows more
precise control of the valve. This is especially useful when instrument signals are used
to control the valve. An example of a valve positioner is a set of limit switches operated
by the motion of the valve. A positioner is symbolized by a square box on the stem of
the control valve actuator. The positioner may have lines attached for motive force,
instrument signals, or both. Figure 5 shows two examples of valves equipped with
positioners. Note that, although these examples are more detailed than those of Figure
3 and Figure 4, the reader still does not have sufficient information to fully determine
response of the control valve to a change in control signal.

Module 2: Engineering Fluid Diagrams and Prints
Page 6
Figure 6 Control Valve Designations
Figure 5 Control Valves with Valve Positioners
In Example A of Figure 5, the reader can reasonably assume that opening of the control valve is in some way proportional to the level it controls and that the solenoid valve provides an override of the automatic control signals. However, the reader cannot ascertain whether it opens or closes the control valve. Also, the reader cannot determine in which direction the valve moves in response to a change in the control parameter. In Example B of Figure 5, the reader can make the same general assumptions as in Example A, except the control signal is unknown. Without additional information, the reader can only assume the air supply provides both the control signal and motive force for positioning the control valve. Even when valves are equipped with positioners, the positioner symbol may appear only on detailed system diagrams. Larger, overall system diagrams usually do not show this much detail and may only show the examples of Figure 5 as air-operated valves with no special features.
Control Valve Designations
A control valve may serve any number of functions within a fluid system. To differentiate between valve uses, a balloon labeling system is used to identify the function of a control valve, as shown in Figure 6. The common convention is that the first letter used in the valve designator indicates the parameter to be controlled by the valve. For example:
F = flow
T = temperature
L = level
P = pressure
H = hand (manually operated valve)
The second letter is usually a "C" and identifies the valve as a controller, or active component, as opposed to a hand-operated valve. The third letter is a "V" to indicate that the piece of equipment is a valve.

Module 2: Engineering Fluid Diagrams and Prints
Page 7
Piping Systems
The piping of a single system may
contain more than a single medium. For
example, although the main process
flow line may carry water, the associated
auxiliary piping may carry compressed
air, inert gas, or hydraulic fluid. Also, a
fluid system diagram may also depict
instrument signals and electrical wires
as well as piping. Figure 7 shows
commonly used symbols for indicating
the medium carried by the piping and for
differentiating between piping,
instrumentation signals, and electrical
wires. Note that, although the auxiliary
piping symbols identify their mediums,
the symbol for the process flow line
does not identify its medium. Figure 7 Piping Symbols
The diagram may also depict the individual fittings comprising the piping runs
depending on its intended use. Figure 8 shows symbols used to depict pipe fittings.
Figure 8 More Piping Symbols
Module 2: Engineering Fluid Diagrams and Prints
Page 8
Instrumentation
One of the main purposes of a P&ID is to provide functional information about how
instrumentation in a system or piece of equipment interfaces with the system or piece of
equipment. Because of this, a large amount of the symbology appearing on P&IDs
depicts instrumentation and instrument loops.
The symbols used to represent instruments and their loops can be divided into four
categories. Generally each of these four categories uses the component identifying
(labeling) scheme identified in Table 1. The first column of Table 1 lists the letters used
to identify the parameter being sensed or monitored by the loop or instrument. The
second column lists the letters used to indicate the type of indicator or controller. The
third column lists the letters used to indicate the type of component. The fourth column
lists the letters used to indicate the type of signals that are being modified by a modifier.

Module 2: Engineering Fluid Diagrams and Prints
Page 9
TABLE 1
Instrument Identifiers
Sensed Parameter Type of Indicator
or Controller Type of Component Type of Signal
F = flow
T = temperature
P = pressure
I = current
L = level
V = voltage
Z = position
R = recorder
I = indicator
C = controller
T = transmitter
M = modifier
E = element
I = current
V = voltage
P = pneumatic
The first three columns above are combined such that the resulting instrument identifier
indicates its sensed parameter, the function of the instrument, and the type of
instrument. The fourth column is used only in the case of an instrument modifier and is
used to indicate the types of signals being modified. The following is a list of example
instrument identifiers constructed from Table 1.
FIC = flow indicating controller TT = temperature transmitter
FM = flow modifier PT = pressure transmitter
PM = pressure modifier FE = flow element
TE = temperature element FI = flow indicator
TR = temperature recorder TI = temperature indicator
LIC = level indicating controller FC = flow controller
Module 2: Engineering Fluid Diagrams and Prints
Page 10
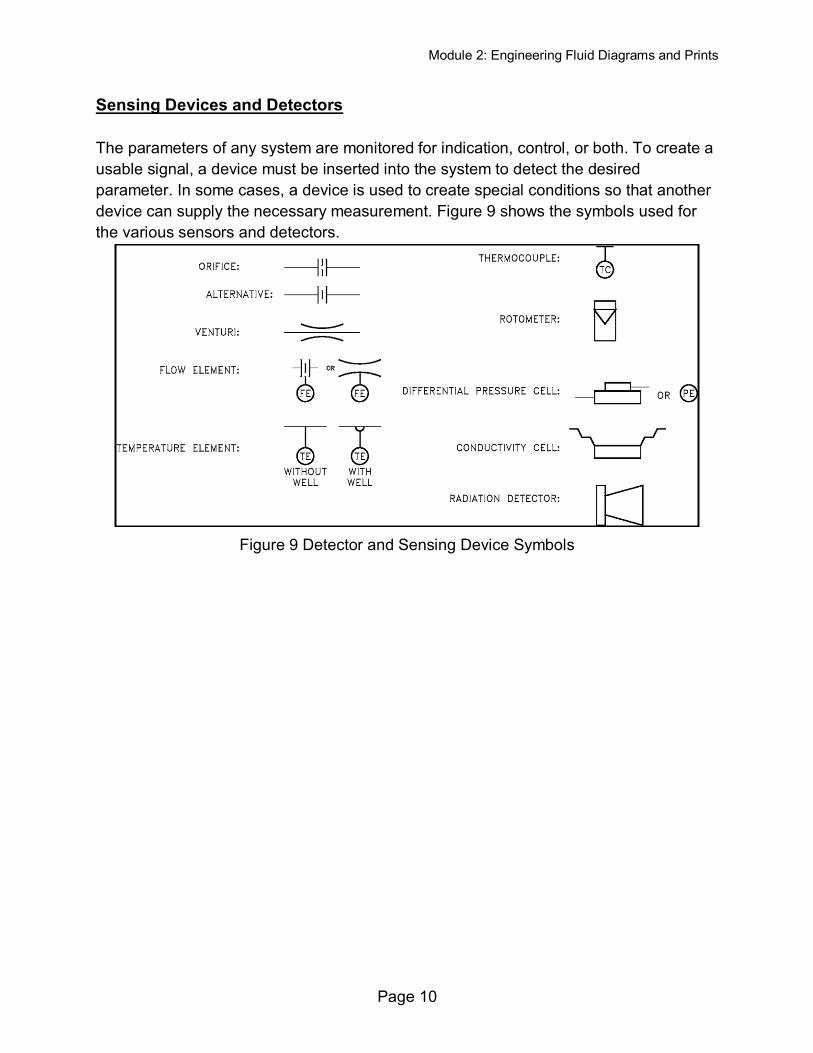
Sensing Devices and Detectors
The parameters of any system are monitored for indication, control, or both. To create a
usable signal, a device must be inserted into the system to detect the desired
parameter. In some cases, a device is used to create special conditions so that another
device can supply the necessary measurement. Figure 9 shows the symbols used for
the various sensors and detectors.
Figure 9 Detector and Sensing Device Symbols

Module 2: Engineering Fluid Diagrams and Prints
Page 11
Figure 10 Transmitters and Instruments
Modifiers and Transmitters
Sensors and detectors by themselves are not sufficient to create usable system
indications. Each sensor or detector must be coupled with appropriate modifiers and/or
transmitters. The exceptions are certain types of local instrumentation having
mechanical readouts, such as bourdon tube pressure gages and bimetallic
thermometers. Figure 10 illustrates various examples of modifiers and transmitters.
Figure 10 also illustrates the common notations used to indicate the location of an
instrument, i.e., local or board mounted.
Transmitters are used to
convert the signal from a
sensor or detector to a form
that can be sent to a remote
point for processing,
controlling, or monitoring.
The output can be electronic
(voltage or current),
pneumatic, or hydraulic.
Figure 10 illustrates symbols
for several specific types of
transmitters.
The reader should note that
modifiers may only be
identified by the type of input
and output signal (such as
I/P for one that converts an
electrical input to a
pneumatic output) rather
than by the monitored
parameter (such as PM for
pressure modifier).

Module 2: Engineering Fluid Diagrams and Prints
Page 12
Figure 11 Indicators and Recorders
PR-02 Page 12 Rev. 0
Indicators and Recorders
Indicators and recorders are instruments that convert the signal generated by an instrument loop into a readable form. The indicator or recorder may be locally or board mounted, and like modifiers and transmitters this information is indicated by the type of symbol used. Figure 11 provides examples of the symbols used for indicators and recorders and how their location is denoted.
Controllers
Controllers process the signal from an instrument loop and use it to position or manipulate some other system component. Generally they are denoted by placing a "C" in the balloon after the controlling parameter as shown in Figure 12. There are controllers that serve to process a signal and create a new signal. These include proportional controllers, proportional-integral controllers, and proportional-integral-differential controllers. The symbols for these controllers are illustrated in Figure 13. Note that these types of controllers are also called signal conditioners.
Figure 12 Controllers Figure 13 Signal Conditioners

Module 2: Engineering Fluid Diagrams and Prints
Page 13
Examples of Simple Instrument Loops
Figure 14 shows two examples of simple instrument loops. Figure 14 (A) shows a
temperature transmitter (TT), which generates two electrical signals. One signal goes
to a board-mounted temperature
recorder (TR) for display. The
second signal is sent to a
proportional-integral-derivative (PID)
controller, the output of which is
sent to a current-to-pneumatic
modifier (I/P). In the I/P modifier, the
electric signal is converted into a
pneumatic signal, commonly 3 psi to
15 psi, which in turn operates the
valve. The function of the complete
loop is to modify flow based on
process fluid temperature. Note that
there is not enough information to
determine how flow and
temperature are related and what
the setpoint is, but in some
instances the setpoint is stated on a
P&ID. Knowing the setpoint and
purpose of the system will usually
be sufficient to allow the operation
of the instrument loop to be
determined. Figure 14 Instrumentation System Examples
The pneumatic level transmitter (LT) illustrated in Figure 14 (B) senses tank level. The
output of the level transmitter is pneumatic and is routed to a board-mounted level
modifier (LM). The level modifier conditions the signal (possibly boosts or
mathematically modifies the signal) and uses the modified signal for two purposes. The
modifier drives a board-mounted recorder (LR) for indication, and it sends a modified
pneumatic signal to the diaphragm-operated level control valve. Notice that insufficient
information exists to determine the relationship between sensed tank level and valve
operation.
Components
Within every fluid system there are major components such as pumps, tanks, heat
exchangers, and fans. Figure 15 shows the engineering symbols for the most common
major components.

Module 2: Engineering Fluid Diagrams and Prints
Page 14
Figure 15 Symbols for Major Components

Module 2: Engineering Fluid Diagrams and Prints
Page 15
Miscellaneous P&ID Symbols
In addition to the normal symbols used on P&IDs to represent specific pieces of equipment, there are miscellaneous symbols that are used to guide or provide additional information about the drawing. Figure 16 lists and explains four of the more common miscellaneous symbols.
Figure 16 Miscellaneous Symbols
Summary
The important information in this chapter is summarized below.
Engineering Fluids Diagrams and Prints Summary
In this chapter the common symbols found on P&IDs for valves, valve operators, process piping, instrumentation, and common system components were reviewed.

Module 2: Engineering Fluid Diagrams and Prints
Page 16
READING ENGINEERING P&IDs
Standards and conventions have been developed to provide consistency from drawing to drawing. To accurately interpret a drawing, these
standards and conventions must be understood.
EO 1.9 STATE how the following valve conditions are depicted on an engineering P&ID
drawing:
a. Open valve e. Locked-closed valve
b. Closed valve f. Locked-open valve
c. Throttled valve g. Fail-open valves
d. Combination valves h. Fail-closed valve
(3- or 4- way valve) i. Fail-as-is valve
Standards and Conventions for Valve Status
Before a diagram or print can be properly read and understood, the basic conventions used by P&IDs to denote valve positions and failure modes must be understood. The reader must be able to determine the valve position, know if this position is normal, know how the valve will fail, and in some cases know if the valve is normally locked in that position. Figure 17 illustrates the symbols used to indicate valve status. Unless otherwise stated, P&IDs indicate valves in their "normal" position. This is usually interpreted as the normal or primary flowpath for the system. An exception is safety systems, which are normally shown in their standby or non-accident condition.
Figure 17 Valve Status Symbols
3-way valves are sometimes drawn in the position that they will fail to instead of always being drawn in their "normal" position. This will either be defined as the standard by the system of drawings or noted in some manner on the individual drawings.

Module 2: Engineering Fluid Diagrams and Prints
Page 17
Summary
The important information in this chapter is summarized below.
Reading Engineering P&IDs Summary
This chapter reviewed the basic symbology, common standards, and
conventions used on P&IDs, such as valve conditions and modes of failure.
This information, with the symbology learned in the preceding chapter,
provides the information necessary to read and interpret most P&IDs.

Module 2: Engineering Fluid Diagrams and Prints
Page 18
P&ID PRINT READING EXAMPLE
The ability to read and understand prints is achieved through the repetitive
reading of prints.
EO 1.10 Given an engineering P&ID, IDENTIFY components and DETERMINE the
flowpath(s) for a given valve lineup.
Example
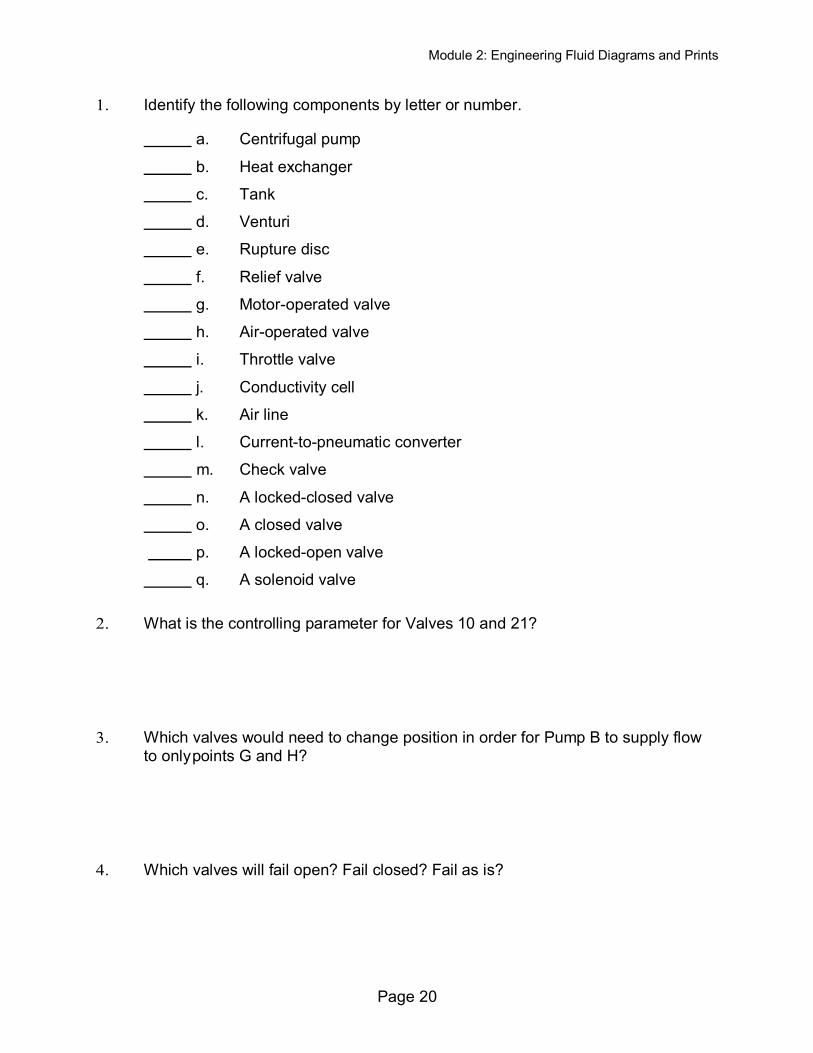
At this point, all the symbols for valves and major components have been presented, as have the conventions for identifying the condition of a system. Refer to Figure 18 as necessary to answer the following questions. The answers are provided in the back of this section so that you may judge your own knowledge level.

Module 2: Engineering Fluid Diagrams and Prints
Page 19
Figure 18 Exercise P&ID
Module 2: Engineering Fluid Diagrams and Prints
Page 20
1. Identify the following components by letter or number.
a. Centrifugal pump
b. Heat exchanger
c. Tank
d. Venturi
e. Rupture disc
f. Relief valve
g. Motor-operated valve
h. Air-operated valve
i. Throttle valve
j. Conductivity cell
k. Air line
l. Current-to-pneumatic converter
m. Check valve
n. A locked-closed valve
o. A closed valve
p. A locked-open valve
q. A solenoid valve
2. What is the controlling parameter for Valves 10 and 21?
3. Which valves would need to change position in order for Pump B to supply flow to only points G and H?
4. Which valves will fail open? Fail closed? Fail as is?

Module 2: Engineering Fluid Diagrams and Prints
Page 21
Answers for questions on Figure 18
1. a. A or B
b . C or D
c . E
d . 31
e . 1
f . 8 or 17
g . 2,3,7 or 16
h . 10, 21
i . 12 or 24
j . 26
k . 32
l . 28
m . 5 or 14
n . 18 or 19
o . 18 or 19
p . 4
q . 11 or 23
2. Temperature as sensed by the temperature elements (TE)
3. Open 18 and/or 19
Shut 13 and 25
4. Fail Open: 2 and 3
Fail Closed: 10 and 21
Fail as is: 7 and 16

Module 2: Engineering Fluid Diagrams and Prints
Page 22
Summary
The important information in this chapter is summarized below.
P&ID Print Reading Example Summary
This chapter provided the student with examples in applying the material learned in Chapters 1 and 2.

Module 2: Engineering Fluid Diagrams and Prints
Page 23
FLUID POWER P&IDs
Fluid power diagrams and schematics require an independent review because they use a unique set of symbols and conventions.
EO 1.11 IDENTIFY the symbols used on engineering fluid power drawings for the following components:
a. Pump d. Actuators
b. Compressor e. Piping and piping junctions
c. Reservoir f. Valves
EO 1.12 Given a fluid power type drawing, DETERMINE the operation or resultant
action of the stated component when hydraulic pressure is applied/ removed.
Fluid Power Diagrams and Schematics
Different symbology is used when dealing with systems that operate with fluid power. Fluid power includes either gas (such as air) or hydraulic (such as water or oil) motive media. Some of the symbols used in fluid power systems are the same or similar to those already discussed, but many are entirely different.
Fluid power systems are divided into five basic parts: pumps, reservoirs, actuators, valves, and lines.
Pumps
In the broad area of fluid power, two categories of pump symbols are used, depending on the motive media being used (i.e., hydraulic or pneumatic). The basic symbol for the pump is a circle containing one or more arrow heads indicating the direction(s) of flow with the points of the arrows in contact with the circle. Hydraulic pumps are shown by solid arrow heads. Pneumatic compressors are represented by hollow arrow heads. Figure 19 provides common symbols used for pumps (hydraulic) and compressors (pneumatic) in fluid power diagrams.
Figure 19 Fluid Power Pump and Compressor Symbols

Module 2: Engineering Fluid Diagrams and Prints
Page 24
Reservoirs
Reservoirs provide a location for storage of the motive media (hydraulic fluid or compressed gas). Although the symbols used to represent reservoirs vary widely, certain conventions are used to indicate how a reservoir handles the fluid. Pneumatic reservoirs are usually simple tanks and their symbology is usually some variation of the cylinder shown in Figure 20. Hydraulic reservoirs can be much more complex in terms of how the fluid is admitted to and removed from the tank. To convey this information, symbology conventions have been developed. These symbols are in Figure 20.
Figure 20 Fluid Power Reservoir Symbols
Actuator
An actuator in a fluid power system is any device that converts the hydraulic or pneumatic pressure into mechanical work. Actuators are classified as linear actuators and rotary actuators. Linear actuators have some form of piston device. Figure 21 illustrates several types of linear actuators and their drawing symbols.

Module 2: Engineering Fluid Diagrams and Prints
Page 25
Figure 21 Symbols for Linear Actuators
Rotary actuators are generally called motors and may be fixed or variable. Several of the more common rotary symbols are shown in Figure 22. Note the similarity between rotary motor symbols in Figure 22 and the pump symbols shown in Figure 19. The difference between them is that the point of the arrow touches the circle in a pump and the tail of the arrow touches the circle in a motor.

Module 2: Engineering Fluid Diagrams and Prints
Page 26
Figure 22 Symbols for Rotary Actuators
Piping
The sole purpose of piping in a fluid power system is to transport the working media, at pressure, from one point to another. The symbols for the various lines and termination points are shown in Figure 23.
Figure 23 Fluid Power Line Symbols

Module 2: Engineering Fluid Diagrams and Prints
Page 27
Figure 24 Valve Operation
Valves
Valves are the most complicated symbols in fluid power systems. Valves provide the control that is required to ensure that the motive media is routed to the correct point when needed. Fluid power system diagrams require much more complex valve symbology than standard P&IDs due to the complicated valving used in fluid power systems. In a typical P&ID, a valve opens, closes, or throttles the process fluid, but is rarely required to route the process fluid in any complex manner (three- and four-way valves being the common exceptions). In fluid power systems it is common for a valve to have three to eight pipes attached to the valve body, with the valve being capable of routing the fluid, or several separate fluids, in any number of combinations of input and output flowpaths.
The symbols used to represent fluid power valves must contain much more information than the standard P&ID valve symbology. To meet this need, the valve symbology shown in the following figures was developed for fluid power P&IDs. Figure 24, a cutaway view, provides an example of the internal complexity of a simple fluid power type valve. Figure 24 illustrates a four-way/three-position valve and how it operates to vary the flow of the fluid. Note that in Figure 24 the operator of the valve is not identified, but like a standard process fluid valve the valve could be operated by a diaphragm, motor, hydraulic, solenoid, or manual operator. Fluid power valves, when electrically operated by a solenoid, are drawn in the de-energized position. Energizing the solenoid will cause the valve to shift to the other port. If the valve is operated by other than a solenoid or is a multiport valve, the information necessary to determine how the valve operates will be provided on each drawing or on its accompanying legend print.

Module 2: Engineering Fluid Diagrams and Prints
Page 28
Refer to Figure 25 to see how the valve in Figure 24 is transformed into a usable symbol.
Figure 25 Valve Symbol Development

Module 2: Engineering Fluid Diagrams and Prints
Page 29
Figure 26 shows symbols for the various valve types used in fluid power systems.
Figure 26 Fluid Power Valve Symbols

Module 2: Engineering Fluid Diagrams and Prints
Page 30
Reading Fluid Power Diagrams
Using the symbology previously
discussed, a fluid power diagram can now be read. But before reading some complex examples, let's look at a simple hydraulic system and convert it into a fluid power diagram.
Using the drawing in Figure 27, the
left portion of Figure 28 lists each part and its fluid power symbol. The right side of Figure 28 shows the fluid power diagram that represents the drawing in Figure 27.
Figure 27 Simple Hydraulic Power System
Figure 28 Line Diagram of Simple Hydraulic Power System

Module 2: Engineering Fluid Diagrams and Prints
Page 31
With an understanding of the principles involved in reading fluid power diagram, any diagram can be interpreted. Figure 29 shows the kind of diagram that is likely to be encountered in the engineering field. To read this diagram, a step-by-step interpretation of what is happening in the system will be presented.
Figure 29 Typical Fluid Power Diagram
The first step is to get an overall view of what is happening. The arrows between A and B in the lower right-hand corner of the figure indicate that the system is designed to press or clamp some type of part between two sections of the machine. Hydraulic systems are often used in press work or other applications where the work piece must be held in place.

Module 2: Engineering Fluid Diagrams and Prints
Page 32
With the basic function understood, a detailed study of the diagram can be accomplished using a step-by-step analysis of each numbered local area in the diagram.
LOCAL AREA NUMBER 1
Symbol for an open reservoir with a strainer. The strainer is used to clean the oil before it enters the system.
LOCAL AREA NUMBER 2
Fixed displacement pump, electrically operated. This pump provides hydraulic pressure to the system.
LOCAL AREA NUMBER 3
Symbol for a relief valve with separate pressure gage. The relief valve is spring operated and protects the system from over pressurization. It also acts as an unloader valve to relieve pressure when the cylinder is not in operation. When system pressure exceeds its setpoint, the valve opens and returns the hydraulic fluid back to the reservoir. The gage provides a reading of how much pressure is in the system.
LOCAL AREA NUMBER 4
Composite symbol for a 4-way, 2-position valve. Pushbutton PB-1 is used to activate the valve by energizing the S-1 solenoid (note the valve is shown in the de-energized position). As shown, the high pressure hydraulic fluid is being routed from Port 1 to Port 3 and then to the bottom chamber of the piston. This drives and holds the piston in local area #5 in the retracted position. When the piston is fully retracted and hydraulic pressure builds, the unloader (relief) valve will lift and maintain the system's pressure at setpoint.
When PB-1 is pushed and S-1 energized, the 1-2 ports are aligned and 3-4 ports are aligned. This allows hydraulic fluid to enter the top chamber of the piston and drive it down. The fluid in the bottom chamber drains though the 3-4 ports back into the reservoir. The piston will continue to travel down until either PB-1 is released or full travel is reached, at which point the unloader (relief) valve will lift.
LOCAL AREA NUMBER 5
Actuating cylinder and piston. The cylinder is designed to receive fluid in either the upper or lower chambers. The system is designed so that when pressure is applied to the top chamber, the bottom chamber is aligned to drain back to the reservoir. When pressure is applied to the bottom chamber, the top chamber is aligned so that it drains back to the reservoir.

Module 2: Engineering Fluid Diagrams and Prints
Page 33
Types of Fluid Power Diagrams
Several kinds of diagrams can be used to show how systems work. With an understanding of how to interpret Figure 29, a reader will be able to interpret all of the diagrams that follow.
A pictorial diagram shows the physical arrangement of the elements in a system. The components are outline drawings that show the external shape of each item. Pictorial drawings do not show the internal function of the elements and are not especially valuable for maintenance or troubleshooting. Figure 30 shows a pictorial diagram of a system.
Figure 30 Pictorial Fluid Power Diagram
A cutaway diagram shows both the physical arrangement and the operation of the different components. It is generally used for instructional purposes because it explains the functions while showing how the system is arranged. Because these diagrams require so much space, they are not usually used for complicated systems. Figure 31 shows the system represented in Figure 30 in cutaway diagram format and illustrates the similarities and differences between the two types of diagrams.

Module 2: Engineering Fluid Diagrams and Prints
Page 34
Figure 31 Cutaway Fluid Power Diagram
A schematic diagram uses symbols to show the elements in a system. Schematics are designed to supply the functional information of the system. They do not accurately represent the relative location of the components. Schematics are useful in maintenance work, and understanding them is an important part of troubleshooting. Figure 32 is a schematic diagram of the system illustrated in Figure 30 and Figure 31.
Figure 32 Schematic Fluid Power Diagram

Module 2: Engineering Fluid Diagrams and Prints
Page 35
Summary
The important information in this chapter is summarized below.
Fluid Power P&IDs Summary
This chapter reviewed the most commonly used symbols on fluid power
diagrams and the basic standards and conventions for reading and
interpreting fluid power diagrams.


