English Language Learners in K–12: Trends, Policies, and Research in Washington State
Annie Pennucci
With Susan Kavanaugh
January 2005

English Language Learners in K–12: Trends, Policies, and Research in Washington State
Annie Pennucci With
Susan Kavanaugh
January 2005
Washington State Institute for Public Policy 110 Fifth Avenue Southeast, Suite 214
Post Office Box 40999 Olympia, Washington 98504-0999
Telephone: (360) 586-2677 FAX: (360) 586-2793
URL: http://www.wsipp.wa.gov Document No. 05-01-2201
WASHINGTON STATE INSTITUTE FOR PUBLIC POLICY Mission The Washington Legislature created the Washington State Institute for Public Policy in 1983. A Board of Directors—representing the legislature, the governor, and public universities—governs the Institute, hires the director, and guides the development of all activities. The Institute’s mission is to carry out practical research, at legislative direction, on issues of importance to Washington State. The Institute conducts research activities using its own policy analysts, academic specialists from universities, and consultants. New activities grow out of requests from the Washington legislature and executive branch agencies, often directed through legislation. Institute staff work closely with legislators, as well as legislative, executive, and state agency staff to define and conduct research on appropriate state public policy topics. Current assignments include projects in welfare reform, criminal justice, education, youth violence, and social services. Board of Directors Senator Karen Fraser Dennis Braddock, Department of Social and Health Services Senator Linda Evans Parlette (Pending), Office of Financial Management Senator (Pending) Douglas Baker, Washington State University Senator (Pending) Stephen Jordan, Eastern Washington University Representative Don Cox Sandra Archibald, University of Washington Representative Phyllis Kenney Thomas L. "Les" Purce, The Evergreen State College Representative Helen Sommers Ken Conte, House Office of Program Research Representative (Pending) Stan Pynch, Senate Committee Services Staff Roxanne Lieb, Director Steve Aos, Associate Director
CONTENTS Executive Summary................................................................................................................ 1 I. Study Direction.................................................................................................................. 3 II. Student and Program Trends............................................................................................ 7 III. Bilingual Education Law and Policy ................................................................................ 27 IV. Effectiveness and Duration of the TBIP.......................................................................... 39 Conclusion ............................................................................................................................ 55
ACKNOWLEDGEMENTS The authors extend thanks to the OSPI Research and Evaluation office for help with acquiring and interpreting data and to the Bilingual Education office for ongoing support. We greatly appreciate the time donated by school district staff who participated in interviews describing their services for ELL students. Thomas Stritikus of the University of Washington, Magda Costantino of The Evergreen State College, and Robert Slavin of Johns Hopkins University provided valuable consultations regarding the current state of research on bilingual education. The State Bilingual Education Advisory Committee, composed of educators from throughout Washington State, provided additional information about instruction for ELL students. Representation on the committee includes the following:
Dr. Richard Gomez, OSPI Director, Migrant/Bilingual Education
Helen Malagon, OSPI Bilingual Education Program Supervisor
Rodrigo Barron, OSPI Bilingual Education Program Supervisor
Phouang Hamilton, OSPI Bilingual Education Program Supervisor
Margaret Ho, OSPI Bilingual Education Program Supervisor
Christina Donato, Tacoma, ESL Teacher
Elizabeth Flynn, Pasco, Director, Instruction and Achievement
Debra Hale, Vancouver, Principal
Sergio Hernandez, Tekoa, Superintendent
Minh-Anh Hodge, Tacoma, Director, Elementary Education and Second Language Acquisition
Ellen Kaje, Northshore, ELL Literacy Specialist
Margaret Perry, Everett, ELL Staff Support
Mary Pruitt, Kennewick, Federal Projects Administrator
Thom Romero, ESD 105, Director, MERO 105
Patricia Valdez-Zontek, Yakima, Executive Director, State and Federal Programs
Dottie Weldon, Spokane, Coordinator, Special Programs Special thanks to Institute staff, including Janie Maki for compiling key information about other states and programs serving students learning the English language; Laura Harmon for programming support; Debra Fabritius for her tireless editing; and Steve Aos, Robert Barnoski, and Wei Yen for their expertise in statistical analysis.
1
EXECUTIVE SUMMARY The 2004 Washington State Legislature directed the Washington State Institute for Public Policy (Institute) to review the state Transitional Bilingual Instructional Program (TBIP). The Institute interviewed TBIP staff at the state and school district levels; analyzed student enrollment and assessment data; and reviewed laws, policies, and research on instruction for English language learners (ELL students) in the public K–12 school system. Federal and State Laws Define Requirements The 1979 Washington State Legislature created the TBIP. State and federal laws
require public schools to provide ELL students with specialized instruction to help them access the educational curriculum. Federal policy recommends using “research based” programs for ELL students; Washington State law authorizes bilingual, or native language, instructional programs. State statute allows for English as a Second Language (ESL) programs in situations where instruction in students’ native languages is not feasible.
State law gives school districts broad discretion to select and implement programs. The state Office of the Superintendent of Public Instruction (OSPI) develops policy guidelines and provides training and technical assistance to schools enrolling TBIP students.
Student Enrollment Continues to Increase Steadily TBIP student enrollment is growing rapidly and, therefore, so are dedicated state
general fund expenditures. Between 1985 and 2004, TBIP enrollment increased from 2 to 7 percent of public K–12 students in Washington State. Washington State now provides over $54 million annually for more than 70,000 TBIP students.
TBIP enrollment increases are partly explained by population growth among non-English speakers in Washington State. Enrollment growth is also due to higher numbers of students continuing in the TBIP across school years; the percentage of students in the TBIP for more than three years increased from 9 to 28 percent between 1986 and 2002.
Student and School Characteristics Influence Services Provided Most Washington schools provide ESL instruction for ELL students. Bilingual programs
require a school district to enroll sufficient numbers of ELL students in the same grades, speaking the same language, and with similar language proficiency levels. These conditions are rare among Washington schools, particularly at the secondary level. While the majority (66 percent) of TBIP students speak Spanish, more than 160 different languages are spoken in Washington schools.
Elementary schools are more likely to implement bilingual programs because there are
more elementary ELL students statewide, and they remain in the same classroom for
2
the entire school day; these factors create more opportunities to group students for native language instruction. At the middle and high school levels, ELL students have more varied educational backgrounds and lower English proficiency relative to their peers.
While the number of teachers obtaining bilingual and ESL endorsements has increased in recent years, locating qualified teachers remains a challenge for districts interested in bilingual programs. Instructional assistants (IAs) are widely used in the TBIP at all grade levels to provide special assistance to students and facilitate communication among students, teachers, and parents.
Most Students Remain in the TBIP for Less Than Three Years Per-student TBIP funding is provided to school districts until an ELL student
demonstrates sufficient English language and academic proficiency on assessment tests. State law sets a three-year target for students to transition out of the TBIP into mainstream classes.
Students’ average length of stay in the TBIP has gradually increased over the life of the program, from about 1.4 to 2.2 school years. Analysis of district-level OSPI data could not conclusively link longer length of stay with student or program characteristics. Most students exit the TBIP within three years.
While there is no clear consensus, many researchers have concluded it takes four to seven years for students to develop English language skills sufficient for academic work.
Effective Programs: Research Is Inconclusive State data on student outcomes reveal a gap between the academic performance of
ELL students and Washington K–12 students overall. Reflecting a disparity found nationwide, 20 to 55 percent fewer Washington ELL students meet WASL standards than all Washington students. Analysis of district-level data could not identify programs associated with better test scores, due to data limitations.
A review of research literature reveals that few evaluations of bilingual education use sufficiently rigorous research designs to meet scientific standards for generalizability. There is some evidence that bilingual programs can improve ELL student test scores in the short term, but the research does not address ESL instruction, the most common program in Washington schools.
Opportunity to Examine Effectiveness of Washington Programs Student-level TBIP data recently collected by OSPI will enable future research to identify
instructional strategies associated with improved academic outcomes for ELL students. Washington State could invest in a research study using the new data to address the question of program cost-effectiveness. This investment in research would provide scientific evidence of what instructional strategies work best for Washington ELL students.
3
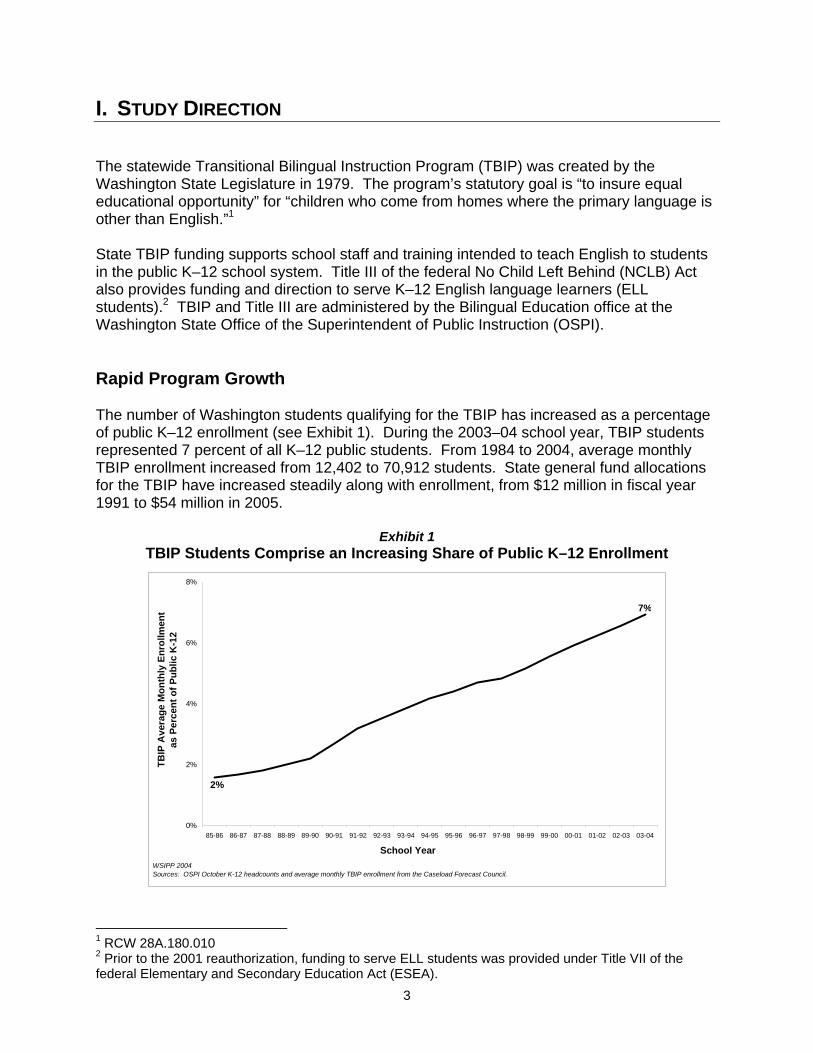
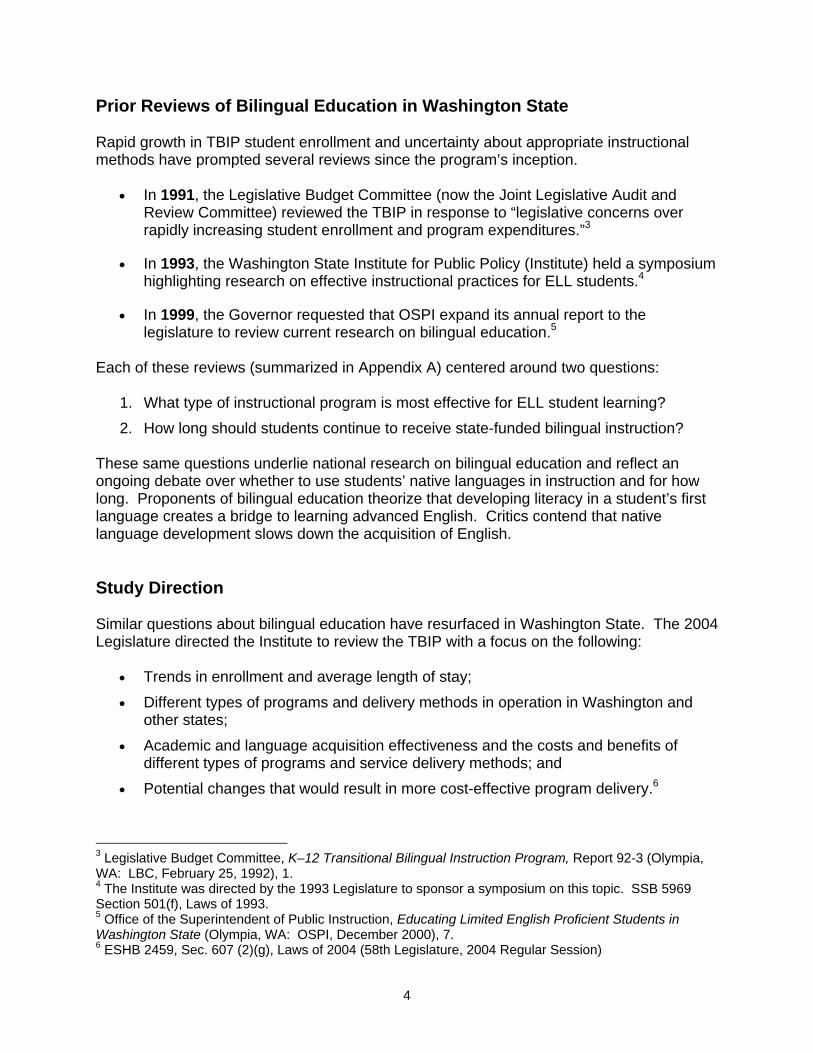
I. STUDY DIRECTION The statewide Transitional Bilingual Instruction Program (TBIP) was created by the Washington State Legislature in 1979. The program’s statutory goal is “to insure equal educational opportunity” for “children who come from homes where the primary language is other than English.”1 State TBIP funding supports school staff and training intended to teach English to students in the public K–12 school system. Title III of the federal No Child Left Behind (NCLB) Act also provides funding and direction to serve K–12 English language learners (ELL students).2 TBIP and Title III are administered by the Bilingual Education office at the Washington State Office of the Superintendent of Public Instruction (OSPI). Rapid Program Growth The number of Washington students qualifying for the TBIP has increased as a percentage of public K–12 enrollment (see Exhibit 1). During the 2003–04 school year, TBIP students represented 7 percent of all K–12 public students. From 1984 to 2004, average monthly TBIP enrollment increased from 12,402 to 70,912 students. State general fund allocations for the TBIP have increased steadily along with enrollment, from $12 million in fiscal year 1991 to $54 million in 2005.
Exhibit 1 TBIP Students Comprise an Increasing Share of Public K–12 Enrollment
0%
2%
4%
6%
8%
85-86 86-87 87-88 88-89 89-90 90-91 91-92 92-93 93-94 94-95 95-96 96-97 97-98 98-99 99-00 00-01 01-02 02-03 03-04
School Year
TBIP
Ave
rage
Mon
thly
Enr
ollm
ent
as P
erce
nt o
f Pub
lic K
-12
WSIPP 2004Sources: OSPI October K-12 headcounts and average monthly TBIP enrollment from the Caseload Forecast Council.
7%
2%
1 RCW 28A.180.010 2 Prior to the 2001 reauthorization, funding to serve ELL students was provided under Title VII of the federal Elementary and Secondary Education Act (ESEA).
4
Prior Reviews of Bilingual Education in Washington State Rapid growth in TBIP student enrollment and uncertainty about appropriate instructional methods have prompted several reviews since the program’s inception.
• In 1991, the Legislative Budget Committee (now the Joint Legislative Audit and Review Committee) reviewed the TBIP in response to “legislative concerns over rapidly increasing student enrollment and program expenditures.”3
• In 1993, the Washington State Institute for Public Policy (Institute) held a symposium highlighting research on effective instructional practices for ELL students.4
• In 1999, the Governor requested that OSPI expand its annual report to the legislature to review current research on bilingual education.5
Each of these reviews (summarized in Appendix A) centered around two questions:
1. What type of instructional program is most effective for ELL student learning?
2. How long should students continue to receive state-funded bilingual instruction? These same questions underlie national research on bilingual education and reflect an ongoing debate over whether to use students’ native languages in instruction and for how long. Proponents of bilingual education theorize that developing literacy in a student’s first language creates a bridge to learning advanced English. Critics contend that native language development slows down the acquisition of English. Study Direction Similar questions about bilingual education have resurfaced in Washington State. The 2004 Legislature directed the Institute to review the TBIP with a focus on the following:
• Trends in enrollment and average length of stay;
• Different types of programs and delivery methods in operation in Washington and other states;
• Academic and language acquisition effectiveness and the costs and benefits of different types of programs and service delivery methods; and
• Potential changes that would result in more cost-effective program delivery.6
3 Legislative Budget Committee, K–12 Transitional Bilingual Instruction Program, Report 92-3 (Olympia, WA: LBC, February 25, 1992), 1. 4 The Institute was directed by the 1993 Legislature to sponsor a symposium on this topic. SSB 5969 Section 501(f), Laws of 1993. 5 Office of the Superintendent of Public Instruction, Educating Limited English Proficient Students in Washington State (Olympia, WA: OSPI, December 2000), 7. 6 ESHB 2459, Sec. 607 (2)(g), Laws of 2004 (58th Legislature, 2004 Regular Session)
5
In completing this report, the Institute relied on interviews with TBIP staff at the state and district levels; analysis of data from OSPI, the state Caseload Forecast Council, and the U.S. Census; a review of laws and regulations related to bilingual instruction in Washington and other states; and a review of research on instruction for ELL students. Institute staff also consulted with researchers who have completed similar studies. Detailed explanations of the methods are in Appendices B through E. Section II examines TBIP student and program trends. Section III summarizes the laws and regulations governing bilingual education, and Section IV describes research on the effectiveness and duration of services for ELL students.

7
SECTION II: STUDENT AND PROGRAM TRENDS Since the 1980s, the number of students qualifying for Washington State’s Transitional Bilingual Instructional Program (TBIP) has grown steadily, driving annual increases in state general fund spending. This section examines these trends and provides data on the following:
TBIP Student Enrollment
State Funding for TBIP
Types of Programs
Program Staffing
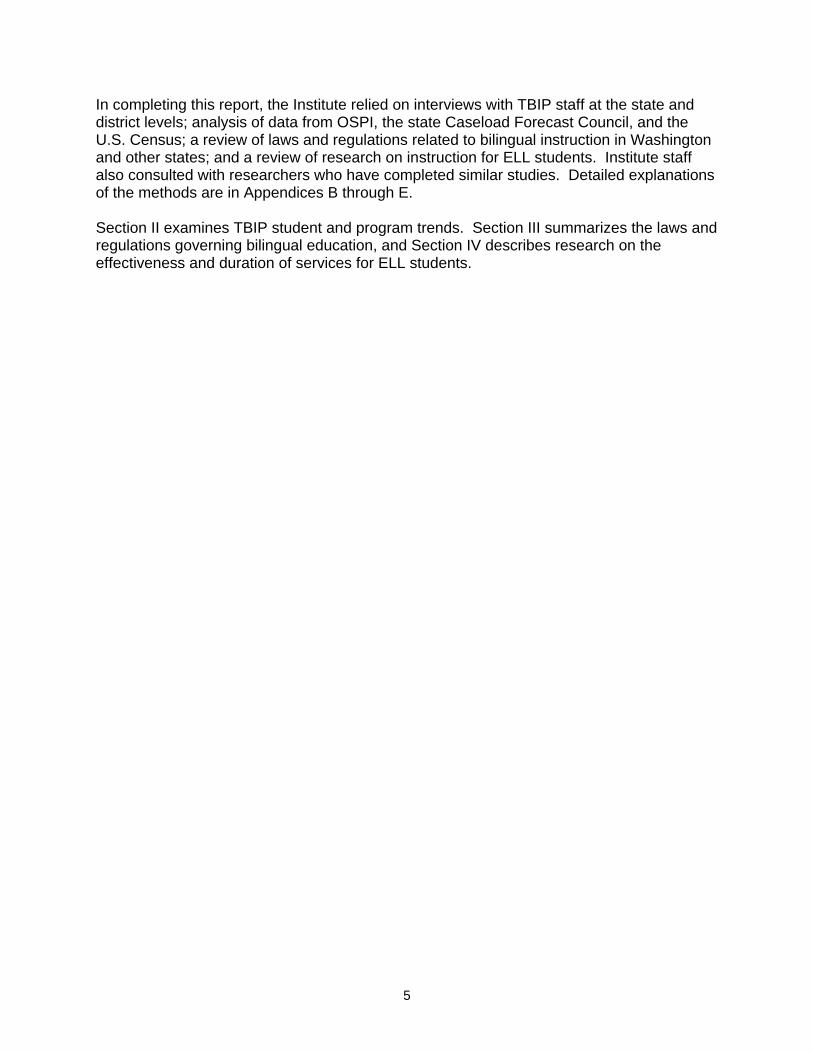
TBIP Student Characteristics TBIP Student Enrollment Enrollment in the TBIP is measured in two ways. First, in its annual report to the legislature, OSPI calculates the total number of students served by the TBIP at any point during the school year. Second, the average number of students in the program each month over eight months of the school year is reported for funding purposes. State funding for the TBIP is apportioned to districts based on this average monthly enrollment. The difference between the two numbers represents movement of TBIP students in and out of the state and among school districts. Exhibit 2 illustrates how, using either measure, the number of TBIP students has increased steadily by an average of about 11 percent annually since 1985–86. The state now provides TBIP funding for over 70,000 students. The number of state-funded instructional programs for ELL students has increased as well. During the 1984–85 school year, 106 Washington school districts received TBIP funding; by 2001–02, this number had grown to 187.
Exhibit 2 TBIP Student Enrollment Has Grown Steadily
0
20,000
40,000
60,000
80,000
85-86 86-87 87-88 88-89 89-90 90-91 91-92 92-93 93-94 94-95 95-96 96-97 97-98 98-99 99-00 00-01 01-02 02-03 03-04
School Year
Num
ber o
f Stu
dent
s
WSIPP 2004Sources: OSPI TBIP enrollment data and average monthly apportionment data from the Caseload Forecast Council.
Total Enrollment
Average Monthly Enrollment
8
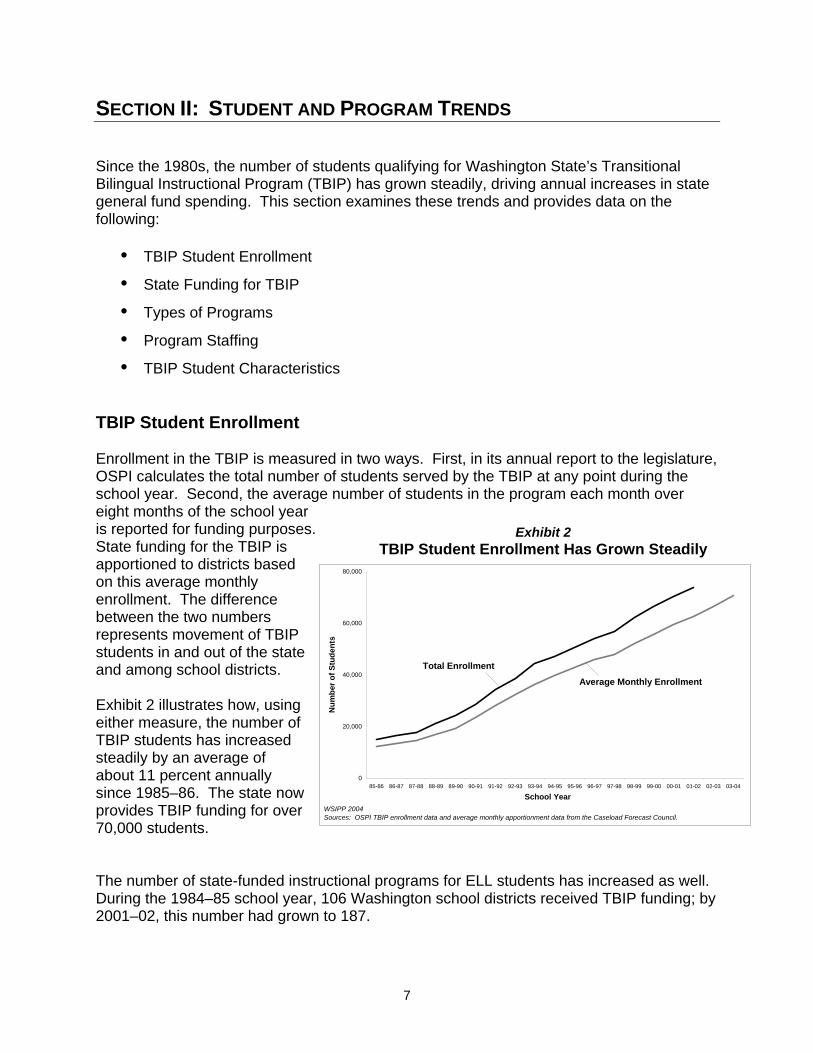
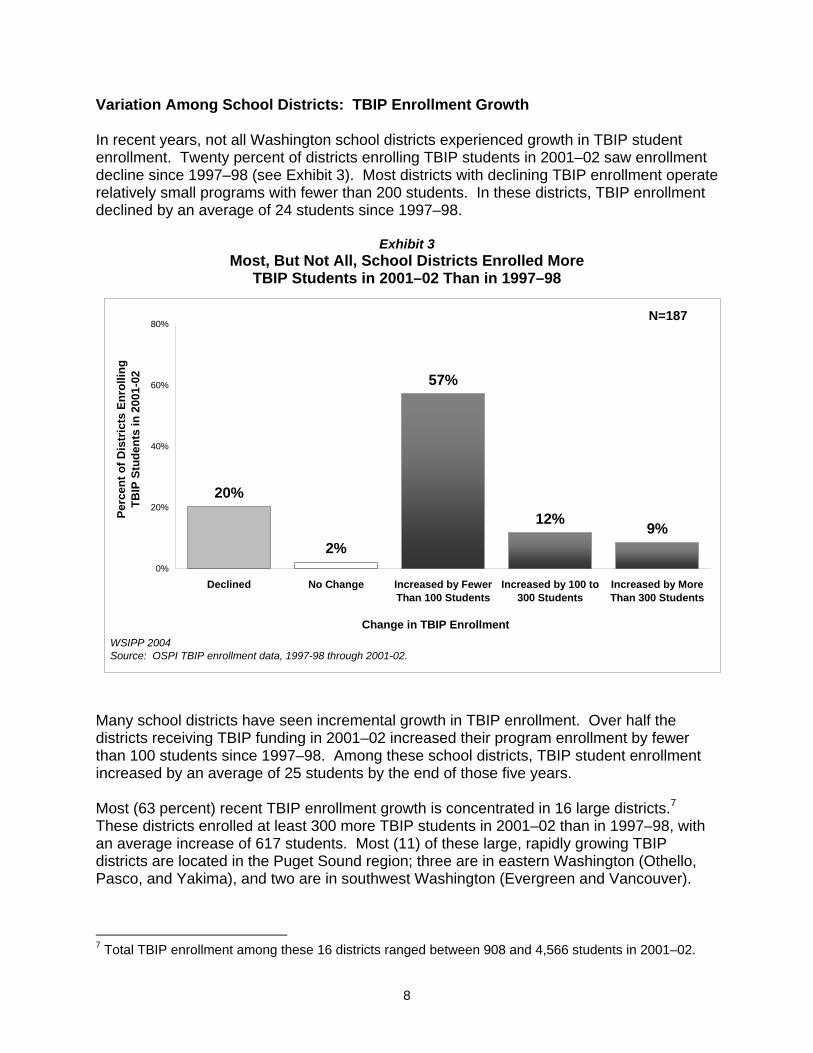
Variation Among School Districts: TBIP Enrollment Growth In recent years, not all Washington school districts experienced growth in TBIP student enrollment. Twenty percent of districts enrolling TBIP students in 2001–02 saw enrollment decline since 1997–98 (see Exhibit 3). Most districts with declining TBIP enrollment operate relatively small programs with fewer than 200 students. In these districts, TBIP enrollment declined by an average of 24 students since 1997–98.
Exhibit 3 Most, But Not All, School Districts Enrolled More
TBIP Students in 2001–02 Than in 1997–98
Many school districts have seen incremental growth in TBIP enrollment. Over half the districts receiving TBIP funding in 2001–02 increased their program enrollment by fewer than 100 students since 1997–98. Among these school districts, TBIP student enrollment increased by an average of 25 students by the end of those five years. Most (63 percent) recent TBIP enrollment growth is concentrated in 16 large districts.7 These districts enrolled at least 300 more TBIP students in 2001–02 than in 1997–98, with an average increase of 617 students. Most (11) of these large, rapidly growing TBIP districts are located in the Puget Sound region; three are in eastern Washington (Othello, Pasco, and Yakima), and two are in southwest Washington (Evergreen and Vancouver). 7 Total TBIP enrollment among these 16 districts ranged between 908 and 4,566 students in 2001–02.
20%
2%
57%
12% 9%
0%
20%
40%
60%
80%
Declined No Change Increased by FewerThan 100 Students
Increased by 100 to300 Students
Increased by MoreThan 300 Students
Change in TBIP Enrollment
Perc
ent o
f Dis
tric
ts E
nrol
ling
TBIP
Stu
dent
s in
200
1-02
WSIPP 2004Source: OSPI TBIP enrollment data, 1997-98 through 2001-02.
N=187
9
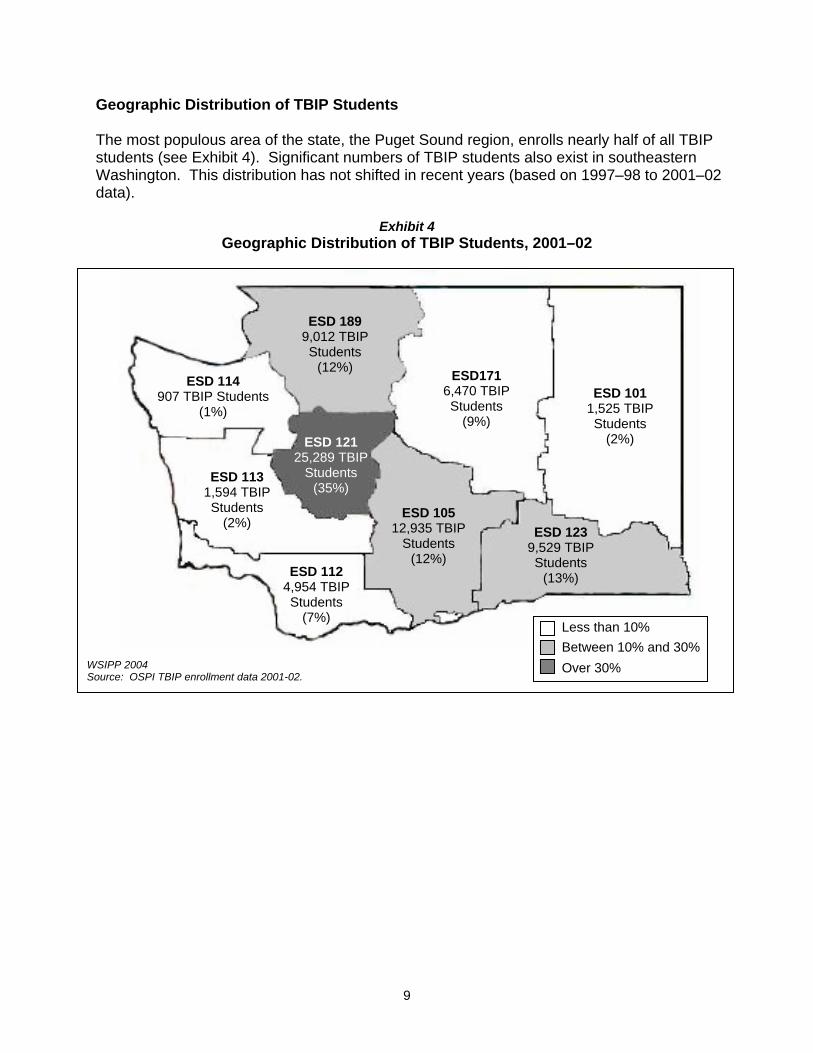
Geographic Distribution of TBIP Students The most populous area of the state, the Puget Sound region, enrolls nearly half of all TBIP students (see Exhibit 4). Significant numbers of TBIP students also exist in southeastern Washington. This distribution has not shifted in recent years (based on 1997–98 to 2001–02 data).
Exhibit 4 Geographic Distribution of TBIP Students, 2001–02
What Drives TBIP Enrollment Growth? The Institute examined data covering factors that might contribute to the TBIP’s relatively rapid enrollment growth. To begin, we compared U.S. Census estimates of Washington’s non-English speaking population with TBIP enrollment data.
WSIPP 2004 Source: OSPI TBIP enrollment data 2001-02.
ESD 189 9,012 TBIP Students
(12%)
ESD 105 12,935 TBIP
Students (12%)
ESD 123 9,529 TBIP Students
(13%)
ESD171 6,470 TBIP Students
(9%)
ESD 101 1,525 TBIP Students
(2%)
ESD 114 907 TBIP Students
(1%)
ESD 113 1,594 TBIP Students
(2%)
ESD 112 4,954 TBIP Students
(7%)
ESD 121 25,289 TBIP
Students (35%)
Less than 10% Between 10% and 30% Over 30%
10
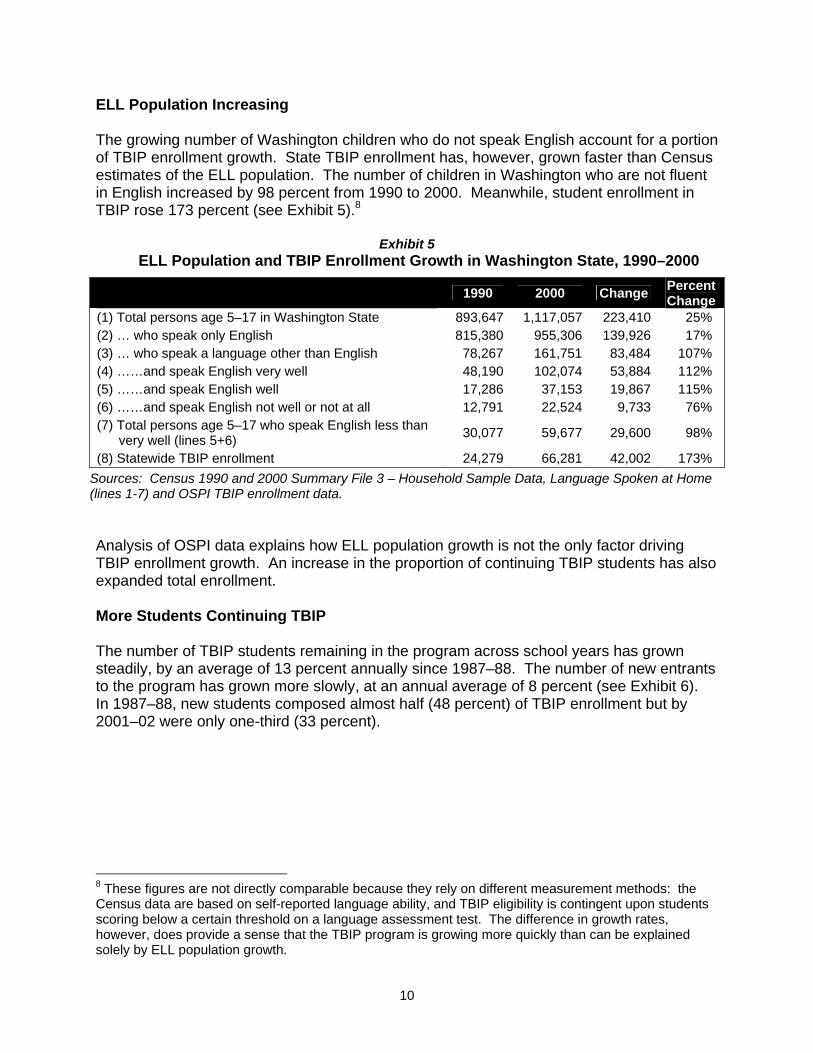
ELL Population Increasing The growing number of Washington children who do not speak English account for a portion of TBIP enrollment growth. State TBIP enrollment has, however, grown faster than Census estimates of the ELL population. The number of children in Washington who are not fluent in English increased by 98 percent from 1990 to 2000. Meanwhile, student enrollment in TBIP rose 173 percent (see Exhibit 5).8
Exhibit 5 ELL Population and TBIP Enrollment Growth in Washington State, 1990–2000
1990 2000 Change Percent Change
(1) Total persons age 5–17 in Washington State 893,647 1,117,057 223,410 25% (2) … who speak only English 815,380 955,306 139,926 17% (3) … who speak a language other than English 78,267 161,751 83,484 107% (4) ……and speak English very well 48,190 102,074 53,884 112% (5) ……and speak English well 17,286 37,153 19,867 115% (6) ……and speak English not well or not at all 12,791 22,524 9,733 76% (7) Total persons age 5–17 who speak English less than
very well (lines 5+6) 30,077 59,677 29,600 98%
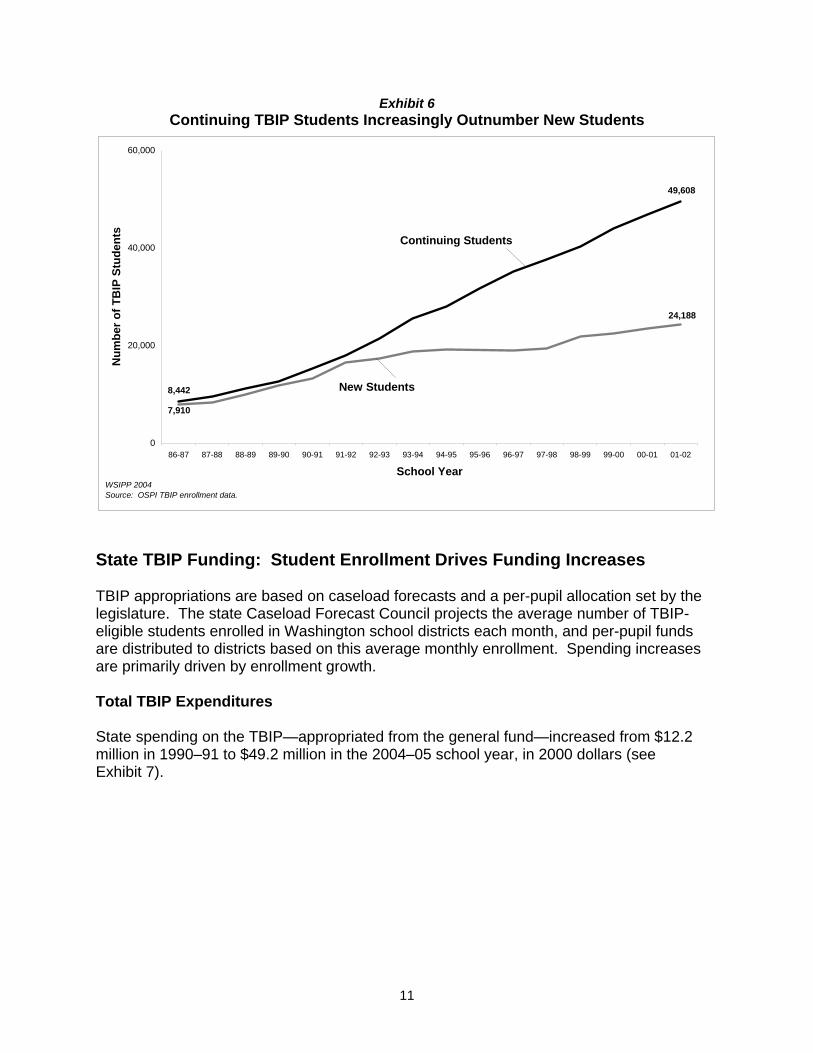
(8) Statewide TBIP enrollment 24,279 66,281 42,002 173% Sources: Census 1990 and 2000 Summary File 3 – Household Sample Data, Language Spoken at Home (lines 1-7) and OSPI TBIP enrollment data. Analysis of OSPI data explains how ELL population growth is not the only factor driving TBIP enrollment growth. An increase in the proportion of continuing TBIP students has also expanded total enrollment. More Students Continuing TBIP The number of TBIP students remaining in the program across school years has grown steadily, by an average of 13 percent annually since 1987–88. The number of new entrants to the program has grown more slowly, at an annual average of 8 percent (see Exhibit 6). In 1987–88, new students composed almost half (48 percent) of TBIP enrollment but by 2001–02 were only one-third (33 percent).
8 These figures are not directly comparable because they rely on different measurement methods: the Census data are based on self-reported language ability, and TBIP eligibility is contingent upon students scoring below a certain threshold on a language assessment test. The difference in growth rates, however, does provide a sense that the TBIP program is growing more quickly than can be explained solely by ELL population growth.
11
Exhibit 6 Continuing TBIP Students Increasingly Outnumber New Students
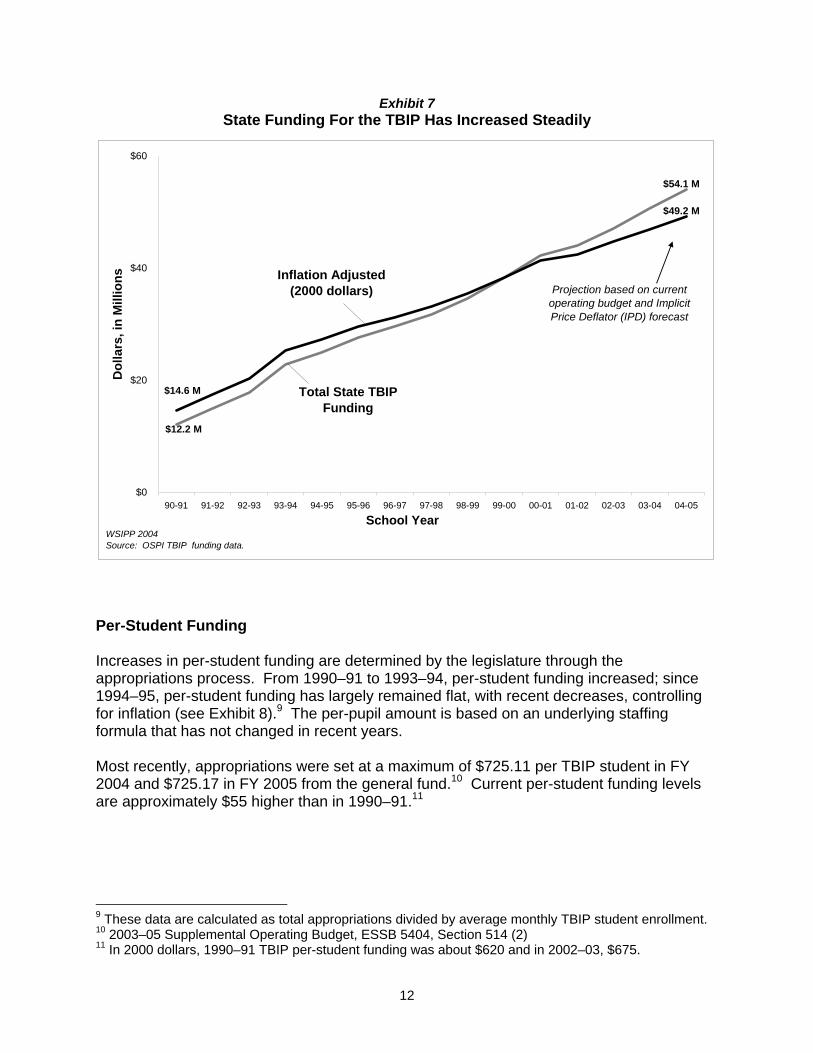
State TBIP Funding: Student Enrollment Drives Funding Increases TBIP appropriations are based on caseload forecasts and a per-pupil allocation set by the legislature. The state Caseload Forecast Council projects the average number of TBIP-eligible students enrolled in Washington school districts each month, and per-pupil funds are distributed to districts based on this average monthly enrollment. Spending increases are primarily driven by enrollment growth. Total TBIP Expenditures State spending on the TBIP—appropriated from the general fund—increased from $12.2 million in 1990–91 to $49.2 million in the 2004–05 school year, in 2000 dollars (see Exhibit 7).
0
20,000
40,000
60,000
86-87 87-88 88-89 89-90 90-91 91-92 92-93 93-94 94-95 95-96 96-97 97-98 98-99 99-00 00-01 01-02
School Year
Num
ber o
f TB
IP S
tude
nts
WSIPP 2004Source: OSPI TBIP enrollment data.
Continuing Students
New Students8,442
49,608
24,188
7,910
12
Exhibit 7 State Funding For the TBIP Has Increased Steadily
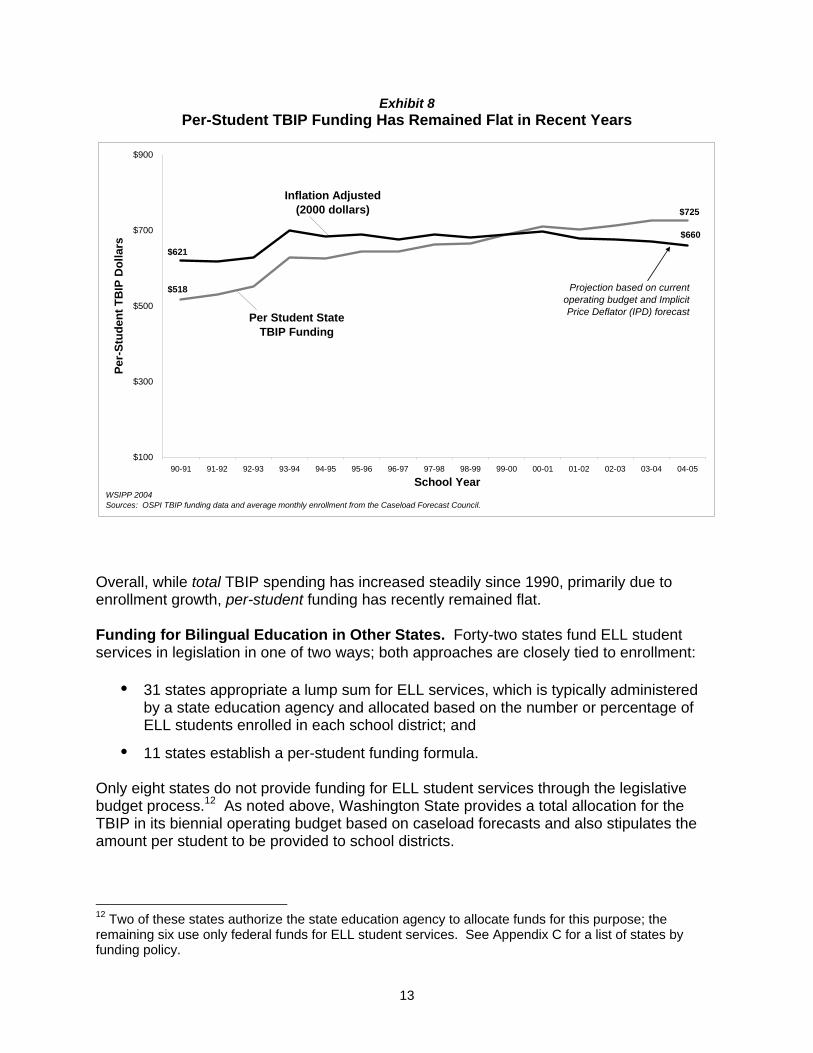
Per-Student Funding Increases in per-student funding are determined by the legislature through the appropriations process. From 1990–91 to 1993–94, per-student funding increased; since 1994–95, per-student funding has largely remained flat, with recent decreases, controlling for inflation (see Exhibit 8).9 The per-pupil amount is based on an underlying staffing formula that has not changed in recent years. Most recently, appropriations were set at a maximum of $725.11 per TBIP student in FY 2004 and $725.17 in FY 2005 from the general fund.10 Current per-student funding levels are approximately $55 higher than in 1990–91.11
9 These data are calculated as total appropriations divided by average monthly TBIP student enrollment. 10 2003–05 Supplemental Operating Budget, ESSB 5404, Section 514 (2) 11 In 2000 dollars, 1990–91 TBIP per-student funding was about $620 and in 2002–03, $675.
$0
$20
$40
$60
90-91 91-92 92-93 93-94 94-95 95-96 96-97 97-98 98-99 99-00 00-01 01-02 02-03 03-04 04-05
School Year
Dol
lars
, in
Mill
ions
WSIPP 2004Source: OSPI TBIP funding data.
Projection based on current operating budget and Implicit Price Deflator (IPD) forecast
Inflation Adjusted(2000 dollars)
Total State TBIP Funding
$14.6 M
$12.2 M
$54.1 M
$49.2 M
13
Exhibit 8 Per-Student TBIP Funding Has Remained Flat in Recent Years
Overall, while total TBIP spending has increased steadily since 1990, primarily due to enrollment growth, per-student funding has recently remained flat. Funding for Bilingual Education in Other States. Forty-two states fund ELL student services in legislation in one of two ways; both approaches are closely tied to enrollment:
31 states appropriate a lump sum for ELL services, which is typically administered by a state education agency and allocated based on the number or percentage of ELL students enrolled in each school district; and
11 states establish a per-student funding formula. Only eight states do not provide funding for ELL student services through the legislative budget process.12 As noted above, Washington State provides a total allocation for the TBIP in its biennial operating budget based on caseload forecasts and also stipulates the amount per student to be provided to school districts. 12 Two of these states authorize the state education agency to allocate funds for this purpose; the remaining six use only federal funds for ELL student services. See Appendix C for a list of states by funding policy.
$100
$300
$500
$700
$900
90-91 91-92 92-93 93-94 94-95 95-96 96-97 97-98 98-99 99-00 00-01 01-02 02-03 03-04 04-05
School Year
Per-
Stud
ent T
BIP
Dol
lars
WSIPP 2004Sources: OSPI TBIP funding data and average monthly enrollment from the Caseload Forecast Council.
Projection based on current operating budget and Implicit Price Deflator (IPD) forecastPer Student State
TBIP Funding
Inflation Adjusted (2000 dollars)
$621
$518
$725
$660
14
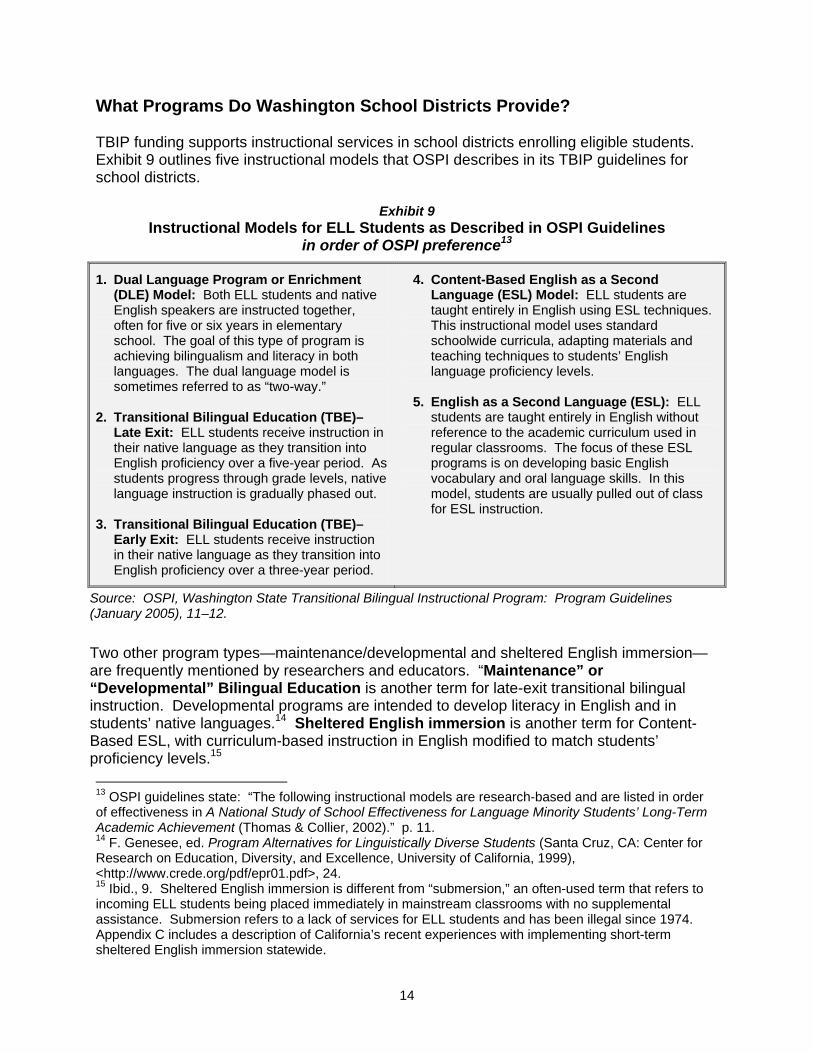
What Programs Do Washington School Districts Provide? TBIP funding supports instructional services in school districts enrolling eligible students. Exhibit 9 outlines five instructional models that OSPI describes in its TBIP guidelines for school districts.
Exhibit 9
Instructional Models for ELL Students as Described in OSPI Guidelines in order of OSPI preference13
1. Dual Language Program or Enrichment (DLE) Model: Both ELL students and native English speakers are instructed together, often for five or six years in elementary school. The goal of this type of program is achieving bilingualism and literacy in both languages. The dual language model is sometimes referred to as “two-way.”
2. Transitional Bilingual Education (TBE)–Late Exit: ELL students receive instruction in their native language as they transition into English proficiency over a five-year period. As students progress through grade levels, native language instruction is gradually phased out.
3. Transitional Bilingual Education (TBE)–
Early Exit: ELL students receive instruction in their native language as they transition into English proficiency over a three-year period.
4. Content-Based English as a Second Language (ESL) Model: ELL students are taught entirely in English using ESL techniques. This instructional model uses standard schoolwide curricula, adapting materials and teaching techniques to students’ English language proficiency levels.
5. English as a Second Language (ESL): ELL
students are taught entirely in English without reference to the academic curriculum used in regular classrooms. The focus of these ESL programs is on developing basic English vocabulary and oral language skills. In this model, students are usually pulled out of class for ESL instruction.
Source: OSPI, Washington State Transitional Bilingual Instructional Program: Program Guidelines (January 2005), 11–12. Two other program types—maintenance/developmental and sheltered English immersion—are frequently mentioned by researchers and educators. “Maintenance” or “Developmental” Bilingual Education is another term for late-exit transitional bilingual instruction. Developmental programs are intended to develop literacy in English and in students’ native languages.14 Sheltered English immersion is another term for Content-Based ESL, with curriculum-based instruction in English modified to match students’ proficiency levels.15 13 OSPI guidelines state: “The following instructional models are research-based and are listed in order of effectiveness in A National Study of School Effectiveness for Language Minority Students’ Long-Term Academic Achievement (Thomas & Collier, 2002).” p. 11. 14 F. Genesee, ed. Program Alternatives for Linguistically Diverse Students (Santa Cruz, CA: Center for Research on Education, Diversity, and Excellence, University of California, 1999), <http://www.crede.org/pdf/epr01.pdf>, 24. 15 Ibid., 9. Sheltered English immersion is different from “submersion,” an often-used term that refers to incoming ELL students being placed immediately in mainstream classrooms with no supplemental assistance. Submersion refers to a lack of services for ELL students and has been illegal since 1974. Appendix C includes a description of California’s recent experiences with implementing short-term sheltered English immersion statewide.
15
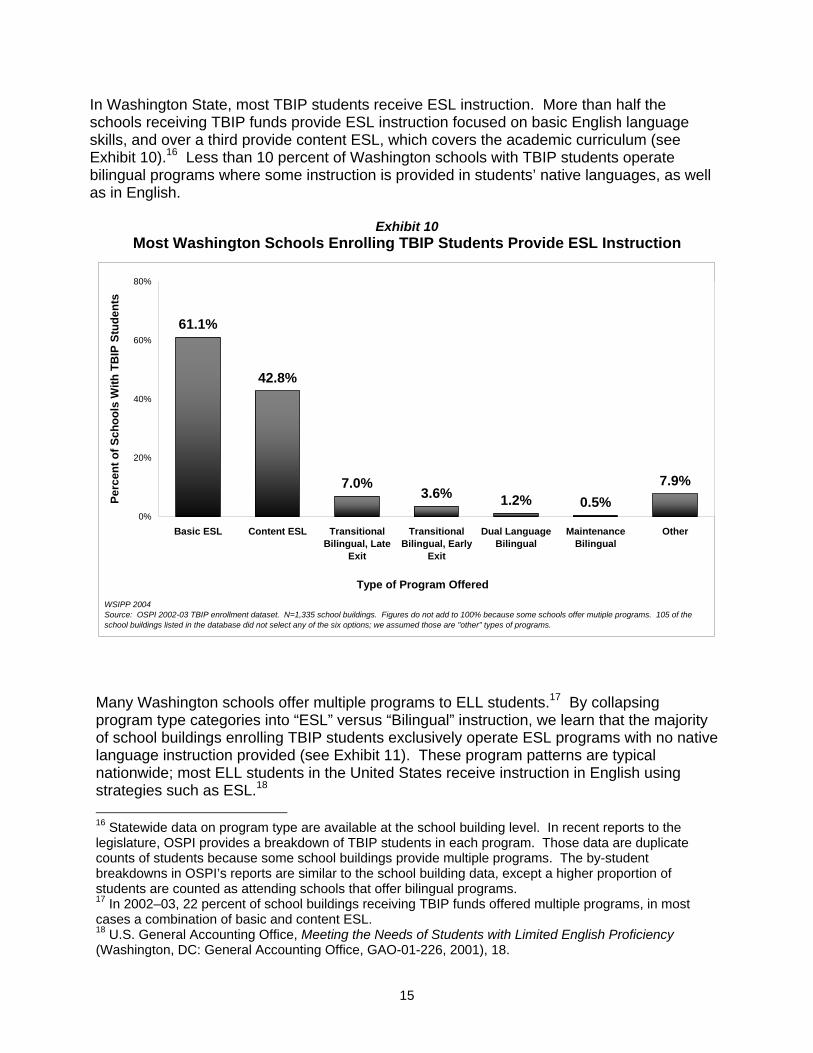
In Washington State, most TBIP students receive ESL instruction. More than half the schools receiving TBIP funds provide ESL instruction focused on basic English language skills, and over a third provide content ESL, which covers the academic curriculum (see Exhibit 10).16 Less than 10 percent of Washington schools with TBIP students operate bilingual programs where some instruction is provided in students’ native languages, as well as in English.
Exhibit 10 Most Washington Schools Enrolling TBIP Students Provide ESL Instruction
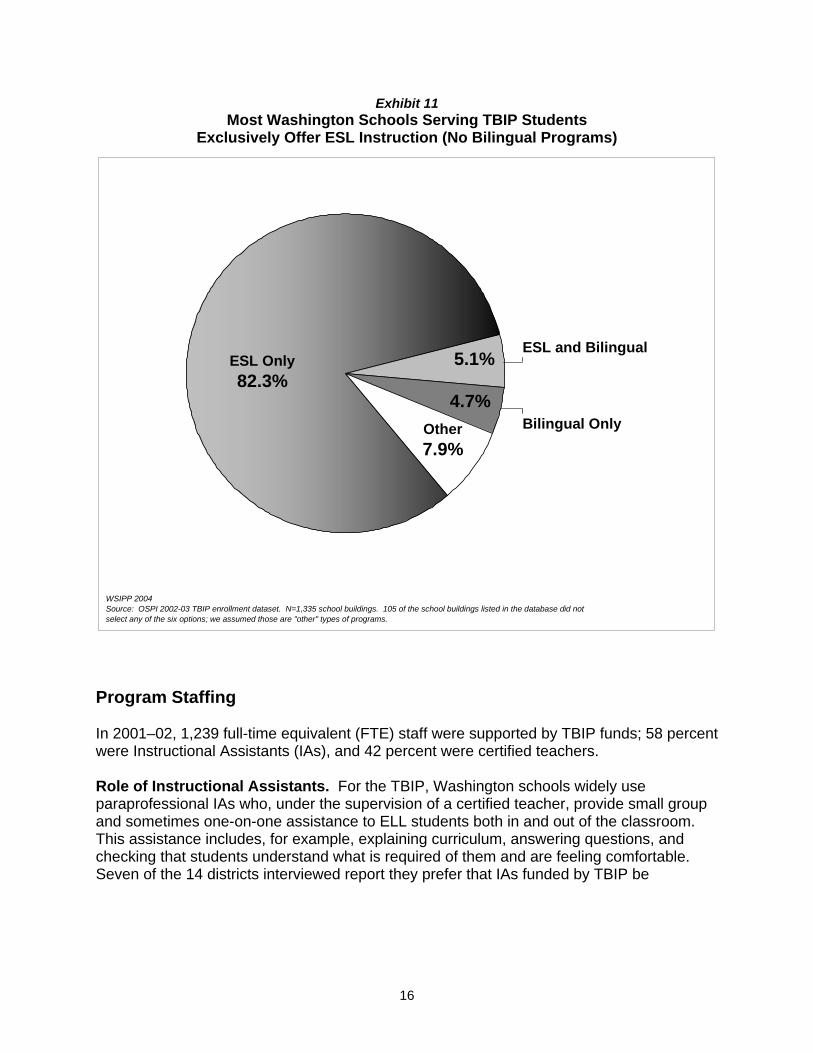
Many Washington schools offer multiple programs to ELL students.17 By collapsing program type categories into “ESL” versus “Bilingual” instruction, we learn that the majority of school buildings enrolling TBIP students exclusively operate ESL programs with no native language instruction provided (see Exhibit 11). These program patterns are typical nationwide; most ELL students in the United States receive instruction in English using strategies such as ESL.18
16 Statewide data on program type are available at the school building level. In recent reports to the legislature, OSPI provides a breakdown of TBIP students in each program. Those data are duplicate counts of students because some school buildings provide multiple programs. The by-student breakdowns in OSPI’s reports are similar to the school building data, except a higher proportion of students are counted as attending schools that offer bilingual programs. 17 In 2002–03, 22 percent of school buildings receiving TBIP funds offered multiple programs, in most cases a combination of basic and content ESL. 18 U.S. General Accounting Office, Meeting the Needs of Students with Limited English Proficiency (Washington, DC: General Accounting Office, GAO-01-226, 2001), 18.
61.1%
42.8%
7.0%3.6% 1.2% 0.5%
7.9%
0%
20%
40%
60%
80%
Basic ESL Content ESL TransitionalBilingual, Late
Exit
TransitionalBilingual, Early
Exit
Dual LanguageBilingual
MaintenanceBilingual
Other
Type of Program Offered
Perc
ent o
f Sch
ools
With
TB
IP S
tude
nts
WSIPP 2004Source: OSPI 2002-03 TBIP enrollment dataset. N=1,335 school buildings. Figures do not add to 100% because some schools offer mutiple programs. 105 of the school buildings listed in the database did not select any of the six options; we assumed those are "other" types of programs.
16
Exhibit 11 Most Washington Schools Serving TBIP Students
Exclusively Offer ESL Instruction (No Bilingual Programs)
Program Staffing In 2001–02, 1,239 full-time equivalent (FTE) staff were supported by TBIP funds; 58 percent were Instructional Assistants (IAs), and 42 percent were certified teachers. Role of Instructional Assistants. For the TBIP, Washington schools widely use paraprofessional IAs who, under the supervision of a certified teacher, provide small group and sometimes one-on-one assistance to ELL students both in and out of the classroom. This assistance includes, for example, explaining curriculum, answering questions, and checking that students understand what is required of them and are feeling comfortable. Seven of the 14 districts interviewed report they prefer that IAs funded by TBIP be
WSIPP 2004Source: OSPI 2002-03 TBIP enrollment dataset. N=1,335 school buildings. 105 of the school buildings listed in the database did not select any of the six options; we assumed those are "other" types of programs.
ESL Only82.3%
5.1%
4.7%Other7.9%
Bilingual Only
ESL and Bilingual
17
bilingual.19 Many staff describe a key role of IAs as facilitating communication between the mainstream and ESL teachers, as well as among students, teachers, and parents.20 Teacher Endorsements. The pre-service preparation of teachers funded by the TBIP has increased over the last decade. In 2001–02, about half of teachers who work at least part-time in the TBIP had an ESL endorsement, up from one-third in 1992–93. About one-third had an endorsement in bilingual education, up from 23 percent nine years earlier. 21 Staff Training. By state law and federal guidelines, school districts must provide in-service training for all staff involved in the TBIP, including teaching strategies appropriate for culturally different backgrounds, curricula, assessment, and program models.22 Neither statute nor Washington Administrative Code (WAC) specifies how much training is required. Federal policy guidelines note that the professional development activities must be “of sufficient intensity and duration to have a positive and lasting impact on the teachers’ performance” 23 and exclude one-day workshops and conferences unless they are part of a more comprehensive effort. OSPI recommends districts not use federal Title III funds for staffing; instead, OSPI encourages using federal funds for training and other professional development activities, as well as purchase of materials.24 Most state TBIP funds are used for staffing, with some devoted to acquiring educational materials and providing training. Districts submit information on training provided to TBIP teachers and staff for OSPI’s annual report to the legislature. According to many district TBIP staff, effective programs ensure that all teachers have substantial training in language acquisition teaching strategies. These methods, according to those interviewed, include techniques such as pairing native English speakers with ELL students for projects, using pictures and acting out concepts, summarizing and simplifying reading material, and checking frequently to confirm students understand the information.
19 Among these seven districts, several indicated they have difficulty retaining bilingual IAs, because, due to district policy, they cannot pay them more than IAs who speak only English. One district does pay bilingual IAs at a higher rate because they serve as translators between school staff and ELL students and their parents. 20 Washington school districts do vary in their reliance on instructional assistants, with some districts using TBIP funds almost exclusively to pay IAs and others to pay only certified teachers. In some districts, part of an IA’s time may be devoted to the TBIP and the remainder to other programs. One district interviewed uses primarily certified teachers to serve ELL students but pays for them using local levy funds. 21 An ESL endorsement requires 45 quarter (30 semester) specialized course credits and fieldwork (WAC 182-80-338) and a Bilingual Endorsement requires 16 quarter (24 semester) credits and fluency in the targeted language (WAC 182-80-300). Some teachers have endorsements in both ESL and bilingual education. 22 RCW 28A.180.040 (5); and Part I: Non-Regulatory Guidance on Implementation of Title III Formula Grant Program, Elementary and Secondary Education Act, Title III, Part A, as amended by the No Child Left Behind Act of 2001, Subsection F-3, <http://www.ed.gov/print/programs/sfgp/nrgcomp.html#roles>. 23 Part I: Non-regulatory guidance on implementation of Title III formula grant program, Elementary and Secondary Education Act, Title III, Part A, as amended by the No Child Left Behind Act of 2001, Subsection F-3 <http://www.ed.gov/print/programs/sfgp/nrgcomp.html#roles>. 24 A few exceptions are made for extended-day programs. Richard Gomez, Migrant and Bilingual Education Office director, telephone interview, May 21, 2004.
18
Staff indicate that these techniques are aligned with good teaching practices in general and can be beneficial for all students. District staff interviewed describe recent increases in district training efforts, not only for TBIP staff but for all teachers and aides, with training on language acquisition strategies integrated with teaching literacy to all students. One district with a large ELL population is moving toward serving TBIP students within the mainstream classroom by offering intensive language acquisition training for all teachers. The district maintains that this approach is the only way for students to receive language assistance throughout the school day. Staffing and Program Selection. Some districts indicate that, if sufficient bilingual staff were available, they would supplement ESL with native language instruction for ELL students. Several districts have been unable to recruit certified teachers who speak the languages of TBIP students in their district. In many cases where teachers and IAs speak a student’s language, they do not have the literacy skills or academic preparation to teach in that language. Districts that have transitioned from ESL to bilingual programs caution that replacing current instructional staff with appropriately endorsed bilingual teachers must be gradual because of contractual and other issues. TBIP Student Characteristics Even more than staffing issues, student characteristics influence the types of TBIP instructional models implemented in Washington school districts, including students’:
• Grade levels;
• Native languages;
• Proficiency in English; and
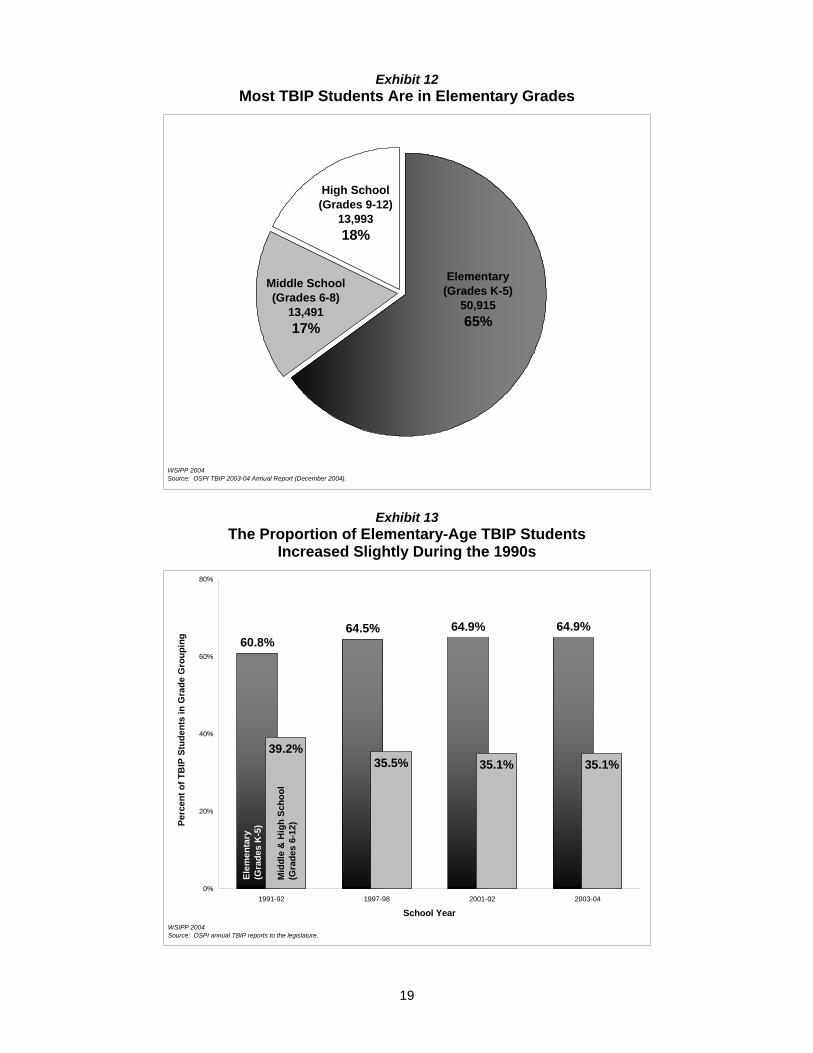
• Prior education. ELL Student Grouping by Grade Level Most Washington TBIP students are in elementary school (see Exhibit 12); this proportion has increased slightly over the past decade (see Exhibit 13).
19
Exhibit 12 Most TBIP Students Are in Elementary Grades
Middle School(Grades 6-8)
13,491 17%
High School (Grades 9-12)
13,993 18%
Elementary (Grades K-5)
50,915 65%
WSIPP 2004Source: OSPI TBIP 2003-04 Annual Report (December 2004).
Exhibit 13 The Proportion of Elementary-Age TBIP Students
Increased Slightly During the 1990s
60.8%64.5% 64.9% 64.9%
39.2%35.5% 35.1% 35.1%
0%
20%
40%
60%
80%
1991-92 1997-98 2001-02 2003-04
School Year
Perc
ent o
f TB
IP S
tude
nts
in G
rade
Gro
upin
g
WSIPP 2004Source: OSPI annual TBIP reports to the legislature.
Elem
enta
ry
(Gra
des
K-5
)
Mid
dle
& H
igh
Scho
ol
(Gra
des
6-12
)
20
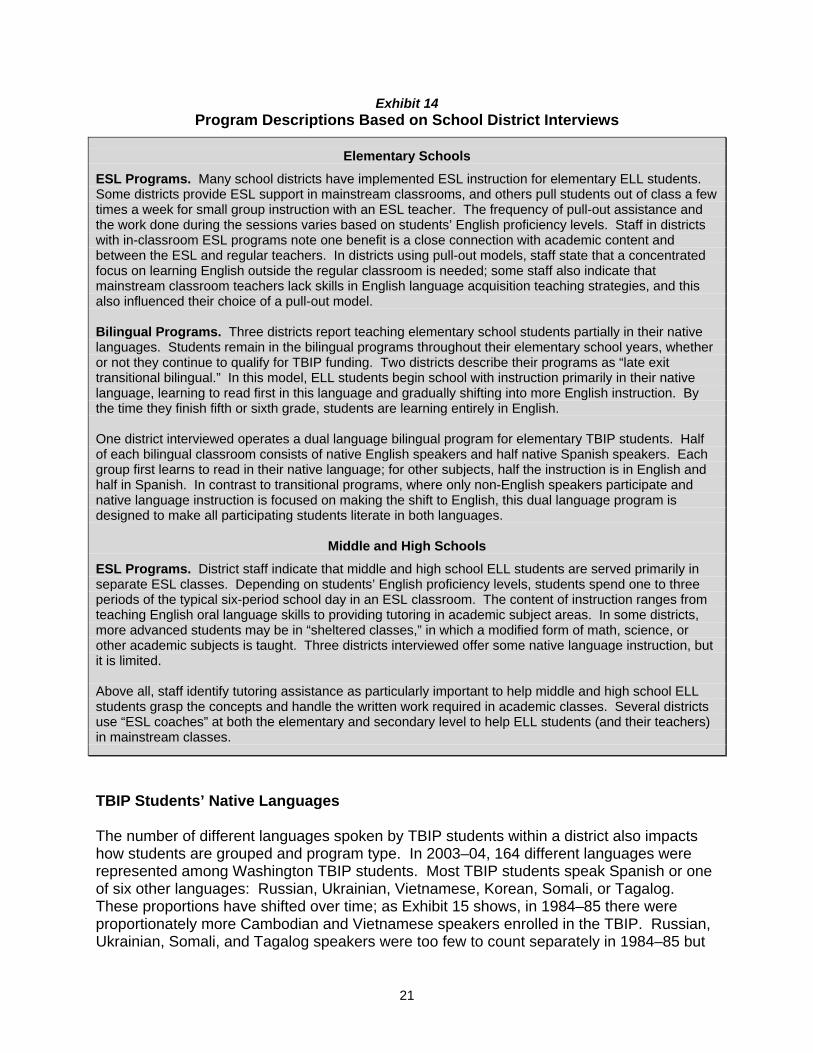
Serving Elementary Versus Middle and High School ELL Students. All school districts interviewed report using different approaches to teaching English in elementary schools versus middle and high schools. Elementary schools are more likely to operate bilingual programs with native language instruction provided to students as a class. Secondary school programs primarily use ESL instruction, either a one-on-one pull-out model or, more commonly, sending students to special classrooms for part of the day.25 District staff explain that these differences are dictated by logistics: elementary school students remain in one classroom for all or most of the day, but middle and high school students typically move from class to class for different subjects. The larger numbers of elementary-age ELL children also make it more feasible to group students for in-classroom instruction using their native languages. Exhibit 14 describes typical ESL and bilingual instructional programs at the elementary and secondary levels in Washington State, based on the 14 districts interviewed for this report (see Appendix B).
25 These grade-based instructional models are not absolute, and a variety of strategies are used in elementary and secondary schools across the state, as described in Appendix B.
21
Exhibit 14 Program Descriptions Based on School District Interviews
Elementary Schools
ESL Programs. Many school districts have implemented ESL instruction for elementary ELL students. Some districts provide ESL support in mainstream classrooms, and others pull students out of class a few times a week for small group instruction with an ESL teacher. The frequency of pull-out assistance and the work done during the sessions varies based on students’ English proficiency levels. Staff in districts with in-classroom ESL programs note one benefit is a close connection with academic content and between the ESL and regular teachers. In districts using pull-out models, staff state that a concentrated focus on learning English outside the regular classroom is needed; some staff also indicate that mainstream classroom teachers lack skills in English language acquisition teaching strategies, and this also influenced their choice of a pull-out model. Bilingual Programs. Three districts report teaching elementary school students partially in their native languages. Students remain in the bilingual programs throughout their elementary school years, whether or not they continue to qualify for TBIP funding. Two districts describe their programs as “late exit transitional bilingual.” In this model, ELL students begin school with instruction primarily in their native language, learning to read first in this language and gradually shifting into more English instruction. By the time they finish fifth or sixth grade, students are learning entirely in English. One district interviewed operates a dual language bilingual program for elementary TBIP students. Half of each bilingual classroom consists of native English speakers and half native Spanish speakers. Each group first learns to read in their native language; for other subjects, half the instruction is in English and half in Spanish. In contrast to transitional programs, where only non-English speakers participate and native language instruction is focused on making the shift to English, this dual language program is designed to make all participating students literate in both languages.
Middle and High Schools
ESL Programs. District staff indicate that middle and high school ELL students are served primarily in separate ESL classes. Depending on students’ English proficiency levels, students spend one to three periods of the typical six-period school day in an ESL classroom. The content of instruction ranges from teaching English oral language skills to providing tutoring in academic subject areas. In some districts, more advanced students may be in “sheltered classes,” in which a modified form of math, science, or other academic subjects is taught. Three districts interviewed offer some native language instruction, but it is limited. Above all, staff identify tutoring assistance as particularly important to help middle and high school ELL students grasp the concepts and handle the written work required in academic classes. Several districts use “ESL coaches” at both the elementary and secondary level to help ELL students (and their teachers) in mainstream classes.
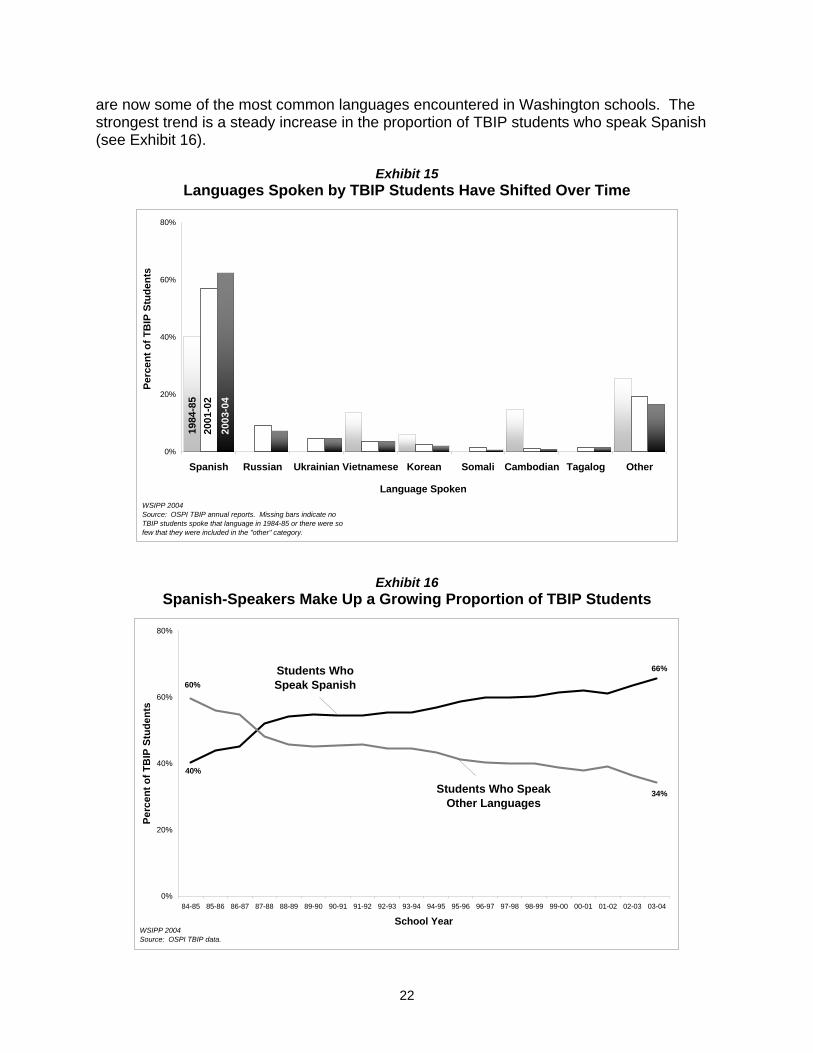
TBIP Students’ Native Languages The number of different languages spoken by TBIP students within a district also impacts how students are grouped and program type. In 2003–04, 164 different languages were represented among Washington TBIP students. Most TBIP students speak Spanish or one of six other languages: Russian, Ukrainian, Vietnamese, Korean, Somali, or Tagalog. These proportions have shifted over time; as Exhibit 15 shows, in 1984–85 there were proportionately more Cambodian and Vietnamese speakers enrolled in the TBIP. Russian, Ukrainian, Somali, and Tagalog speakers were too few to count separately in 1984–85 but
22
are now some of the most common languages encountered in Washington schools. The strongest trend is a steady increase in the proportion of TBIP students who speak Spanish (see Exhibit 16).
Exhibit 15 Languages Spoken by TBIP Students Have Shifted Over Time
0%
20%
40%
60%
80%
Spanish Russian Ukrainian Vietnamese Korean Somali Cambodian Tagalog Other
Language Spoken
Perc
ent o
f TB
IP S
tude
nts
WSIPP 2004Source: OSPI TBIP annual reports. Missing bars indicate no TBIP students spoke that language in 1984-85 or there were so few that they were included in the "other" category.
1984
-85
2003
-04
2001
-02
Exhibit 16 Spanish-Speakers Make Up a Growing Proportion of TBIP Students
0%
20%
40%
60%
80%
84-85 85-86 86-87 87-88 88-89 89-90 90-91 91-92 92-93 93-94 94-95 95-96 96-97 97-98 98-99 99-00 00-01 01-02 02-03 03-04
School Year
Perc
ent o
f TB
IP S
tude
nts
WSIPP 2004Source: OSPI TBIP data.
Students Who Speak Spanish
Students Who Speak Other Languages
60%
40%
66%
34%
23
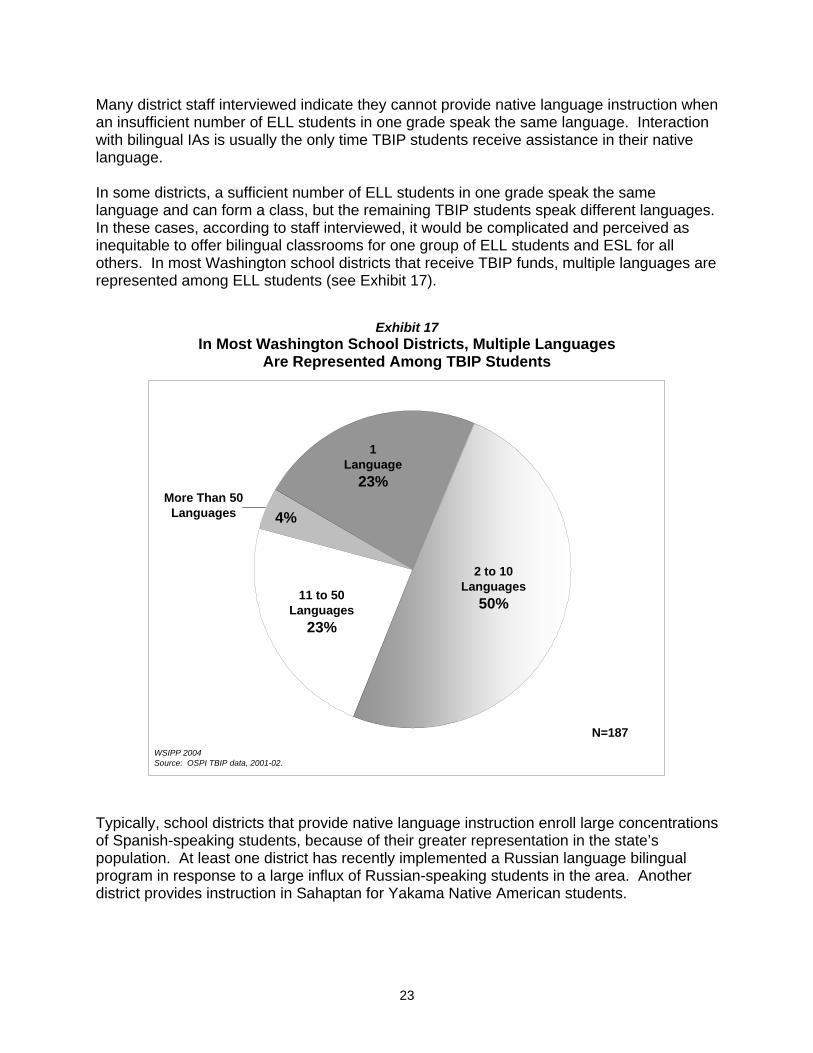
Many district staff interviewed indicate they cannot provide native language instruction when an insufficient number of ELL students in one grade speak the same language. Interaction with bilingual IAs is usually the only time TBIP students receive assistance in their native language. In some districts, a sufficient number of ELL students in one grade speak the same language and can form a class, but the remaining TBIP students speak different languages. In these cases, according to staff interviewed, it would be complicated and perceived as inequitable to offer bilingual classrooms for one group of ELL students and ESL for all others. In most Washington school districts that receive TBIP funds, multiple languages are represented among ELL students (see Exhibit 17).
Exhibit 17 In Most Washington School Districts, Multiple Languages
Are Represented Among TBIP Students
1 Language
23%
2 to 10 Languages
50%11 to 50 Languages
23%
More Than 50 Languages
WSIPP 2004Source: OSPI TBIP data, 2001-02.
N=187
4%
Typically, school districts that provide native language instruction enroll large concentrations of Spanish-speaking students, because of their greater representation in the state’s population. At least one district has recently implemented a Russian language bilingual program in response to a large influx of Russian-speaking students in the area. Another district provides instruction in Sahaptan for Yakama Native American students.
24
English Proficiency Levels Many district staff indicate they use different instructional strategies for students with low and high English proficiency levels. In comparison with their more advanced peers, students with very low English skills typically receive services that are:
• More intensive and extensive;
• In a setting outside the mainstream classroom; and
• Not linked to academic content of the schoolwide curriculum but instead focused on oral language development and basic English vocabulary.
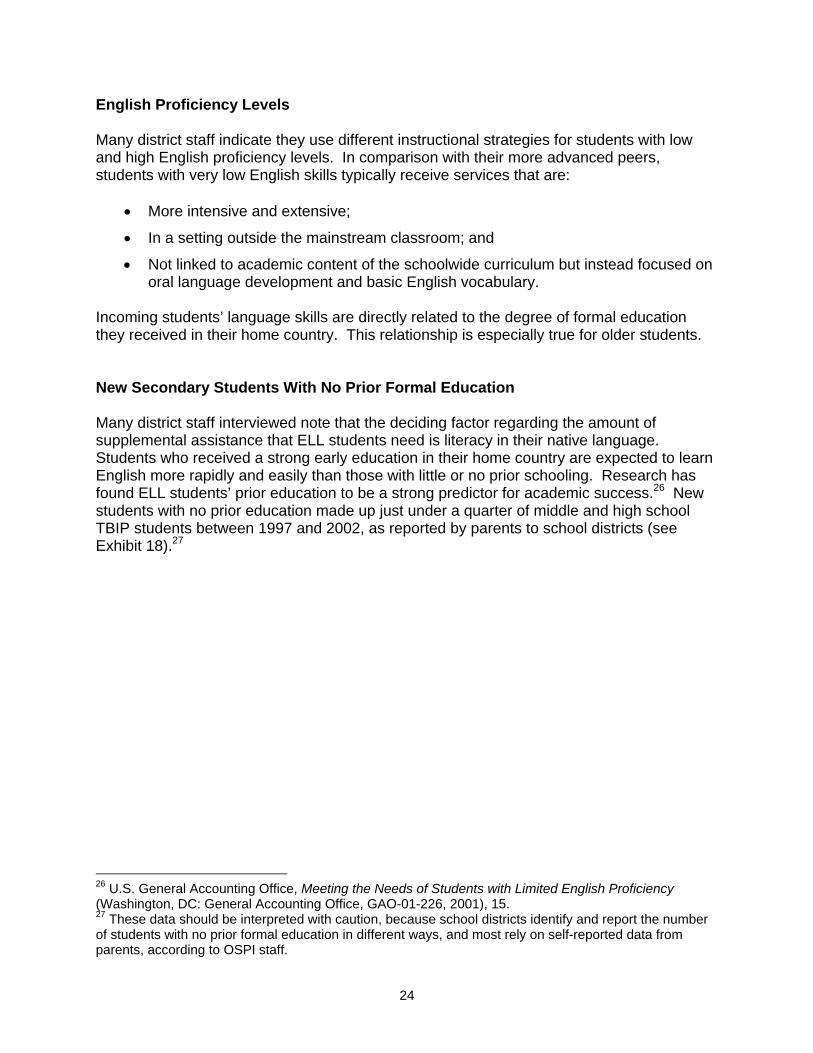
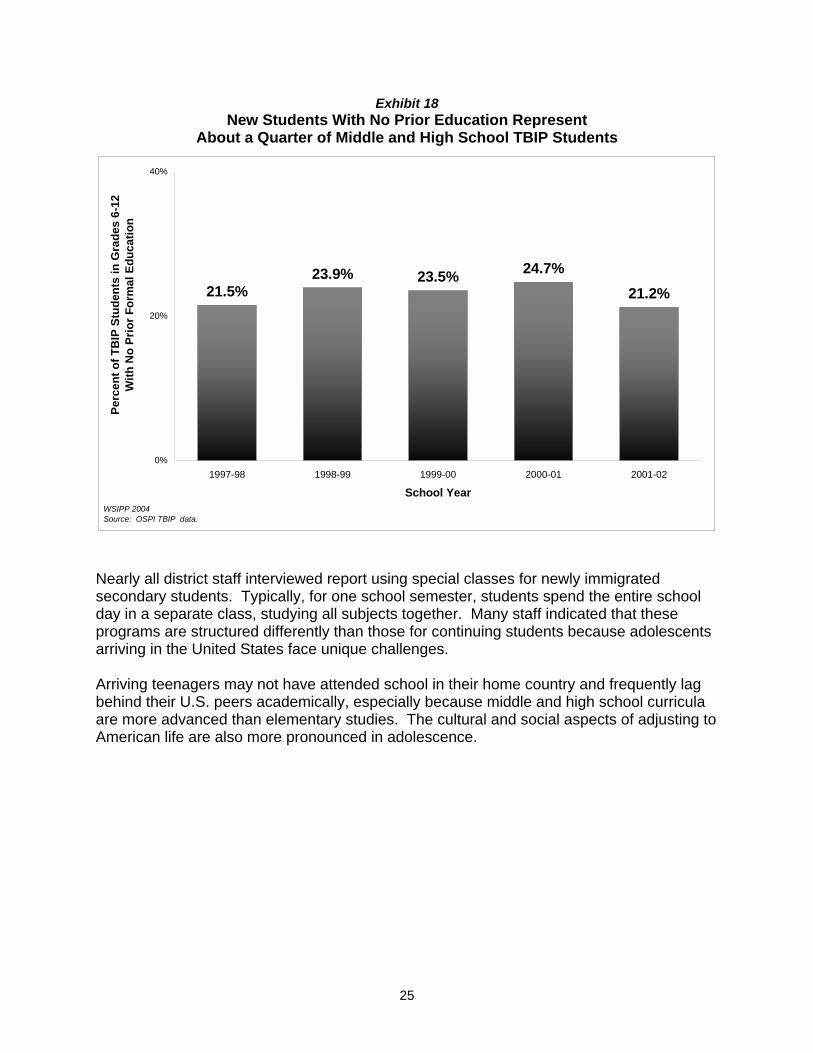
Incoming students’ language skills are directly related to the degree of formal education they received in their home country. This relationship is especially true for older students. New Secondary Students With No Prior Formal Education Many district staff interviewed note that the deciding factor regarding the amount of supplemental assistance that ELL students need is literacy in their native language. Students who received a strong early education in their home country are expected to learn English more rapidly and easily than those with little or no prior schooling. Research has found ELL students’ prior education to be a strong predictor for academic success.26 New students with no prior education made up just under a quarter of middle and high school TBIP students between 1997 and 2002, as reported by parents to school districts (see Exhibit 18).27
26 U.S. General Accounting Office, Meeting the Needs of Students with Limited English Proficiency (Washington, DC: General Accounting Office, GAO-01-226, 2001), 15. 27 These data should be interpreted with caution, because school districts identify and report the number of students with no prior formal education in different ways, and most rely on self-reported data from parents, according to OSPI staff.
25
Exhibit 18 New Students With No Prior Education Represent
About a Quarter of Middle and High School TBIP Students
21.5%23.9% 23.5% 24.7%
21.2%
0%
20%
40%
1997-98 1998-99 1999-00 2000-01 2001-02
School Year
Perc
ent o
f TB
IP S
tude
nts
in G
rade
s 6-
12W
ith N
o Pr
ior F
orm
al E
duca
tion
WSIPP 2004Source: OSPI TBIP data.
Nearly all district staff interviewed report using special classes for newly immigrated secondary students. Typically, for one school semester, students spend the entire school day in a separate class, studying all subjects together. Many staff indicated that these programs are structured differently than those for continuing students because adolescents arriving in the United States face unique challenges. Arriving teenagers may not have attended school in their home country and frequently lag behind their U.S. peers academically, especially because middle and high school curricula are more advanced than elementary studies. The cultural and social aspects of adjusting to American life are also more pronounced in adolescence.
26
Summary Trends in TBIP student enrollment, funding, programs, and staffing provide a snapshot of the TBIP as currently implemented in Washington State. Trends in Enrollment and Funding
TBIP student enrollment is growing rapidly. Per-student TBIP funding has remained flat in recent years, but growing enrollment has driven increases in state general fund expenditures.
Growing TBIP enrollment is partly explained by population growth among people who are not fluent English speakers. Enrollment growth is also due to an increasing number of students continuing in the TBIP across school years.
Instructional Methods and Student Characteristics
Most Washington schools provide ESL instruction for ELL students. ESL instruction is typically provided in small groups outside the mainstream classroom. Some schools, mainly at the elementary level, provide in-classroom ESL instruction.
To implement bilingual, or native language, instruction, school districts require sufficient numbers of ELL students in the same grades, speaking the same language, and with similar language proficiency levels. These conditions are rare among Washington State school districts. Finding qualified bilingual teachers can also be a challenge for districts interested in bilingual programs.
Elementary schools are more likely to implement bilingual programs. There are more elementary ELL students statewide, and they remain in the same classroom for the entire school day; these factors create more opportunities to group elementary students for native language instruction. At the middle and high school levels, ELL students have more varied educational backgrounds and lower English proficiency relative to their peers, and ESL is frequently deemed as the only practical approach.
Program Staffing
Over half of TBIP school staff are instructional assistants, and about 40 percent are certified teachers. IAs are widely used in the TBIP at all grade levels to provide special assistance to ELL students. Most districts interviewed prefer employing bilingual IAs to facilitate communication among students, teachers, and parents.
In recent years, more TBIP teachers have obtained endorsements in bilingual education and ESL instruction. Teacher and staff training is supported by state TBIP, federal Title III, and local district funds. Many school districts integrate language acquisition teaching strategies into schoolwide training.
The following section reviews the legal requirements for bilingual education in Washington State.
27
SECTION III: BILINGUAL EDUCATION LAW AND POLICY This section outlines the laws and policies that provide for Washington State’s transitional bilingual instructional program (TBIP), covering federal requirements and key provisions of state law, rules, and policy. Federal Requirements The requirement to provide services to ELL students emerged through a series of civil rights laws and court cases, with recent changes stemming from the federal No Child Left Behind (NCLB) Act of 2001. Civil Rights Laws and Cases Federal policy regarding services to ELL students attending public schools derives from two civil rights laws and two federal court cases.
Title VI of the Civil Rights Act of 1964 prohibits any agency that receives federal funds from discriminating on the basis of race, color, or national origin.
The Equal Educational Opportunities Act of 1974 requires states to take appropriate action to overcome barriers to ELL students’ equal participation in school instructional programs.
In the 1974 Lau v. Nichols case, the U.S. Supreme Court found that the failure of a school district to provide a specially designed program to teach English to ELL students violated their civil rights by failing to give them equal educational opportunity.
In the 1981 Casteñeda v. Pickard case, the Supreme Court outlined three criteria to determine whether a program meets the needs of ELL students. To preserve the educational rights of students learning English, a school district’s program must: (1) be based on a pedagogically sound plan, (2) have sufficient qualified teachers to implement it, and (3) after a trial period, be evaluated and either be found effective in helping language minority students learn both English and academic content areas or be modified.28
The Office of Civil Rights (OCR) in the U.S. Department of Education enforces education-related Title VI regulations, which require school districts to meet the Casteñeda standard. The regulations do not require or advocate a particular educational approach to instruct ELL students and give districts substantial flexibility in designing programs.29 28 U.S. Department of Education, Title VI Language Minority Compliance Procedures, Initially issued December 3, 1985, reissued without change April 6, 1990, <http://www.helpforschools.com/ELLKBase/legal/OCR_Language_Minority_Compliance_Procedures.shtml>. 29 U.S. Department of Education, “Questions and Answers on the Rights of Limited-English Proficient Students,” <http://www.ed.gov/print/about/offices/list/ocr/qa-ell.html>.
28
In evaluating compliance, OCR looks at such factors as whether ELL students are:
Excluded from effective participation in school;
Inappropriately identified as having disabilities;
Excluded from gifted and talented programs;30
Showing sub-par academic performance (as measured by promotion and dropout rates as well as performance on tests and other assessments); or
Consigned to programs that do not allow them to move into mainstream classes within a reasonable time frame.31
In short, federal law requires school districts that enroll ELL students to eliminate barriers to equal participation. Districts may choose what type of services to offer, but the services must be a formal program using methods that experts deem sound.32 The selected program must also have sufficient resources and be effective in helping ELL students achieve at least average academic performance levels. Recent Changes in Federal Law: The No Child Left Behind Act The aim of federal funding is for ELL students to “develop English proficiency and meet the same academic content and academic achievement standards as other children are expected to meet.”33 Title II of the NCLB Act, which went into effect in January 2002, made multiple changes to federal policy related to the education and assessment of ELL students, including the following:
• ELL students must be tested each year in reading, writing, speaking, and listening;
• ELL students must take the assessment of proficiency in meeting the state achievement standards (in Washington, this is the Washington Assessment of Student Learning or WASL);
• Only ELL students in their first year of school in the United States may be exempted from taking the state reading assessment;
• The academic test scores of ELL students must be reported separately from schoolwide averages; the test scores are used in assessing whether a school is making adequate yearly progress (AYP) in improving the skill level of all students;
• The academic test scores of former ELL students must be tracked for two years after services are discontinued; and
30 U.S. Department of Education, “Policy Update on Schools’ Obligations Toward National Origin Minority Students with Limited-English Proficiency (LEP),” Memorandum dated September 27, 1991, <http://www.ed.gov/about/offices/list/ocr/docs/lau1991.html>. 31 U.S. Department of Education, “School Assignment and Title VI in Elementary and Secondary Schools,” <http://library.lp.findlaw.com/articles/file/00020/005674/title/Subject/topic/Education_Civil%20Rights/filename/education_2_2718>. 32 U.S. Department of Education, “Questions and Answers on the Rights of Limited-English Proficient Students,” <http://www.ed.gov/print/about/offices/list/ocr/qa-ell.html>. 33 U.S. Department of Education, “Part I: Non-Regulatory Guidance on Implementation of Title III State Formula Grant Program,” Section A-1, <http://www.ed.gov/programs/sfgp/nrgcomp.html#top>.
29
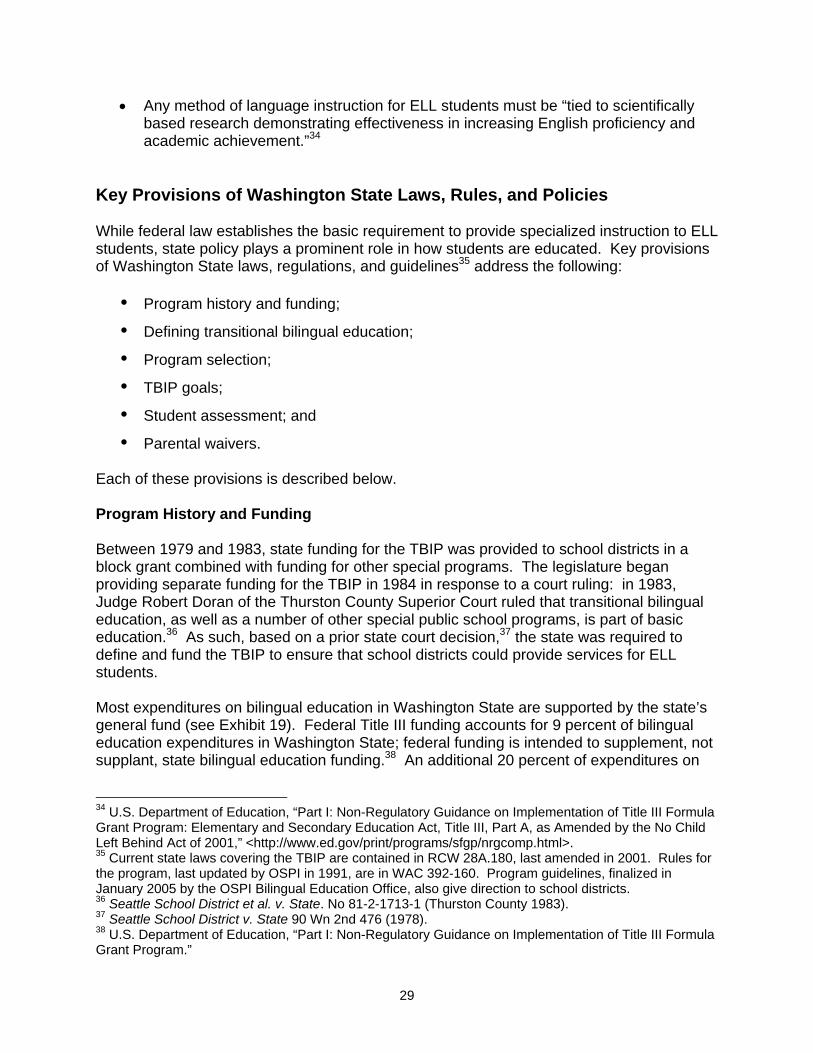
• Any method of language instruction for ELL students must be “tied to scientifically based research demonstrating effectiveness in increasing English proficiency and academic achievement.”34
Key Provisions of Washington State Laws, Rules, and Policies While federal law establishes the basic requirement to provide specialized instruction to ELL students, state policy plays a prominent role in how students are educated. Key provisions of Washington State laws, regulations, and guidelines35 address the following:
Program history and funding;
Defining transitional bilingual education;
Program selection;
TBIP goals;
Student assessment; and
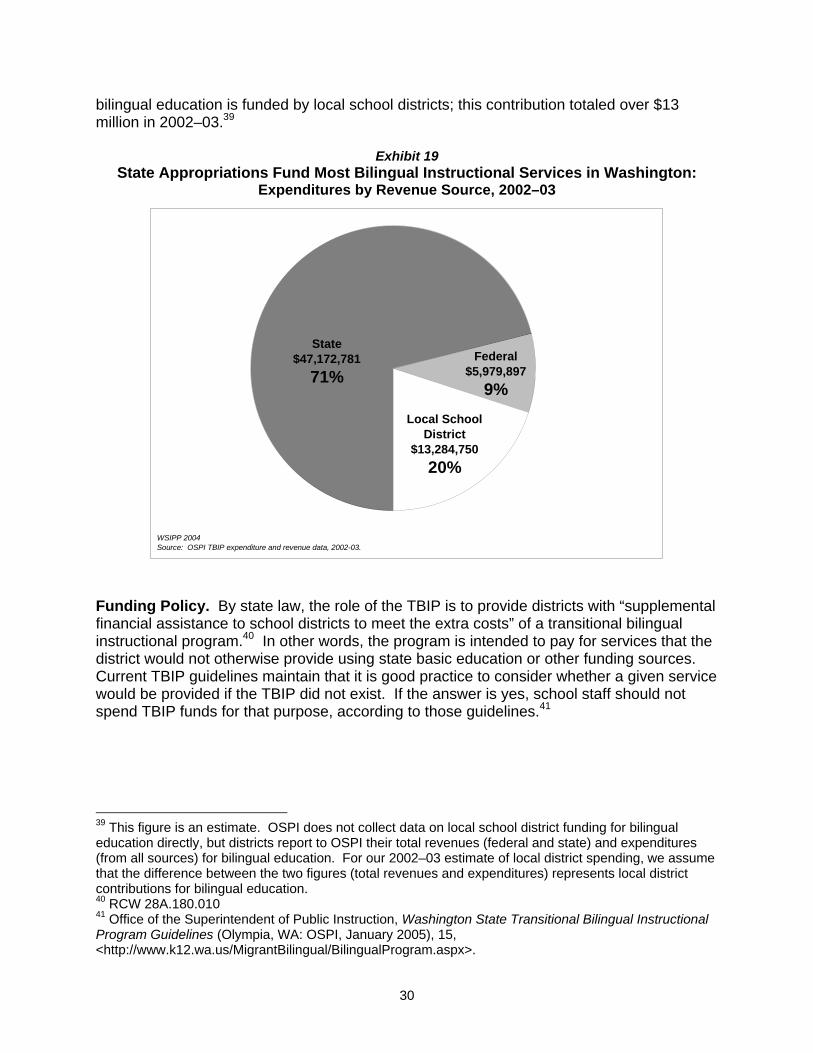
Parental waivers. Each of these provisions is described below. Program History and Funding Between 1979 and 1983, state funding for the TBIP was provided to school districts in a block grant combined with funding for other special programs. The legislature began providing separate funding for the TBIP in 1984 in response to a court ruling: in 1983, Judge Robert Doran of the Thurston County Superior Court ruled that transitional bilingual education, as well as a number of other special public school programs, is part of basic education.36 As such, based on a prior state court decision,37 the state was required to define and fund the TBIP to ensure that school districts could provide services for ELL students. Most expenditures on bilingual education in Washington State are supported by the state’s general fund (see Exhibit 19). Federal Title III funding accounts for 9 percent of bilingual education expenditures in Washington State; federal funding is intended to supplement, not supplant, state bilingual education funding.38 An additional 20 percent of expenditures on
34 U.S. Department of Education, “Part I: Non-Regulatory Guidance on Implementation of Title III Formula Grant Program: Elementary and Secondary Education Act, Title III, Part A, as Amended by the No Child Left Behind Act of 2001,” <http://www.ed.gov/print/programs/sfgp/nrgcomp.html>. 35 Current state laws covering the TBIP are contained in RCW 28A.180, last amended in 2001. Rules for the program, last updated by OSPI in 1991, are in WAC 392-160. Program guidelines, finalized in January 2005 by the OSPI Bilingual Education Office, also give direction to school districts. 36 Seattle School District et al. v. State. No 81-2-1713-1 (Thurston County 1983). 37 Seattle School District v. State 90 Wn 2nd 476 (1978). 38 U.S. Department of Education, “Part I: Non-Regulatory Guidance on Implementation of Title III Formula Grant Program.”
30
bilingual education is funded by local school districts; this contribution totaled over $13 million in 2002–03.39
Exhibit 19 State Appropriations Fund Most Bilingual Instructional Services in Washington:
Expenditures by Revenue Source, 2002–03
WSIPP 2004Source: OSPI TBIP expenditure and revenue data, 2002-03.
Local SchoolDistrict
$13,284,75020%
State$47,172,781
71%Federal
$5,979,8979%
Funding Policy. By state law, the role of the TBIP is to provide districts with “supplemental financial assistance to school districts to meet the extra costs” of a transitional bilingual instructional program.40 In other words, the program is intended to pay for services that the district would not otherwise provide using state basic education or other funding sources. Current TBIP guidelines maintain that it is good practice to consider whether a given service would be provided if the TBIP did not exist. If the answer is yes, school staff should not spend TBIP funds for that purpose, according to those guidelines.41
39 This figure is an estimate. OSPI does not collect data on local school district funding for bilingual education directly, but districts report to OSPI their total revenues (federal and state) and expenditures (from all sources) for bilingual education. For our 2002–03 estimate of local district spending, we assume that the difference between the two figures (total revenues and expenditures) represents local district contributions for bilingual education. 40 RCW 28A.180.010 41 Office of the Superintendent of Public Instruction, Washington State Transitional Bilingual Instructional Program Guidelines (Olympia, WA: OSPI, January 2005), 15, <http://www.k12.wa.us/MigrantBilingual/BilingualProgram.aspx>.
31
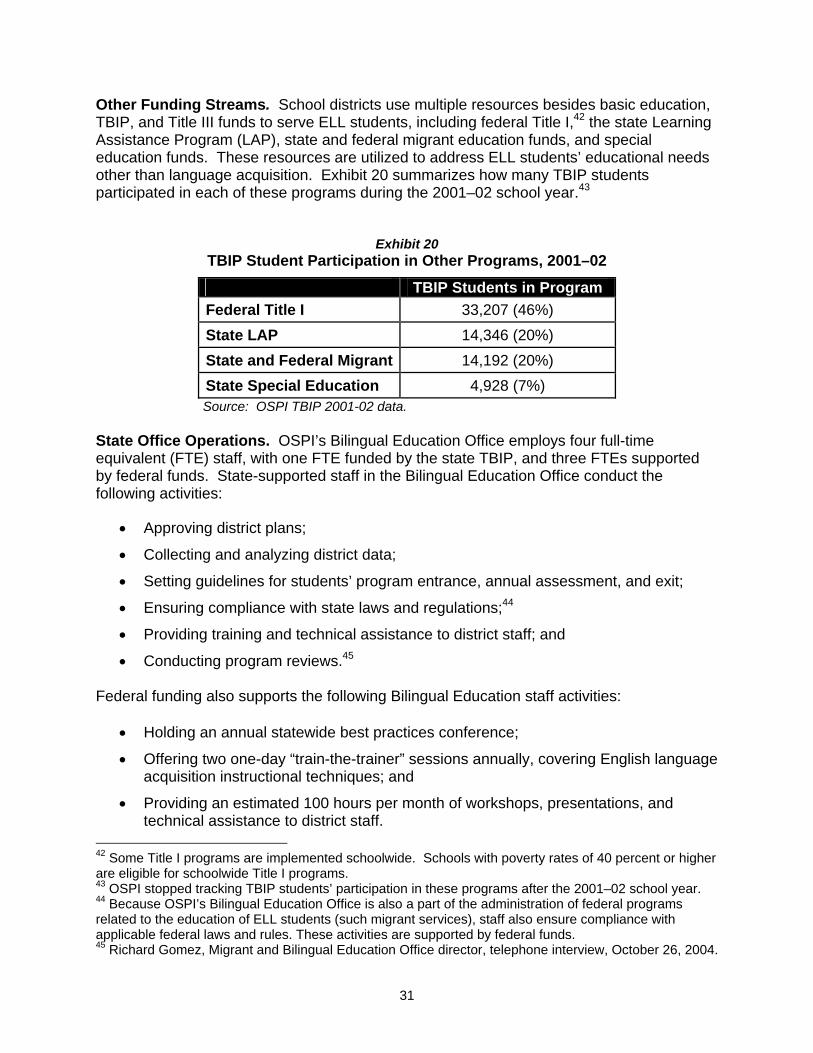
Other Funding Streams. School districts use multiple resources besides basic education, TBIP, and Title III funds to serve ELL students, including federal Title I,42 the state Learning Assistance Program (LAP), state and federal migrant education funds, and special education funds. These resources are utilized to address ELL students’ educational needs other than language acquisition. Exhibit 20 summarizes how many TBIP students participated in each of these programs during the 2001–02 school year.43
Exhibit 20 TBIP Student Participation in Other Programs, 2001–02
TBIP Students in Program Federal Title I 33,207 (46%) State LAP 14,346 (20%) State and Federal Migrant 14,192 (20%) State Special Education 4,928 (7%) Source: OSPI TBIP 2001-02 data.
State Office Operations. OSPI’s Bilingual Education Office employs four full-time equivalent (FTE) staff, with one FTE funded by the state TBIP, and three FTEs supported by federal funds. State-supported staff in the Bilingual Education Office conduct the following activities:
• Approving district plans;
• Collecting and analyzing district data;
• Setting guidelines for students’ program entrance, annual assessment, and exit;
• Ensuring compliance with state laws and regulations;44
• Providing training and technical assistance to district staff; and
• Conducting program reviews.45 Federal funding also supports the following Bilingual Education staff activities:
• Holding an annual statewide best practices conference;
• Offering two one-day “train-the-trainer” sessions annually, covering English language acquisition instructional techniques; and
• Providing an estimated 100 hours per month of workshops, presentations, and technical assistance to district staff.
42 Some Title I programs are implemented schoolwide. Schools with poverty rates of 40 percent or higher are eligible for schoolwide Title I programs. 43 OSPI stopped tracking TBIP students’ participation in these programs after the 2001–02 school year. 44 Because OSPI’s Bilingual Education Office is also a part of the administration of federal programs related to the education of ELL students (such migrant services), staff also ensure compliance with applicable federal laws and rules. These activities are supported by federal funds. 45 Richard Gomez, Migrant and Bilingual Education Office director, telephone interview, October 26, 2004.
32
Defining Bilingual Education In Washington State law, “transitional bilingual instruction” is defined to include both bilingual education and, when necessary, ESL instruction. Bilingual education is defined as “a system of instruction which uses two languages, one of which is English, as a means of instruction to build upon and expand language skills to enable the pupil to achieve competency in English. Concepts are introduced in the primary language and reinforced in the second language.”46 Instruction in students’ primary, or native, languages is intended to help students transition to English. State law also allows for English as a Second Language methods where bilingual instruction is not feasible: “In those cases in which the use of two languages is not practicable, as established by the superintendent of public instruction and unless otherwise prohibited by law, an alternative system of instruction which may include English as a second language”47 may be substituted. ESL instruction is provided in English; teachers adapt the language to match students’ English proficiency levels, using specific techniques to communicate and teach.48 The option of using ESL in lieu of instruction in the student’s native language was added to the TBIP statute in 1984. Applicable WAC specifies situations in which a district may offer an alternative (i.e., not bilingual) program, including when:
• The distribution of ELL students among schools and grade levels is such that implementing a bilingual program would substantially impair students’ basic education;
• Teachers trained in bilingual education and fluent in students’ native language(s) are unavailable, despite reasonable efforts to recruit them;
• The district has been unable to obtain necessary instructional material; or
• An influx of ELL students has temporarily exceeded the district’s bilingual program capacity.49
Program Selection: School District Discretion In adopting rules governing the TBIP, state statute directs OSPI to give school districts flexibility to select the type of bilingual or ESL program they will implement: “The rules shall be designed to maximize the role of school districts in selecting programs appropriate to meet the needs of eligible students.”50
46 RCW 28A.180.030(1)(a) 47 RCW 28A.180.030(1)(b) 48 Such techniques include the use of visuals, props, and body language, in addition to modifying the vocabulary, grammar, and pace of speech. T. Grundy, “ESL/Bilingual Education: Policies, Programs, and Pedagogy,” Oregon School Study Council Bulletin 36, no. 4 (1992): 15. 49 WAC 392-160-040 50 RCW 28A.180.060 (2)
33
In interviews, OSPI staff state that on the basis of this statutory language, they do not have the authority to deny funding for districts’ TBIP services, unless a district application is incomplete or inaccurate.51 Staff note, however, that school districts are expected to provide documentation in students’ files explaining the reasons why “alternative” services (i.e., not native language instruction) are provided. Some district programs are reviewed on-site by OSPI staff and recommendations are made for improvements. Staff indicate that these reviews are time-intensive and their other responsibilities limit their opportunity for reviews. During the 2003–04 school year, OSPI staff completed reviews of three district programs. Neither statute, WAC, nor policy guidance currently specifies a minimum number of hours per week that TBIP students are to receive services. OSPI staff plan to establish a standard when applicable WACs are updated in 2005. OSPI Recommended Models. OSPI staff recommend districts follow “best practices.” This recommendation is based on the NCLB Act requirement that instructional models be “research-based.”52 OSPI staff encourage districts to use what they deem as the most effective instructional model that is feasible given a district’s demographics and resources; state staff provide technical assistance to school districts in identifying and implementing effective programs. The OSPI Migrant and Bilingual Education director in his presentations to schools has encouraged two models for educating students who are learning English:53
• In schools where ELL students come from a variety of language backgrounds, OSPI recommends content ESL, that is, instruction in English that uses specialized teaching strategies for English language development, the substance of which is based on the mainstream academic curriculum.
• In areas where ELL students come from a single language background, OSPI recommends instruction in students’ native language along with content ESL (i.e., transitional or dual programs).
51 “Each application that is submitted as required by and pursuant to this chapter shall be approved: Provided, That approval of an application may be withheld in whole or part in the event the superintendent of public instruction deems it necessary to ascertain the completeness and accuracy of the application.” WAC 392-160-029 (1) 52 U.S. Department of Education, “Part I: Non-Regulatory Guidance on Implementation of Title III Formula Grant Program: Elementary and Secondary Education Act, Title III, Part A, as Amended by the No Child Left Behind Act of 2001,” <http://www.ed.gov/print/programs/sfgp/nrgcomp.html>. 53 See, for example, R. Gomez, “Journey to the 21st Century Citizen: The ABCs of Closing the Achievement Gap for English Language Learners,” PowerPoint presentation (Olympia, WA: OSPI, January 2002), <http://www.k12.wa.us/MigrantBilingual/presentations.aspx>.
34
Authorized Programs in Other States. Forty states have legislative provisions regarding instruction for ELL students in public K–12 schools. In statute, most of these states do not specify the type of instructional program to be provided or, like Washington, mention bilingual (i.e., native language) instruction only generally. Three states—California, Arizona, and Massachusetts—specifically authorize use of sheltered English immersion, i.e., content-based ESL. Appendix C includes a description of California’s recent experiences with requiring school districts to implement short-term sheltered English immersion programs for ELL students. Program Goals The NCLB Act defines goals for ELL students that include general academic achievement: “The major goals of Title III are to help ensure that limited English proficient (LEP) children attain English proficiency, develop high levels of academic competence in English and meet the same challenging State academic content and student academic achievement standards that all students are expected to meet.”54 Sections of Washington’s TBIP statute differ in the defined aim of bilingual education. Some parts suggest the goal is solely to teach the English language while another indicates a broader purpose—to assist ELL students in mastering academic content areas, such as math, reading, writing, science, and social studies, in addition to learning English. Emphasis on English Proficiency Alone. The TBIP statute section dealing with the responsibilities of school boards mandates that school districts offer a program “to achieve [students’] competency in English” and each year “measure each eligible pupil’s improvement in learning the English language.”55 Emphasis on Both English Language and Overall Academic Proficiency. In contrast, a TBIP statute section adopted in 2001 directs OSPI to develop an evaluation system to assess “increases in the English and academic proficiency of students” with the purpose of informing schools, districts, parents, and the state about the effectiveness of the TBIP in “teaching these students English and other content areas, such as mathematics and writing.”56 This statutory language suggests program goals encompass both acquisition of English language skills and overall academic achievement. In program guidelines issued to school districts, OSPI adopts the broader focus: “The main goal of the Transitional Bilingual Instructional Program is to develop English language proficiency while maintaining academics at grade level.”57 Nationwide Debate. The inconsistency in Washington statutes regarding TBIP goals reflects a nationwide debate over whether ELL students should be taught in English only or, where feasible, partially in their native language. One author described this debate as
54 U.S. Department of Education, “Part II: Final Non-Regulatory Guidance on the Title III State Formula Grant Program–Standards, Assessments and Accountability,” <http://www.ed.gov/programs/nfdp/NRG1.2.25.03.doc>, 5 55 RCW 28A.180.040 (1) and (4) 56 RCW 28A.180.090 (3) 57 OSPI, Washington State Transitional Bilingual Instructional Program Guidelines, 1.
35
political and cultural, rather than based on evidence of what works best.58 A group of prominent researchers summarized research on bilingual education and concluded that this debate is related to broader societal questions, including whether to establish English as the official language of the United States and whether the country intends to preserve multiculturalism.59 These researchers also noted that political questions cannot be answered through evaluation research. If the ultimate goal for all students is academic success, many researchers have concluded the critical question is how effectively instructional programs “promote all-around cognitive development. The speed of English acquisition matters less than its quality—whether it provides a solid foundation for future academic achievement.”60 TBIP Student Assessment State-mandated assessments of TBIP students address both oral language and academic proficiency. State rules require that school districts ask families registering new students what language their child speaks.61 This “home language survey” must be available to the family in its native language whenever possible and must ask two questions:62
1. Is a language other than English spoken in your home?
2. Does your child speak a language other than English? If the answer to either of these questions is yes, the student must be tested for TBIP eligibility.63 Entry Criterion: Oral Language Proficiency. The criterion for entry into the TBIP is scoring below a certain point on one of two OSPI-approved tests of English oral language proficiency. Program guidelines specify the approved tests: Language Assessment Scales–Oral (LAS-O) and Language Proficiency Test Series–Oral (LPTS-O).64 These tests are also frequently used by districts to meet the federal requirement for annual testing of all students’ speaking and listening skills. Exit Criteria: Reading and Writing. By state law, OSPI is charged with setting the criteria by which students exit the TBIP. Prior to 2002, OSPI rules established the exit criterion as
58 R.P. Porter, Forked Tongue: The Politics of Bilingual Education (New York: Basic Books, 1990), 11. 59 D. August and K. Hakuta, eds, Improving Schooling for Language-Minority Children: A Research Agenda (Washington, DC: National Academy Press, 1997), 14. 60 J. Crawford, Bilingual Education: History, Politics, Theory and Practice, 2nd edition (Los Angeles: Bilingual Education Services, 1991), 91. 61 WAC 392-160-015 62 OSPI, Transitional Bilingual Instructional Program Guidelines, 5. 63 There are some inconsistencies between RCW, WAC, and TBIP guidelines regarding program entrance assessments. Statute directs OSPI to require districts to assess students for program entrance within ten days of school registration; WAC states this must happen within 20 days of registration; and TBIP guidelines specify ten days. OSPI staff are waiting for legislative approval for a TBIP student evaluation system, which they intend to seek during the 2005 legislative session, before updating the WAC to match statute and program guidelines. 64 To be eligible for the TBIP, students must score at Level 1 on the LPTS or Level 1, 2, or 3 on the LAS-O. OSPI, Transitional Bilingual Instructional Program Guidelines, 5.
36
scoring above the 35th percentile on the reading and language arts portions of any nationally normed standardized test.65 Since the spring of 2002, the Washington Language Proficiency Test (WLPT) has been the primary basis for determining when students no longer need and are no longer eligible for the TBIP. Students who meet the WASL reading proficiency standard and attain a certain scale score on the WASL writing test are also no longer eligible for the program.66 District staff interviewed understand the criteria and process for TBIP students’ entry and exit. When asked how they decide whether a student qualifies for the program, they described the procedures explained above. Staff report they find the WLPT a useful tool for determining what services students need and measuring progress. Annual Evaluation of Students’ English and Academic Proficiency: New Federal Law Overtakes State Policy Development. In 2001, the Legislature directed OSPI to review the criteria used to determine when ELL students should be required to take the WASL, as well as when districts should include these students’ test scores in overall school results.67 OSPI’s subsequent report, which encouraged a broad exemption policy for ELL students, was submitted a few months after the NCLB Act went into effect. NCLB requires, as a condition of accepting Title III funds, annual assessment of the English and academic proficiency of ELL students and the inclusion of ELL students’ test scores in schoolwide results for assessment of schools’ adequate yearly progress (AYP). Many school district staff interviewed describe positive impacts from including ELL students’ WASL scores in determining schools’ AYP. Staff indicate that by making ELL student performance a part of accountability standards, regular classroom teachers pay more attention to ELL students’ academic needs. The 2001 legislation also required OSPI to develop an evaluation system to measure improvements in English language and academic proficiency of current and former TBIP students. OSPI was directed to report to the legislature regarding the evaluation system and receive approval and funding before its implementation. The 2003–05 state operating budget adopted in 2003 provided $70,000 for OSPI to develop the tracking system.68
65 WAC 392-160-035 (3) 66 On the WLPT, students must score Level 4 in reading and Level 3 in writing to exit the TBIP. On the WASL, students much reach a reading proficiency Level of 3 or a scale score of 400 and a 7 (grades 4 and 7) or 13 (grade 10) in writing. OSPI, Transitional Bilingual Instructional Program Guidelines, 8. 67 Terry Bergeson, Bob Harmon, and Richard Gomez, Exemption and Reporting Criteria and the Development of an Evaluation System for Students Enrolled in the State Transitional Bilingual Education Program: A Report to the Legislature in Response to ESSHB 2025 Chapter 6, 2001 Laws, 1st Special Session (Olympia, WA: OSPI, January 2003), 2, <http://www.k12.wa.us/MigrantBilingual/pubdocs/bilingualRpt2003.pdf>. 68 Chapter 25, Laws of 2003, 1st Special Session, Section 514 (3). In a 2003 report to the Legislature, OSPI noted it would seek approval from the legislature before fully implementing the evaluation system. Ibid., 13.
37
Parental Waivers OSPI guidelines also provide for a parental waiver process.69 According to district staff interviewed, some parents express concern that their child will never fully transition to English if placed in intensive bilingual or ESL programs. In these situations, parents can request to waive their child from TBIP participation. District staff meet with parents of new students to explain the provided services. After conferencing, most parents agree to their child’s participation in the TBIP. In 2002–03, parents received waivers for 321 TBIP-eligible students, less than half of 1 percent of TBIP students statewide. According to district staff interviewed, some parents prefer their children attend the neighborhood school, and this choice can impact district-wide ELL student services. Although there might be enough ELL students in one grade who speak the same language within district boundaries, parental preference for neighborhood schools can prevent districts from implementing a single-school magnet program that groups ELL students. High school social and academic pressures can also influence waivers. One school district interviewed indicated that 10 to 20 percent of high school TBIP-eligible students in their district request waivers for themselves because they want to challenge themselves in more rigorous classes and be a part of the regular classroom. Summary State and federal laws and policies establish requirements and provide guidelines for schools serving ELL students. Federal Law and Policy
Since 1974, federal law and policy have required public schools to provide ELL students with specialized instruction intended to ensure equal access to the educational curriculum.
The 2001 NCLB Act created new requirements for ELL student instruction, including more rigorous student assessment and tracking and the use of research-based instructional programs.
State Funding
State TBIP funding provides for staffing, training, and purchasing of materials for ELL student services. The state general fund supports approximately 70 percent of bilingual instruction in Washington; federal Title III funds about 10 percent, and local
69 Districts must notify parents when their child’s performance on language assessments makes the child eligible for the TBIP. Parents have the right to waive services for their child, but the district must hold a conference with the child’s parents or guardians, during which teachers describe the services offered. OSPI, Transitional Bilingual Instructional Program Guidelines, 14.
38
school districts contribute 20 percent. In 2002–03, these funding sources combined provided $66 million for instructional services for ELL students in Washington.
State Law and Policy
Washington State law authorizes the implementation of bilingual education for ELL students, which is defined as using two languages in instruction, English and the student’s native language. State law also allows for ESL programs where bilingual instruction is not feasible. ESL instruction is conducted entirely in English, with vocabulary and academic content adapted to students’ English proficiency levels.
School districts can select the type of program for ELL students. OSPI staff provide technical assistance and training to help districts identify and implement effective programs.
The state’s goals for the TBIP are not consistent in statute. Some sections of the TBIP statute focus exclusively on English language acquisition, while others emphasize students’ overall academic performance. This inconsistent emphasis reflects a nationwide debate on the use of non-English languages in the classroom. Most federal and state laws and policies support the goals of developing students’ language and general academic abilities.
All Washington schools are required to ask parents of newly enrolled students whether languages other than English are used in the home. If so, students are tested for English oral language proficiency; those scoring low are eligible for the TBIP. Scoring above a certain threshold on the WLPT or WASL determines when students are no longer eligible for the program. Many staff interviewed note that including ELL students’ WASL scores in determining schools’ AYP has created a schoolwide focus on ensuring ELL students’ academic success.
Parents can choose to waive their children from TBIP services. Parents who request waivers typically do so because they do not approve of the type of services provided or they prefer their children attend the neighborhood school. Few parents request waivers; only 0.4 percent of eligible students were waived from TBIP in 2002–03.
39
SECTION IV: EFFECTIVENESS AND DURATION OF THE TBIP This section analyzes data and reviews research addressing the two recurring questions regarding instruction for ELL students:
1. What instructional programs are effective in improving ELL students’ academic and language acquisition outcomes; and
2. How long does it typically take ELL students to develop English language skills sufficient for academic success?
Program Effectiveness Program effectiveness is defined and measured in terms of ELL student academic outcomes. Analysis of ELL Student Outcomes Data Academic outcomes for Washington ELL students include the following measurements:
Graduation and transition rates;
WLPT scores; and
Performance on the WASL. State district-level data on these outcomes are presented below. Graduation and Transition Rates. Exhibit 21 presents TBIP student graduation and transition rates. Over five years, discernible, although weak, trends emerged:
Decrease in transition rates (proportionately fewer TBIP students testing out of the program);
Increase in retention rates (proportionately more TBIP students remaining at the same grade);
Increase in promotion rates (proportionately more TBIP students being promoted to the next grade);
Decrease in the high school dropout rate; and
Fluctuation in the high school graduation rate.
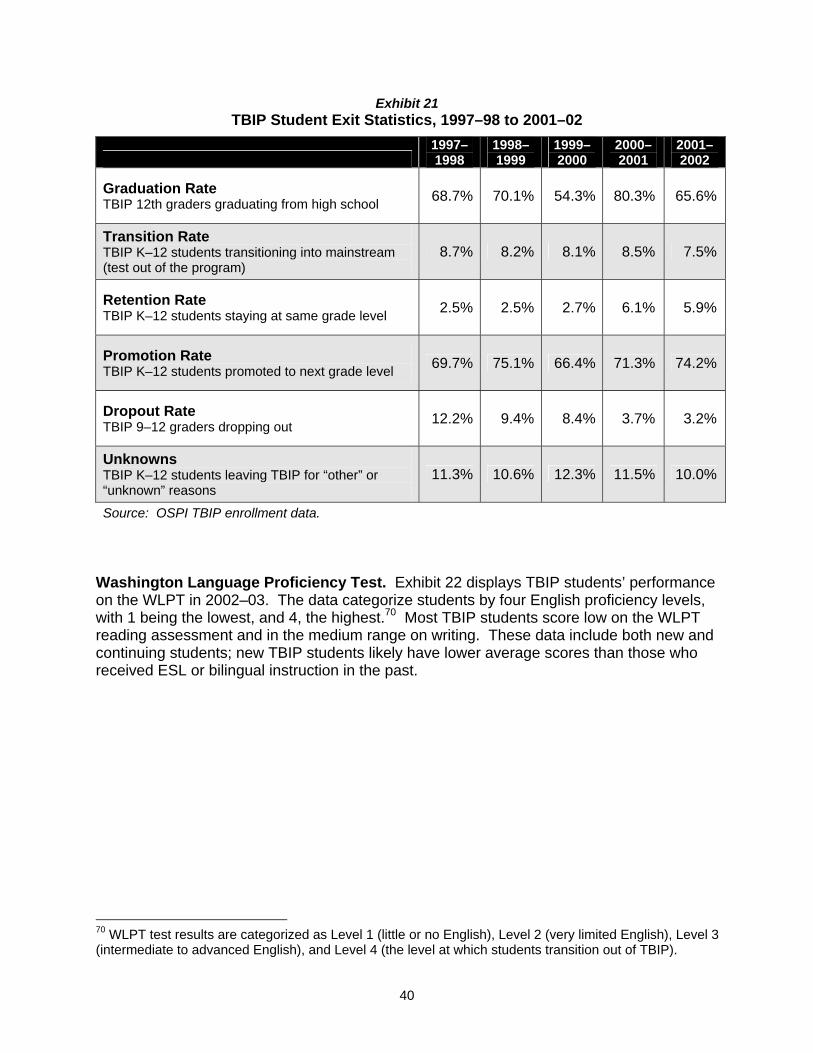
40
Exhibit 21 TBIP Student Exit Statistics, 1997–98 to 2001–02
1997–1998
1998–1999
1999–2000
2000–2001
2001–2002
Graduation Rate TBIP 12th graders graduating from high school 68.7% 70.1% 54.3% 80.3% 65.6%
Transition Rate TBIP K–12 students transitioning into mainstream (test out of the program)
8.7% 8.2% 8.1% 8.5% 7.5%
Retention Rate TBIP K–12 students staying at same grade level 2.5% 2.5% 2.7% 6.1% 5.9%
Promotion Rate TBIP K–12 students promoted to next grade level 69.7% 75.1% 66.4% 71.3% 74.2%
Dropout Rate TBIP 9–12 graders dropping out 12.2% 9.4% 8.4% 3.7% 3.2%
Unknowns TBIP K–12 students leaving TBIP for “other” or “unknown” reasons
11.3% 10.6% 12.3% 11.5% 10.0%
Source: OSPI TBIP enrollment data. Washington Language Proficiency Test. Exhibit 22 displays TBIP students’ performance on the WLPT in 2002–03. The data categorize students by four English proficiency levels, with 1 being the lowest, and 4, the highest.70 Most TBIP students score low on the WLPT reading assessment and in the medium range on writing. These data include both new and continuing students; new TBIP students likely have lower average scores than those who received ESL or bilingual instruction in the past.
70 WLPT test results are categorized as Level 1 (little or no English), Level 2 (very limited English), Level 3 (intermediate to advanced English), and Level 4 (the level at which students transition out of TBIP).
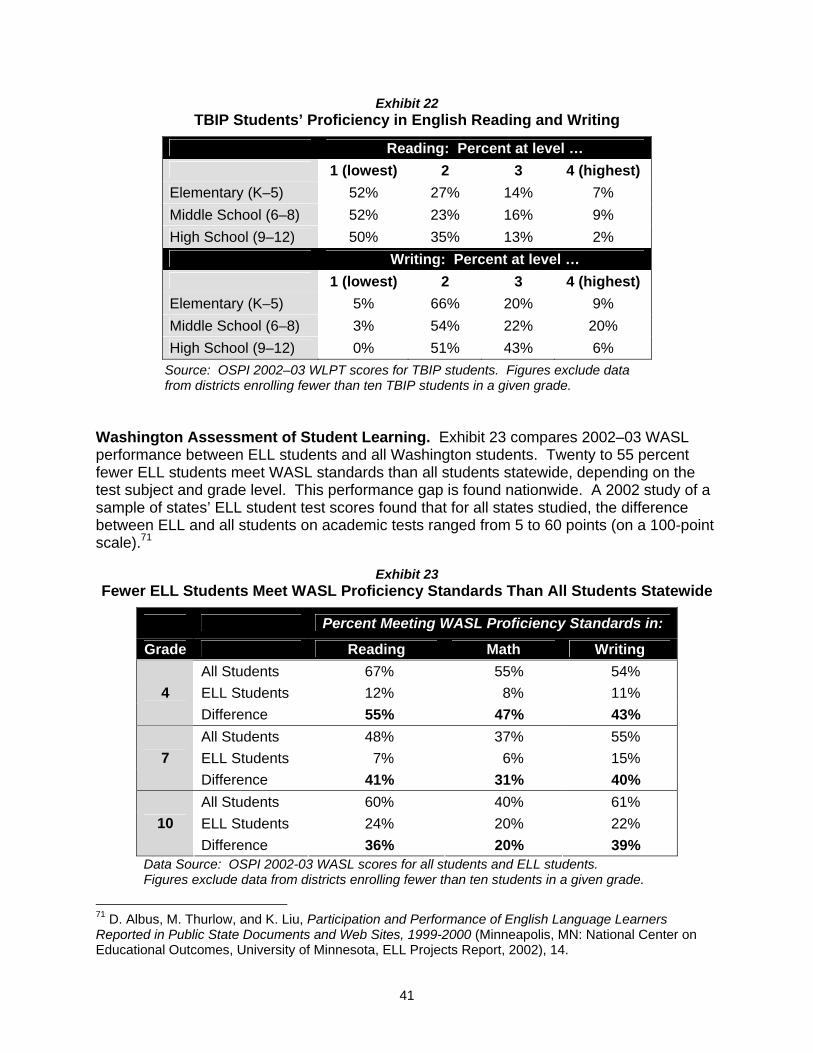
41
Exhibit 22 TBIP Students’ Proficiency in English Reading and Writing
Reading: Percent at level … 1 (lowest) 2 3 4 (highest) Elementary (K–5) 52% 27% 14% 7% Middle School (6–8) 52% 23% 16% 9% High School (9–12) 50% 35% 13% 2% Writing: Percent at level … 1 (lowest) 2 3 4 (highest) Elementary (K–5) 5% 66% 20% 9% Middle School (6–8) 3% 54% 22% 20% High School (9–12) 0% 51% 43% 6%
Source: OSPI 2002–03 WLPT scores for TBIP students. Figures exclude data from districts enrolling fewer than ten TBIP students in a given grade.
Washington Assessment of Student Learning. Exhibit 23 compares 2002–03 WASL performance between ELL students and all Washington students. Twenty to 55 percent fewer ELL students meet WASL standards than all students statewide, depending on the test subject and grade level. This performance gap is found nationwide. A 2002 study of a sample of states’ ELL student test scores found that for all states studied, the difference between ELL and all students on academic tests ranged from 5 to 60 points (on a 100-point scale).71
Exhibit 23
Fewer ELL Students Meet WASL Proficiency Standards Than All Students Statewide
Percent Meeting WASL Proficiency Standards in:
Grade Reading Math Writing All Students 67% 55% 54% ELL Students 12% 8% 11% 4 Difference 55% 47% 43% All Students 48% 37% 55% ELL Students 7% 6% 15% 7 Difference 41% 31% 40% All Students 60% 40% 61% ELL Students 24% 20% 22% 10 Difference 36% 20% 39%
Data Source: OSPI 2002-03 WASL scores for all students and ELL students. Figures exclude data from districts enrolling fewer than ten students in a given grade.
71 D. Albus, M. Thurlow, and K. Liu, Participation and Performance of English Language Learners Reported in Public State Documents and Web Sites, 1999-2000 (Minneapolis, MN: National Center on Educational Outcomes, University of Minnesota, ELL Projects Report, 2002), 14.
42
Factors Associated With Variation in WASL Performance. The Institute analyzed state TBIP data to identify factors associated with better WASL performance among ELL students. This analysis is described in Appendix D. We could not draw any conclusions regarding effectiveness of different programs because the data are district level, rather than student level, and the program description data are unreliable. Research Review The Institute reviewed the research literature on bilingual education to learn which programs are effective in educating ELL students. We conducted this review by collecting all evaluations of bilingual and ESL programs we could find, searching electronic databases, the Internet, and research citations. We found over 300 studies published in English; 98 publications were evaluations of instructional programs in schools. Appendix E provides a list of the studies examined. Of these 98 evaluations, seven used sufficiently rigorous research designs to allow scientific conclusions regarding program effectiveness (see Exhibit 24).72 The studies measure short-term results of using native language instruction, in varying degrees. Because of the variation in grade levels, programs, and assessment tests, the Institute could not combine the results in a meta-analysis. In five of the seven studies, at the end of the study period ELL students receiving instruction in their native language for part of the school day had better test scores than ELL students receiving all-English instruction. Applicability to Washington. The findings from these studies, unfortunately, are not particularly helpful to Washington State because none examined ESL instruction, the most common program in Washington schools. Because the studies did not track students’ post-program performance, we do not know what teaching strategies are most beneficial for ELL students in the long term. Also, most of the research was conducted in the 1960s and 1970s when bilingual education was in its infancy.
72 At a minimum, evaluations needed a quasi-experimental research design using a comparison group and measurement of one or both of the two outcomes of interest (English language acquisition and academic achievement).
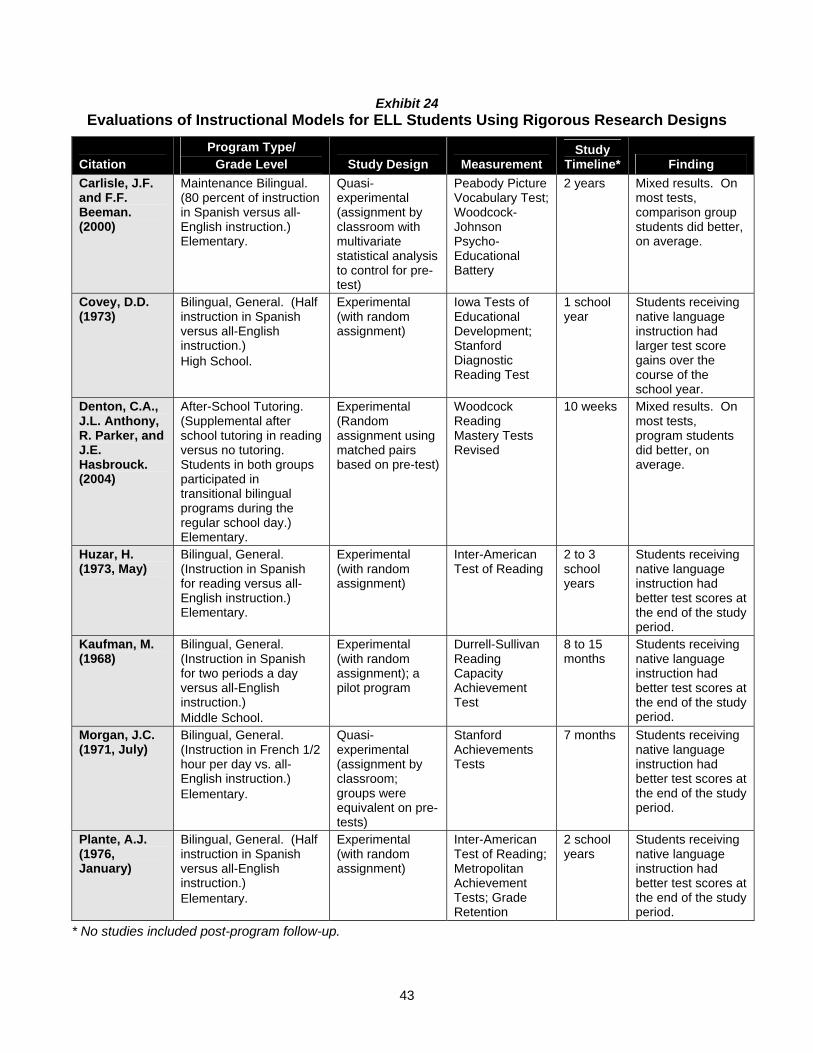
43
Exhibit 24 Evaluations of Instructional Models for ELL Students Using Rigorous Research Designs
Citation Program Type/
Grade Level Study Design Measurement Study
Timeline* Finding Carlisle, J.F. and F.F. Beeman. (2000)
Maintenance Bilingual. (80 percent of instruction in Spanish versus all-English instruction.) Elementary.
Quasi-experimental (assignment by classroom with multivariate statistical analysis to control for pre-test)
Peabody Picture Vocabulary Test; Woodcock-Johnson Psycho-Educational Battery
2 years Mixed results. On most tests, comparison group students did better, on average.
Covey, D.D. (1973)
Bilingual, General. (Half instruction in Spanish versus all-English instruction.) High School.
Experimental (with random assignment)
Iowa Tests of Educational Development; Stanford Diagnostic Reading Test
1 school year
Students receiving native language instruction had larger test score gains over the course of the school year.
Denton, C.A., J.L. Anthony, R. Parker, and J.E. Hasbrouck. (2004)
After-School Tutoring. (Supplemental after school tutoring in reading versus no tutoring. Students in both groups participated in transitional bilingual programs during the regular school day.) Elementary.
Experimental (Random assignment using matched pairs based on pre-test)
Woodcock Reading Mastery Tests Revised
10 weeks Mixed results. On most tests, program students did better, on average.
Huzar, H. (1973, May)
Bilingual, General. (Instruction in Spanish for reading versus all-English instruction.) Elementary.
Experimental (with random assignment)
Inter-American Test of Reading
2 to 3 school years
Students receiving native language instruction had better test scores at the end of the study period.
Kaufman, M. (1968)
Bilingual, General. (Instruction in Spanish for two periods a day versus all-English instruction.) Middle School.
Experimental (with random assignment); a pilot program
Durrell-Sullivan Reading Capacity Achievement Test
8 to 15 months
Students receiving native language instruction had better test scores at the end of the study period.
Morgan, J.C. (1971, July)
Bilingual, General. (Instruction in French 1/2 hour per day vs. all-English instruction.) Elementary.
Quasi-experimental (assignment by classroom; groups were equivalent on pre-tests)
Stanford Achievements Tests
7 months Students receiving native language instruction had better test scores at the end of the study period.
Plante, A.J. (1976, January)
Bilingual, General. (Half instruction in Spanish versus all-English instruction.) Elementary.
Experimental (with random assignment)
Inter-American Test of Reading; Metropolitan Achievement Tests; Grade Retention
2 school years
Students receiving native language instruction had better test scores at the end of the study period.
* No studies included post-program follow-up.
44
OSPI Recommended Models: Thomas and Collier Study. OSPI staff frequently cite a report by Thomas and Collier73 as evidence to support their recommended models, in particular, bilingual programs (see Exhibit 9). The Thomas and Collier study is a large scale, national research project examining current practices in bilingual education, including ESL. The research design, however, limits the scientific weight that can be given to its results, which are not conclusive or generalizable to Washington because:
No evidence was provided regarding the comparability of program and comparison groups and, in some cases, comparison groups were not used.74
The researchers did not study typical school programs; instead, they selected districts with documented, well-implemented programs and a demonstrated commitment to school reform, with close oversight and involvement of the researchers.75
The Thomas and Collier study findings regarding program effectiveness should be considered exploratory rather than definitive. The authors conclude that “each school context is different, and significant elements within each educational context can have strong influence on students’ academic achievement in the long term.”76 Other experts have reached similar conclusions. A 1997 report by a national research committee on bilingual education stated that the key question is “not finding a program that works for all children and all localities, but rather finding a set of program components that works for the children in the community of interest, given the goals, demographics, and resources of that community.”77 Length of Stay Related to the question of which instructional strategies influence ELL students’ academic achievement is the question of how long ELL students need specialized instruction. Expectations regarding duration influence how programs are structured and enrollment projections. Information regarding Washington students’ length of stay in the TBIP is presented below, including:
State law, policy, and practice;
Research on length of stay; and
Analysis of OSPI length of stay data.
73 W.P. Thomas and V.P. Collier, A National Study of School Effectiveness For Language Minority Students' Long-Term Academic Achievement (Santa Cruz, CA: Center for Research on Education, Diversity & Excellence, 2002), <http://www.crede.ucsc.edu/research/llaa/1.1pdfs/1.1complete.pdf>. 74 Without an equivalent group of students for comparison purposes, the findings are descriptive but not causal (i.e., students’ academic performance cannot be attributed to program participation alone). 75 Thomas and Collier, A National Study of School Effectiveness, 23. 76 Thomas and Collier, A National Study of School Effectiveness, 324. 77 August and Hakuta, Improving Schooling for Language-Minority Children, 147.
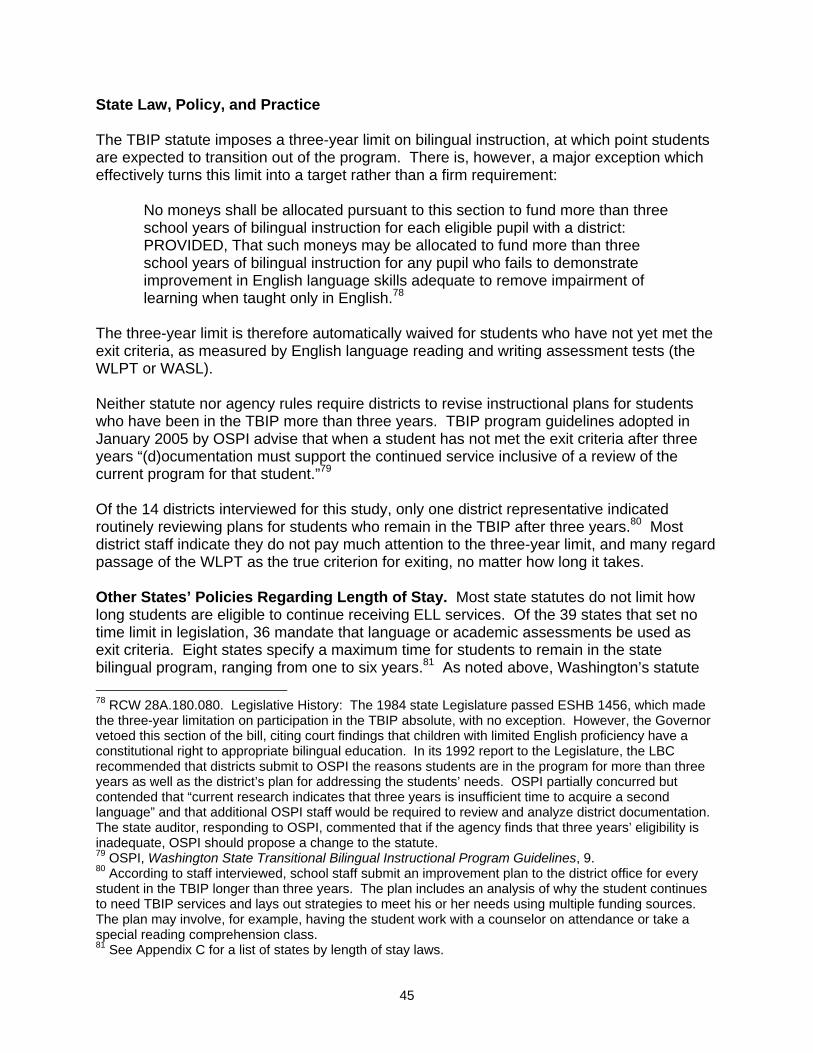
45
State Law, Policy, and Practice The TBIP statute imposes a three-year limit on bilingual instruction, at which point students are expected to transition out of the program. There is, however, a major exception which effectively turns this limit into a target rather than a firm requirement:
No moneys shall be allocated pursuant to this section to fund more than three school years of bilingual instruction for each eligible pupil with a district: PROVIDED, That such moneys may be allocated to fund more than three school years of bilingual instruction for any pupil who fails to demonstrate improvement in English language skills adequate to remove impairment of learning when taught only in English.78
The three-year limit is therefore automatically waived for students who have not yet met the exit criteria, as measured by English language reading and writing assessment tests (the WLPT or WASL). Neither statute nor agency rules require districts to revise instructional plans for students who have been in the TBIP more than three years. TBIP program guidelines adopted in January 2005 by OSPI advise that when a student has not met the exit criteria after three years “(d)ocumentation must support the continued service inclusive of a review of the current program for that student.”79 Of the 14 districts interviewed for this study, only one district representative indicated routinely reviewing plans for students who remain in the TBIP after three years.80 Most district staff indicate they do not pay much attention to the three-year limit, and many regard passage of the WLPT as the true criterion for exiting, no matter how long it takes. Other States’ Policies Regarding Length of Stay. Most state statutes do not limit how long students are eligible to continue receiving ELL services. Of the 39 states that set no time limit in legislation, 36 mandate that language or academic assessments be used as exit criteria. Eight states specify a maximum time for students to remain in the state bilingual program, ranging from one to six years.81 As noted above, Washington’s statute 78 RCW 28A.180.080. Legislative History: The 1984 state Legislature passed ESHB 1456, which made the three-year limitation on participation in the TBIP absolute, with no exception. However, the Governor vetoed this section of the bill, citing court findings that children with limited English proficiency have a constitutional right to appropriate bilingual education. In its 1992 report to the Legislature, the LBC recommended that districts submit to OSPI the reasons students are in the program for more than three years as well as the district’s plan for addressing the students’ needs. OSPI partially concurred but contended that “current research indicates that three years is insufficient time to acquire a second language” and that additional OSPI staff would be required to review and analyze district documentation. The state auditor, responding to OSPI, commented that if the agency finds that three years’ eligibility is inadequate, OSPI should propose a change to the statute. 79 OSPI, Washington State Transitional Bilingual Instructional Program Guidelines, 9. 80 According to staff interviewed, school staff submit an improvement plan to the district office for every student in the TBIP longer than three years. The plan includes an analysis of why the student continues to need TBIP services and lays out strategies to meet his or her needs using multiple funding sources. The plan may involve, for example, having the student work with a counselor on attendance or take a special reading comprehension class. 81 See Appendix C for a list of states by length of stay laws.
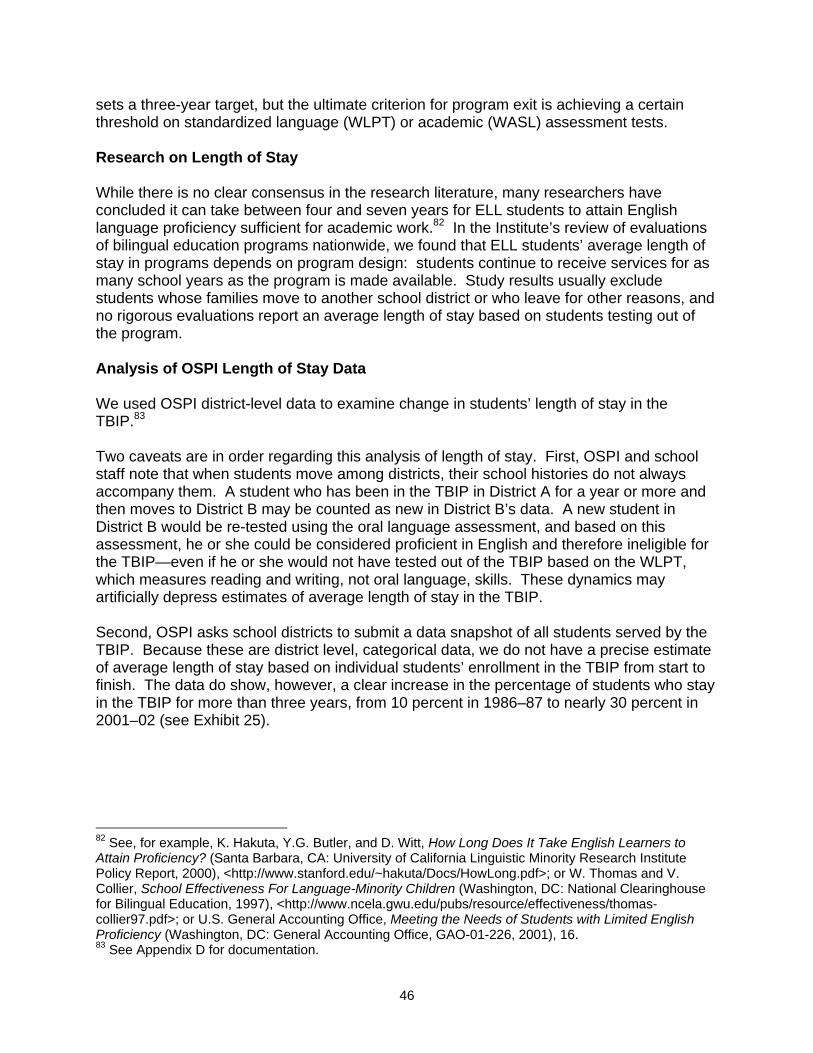
46
sets a three-year target, but the ultimate criterion for program exit is achieving a certain threshold on standardized language (WLPT) or academic (WASL) assessment tests. Research on Length of Stay While there is no clear consensus in the research literature, many researchers have concluded it can take between four and seven years for ELL students to attain English language proficiency sufficient for academic work.82 In the Institute’s review of evaluations of bilingual education programs nationwide, we found that ELL students’ average length of stay in programs depends on program design: students continue to receive services for as many school years as the program is made available. Study results usually exclude students whose families move to another school district or who leave for other reasons, and no rigorous evaluations report an average length of stay based on students testing out of the program. Analysis of OSPI Length of Stay Data We used OSPI district-level data to examine change in students’ length of stay in the TBIP.83 Two caveats are in order regarding this analysis of length of stay. First, OSPI and school staff note that when students move among districts, their school histories do not always accompany them. A student who has been in the TBIP in District A for a year or more and then moves to District B may be counted as new in District B’s data. A new student in District B would be re-tested using the oral language assessment, and based on this assessment, he or she could be considered proficient in English and therefore ineligible for the TBIP—even if he or she would not have tested out of the TBIP based on the WLPT, which measures reading and writing, not oral language, skills. These dynamics may artificially depress estimates of average length of stay in the TBIP. Second, OSPI asks school districts to submit a data snapshot of all students served by the TBIP. Because these are district level, categorical data, we do not have a precise estimate of average length of stay based on individual students’ enrollment in the TBIP from start to finish. The data do show, however, a clear increase in the percentage of students who stay in the TBIP for more than three years, from 10 percent in 1986–87 to nearly 30 percent in 2001–02 (see Exhibit 25).
82 See, for example, K. Hakuta, Y.G. Butler, and D. Witt, How Long Does It Take English Learners to Attain Proficiency? (Santa Barbara, CA: University of California Linguistic Minority Research Institute Policy Report, 2000), <http://www.stanford.edu/~hakuta/Docs/HowLong.pdf>; or W. Thomas and V. Collier, School Effectiveness For Language-Minority Children (Washington, DC: National Clearinghouse for Bilingual Education, 1997), <http://www.ncela.gwu.edu/pubs/resource/effectiveness/thomas-collier97.pdf>; or U.S. General Accounting Office, Meeting the Needs of Students with Limited English Proficiency (Washington, DC: General Accounting Office, GAO-01-226, 2001), 16. 83 See Appendix D for documentation.
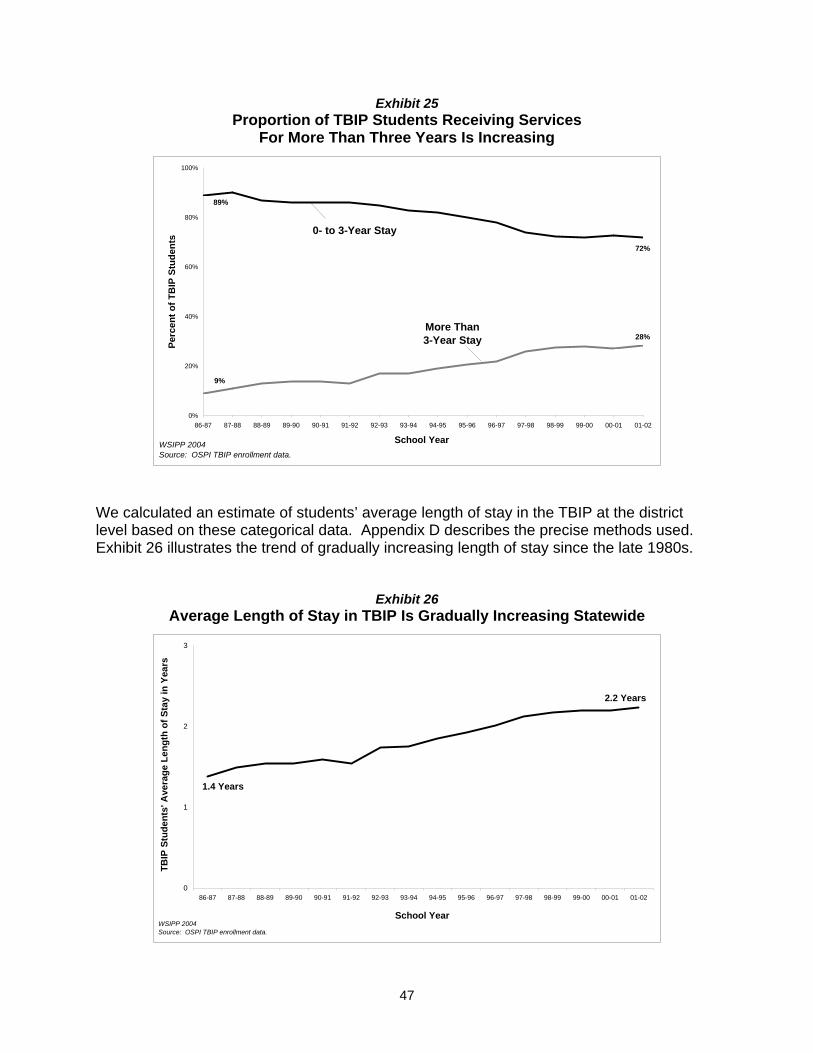
47
Exhibit 25 Proportion of TBIP Students Receiving Services
For More Than Three Years Is Increasing
0%
20%
40%
60%
80%
100%
86-87 87-88 88-89 89-90 90-91 91-92 92-93 93-94 94-95 95-96 96-97 97-98 98-99 99-00 00-01 01-02
School Year
Perc
ent o
f TB
IP S
tude
nts
WSIPP 2004Source: OSPI TBIP enrollment data.
0- to 3-Year Stay
More Than 3-Year Stay
89%
9%
72%
28%
We calculated an estimate of students’ average length of stay in the TBIP at the district level based on these categorical data. Appendix D describes the precise methods used. Exhibit 26 illustrates the trend of gradually increasing length of stay since the late 1980s.
Exhibit 26 Average Length of Stay in TBIP Is Gradually Increasing Statewide
0
1
2
3
86-87 87-88 88-89 89-90 90-91 91-92 92-93 93-94 94-95 95-96 96-97 97-98 98-99 99-00 00-01 01-02
School Year
TBIP
Stu
dent
s' A
vera
ge L
engt
h of
Sta
y in
Yea
rs
WSIPP 2004Source: OSPI TBIP enrollment data.
1.4 Years
2.2 Years
48
Graduating and Transitioning Students. OSPI also collects length of stay data covering TBIP students who graduate from high school or transition out of the program by meeting proficiency standards on assessment tests. These data provide a stronger measure of how long students stay in the program from beginning to end, except that the data exclude students who leave the program for other or unknown reasons and those who drop out.84 It is not known how including dropouts and those who leave for unknown reasons would impact this measure, although it is likely that such inclusion would reduce average length of stay because students counted as dropouts or unknowns leave before they transition or graduate from high school. Average length of stay estimates for graduating and transitioning students are higher than for all TBIP students (see Exhibit 27), particularly because this measure excludes new students. For both groups, average length of stay has increased slightly since 1997–98, and, for graduating and transitioning students, the average is approaching three years.
Exhibit 27
Average School Years in TBIP: Two Measures
2.14
2.602.81
2.23
0
3
All TBIP Students Graduating and TransitioningStudents
Estim
ated
Ave
rage
Len
gth
of S
tay
in T
BIP
in Y
ears
WSIPP 2004Source: OSPI TBIP data.
1997
-199
8
2001
-200
2
84 In 2001–02, TBIP students who left the program for other or unknown reasons or dropped out of school made up more than half (53 percent) of exiting TBIP students. Students graduating from high school made up 9 percent of exiting students, and 38 percent of exiting students transitioned out of TBIP into mainstream classrooms full-time.
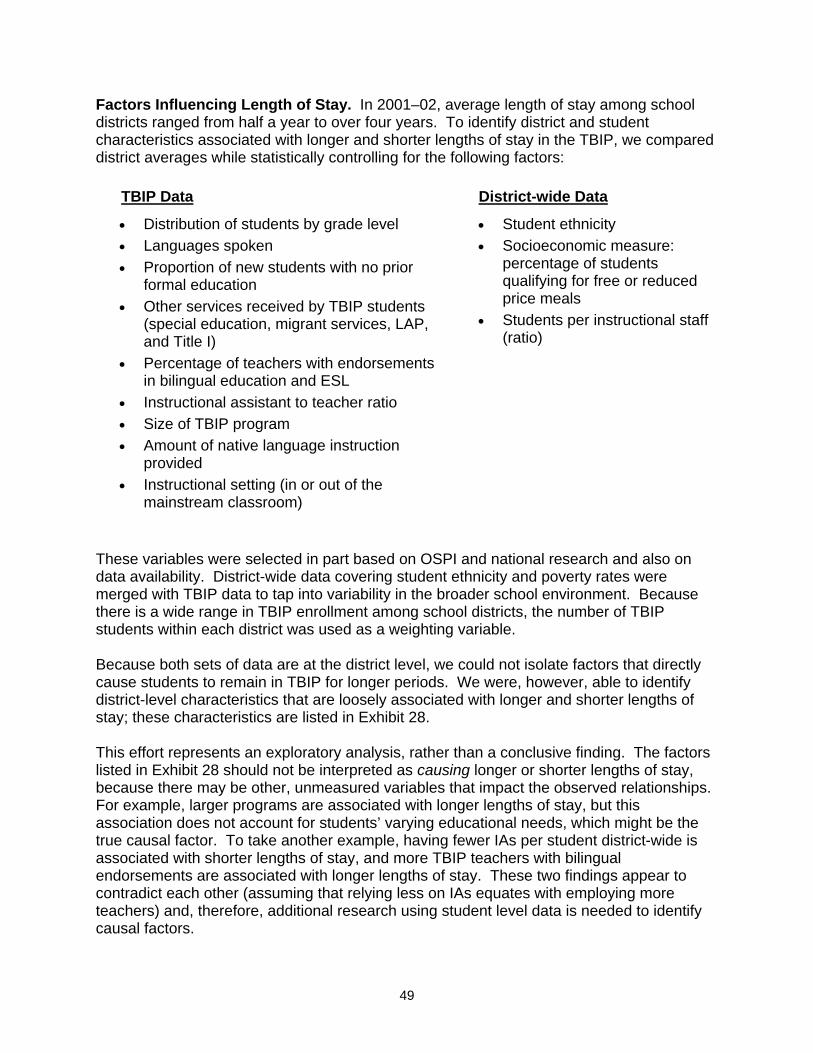
49
Factors Influencing Length of Stay. In 2001–02, average length of stay among school districts ranged from half a year to over four years. To identify district and student characteristics associated with longer and shorter lengths of stay in the TBIP, we compared district averages while statistically controlling for the following factors:
TBIP Data District-wide Data
• Distribution of students by grade level • Languages spoken • Proportion of new students with no prior
formal education • Other services received by TBIP students
(special education, migrant services, LAP, and Title I)
• Percentage of teachers with endorsements in bilingual education and ESL
• Instructional assistant to teacher ratio • Size of TBIP program • Amount of native language instruction
provided • Instructional setting (in or out of the
mainstream classroom)
• Student ethnicity • Socioeconomic measure:
percentage of students qualifying for free or reduced price meals
• Students per instructional staff (ratio)
These variables were selected in part based on OSPI and national research and also on data availability. District-wide data covering student ethnicity and poverty rates were merged with TBIP data to tap into variability in the broader school environment. Because there is a wide range in TBIP enrollment among school districts, the number of TBIP students within each district was used as a weighting variable. Because both sets of data are at the district level, we could not isolate factors that directly cause students to remain in TBIP for longer periods. We were, however, able to identify district-level characteristics that are loosely associated with longer and shorter lengths of stay; these characteristics are listed in Exhibit 28. This effort represents an exploratory analysis, rather than a conclusive finding. The factors listed in Exhibit 28 should not be interpreted as causing longer or shorter lengths of stay, because there may be other, unmeasured variables that impact the observed relationships. For example, larger programs are associated with longer lengths of stay, but this association does not account for students’ varying educational needs, which might be the true causal factor. To take another example, having fewer IAs per student district-wide is associated with shorter lengths of stay, and more TBIP teachers with bilingual endorsements are associated with longer lengths of stay. These two findings appear to contradict each other (assuming that relying less on IAs equates with employing more teachers) and, therefore, additional research using student level data is needed to identify causal factors.
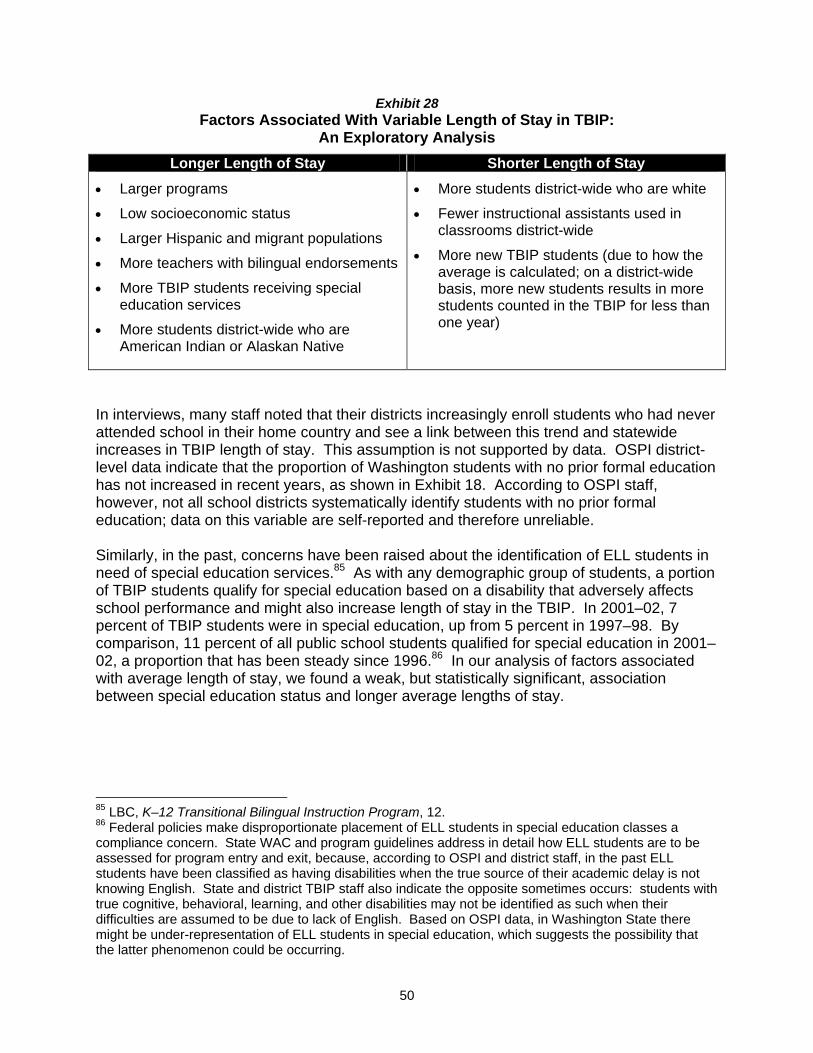
50
Exhibit 28 Factors Associated With Variable Length of Stay in TBIP:
An Exploratory Analysis Longer Length of Stay Shorter Length of Stay
• Larger programs
• Low socioeconomic status
• Larger Hispanic and migrant populations
• More teachers with bilingual endorsements
• More TBIP students receiving special education services
• More students district-wide who are American Indian or Alaskan Native
• More students district-wide who are white
• Fewer instructional assistants used in classrooms district-wide
• More new TBIP students (due to how the average is calculated; on a district-wide basis, more new students results in more students counted in the TBIP for less than one year)
In interviews, many staff noted that their districts increasingly enroll students who had never attended school in their home country and see a link between this trend and statewide increases in TBIP length of stay. This assumption is not supported by data. OSPI district-level data indicate that the proportion of Washington students with no prior formal education has not increased in recent years, as shown in Exhibit 18. According to OSPI staff, however, not all school districts systematically identify students with no prior formal education; data on this variable are self-reported and therefore unreliable. Similarly, in the past, concerns have been raised about the identification of ELL students in need of special education services.85 As with any demographic group of students, a portion of TBIP students qualify for special education based on a disability that adversely affects school performance and might also increase length of stay in the TBIP. In 2001–02, 7 percent of TBIP students were in special education, up from 5 percent in 1997–98. By comparison, 11 percent of all public school students qualified for special education in 2001–02, a proportion that has been steady since 1996.86 In our analysis of factors associated with average length of stay, we found a weak, but statistically significant, association between special education status and longer average lengths of stay.
85 LBC, K–12 Transitional Bilingual Instruction Program, 12. 86 Federal policies make disproportionate placement of ELL students in special education classes a compliance concern. State WAC and program guidelines address in detail how ELL students are to be assessed for program entry and exit, because, according to OSPI and district staff, in the past ELL students have been classified as having disabilities when the true source of their academic delay is not knowing English. State and district TBIP staff also indicate the opposite sometimes occurs: students with true cognitive, behavioral, learning, and other disabilities may not be identified as such when their difficulties are assumed to be due to lack of English. Based on OSPI data, in Washington State there might be under-representation of ELL students in special education, which suggests the possibility that the latter phenomenon could be occurring.
51
How to Identify Effective Programs As illustrated above, the research evidence and state data available for this study could not conclusively answer the key questions examined in this report:
1. What instructional programs are effective in improving ELL students’ academic and language acquisition outcomes; and
2. How long does it typically take ELL students to develop English language skills sufficient for academic success?
For Washington to identify ways to increase the cost-effectiveness of the TBIP, a designated research effort is needed. Ideally, this analysis would involve an experiment using random assignment of ELL students to various programs. Such experiments are challenging to implement with fidelity. OSPI has, however, recently made substantial improvements to its TBIP data collection system and, with some additional effort, these data could be used to identify instructional programs associated with better academic outcomes for ELL students in Washington State. Recent OSPI Data Improvements OSPI released 2002-03 and 2003-04 TBIP data in the first week of December 2004. The timeline was too short for the Institute to complete a full analysis of these complex datasets by January 2005.87 A preliminary examination of the dataset, however, revealed its significant advances in precise information on student performance and types of programs in Washington:
TBIP student-level data covering grade levels, languages spoken, entry and exit dates, and entry test scores on oral language assessment tests. Because the new dataset includes unique student identifiers,88 these data can be directly linked with the following student academic outcomes:
Grade retention;
High school graduation; and
WLPT and WASL scores.
Clarification of the categories school districts use to report what kinds of instructional programs are implemented at each school building.89
These improvements will enable researchers to use student data nested within a school-level dataset that captures program type and additional characteristics, such as 87 For the school years covered, each dataset includes nearly 200 district and 2,000 school building records and over 70,000 student records. Simply importing, defining, cleaning, and linking the 2002–03 data took two weeks of computer programming and consultation with database and program managers; running and interpreting basic statistics on a subset of the data required an additional week of staff time. 88 Some districts submitting TBIP data use district-assigned ID numbers and some use the statewide unique student ID number. OSPI staff indicated that data can be linked at the state level, regardless of the ID number’s source. 89 The new categories match those listed in Exhibit 9.
52
socioeconomic status, for sophisticated statistical analysis of factors influencing ELL student academic outcomes. Additional Data Needed These electronic data supply approximately half the information needed for scientific analysis of TBIP student outcomes. To understand the nuances of service provision, a survey of a sample of school districts could supply the remaining data needed, specifically:
Entry and Exit Dates. While the new data include TBIP student entry and exit dates, these dates do not fully capture how students move in and out of the program and among school districts. Future analysis of students’ length of stay in the TBIP and associated academic outcomes would need to account for the full length of time ELL students receive services.
Exit Reasons. To examine outcomes such as high school graduation, data
covering why students leave the TBIP need to be improved. In 2002–03, 41 percent of the 10,080 students who exited the TBIP were recorded as leaving for “other” reasons (rather than because they graduated, transitioned, or dropped out). To obtain a representative sample, school districts would need to catalog those “other” reasons.
Program Type. While OSPI has improved the broad categories used to describe
district programs, the mix of services provided to students would inform which specific strategies are more effective. Supplemental program data might include, for example, the amount of time students spend in ESL classes, how frequently they are pulled out of mainstream classes, or whether native language instruction is supplemented by ESL teaching methods.
Finance. OSPI collects data about the funding streams that support ELL student
services, but these data—particularly estimates of federal and local district funding—are not sufficiently detailed or reliable. To address the question of cost-effectiveness, uniform estimates of revenues and expenditures related to bilingual education at the school building level are needed.
Teacher Qualifications. OSPI collects data on TBIP teachers and instructional
assistants, covering their qualifications and training and the languages they speak, if bilingual. These data are now collected at the district level and would need to be disaggregated to the school building level.
Timeline and Cost. To estimate a timeline and cost for such a study, we report figures based on our fiscal note methodology. This study could be conducted by a variety of research groups and/or individuals; the estimates are designed to provide an approximation of costs. We anticipate the study would require a year and a half and cost approximately $220,000. Exhibit 29 summarizes the anticipated staffing, activities, and costs.
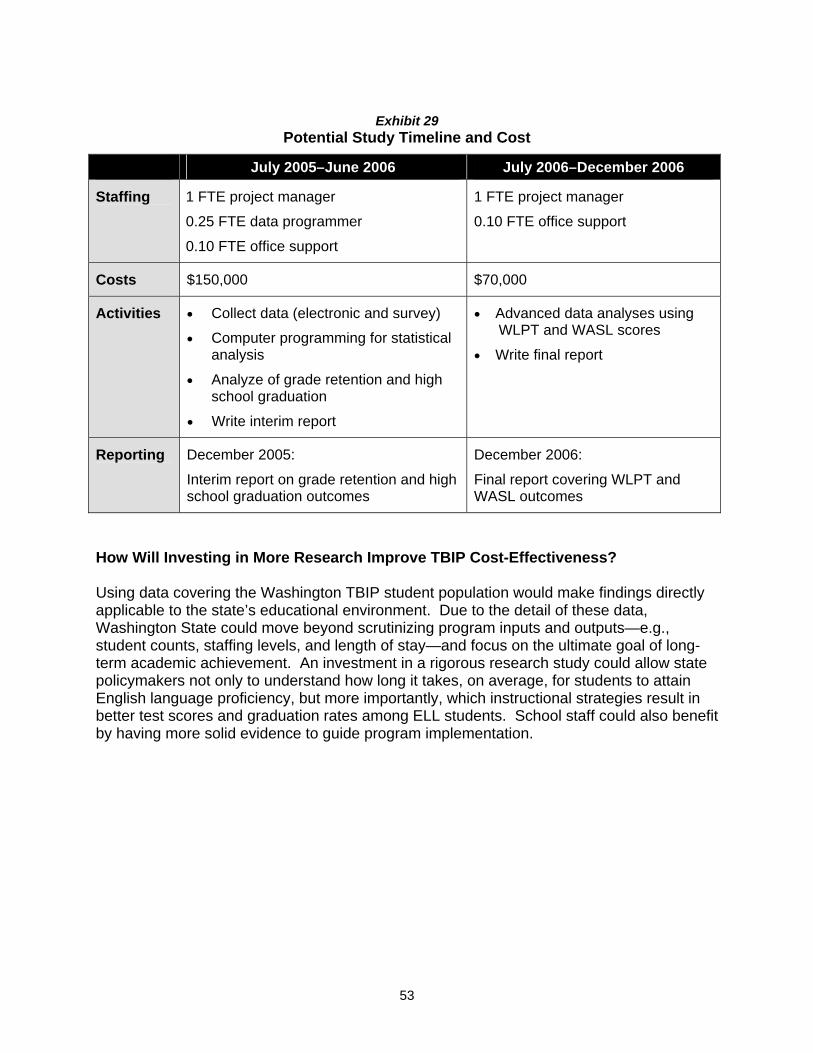
53
Exhibit 29
Potential Study Timeline and Cost
July 2005–June 2006 July 2006–December 2006
Staffing
1 FTE project manager
0.25 FTE data programmer
0.10 FTE office support
1 FTE project manager
0.10 FTE office support
Costs $150,000 $70,000
Activities • Collect data (electronic and survey)
• Computer programming for statistical analysis
• Analyze of grade retention and high school graduation
• Write interim report
• Advanced data analyses using WLPT and WASL scores
• Write final report
Reporting December 2005:
Interim report on grade retention and high school graduation outcomes
December 2006:
Final report covering WLPT and WASL outcomes
How Will Investing in More Research Improve TBIP Cost-Effectiveness? Using data covering the Washington TBIP student population would make findings directly applicable to the state’s educational environment. Due to the detail of these data, Washington State could move beyond scrutinizing program inputs and outputs—e.g., student counts, staffing levels, and length of stay—and focus on the ultimate goal of long-term academic achievement. An investment in a rigorous research study could allow state policymakers not only to understand how long it takes, on average, for students to attain English language proficiency, but more importantly, which instructional strategies result in better test scores and graduation rates among ELL students. School staff could also benefit by having more solid evidence to guide program implementation.
54
Summary This section examined research and state data addressing two key questions regarding instruction for ELL students:
1. What instructional programs are effective in improving ELL students’ academic and language acquisition outcomes; and
2. How long does it typically take ELL students to develop English language skills sufficient for academic success?
Program Effectiveness. State data on student outcomes reveal a gap between academic performance of ELL students and all K–12 students; 20 to 55 percent fewer ELL students meet WASL standards, depending on the test subject and grade level. Because in the past state TBIP data were collected at the district level, data analysis could not identify programs associated with better WASL or WLPT scores. A review of research literature revealed that few evaluations of bilingual education use sufficiently rigorous research designs to meet scientific standards for generalizability. There is some evidence that bilingual programs can improve ELL student test scores in the short term. The research, however, does not address ESL instruction, the most common program in Washington schools. Length of Stay. State law imposes a three-year limit on how long students are eligible for the TBIP but provides a major exception: students who demonstrate continued need for supplemental services based on language and academic assessment tests. According to staff, most districts do not review service needs of students who stay beyond three years. Most Washington TBIP students exit the program in less than three years. While there is no clear consensus, many researchers have concluded it takes four to seven years for students to develop English language skills sufficient for academic work. The Institute used district-level data to identify factors associated with longer or shorter lengths of stay in TBIP. While this is not a causal analysis, we were able to identify certain factors—such as large programs and high poverty rates—loosely associated with longer lengths of stay. How to Identify Effective Programs. Student-level data collected by OSPI beginning in 2002–03 (but not available in time for this study) will enable future data analyses to more conclusively identify instructional strategies associated with improved ELL students’ academic achievement. Washington State could invest in a research study using the new OSPI data to answer these questions.
55
CONCLUSION The 2004 Legislature directed the Institute to review the state Transitional Bilingual Instructional Program (TBIP). This review examined laws and policies governing the TBIP, student enrollment trends, program implementation, duration of services, and research on the academic and language acquisition effectiveness of various programs. Law and Policy State and federal laws and policies require public schools to provide ELL students with specialized instruction to help them access the educational curriculum. Washington State law authorizes bilingual programs and ESL in situations where instruction in students’ native languages is not feasible. Statute gives school districts broad discretion to select and implement programs. OSPI provides training and technical assistance to schools implementing the TBIP. Enrollment and Funding Trends TBIP student enrollment is growing rapidly and, therefore, so are dedicated state general fund expenditures. Between 1985 and 2004, TBIP enrollment increased from 2 to 7 percent of public K–12 students. TBIP enrollment increases are partly explained by population growth among non-English speakers in Washington State. Enrollment growth is also due to higher numbers of students continuing in the TBIP across school years. Student and Program Characteristics Nearly all Washington schools enrolling TBIP students provide ESL instruction. Bilingual programs require a school district to enroll sufficient numbers of ELL students in the same grades, speaking the same language, and with similar language proficiency levels. These conditions are rare among Washington schools, particularly at the secondary level. The number of teachers obtaining bilingual and ESL endorsements has increased in recent years. Instructional assistants are widely used in the TBIP at all grade levels to provide special assistance to students and facilitate communication among students, teachers, and parents. Length of Stay Per-student TBIP funding is provided to school districts until a student demonstrates sufficient English language and academic proficiency on assessment tests. State law sets a three-year target for students to transition out of the TBIP into mainstream classes without
56
special assistance. Most TBIP students exit the program within three years. The Institute’s analysis of factors influencing length of stay using district-level data was inconclusive. While there is no clear consensus, many researchers have concluded it takes four to seven years for students to develop English language skills sufficient for academic work. Research on Effective Programs Student outcomes data reveal a gap between the academic performance of ELL students compared with Washington students overall. Analysis of TBIP data could not identify instructional programs associated with better WASL or WLPT scores for ELL students. A review of the research literature reveals that few evaluations of bilingual education use strong research designs with a comparison group. There is some evidence that bilingual programs can improve ELL student test scores in the short term. The research does not, however, address ESL instruction, the most common program in Washington schools. How to Identify Effective Washington Programs Student-level data recently collected by OSPI will enable future research to identify instructional strategies associated with improved academic outcomes for ELL students. Washington State could invest in a research study using the new OSPI data to address the question of program cost-effectiveness. This investment in research would provide scientific evidence of what instructional strategies work best for Washington ELL students.


