Download - Engro Foods
ANALYSIS OF FINANCIAL STATEMENTS
SUBMITTED TO: Mrs. Bushra Zulfiqar
SUBMITTED BY:
SIDRA MALIK (10-arid-1363)
Sundas Shahid (10-arid-1365)
ENGRO CORPORATION LIMITED

ENGRO CORPORATION LIMITEDEngro Corporation is one of the leading Pakistani business conglomerates with stakes in the fertilizer, food, power generation, petrochemicals, automation and terminal storage industries. Having had undergone an employee led buyout in 1992 it has expanded phenomenal in the past two decades. As a holding company its subsidiaries include:
Engro Fertilizers Limited Engro Foods Limited Engro Eximp Private Limited Engro PowerGen Limited Engro Polymers and Chemicals Limited Engro Vopak Limited
Board of Directors
Names Designations
Hussain Dawood Chairma
Muhammad Aliuddin Ansari President & Chief Executive
Shahzada Dawood Director
Shabbir Hashmi Director
Ruhail Mohammed Director
Khalid Siraj Subhani Director
Saad Raja Director
Abdul Samad Dawood Director
Khawaja Iqbal Hassan Director
Sarfaraz Ahmed Rehman Director
Afnan Ahsan Director

Incorporation date
Engro Corporation Limited - the Holding Company, is a public listed company incorporated in Pakistan 1965 as Esso Pakistan Fertilizer Company limited under the Companies Ordinance, 1984.
The principal activity of the Holding Company is to manage investments in subsidiary companies and joint venture, engaged in fertilizers, PVC resin manufacturing and marketing, food, energy, exploration and chemical terminal and storage businesses. The Holding Company’s registered office is situated at 7th & 8th Floors, The Harbour Front Building, HC # 3, Block 4, Marine Drive, Clifton, Karachi.
Listing date
Its shares are quoted on Karachi, Lahore and Islamabad stock exchanges of Pakistan
Lahore Stock Exchange:
Engro Foods:
Company Code 251080Symbol EFOODSCompany Name ENGRO FOODS LIMITEDOutstanding Shares 761577600Listing Date August 10, 2011
Engro polymer and chemical:
Company Code 201206Symbol EPCLCompany Name ENGRO POLYMER & CHEMICALS LTD.Outstanding Shares 663468788Listing Date March 27, 2009
Engro fertilizer:
Company Code 201200Symbol ENGROCompany Name ENGRO CORPORATION LIMITEDOutstanding Shares 511269400Listing Date April 15, 1971

Market Price of the shares
Years Market price2012 1222011 932010 1942009 1832008 97
Fiscal year
Company fiscal year ends on 31 December.
Depreciation method
Company use straight line depreciation method to depreciate its operational assets.

ENGRO BUSINESS AT GLANCE

Engro business at glance
Engro’s investments in agriculture, foods, energy and chemicals were designed to take advantage of Pakistan’s economic needs.
Corporate Performance (Rs. in millions)
Revenue Net income Taxes paid Dividends declared
-Sales Growth
No. of shareholders
20082009201020112012
40,97358,15279,976114,612125,151
4,1263,8076,7908,0601,333
1,0261,9562,3783,2142,015
1,2781,7881,9652,361 ----
20%42%38%43%9%
13,16313,98013,93916,41918,768
Engro Corporation Limited
Engro Corporation Limited is a holding company, created following the demerger of Engro Chemical Pakistan Limited on January 1, 2010. Engro Corp is one of Pakistan's largest conglomerates with the company's business portfolio spanning across sectors including chemical fertilizers, PVC resin, a bulk liquid chemical terminal, foods, power generation and commodity trade.
Engro fertilizers limited
Engro Fertilizers Limited, an Engro Corporation subsidiary, is one of the leading fertilizer manufacturing and marketing companies in the country. It is primarily engaged in the manufacturing and marketing of urea and NPK fertilizers. The business offers a wide variety of fertilizer brands besides urea, which include some of the most trusted brand names by Pakistani farmers. These include Engro Zorawar, a high-phosphate fertilizer developed for alkaline soils. Engro Zarkhez is a high-end blended fertilizer product that offers a unique balance of nutrients for a wide variety of crops. Zingro is an imported zinc micro nutrient, meant to overcome zinc deficiency in a diverse range of crops

Engro foods limited
Engro Foods Limited is an 88% owned subsidiary engaged in the manufacturing, processing and marketing of dairy products, ice cream and fruit juices. The business owns two milk processing plants in Sukkur & Sahiwal and operates a dairy farm in Nara. As an example of Engro's pursuit of excellence, the business has established several brands that have already become household names in Pakistan such as Olper’s (milk), Omore (ice cream), Olper’s Lite (low fat milk), Dairy Omung (UHT dairy liquid), Tarang (tea whitener), Omung Lassi and Olfrute (fruit juice) amongst others. The business has also acquired and operates Al Safa Halal, a meat processing company based in Canada.
Engro Powergen Limited
Engro Powergen Limited owns and operates Engro Powergen Qadirpur Limited, a 220 megawatt power plant and the group's first initiative in the power sector of Pakistan, which is 10% directly owned by the holding company and 84% owned by Engro Powergen. The remainder is owned by the International Finance Corporation (IFC), a subsidiary of the World Bank, and employees. In 2010, Engro Powergen entered into a joint venture with the Sindh government, to establish the Sindh Engro Coal Mining Company Limited, to mine coal from Thar Block-II.
Engro Polymer & Chemicals Limited
Engro Polymer & Chemicals Limited is a 56% owned subsidiary of the group and the only manufacturer of polyvinyl chloride (PVC) in the country, in addition to manufacturing and marketing caustic soda. The Company’s vinyl chloride monomer (VCM) plant began production in the first quarter of 2010 successfully making the plant the only fully integrated Chemical Complex in Pakistan. The firm markets its products under the name of “SABZ”.
Engro Eximp (Private) Limited
Engro Eximp (Private) Limited is the group's commodity trading business that deals primarily in the import and trading of phosphate-based fertilizers for Engro Fertilizers Limited such as DAP, MAP, MOP and SOP, and also imports micro- nutrients like Zinc Sulphate, which it supplies as raw materials to Engro Fertilizer's Zarkhez plant for manufacturing blended fertilizers. In addition, Eximp also manages the procurement, processing and export of rice to markets in the Middle East and the European Union. Over the past five years, Engro Eximp has become the single largest importer of phosphates and potash fertilizers in Pakistan.
Engro Vopak Terminal Limited
Engro Vopak Terminal Limited is a joint venture with Royal Vopak of the Netherlands, Engro owns 50% of Engro Vopak Terminal Limited, a business engaged in the handling, regasification and storage of chemicals and liquefied petroleum gas (LPG). The business launched Pakistan's first cryogenic import facility for ethylene, in line with the group's overall motto of pursuing and enabling excellence.
Elengy Terminal Pakistan Limited
Elengy Terminal Pakistan Limited is a 100% owned subsidiary of the company, which has been created to establish and operate a terminal for the handling, regasification, storage, treatment and processing of Liquefied Natural Gas (LNG) , Re-gasified Liquefied Natural Gas (RLNG), Liquid Petroleum Gas (LPG), Natural Gas Liquid (NGL) and all other related liquids, gases and chemical & petroleum products.
Competitors of Engro Corporation:
The major competitors of Engro Corporation are:
Unilever Nestle Group Fauji group

FINANCIAL REVIEW

Financial review
Financial condition:
Summary of balance sheet:
(Rupees in millions)
2012 2011 2010 2009 2008 2007Net current assets
52,615 44,796 33,696 19,924 20,661 23,571
Long. term assets
136,972 139,268 131,082 112,182 60,141 25,665
Property, plant & eqp.
132,467 135,092 129,068 110,504 58,293 23,478
Capital employed
143,941 146,016 138,811 115,862 64,608 37,995
Long term borrowings
73,257 82,560 89,152 84,142 40,739 18,284
Shareholders’ Equity
43,247 41,890 34,115 29,344 23,548 18,278
Reserves 4433 4330 3995 4202 4955 5875
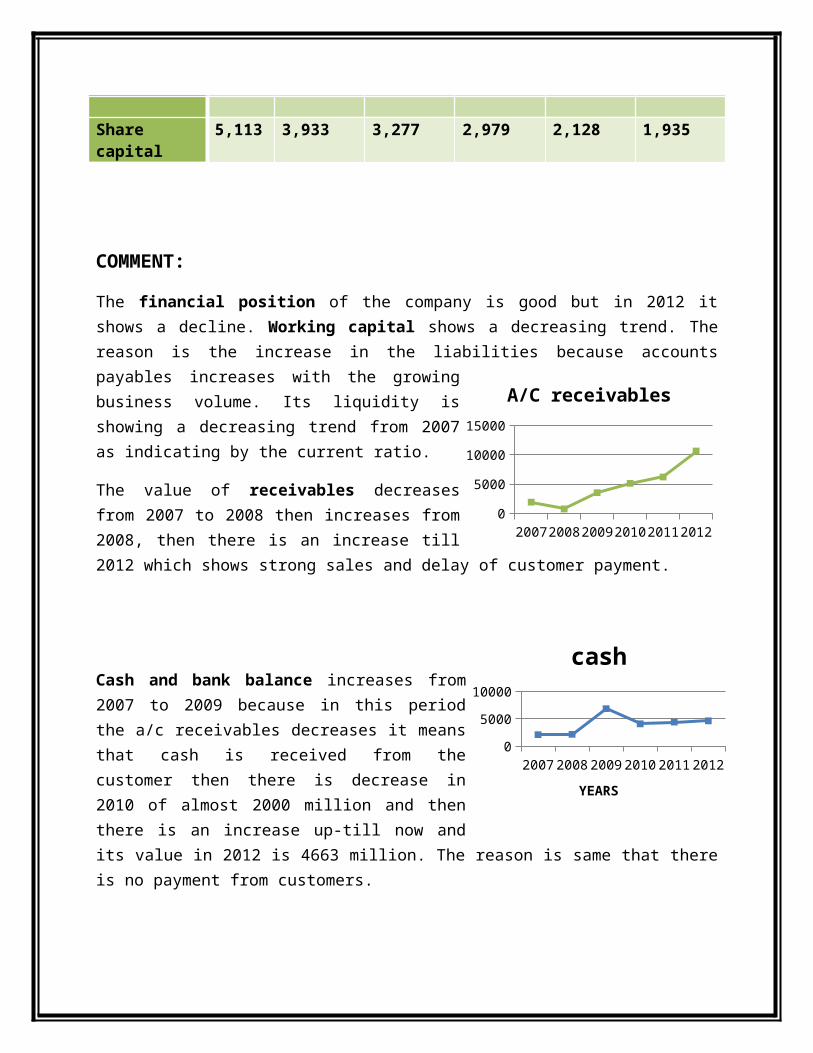
Share capital 5,113 3,933 3,277 2,979 2,128 1,935
COMMENT:
The financial position of the company is good but in 2012 it shows a decline. Working capital shows a decreasing trend. The reason is the increase in the liabilities because accounts payables increases with the growing business volume. Its liquidity is showing a decreasing trend from 2007 as indicating by the current ratio.
The value of receivables decreases from 2007 to 2008 then increases from 2008, then there is an increase till 2012 which shows strong sales and delay of customer payment.
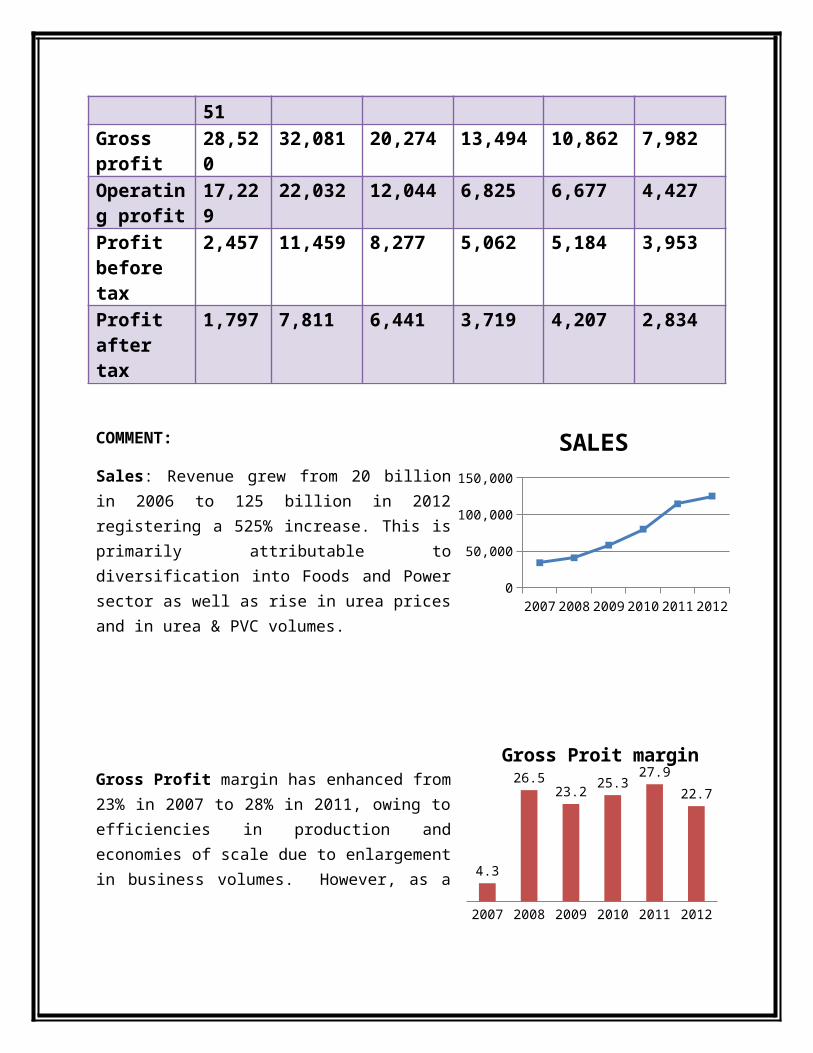
Cash and bank balance increases from 2007 to 2009 because in this period the a/c receivables decreases it means that cash is received from the customer then there is decrease in 2010 of almost 2000 million and then there is an increase up-till now and its value in 2012 is 4663 million. The reason is same that there is no payment from customers.
Property, plant and equipment show an increase from 2007 to 2011 which is as follow 23,478M, 58,293M, 110,504M, 129,068M, 135,092 M and decreases in 2012 that is 132,467M. This increase reflects the modernizations and beginning of expansion projects. The company invested significant amount in property, plant and equipment in recent years primarily for expansion and improving manufacturing techniques. Property, plant and equipment represent over two-thirds of Company’s balance sheet size. The intangible assets shows the up and down trend from 2007 to 2012. And in 2012 it is very low because the company liquidity and profitability ratios represent the poor performance of company in 2012 that affects the reputation of the company.
2007 2008 2009 2010 2011 20120
2000400060008000
cash
YEARS
2007 2008 2009 2010 2011 20120
20,00040,00060,00080,000
100,000120,000140,000160,000
Property Plant and Equipment
2007 2008 2009 2010 2011 20120
2000400060008000
1000012000
A/C receivables

Deferred tax Due to taxable losses in earlier years of fertilizer and petrochemical businesses expansion and diversification in the Foods business, the Company’s deferred tax liability has increased significantly to 5191M in 2012.
Current liabilities increase from 2008 t0 2012 which are as follow 12,280M, 15,970M, 37,751M 53,682M and 67,063M. The company expands its business volume and the use different ways of financing as a result of which its short term borrowings, trade payables and current portion of other borrowings increases which increase the overall current liability.
Long term borrowings are 73,257M, 82,560M, 89,152M, 84,142M, 40,739M and 18,284M in 2007, 2008, 2009, 2010, 2011 and 2012 respectively. In order to maintain the growth momentum, the Company continues to finance a portion of its capital requirement by raising long-term loans. Therefore, the long term loans have notably increased over the years
Equity grew from Rs 10 billion in 2006 to 43 billion in 2012, mainly due to time-to-time capital injections from the shareholders as well as profits retained in the business.
Trade payables have quadrupled over the years in line with the growing business volumes
Increase in short-term borrowings owes to working capital requirements as a result of growth and development in the Company’s business over the years.
Stock in trade: The increase is in line with the continuous increase in the overall business volume.
Summary of income statement
2008 2009 2010 2011 20120
10,00020,00030,00040,00050,00060,00070,00080,000
Current Liabilities
2007 2008 2009 2010 2011 20120
10,00020,00030,00040,00050,00060,00070,00080,00090,000
100,000
Long Term Borrowings
(Rupees in Millions)
2012 2011 2010 2009 2008 2007
Sales 125,151 114612 79,976 58,152 40,973 34,121
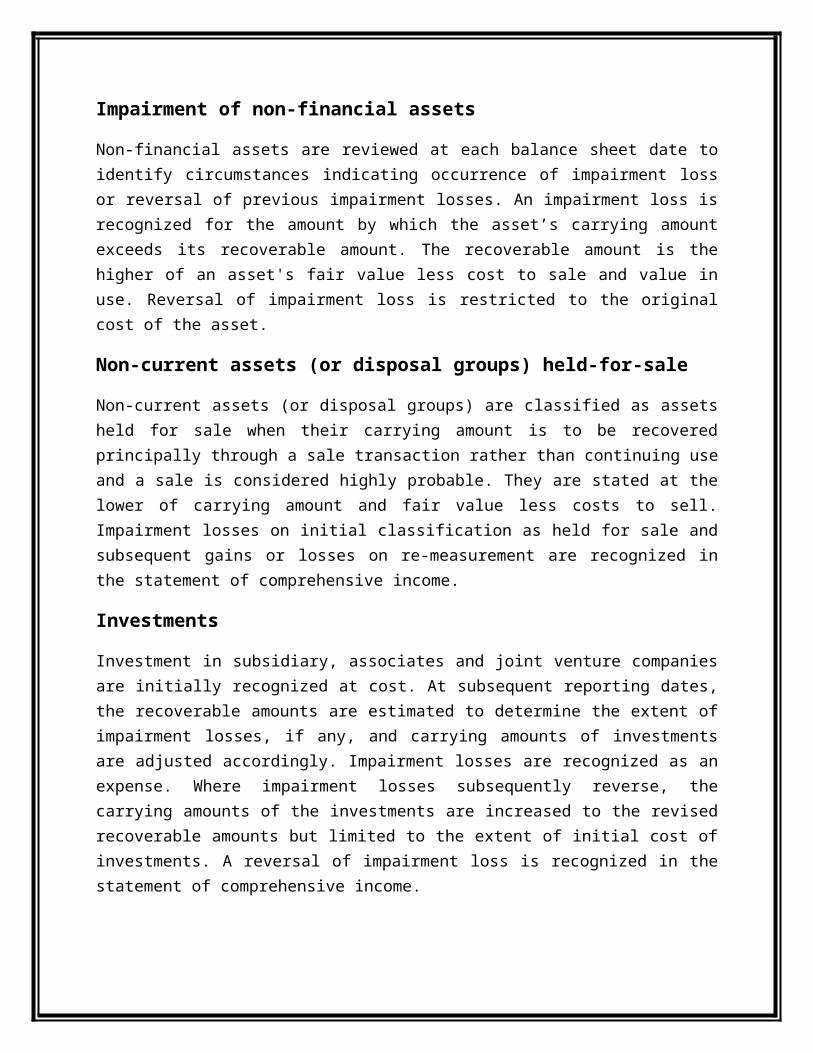
Gross profit
28,520 32,081 20,274 13,494 10,862 7,982
Operating profit
17,229 22,032 12,044 6,825 6,677 4,427
Profit before tax
2,457 11,459 8,277 5,062 5,184 3,953
Profit after tax
1,797 7,811 6,441 3,719 4,207 2,834
COMMENT:
Sales: Revenue grew from 20 billion in 2006 to 125 billion in 2012 registering a 525% increase. This is primarily attributable to diversification into Foods and Power sector as well as rise in urea prices and in urea & PVC volumes.
Gross Profit margin has enhanced from 23% in 2007 to 28% in 2011, owing to efficiencies in production and economies of scale due to enlargement in business volumes. However, as a direct result of issues faced by the fertilizer sector during 2012, it fell to 23% for 2012.
Distribution & Marketing Expenses: In order to support continuous growth path, considerable expenditure has been incurred for brand building especially for the Foods business, which led
2007 2008 2009 2010 2011 20120
20,00040,00060,00080,000
100,000120,000140,000
SALES
2007 2008 2009 2010 2011 2012
4.3
26.523.2
25.327.9
22.7
Gross Proit margin

to manifold increase in marketing costs. With many brands now in an established position, the marketing costs now stand at 9% of revenue in 2012 as compared to 11% in 2007.
Finance costs increased with higher amount of borrowings, which were obtained for business diversification and expansion projects.
SUMMARY OF SIGNIFICANT ACCOUNTING POLICIES
The significant accounting policies applied in the preparation of these financial statements are set out below. These policies have been consistently applied to all the years presented, unless otherwise stated.
Basis of preparation
These financial statements have been prepared in accordance with the requirements of the Companies Ordinance, 1984 (the Ordinance), directives issued by the Securities and Exchange Commission of Pakistan (SECP) and the approved financial reporting standards as applicable in Pakistan. Approved financial reporting standards comprise of such International Financial Reporting Standards (IFRSs) issued by the International Accounting Standards Board (IASB) as are notified under the provisions of the Ordinance.
Property, plant and equipment
These are stated at historical cost less accumulated depreciation and impairment losses, if any, except capital work-in-progress which is stated at cost. Historical cost includes expenditure that is directly attributable to the acquisition of the items including borrowing costs (note 2.20). The cost of self constructed assets includes the cost of materials and direct labor, any other costs directly attributable to bringing the asset to a working condition for its intended use, and the costs of dismantling and removing the items and restoring the site on which they are located. Purchased software that is integral to the functionality of the related equipment is capitalized as part of that equipment.
Where major components of an item of property, plant and equipment have different useful lives, they are accounted for as separate items of property, plant and equipment. Subsequent costs are included in the asset’s carrying amount or recognized as a separate asset, as appropriate, only when it is probable that future economic benefits associated with the item will flow to the Company and the cost of the item can be measured reliably.. All other repairs and maintenance are charged to the statement of comprehensive income during the financial period in which they are incurred.

Depreciation is charged to the statement of comprehensive income using the straight line method whereby the cost of an operating asset less its estimated residual value is written off over its estimated useful life.
Depreciation on addition is charged from the month following the month in which the asset is available for use and on disposals up-to the preceding month of disposal. Depreciation method, useful lives and residual values are reviewed annually.
Impairment of non-financial assets
Non-financial assets are reviewed at each balance sheet date to identify circumstances indicating occurrence of impairment loss or reversal of previous impairment losses. An impairment loss is recognized for the amount by which the asset’s carrying amount exceeds its recoverable amount. The recoverable amount is the higher of an asset's fair value less cost to sale and value in use. Reversal of impairment loss is restricted to the original cost of the asset.
Non-current assets (or disposal groups) held-for-sale
Non-current assets (or disposal groups) are classified as assets held for sale when their carrying amount is to be recovered principally through a sale transaction rather than continuing use and a sale is considered highly probable. They are stated at the lower of carrying amount and fair value less costs to sell. Impairment losses on initial classification as held for sale and subsequent gains or losses on re-measurement are recognized in the statement of comprehensive income.
Investments
Investment in subsidiary, associates and joint venture companies are initially recognized at cost. At subsequent reporting dates, the recoverable amounts are estimated to determine the extent of impairment losses, if any, and carrying amounts of investments are adjusted accordingly. Impairment losses are recognized as an expense. Where impairment losses subsequently reverse, the carrying amounts of the investments are increased to the revised recoverable amounts but limited to the extent of initial cost of investments. A reversal of impairment loss is recognized in the statement of comprehensive income.
Financial assets
The Company classifies its financial assets in the following categories: at fair value through profit or loss, held to maturity, loans and receivables, and available-for-sale. The classification depends on the purpose for which the financial assets were acquired. Management determines the classification of its financial assets at initial recognition.
Regular purchases and sales of financial assets are recognized on the trade date – the date on which the Company commits to purchase or sell the asset. Investments are initially recognized at fair value plus transaction costs for all financial assets not carried at fair value through profit or loss. Financial assets carried at fair value through profit or losses are initially recognized at fair value, and transaction costs are expensed in the statement of comprehensive income. Financial assets are derecognized when the rights to receive cash flows from the investments have expired or have been transferred and the Company has transferred substantially all risks and rewards of ownership. Available-for-sale financial assets and financial assets at fair value through profit or loss are subsequently carried at fair value. Loans and receivables are subsequently carried at amortized cost using the effective interest method.
Financial liabilities
Financial liabilities are recognized at the time when the Company becomes a party to the contractual provisions of the instrument. All financial liabilities are recognized initially at fair value less directly attributable transactions costs, if any. A financial liability is derecognized when the obligation under the liability is discharged or cancelled or expired. Where an existing financial liability is replaced by another from the same lender on substantially different terms, or the terms of an existing liability are substantially modified, such an exchange or modification is treated as a de-recognition of the original liability and the recognition of a new liability, and the difference in respective carrying amounts is recognized in the statement of comprehensive income.
Offsetting financial instruments
Financial assets and liabilities are offset and the net amount reported in the balance sheet when there is a legally enforceable right to offset the recognized amounts and there is an intention to settle either on a net basis, or realize the asset and settle the liability simultaneously.

Other receivables
These are recognized primarily at fair value and afterward measured at amortized cost using effective interest method less provision for impairment, if any. A provision for impairment is established if there is objective evidence that the Company will not be able to collect all amounts due according to the original terms of receivables. The amount of provision is charged to the statement of comprehensive income. Other receivables considered irrecoverable are written-off.
Cash and cash equivalents
Cash and cash equivalents in the statement of cash flows includes cash in hand, balance with banks, other short-term highly liquid investments with original maturities of three months or less, and bank overdrafts, if any.
Share capital
Ordinary shares are classified as equity and recognized at their face value. Incremental costs directly attributable to the issue of new shares or options are shown in equity as a deduction, net of tax, from the proceeds.
Employees' share option scheme
The grant date fair value of equity settled share based payments to employees is initially recognized in the balance sheet as deferred employee compensation expense with a consequent credit to equity as employee share option compensation reserve.
The fair value determined at the grant date of the equity settle d share based payments is recognized as an employee compensation expense on a straight line basis over the vesting period.
Borrowings
Borrowings are recognized initially at fair value, net of transaction costs incurred. Borrowings are subsequently carried at amortized cost; any difference between the proceeds (net of transaction costs) and the redemption value is recognized in the statement of comprehensive income over the period of the borrowings using the effective interest method.
Borrowings are classified as current liabilities unless the Company has an unconditional right to defer settlement of the liability for at least 12 months after the balance sheet date.
Trade and other payables

Trade and other payables are recognized initially at fair value and subsequently measured at amortized cost using the effective interest method. These are classified as current liabilities if payment is due within one year or less (or in the normal operating cycle of the business if longer). If not, they are presented as non-current liabilities.
Current and deferred income tax
The tax expense for the period comprises current and deferred tax. Tax is recognized in the profit or loss, except to the extent that it relates to items recognized in other comprehensive income or directly in equity. In this case the tax is also recognized in other comprehensive income or directly in equity, respectively.
Retirement and other service benefit obligations
Contribution plans
A contribution plan is a post-employment benefit plan under which an entity pays fixed contribution into a separate entity and will have no legal or constructive obligation to pay further amounts. The Company operates contribution provident fund for its permanent employees. Monthly contributions are made both by the Company and employees to the fund at the rate of 10% of basic salary; and defined contribution pension fund for the benefit of management employees. Monthly contributions are made by the Company to the fund at rates ranging from 12.5% to 13.75% of basic salary.
Defined benefit plans
A defined benefit plan is a post-employment benefit plan other than the defined contribution plan. The Company's net obligation in respect of defined benefit plans is calculated by estimating the amount of future benefit that employees have earned in return for their service in current and prior periods. The Company operates defined benefit funded gratuity scheme for its management employees. Annual provision is also made under a service incentive plan for certain category of experienced employees to continue in the Company’s employment.
Employees' compensated absences
The Company accounts for compensated absences on the basis of un-availed leave balance of each employee at the end of the year.
Revenue recognition
Revenue is recognized to the extent it is probable that the economic benefits will flow to the Company and the amount of revenue can be measured reliably. Revenue is measured at the fair value of the consideration received or receivable, and is recognized on the following basis:
• Dividend income from investments is recognized when the Company’s right to receive payment has been established.
• Income on deposits and other financial assets is recognized on accrual basis.
• Royalty income from subsidiary companies is recognized on an accrual basis in accordance with the agreement entered therewith.
Borrowing costs
Borrowing costs are recognized as an expense in the period in which they are incurred except where such costs are directly attributable to the acquisition, construction or production of a qualifying asset in which case such costs are capitalized as part of the cost of that asset. Borrowing costs includes exchange differences arising on foreign currency borrowings to the extent these are regarded as an adjustment to borrowing costs.
Research and development costs
Research and development costs are charged to income as and when incurred.
Earnings per share
The Company presents basic and diluted earnings per share (EPS) in respect of its ordinary shares. Basic EPS is calculated by dividing the profit or loss attributable to ordinary shareholders of the Company by the weighted average number of ordinary shares outstanding during the period..
Dividend and appropriation to reserves
Dividend and appropriation to reserves are recognized in the financial statements in the period in which these are approved.
Long term debt:
The company has long term borrowings of Rs. 18284 million in 2007, Rs. 40739million in 2008, Rs. 84142 million in 2009, Rs. 89152 million in 2010, Rs. 83560 million on 2011, Rs. 73257 million in 2012
On June 28, 2012, the Company entered into a long term finance agreement with Engro Eximp (Private) Limited, a subsidiary company, for Rs. 800,000 at a mark-up rate of 3 months KIBOR plus 2.25% payable quarterly. On September 28, 2012, an addendum was signed whereby; the mark-up rate has been changed to 6 months KIBOR on the day of funds transfer plus 3.5% payable quarterly. On December 28, 2012, a further addendum was signed to increase the finance facility under the agreement to Rs. 1,150,000. The principal is due in one lump sum installment falling due on June 28, 2017. 6.3 On December 31, 2012, the Company entered into a subordination agreement with Engro Eximp (Private) Limited and various banks whereby, out of the total outstanding principal amount of long term loan amounting to Rs. 1,150,000, as referred to in note 6.2, an amount of Rs. 430,000 has been subordinated to the subsidiary company's existing finance facilities extended by the banks, which are parties to the subordination agreement
Employee share option scheme
Under the Employee Share Option Scheme (the Scheme), senior employees who were critical to the business operations were granted options to purchase 5 million newly issued ordinary shares at an exercise price of Rs. 277 per ordinary share. As per the Scheme, the entitlements and exercise price were subject to adjustments because of issue of right shares and bonus shares. The number of options granted to an employee was calculated in accordance with the criticality of employee to the business and their ability and was subject to approval by the Compensation Committee. No amounts were paid or payable by the recipient on receipt of the option. The options carried neither right to dividends nor voting rights. Vesting period started from the date of grant, for employees who were granted shares on or before June 30, 2008 and ended on December 31, 2010, where after these options were to be exercised within a period of two years ended on December 31, 2012. For options granted after June 30, 2008, the vesting period was to end such number of days after December 31, 2010 as was equal to the number of days between the date the initial option letters were issued and the date of grant of the later options. However, the later options could only be exercised up to December 31, 2012.The exercise period under the scheme expired on December 31, 2012, due to which all outstanding share options have lapsed. In 2008, the grant date was changed to August 23, 2007, from the date approved in the original scheme. Further, consequent to the issue of right shares in 2008 and in 2010, the entitlements were increased to 5,500,000 shares and 7,700,000 shares respectively and the exercise price was adjusted to Rs. 267.73 per share and Rs. 205.52 per share respectively. Further, consequent to the bonus issue in the current year, the entitlements were increased to

3,001,799 shares from 2,309,076 shares (adjusted with the effect of forfeiture) respectively and the exercise price was adjusted to Rs. 119.80 from Rs. 155.70 respectively. These changes were duly approved by the Securities and Exchange Commission of Pakistan. The aforementioned reduction in exercise price had no effect on the fair value of share options recognized in the financial statements. However, due to the expiry of the scheme, all outstanding share options have lapsed as at year end.
Earnings per shareEPS is based upon the weighted average number of shares outstanding, it is 5.63 in 2007, 8.23 in 2008, 7.27 in 2009, 13.28 in 2010, 15.77 in 2011 and 2.61 in 2012.
SHARE CAPITAL
Authorized Capital
No.of shares (rupees)2012 2011 2012 2011
550,000,000 450,000,000 5,500,000 4,500,000
Ordinary Shares of Rs. 10 each 5,500,000 4, 500,000
Issued, subscribed and paid-up capital
2012 2011(No. Of shares)
185,354,484 185,354,484325,914,951 207,929,697511,269,435 393,284,181Ordinary shares of Rs. 10 each fully paid in cashOrdinary shares of Rs. 10 each issued as fully paid bonus shares
2012 2011(rupees)
1,853,545 1,853,5453,259,149 2,079,2985,112,694 3,932,843
Movement in issued, subscribed and paid-up share capital during the year
2012 2011(no. of shares)
393,284,181 327,736,819117,985,254 65,547,362511,269,435 393,284,181
As at January 1Ordinary share of Rs. 10Each issued during the year as fully paidBonus shares
2012 2011(rupees)
3,932,843 3,277,3691,179,851 655,4745,112,694 3,932,843
During the year, the Company: increased its authorized share capital from Rs. 4,500,000 to Rs. 5,500,000; and Issued bonus shares in the ratio of 3 shares for every 10 shares held.
As at December 31, 2012 associated companies held 228,787,241 (2011: 186,500,772) ordinary shares in the Company
RATIO ANALYSIS
As the current ratio of the company increases from 2009 to 2007 this shows that company is
highly liquid and it decreases from 2012 to 2010 it means company is not very efficient to pay
its debts during these years, the acid test ratio decreases from 2007 to 2012 this also shows the
poor liquidity of the firm and from 2007 to 2009 the company have a positive net working
capital but 2010 to 2012 the company’s net working capital gets negative that shows that its
current liability is greater than current assets.
Receivable turnover ratio is decreasing from 2007 to 2012 it means that company is inefficient
to collect cash from its receivables, ACP is increasing from 2007 to 2012 it means company
takes much more times in collecting its receivables, inventory turnover is fluctuating but it
decreases from 2010 to 2012 it means company sales are decreasing, inventory ITID also
fluctuating but it increases from 2010 to 2012 this shows company’s inventory is taking time to
convert into sales, total asset turnover increases from 2009 to 2012 it means company is
efficiently using its total assets but this ratio is maximum in 2007 and operating cycle of the
company increases from 2007 to 2012 except 2008 this shows company is taking more time
between the acquisition of goods and final cash realization from sales and subsequent
collection.
Debt to equity ratio is increasing from 2007 to 2012 this shows that company is used more
debt financing with respect to equity, long term debt to total capitalization is increasing from
2007 to 2010 and decreasing from 2012 to 2011 this shows that out of total capitalization how
much long term debt is used by company for financing, the company have negative interest
coverage ratio in 2007, 2008 and 2012 and high value in 2009 but the five year average of this
ratio shows that the company earning is not enough to pay its interest expense
Gross profit, operating profit margin and net profit margin of the company is fluctuating
throughout five years but it is minimum in 2012 this shows that with respect to all five years the
company have minimum profit in 2012, return on investment is maximum in 2007 and 2008
than it decreases and minimum in 2012 this shows that in 2012 company get little return on its
total assets, return on equity is fluctuating throughout five years but it is maximum in 2012this
shows that in 2012 the is getting high return on its shareholder investment, the EPS is
maximum in 2008, 2010 and 2011 and it is minimum in 2012 this shows that in 2012 the
company get very little profit against one share, price to earnings ratio is fluctuating from 2007
to 2011 but in 2012 it is maximum this represents the efficiency of the company and book value

per share is fluctuating throughout five years and it is minimum in 2012 this shows that in 2012
the useful life of per share is less as compared to other years


