
Data Summary Report Environmental Conditions Investigation High Street Outfall and 40th Avenue Storm Sewer System Vasquez Boulevard/Interstate 70 Site, Operable Unit #2 Removal Action Prepared for:
City and County of Denver Environmental Quality Division 200 West 14th Ave, Suite 310 Denver, Colorado 80204
Prepared by:
Engineering Management Support, Inc.
7220 W. Jefferson Ave., Suite 406
Lakewood, Colorado 80235
September 18, 2015

Data Summary Report Page i
TABLE OF CONTENTS
1 INTRODUCTION ............................................................................................................ 1 1.1 Background .................................................................................................................. 1
1.2 Purpose and Objective ................................................................................................. 1 1.3 Report Organization ..................................................................................................... 2
2 DESIGN INVESTIGATION ACTIVITIES ..................................................................... 3 2.1 Health and Safety ......................................................................................................... 3 2.2 Boring Locations .......................................................................................................... 3
2.3 Borehole Drilling and Sampling .................................................................................. 3 2.4 Piezometer Construction.............................................................................................. 5 2.5 Groundwater Level Measurements .............................................................................. 5 2.6 Groundwater Sampling ................................................................................................ 5
2.7 Sample Description...................................................................................................... 5 2.8 Soil Gas Monitoring .................................................................................................... 6
2.9 Decontamination and Investigative Derived Waste (IDW) Management ................... 6 2.10 Borehole/Piezometer Abandonment ........................................................................... 7
3 DESIGN INVESTIGATION RESULTS .......................................................................... 8 3.1 Waste Material Characterization ................................................................................. 8 3.1.1 Physical Characteristics and Extent ........................................................................... 8
3.1.2 Field Screening Results.............................................................................................. 9 3.1.3 Waste Analytical Results ........................................................................................... 9
3.1.4 Asbestos Results ...................................................................................................... 10 3.2 Hydrogeology .......................................................................................................... 11 3.2.1 Groundwater Occurrence ......................................................................................... 11
3.2.2 Flow Direction ......................................................................................................... 11
3.2.3 Saturated Thickness ................................................................................................. 11 3.2.4 Groundwater Analytical Results .............................................................................. 11
4 CONCLUSIONS AND RECOMMENDATIONS ......................................................... 13
4.1 Waste Material Handling .......................................................................................... 13 4.2 Barrier Positioning .................................................................................................... 13
4.3 Odor and Methane Control ....................................................................................... 14 REFERENCES ....................................................................................................................... 15
LIST OF TABLES
Table 1: Geologic and Piezometer/Well Completion Summary
Table 2: Groundwater Elevations
Table 3a: Waste Material TCLP Metals
Table 3b: Waste Material TCLP Volatile Organic Compounds
Table 3c: Soil - Total Metals
Table 3d: Soil - Volatile Organic Compounds
Table 3e: Soil - Poly-nuclear Aromatic Hydrocarbons
Table 4a: Groundwater Quality – Metals
Table 4b: Groundwater Quality – Inorganics
Table 4c: Groundwater Quality – Volatile Organic Compounds

Data Summary Report Page ii
TABLE OF CONTENTS (continued)
LIST OF FIGURES
Figure 1: Base Map
Figure 2: Bedrock Surface Map
Figure 3: Waste/Overburden Thickness Map
Figure 4a: Potentiometric Surface Map, July 2015
Figure 4b: Potentiometric Surface Map, August 2015
Figure 5: Saturated Thickness Map, July 2015
Figure 6: Subsurface Profile Along Channel Alignment
LIST OF APPENDICES
Appendix A: Boring Logs, Piezometer Construction Diagrams, and Groundwater Sampling
Records
Appendix B: Waste Screening Results, Analytical Results, and Data Validation Reports
Appendix C: Asbestos Report

Data Summary Report Page iii
LIST OF ACRONYMS
ACM Asbestos-Containing Material
AIHA American Industrial Hygiene Association
bgs Below ground surface
CABI Certified Asbestos Building Inspector
CDOT Colorado Department of Transportation
CDPHE Colorado Department of Public Health and Environment
CDPS Colorado Discharge Permit System
COC Compound of Concern
DSR Data Summary Report
EMSI Engineering Management Support, Inc.
FSP Field Sampling Plan
HASP Health and Safety Plan
IDW Investigative-Derived Waste
LEL Lower Explosive Limit
MMP Materials Management Plan
PAHs Poly-nuclear-aromatic Hydrocarbons
PID Photo-ionization Detector
PVC Poly-vinyl chloride
OU-2 Operable Unit #2
QAPP Quality Assurance Project Plan
QA/QC Quality Assurance/Quality Control
RACS Regulated Asbestos-Containing Soil
RAWP Response Action Work Plan
RCB Reinforced Concrete Box
RCRA Resource Conservation and Recovery Act
RTD Regional Transportation District
SAP Sampling and Analysis Plan
SPT Standard Penetration Test
SWDI Stormwater Design Investigation
TCLP Toxicity Characteristic Leaching Procedure

Data Summary Report Page iv
USEPA United States Environmental Protection Agency
VOCs Volatile Organic Compounds
WQCD Water Quality Control Division
Data Summary Report Page 1
1 INTRODUCTION
1.1 Background
The City and County of Denver (Respondent) has completed a field investigation to
assess baseline environmental conditions needed to support design of the “environmental
components” of a stormwater drainage feature to be constructed through a portion of
Operable Unit 2 of the VB/I70 Superfund Site. The Respondent is implementing the
“environmental components” pursuant to an Administrative Settlement Agreement and
Order on Consent for Removal Action (Agreement) with the United States
Environmental Protection Agency (USEPA). The stormwater drainage feature is part of
a larger project that is intended to reduce flooding in the Montclair Drainage Basin area
and address stormwater management needs associated with projects being developed by
Regional Transportation District (RTD), Colorado Department of Transportation
(CDOT), and the Respondent.
The “environmental components” to be addressed by the Agreement consist of: 1)
management and handling of waste material encountered during construction of the
stormwater drainage feature through the Denver Coliseum parking lot and Globeville
Landing Park; 2) management and, if necessary treatment and/or disposal of dewatering
liquid during construction of this segment of the drainage feature; and 3) design and
construction of an impermeable barrier system to prevent contaminants remaining within
the boundaries of this segment of the stormwater drainage feature from adversely
impacting stormwater retained within and conveyed by the stormwater drainage feature,
as well as prevent stormwater infiltration into contaminated media remaining beneath or
surrounding this segment of the feature.
1.2 Purpose and Objectives
This Data Summary Report (DSR) presents results from the field sampling and analytical
program that is described in the Sampling and Analysis Plan (SAP) (Removal Action
Work Plan [RAWP] Appendix C, EMSI, 2015) for the “environmental components” of
the stormwater drainage feature described above. The overall objectives of the field
program are to 1) assess the depth and thickness of waste material along the alignment of
the drainage feature, 2) assess whether the waste material is characteristically hazardous
or non-hazardous under the Resource Conservation and Recovery Act (RCRA); 3) assess
the depth to groundwater and general direction of groundwater movement; 4) assess the
saturated thickness of material currently within and beneath the drainage feature; and 5)
assess the quality of groundwater that may need to be pumped and released during
construction. Ultimately, these data are needed to support development of 1) waste
handling, management, and disposal procedures during construction; 2) selection of a
geosynthetic material required for the impermeable barrier system; 3) dewatering
requirements to enable “dry” construction of the impermeable barrier system; 4)
Data Summary Report Page 2
treatment requirements for dewatered water to be released to surface water; and 5) odor
and methane mitigation measures during construction of the drainage feature. All of
these issues will be addressed during design of the “environmental components”, which
is scheduled to be performed during the 3rd
and 4th
quarters of 2015.
1.3 Report Organization
This DSR is organized into the following three sections:
Section 2 – Design Investigation Activities
Section 3 – Design Investigation Results
Section 4 – Conclusions and Recommendations
Supporting appendices consist of:
Appendix A – Boring Logs, Piezometer Construction Diagrams, and Groundwater
Sampling Records
Appendix B – Waste Screening Results, Analytical Results, and Data Validation
Reports
Appendix C – Asbestos Report

Data Summary Report Page 3
2 DESIGN INVESTIGATION ACTIVITIES
2.1 Health and Safety
Prior to performance of field activities, all project personnel read, understood, and agreed
to comply with provisions of the project Health and Safety Plan (HASP) (RAWP
Appendix E, EMSI, 2015). Necessary safety equipment were readily available at the Site
at all times during on-Site activities.
2.2 Boring Locations
Samples of waste material and subsurface condition information were collected from 16
boreholes identified as the Surface Water Design Investigation (SWDI)-series borings
shown in purple on Figure 1. These borings were in addition to 15 geotechnical borings
identified as the TH-series and shown in red on Figure 1 that were drilled by CTL
Thompson as part of their geotechnical investigation for the drainage feature. In
addition, geologic data from three borings drilled by Metro Wastewater in the 1990s were
evaluated in this study. Those borings, also identified as TH-series, are shown in green
on Figure 1. Finally, soil borings drilled as part of the 2008 Remedial Investigation
(EMSI, 2009) were reviewed for waste thickness. Only one boring, SB-4-3 and shown in
black on Figure 1, encountered bedrock – that boring has been added to this investigation.
Geologic logs for all of the borings noted above are presented in Appendix A and
summarized in Table 1.
Temporary piezometers were installed in 15 of the 16 SWDI-series borings. Boring
SWDI-11 was not completed as a piezometer because existing monitoring well CTL
MW-6 is located adjacent to it, and is accessible for potentiometric monitoring and
groundwater quality sampling (Figure 1). All of the 15 piezometers, plus well CTL MW-
6 were sampled for groundwater quality. In addition, groundwater levels were monitored
in all 15 piezometers, plus well CTL MW-6 and existing wells MW-1, MW-2, and MW-3
(Figure 1). Piezometer and well construction diagrams for all of these piezometers and
wells are presented in Appendix A and summarized in Table 1.
2.3 Borehole Drilling and Sampling
All of the SWDI-series borings except three were drilled with 6.25” outside diameter and
3.25” inside diameter hollow-stem augers. The drill rig was equipped with a 140-pound
standard penetration test (SPT) pneumatic hammer and 2-ft long split-barrel SPT
samplers. SPT samples were collected at 5-foot intervals beginning at five feet below
ground surface (bgs). SPT blow counts for each 6-inches of barrel penetration were
recorded. Between sampling intervals, drill cuttings and rig penetration rates were
observed to assess borehole lithology. Boreholes were drilled through waste material

Data Summary Report Page 4
into a minimum of 5-feet of underlying soil, weathered bedrock, or until auger refusal
was encountered, whichever occurred first. At that depth, a final SPT sample was
collected.
The three boreholes not drilled with hollow-stem augers were borings SWDI-13, 14, and
16 (Figure 1). Those were drilled with a direct-push Geoprobe track-mounted rig
because access to the drill sites precluded use of the heavier hollow-stem auger rig. For
those borings, a 3.25” outside diameter and 2 5/8” inside diameter drive casings equipped
with continuous coring plastic sleeves were used to advance the boring and collect
samples, respectively.
Three types of solids samples were collected; samples for toxicity characteristic leaching
procedure (TCLP) testing, samples for total chemical constituents, and samples for
asbestos-containing material (ACM). Note: The SAP also called for geotechnical
sampling if such sampling was determined necessary by the Geotechnical Engineer
(CTL-Thompson) following review of their geotechnical investigation. At the start of
this environmental investigation, CTL-Thompson informed the Respondent that
additional geotechnical sampling was not necessary, so geotechnical samples were not
collected as part of this investigation. The three types of samples collected for this
investigation consisted of:
TCLP Testing: A vertical composite of the material estimated to be removed from the
sample location was collected in accordance with the SAP. In addition, a grab sample for
volatile organic compounds (VOCs) was collected from the SPT interval that exhibited
the highest photo-ionization detector (PID) or lower explosive limit (LEL) reading in the
borehole. The composite sample was then screened for hazardous characteristics
consisting of ignitability, corrosivity, reactivity, oxidizers, and paint filter test in
accordance with the SAP. Composite samples for TCLP testing for RCRA metals were
placed in jars supplied by the analytical laboratory. Note: the SAP also called for TCLP
analysis of poly-nuclear aromatic hydrocarbons (PAHs), but there are no TCLP
regulatory levels for PAHs, so TCLP PAH analyses were not performed.
Total Chemical Constituents: Samples for chemical constituent analyses, which are
necessary for selection of the barrier geosynthetic material, were sampled from
immediately below the proposed liner depths, to the extent such placement could be
estimated. One sample per boring was collected using the SPT sampler. The sample was
screened for VOCs and submitted to the laboratory for analysis of VOCs, PAHs, arsenic,
and lead in accordance with the SAP.
ACM Testing: Any borehole cutting or SPT sample suspected of containing asbestos
was visually characterized and submitted to an American Industrial Hygiene Association
(AIHA) accredited laboratory for analysis in accordance with the SAP. The sampling
and visual characterization were performed by a Colorado Certified Asbestos Building
Inspector (CABI).
Data Summary Report Page 5
2.4 Piezometer Construction
Piezometers were constructed of 1-inch diameter, threaded, flush-joint, polyvinyl
chloride (PVC) well casing. Piezometer screens were positioned from the base of the
borehole to 12-inches above the groundwater level when first encounter during drilling,
and as projected based on water level data from nearby wells and piezometers.
Construction details followed those described in the SAP. Upon completion, the top of
PVC casing was surveyed by a licensed land surveyor for vertical elevation and lateral
coordinates. Piezometer construction diagrams are presented in Appendix A and
summarized in Table 1.
After a period of at least 48-hours following piezometer completion, piezometers were
developed using a 0.75-inch diameter disposable bailer until water turbidity stabilized.
2.5 Groundwater Level Measurements
Groundwater levels were measured with a battery-powered portable water level sensor in
accordance with the SAP. Monthly groundwater levels are being collected to assess
temporal variability. As of the date of this report, two measurements have been
completed; one in July and one in August, 2015.
2.6 Groundwater Sampling
Piezometers and monitoring wells were purged and sampled in accordance with the SAP.
Sample collection records are presented in Appendix A.
Samples were analysed for metals (As, Cd, Cu, Cr(III), Cr(VI), Fe, Pb, Mn, Ni, Se, Ag,
U, and Zn), inorganics (ammonia, chloride, nitrate, nitrite, sulfate, and sulfide), and
VOCs. Metals fractions included dissolved, potentially dissolved, total recoverable,
and/or totals analyses. Filtration required for the dissolved fraction was performed by
the laboratory within 24 hours of sample collection. Analytical results were validated in
accordance with the Quality Assurance Project Plan (QAPP) (RAWP Appendix C-2,
EMSI, 2015). Validated analytical results, along with data validation reports, are
presented in Appendix B.
2.7 Sample Description
Each new boring was numbered with a prefix of SWDI, designating it as part of the
Storm Water Design Investigation. For example: SWDI-7.
Waste material samples were identified and numbered using a two-part numbering
system that consisted of the borehole number and the sample depth interval. For

Data Summary Report Page 6
example, SWDI-7-15-17 indicates the sample was collected from boring SWDI-7 in the
15 to 17-foot depth interval.
Composite samples for TCLP testing were identified by adding a “COMP” to the end of
the boring number. For example, SWDI-7-COMP indicates a composite of the waste to
be removed from the above the liner at that boring location.
The piezometers were designated with the same number as the borehole into which they
are completed. Therefore, a groundwater sample collected from piezometer SWDI-5 was
labeled SWDI-5. A field duplicate was identified by adding a “D” to the end of the
sample number (e.g., SWDI-5D).
2.8 Soil Gas Monitoring
Monitoring for soil gas using a calibrated PID and 4-gas meter was performed during all
borehole drilling and sampling activities. Air quality was also monitored in the breathing
space adjacent to an open boring or completed well or piezometer, and at the top of the
open boring, well, or piezometer during drilling and water quality sampling. Air quality
was monitored for 1) total VOCs using a calibrated hand-held PID, and 2) oxygen
content, combustible gas levels, carbon monoxide (CO), and hydrogen sulfide (H2S)
using a calibrated hand-held 4-gas meter. Air monitoring was conducted continuously
during all activities when there was potential exposure to oxygen deficiency, explosive
vapors, methane, CO, H2S, or VOCs.
2.9 Decontamination and Investigative Derived Waste (IDW) Management
The drill rig, auger flights, drill bits and soil sampling equipment were pressure washed
or steam cleaned prior to arrival on-Site. Following completion of each borehole, auger
flights, drill bits, sampling rods, and soil coring equipment that were used downhole,
were pressure washed over a portable wash basin. Management of the decontamination
water was performed in accordance with the Materials Management Plan (MMP) (RAWP
Appendix D, EMSI, 2015).
All soil cuttings generated by drilling the boreholes were containerized at the time of
drilling. The containers were labeled as to their contents with the borehole number and
the date of drilling indicated on the label. The containers were then transported to a
central staging area designated by the EMSI Project Manager for screening and disposal
in accordance with the MMP.
Management of liquids generated from well development, purging, and sampling were
performed in accordance with the MMP.
Used personal protective equipment (e.g., gloves, paper towels) were placed in plastic
garbage bags and disposed of as solid waste in accordance with the MMP.

Data Summary Report Page 7
2.10 Borehole/Piezometer Abandonment
All piezometers installed during this field program remain in place, but will be removed
during construction of the barrier system. If the barrier excavation does not extend to the
base of the piezometer casing, the remaining PVC casing will be removed and the open
borehole will be backfilled with sand or bentonite.

Data Summary Report Page 8
3 DESIGN INVESTIGATION RESULTS
Waste material characterization and quality, and hydrogeology and groundwater quality
are presented in this section.
3.1 Waste Material Characterization
The physical characteristics, lateral and vertical extent, hazardous material screening
results, analytical results, and asbestos content of waste material beneath the Coliseum
parking lot, and soil and debris beneath the Globeville Landing Park, are discussed in the
following paragraphs.
3.1.1 Physical Characteristics and Extent
Coliseum Parking Lot
Beneath the Coliseum parking lot, waste material typically consists of fill comprised of
fine silty, clayey sand mixed with ash, woody material, fragments of glass, brick, wire,
and plastic, and decomposed organics. The material is generally soft, with SPT blow
counts of 5 to 10 per 12 inches of penetration. Most of the waste material is black, moist,
and releases an odor of decomposing organics. Low levels of methane <10% by volume
were detected in core samples, but higher levels (up to 30% by volume) were detected in
open boreholes. Carbon monoxide, hydrogen sulfide, and VOCs were not detected in
core samples or head space above open boreholes.
As shown in Table 1, the waste interval encountered in the parking lot borings (SWDI-1
through 8) generally started 3 to 4 feet bgs and extended to 14 to 25 feet bgs. In three of
the eight borings, waste material extended to the top of bedrock (SDWI-3 and 5), or to
within 0.5 feet of the top of bedrock (SWDI-6). In another three borings, waste material
ended 5.5 to 12 feet above the top of bedrock (SWDI-7 @ 5.5 feet, SWDI-4 @ 9 feet, and
SWDI-8 @ 12 feet). The other two SWDI borings did not encounter bedrock at total
depths of 14 feet (SWDI-2) and 20 feet (SWDI-1). The bedrock encountered is dense
blue-grey shale, often referred to as the “Denver Blue”. It is discussed further, below.
Globeville Landing Park
Disturbed soil beneath the Globeville Landing Park is present in zones identified as “soil
and debris” on the boring logs. The material is generally described as well-graded to silty
sand with some clay, gravel, and cobbles mixed with brick, concrete, and wood
fragments. It is generally more dense than the waste material beneath the Coliseum
parking lot, but SPT blow counts were similar to those of the waste material beneath the
Coliseum parking lot in borings SWDI-9, 10, and 12. Malodors and low levels of
methane were only detected in “soil and debris” from borings SWDI-9, 10, and 12.

Data Summary Report Page 9
Carbon monoxide, hydrogen sulfide, and VOCs were not detected in core samples or
head space above open boreholes drilled in the Globeville Landing Park.
As shown in Table 1, the “soil and debris” encountered in Globeville Landfill Park
borings (SWDI-9 through 16) was randomly distributed. When encountered, it started 2
to 4 feet bgs and extended to as deep as 31.8 feet bgs. Thicknesses ranged from 0. 5 feet
in SWDI-9 to 27.8 feet in SWDI-10. Three of the SWDI borings did not encounter “soil
and debris”.
Top of Bedrock and Waste/Overburden Thickness
For removal action planning purposes, a top of bedrock contour map and an isopleth map
illustrating waste/overburden thicknesses above the bedrock surface were prepared and
are presented as Figures 2 and 3, respectively. The uppermost bedrock beneath the Site is
the Denver Formation (“Denver Blue”), which consists of claystone, shale, and siltstone
with silty sandstone lenses and typically contains approximately 70% claystone and shale
and 30% sandstone and siltstone (EMSI, 2009). As shown on Figure 2, the bedrock
surface slopes gently eastward to north-eastward in the vicinity of the stormwater feature
beneath the parking lot, but undulates west of the parking lot with a localized low in the
vicinity of TH-36, a localized high in the vicinity of TH-39. From TH-39 it slopes
steeply to the west and northwest toward the South Platte River.
Figure 3 shows the waste/overburden thickness above bedrock. The waste/overburden is
a combined measure of soil, debris, and/or waste material between the top of bedrock and
the ground surface. Within the proposed surface cuts of the stormwater channel, the
waste/overburden thickness ranges from 23 to 30 feet beneath the parking lot, and from 8
to 32 feet beneath Globeville Landing Park.
3.1.2 Field Screening Results
None of the composite samples for waste or soil and debris screened positive for
hazardous waste characteristics and none failed the paint filter test (Appendix B).
3.1.3 Waste Analytical Results
A Level III validation was performed on laboratory analytical results. It consisted of
manually examining data deliverables to determine data quality. Data validation included
application of data qualifiers to the analytical results based on adherence to method
protocols and project-specific Quality Assurance/Quality Control (QA/QC) limits.
Parameters reviewed included:
Analytical holding times;
Method blanks;
Trip blanks;

Data Summary Report Page 10
Matrix spikes/matrix spike duplicates;
Laboratory control samples;
Shipping cooler temperatures;
Laboratory duplicates;
Internal standards; and
Out-of- control QC parameters that are mentioned in case narratives.
Definitions of the data qualifiers are footnoted in the summary tables discussed below.
Tables 3a and 3b show TCLP toxicity results for metals and VOCs in waste material and
soil and debris. None of the samples exceeded RCRA criteria for hazardous waste.
Table 3c shows total arsenic and lead concentrations in subsurface soil, waste material, or
soil and debris material that may come in contact with the barrier liner material. Based
on vendor information, none of these concentrations should constrain material selection;
this will be confirmed during design.
Table 3d shows total VOC concentrations in subsurface soil, waste material, or soil and
debris material that may come in contact with the barrier liner material. Based on vendor
information, none of these concentrations should constrain material selection; this also
will be confirmed during design.
Table 3e shows total PAH concentrations in subsurface soil, waste material, or soil and
debris material that may come in contact with the barrier liner material. Based on vendor
information, none of these concentrations should constrain material selection; this too,
will be confirmed during design.
3.1.4 Asbestos Results
As described in the Asbestos Identification Survey in Appendix C, 14 bulk samples of
suspected ACMs were collected. With the exception of one sample collected from
SWDI-10 from 15 to 17 feet bgs, none of the samples contained asbestos. The single
sample contained chrysotile asbestos in a bundle of 5 fibers. The material had the visual
appearance of black silt / ash with shiny particles, but the type of material was not
discernable. The approximate asbestos fiber content was a trace (less than 1% chrysotile
asbestos). This is less than the USEPA and Colorado Regulation 8 criteria of 1 percent of
the total material for consideration of the material to be an ACM. Nonetheless, the
sample is classified as a regulated asbestos-containing soil (RACS). It could not be sub-
classified as either friable or non-friable because the documented chrysotile asbestos was
only a bundle of 5 fibers from an unknown material.

Data Summary Report Page 11
3.2 Hydrogeology
The occurrence of groundwater, direction of groundwater movement, saturated thickness,
and groundwater analytical results are discussed in the following paragraphs.
3.2.1 Groundwater Occurrence
Shallow groundwater occurs in an unconfined alluvial aquifer, which is comprised of
alluvium, waste material, and soil and debris material that overlies bedrock. As
summarized in Table 2, depths to groundwater are typically 9 to 14 feet bgs in the
Coliseum parking lot and 10 to 23 feet bgs in the Globeville Landing Park. Additional
measurements will be taken monthly for the next 6 months to assess temporal variability
in the groundwater table over time.
3.2.2 Flow Direction
As shown on Figures 4a and 4b, the potentiometric surfaces in July and August, 2015
generally slope toward the north-northwest beneath the parking lot, and toward the west-
northwest beneath the Globeville Landing Park. These directions do not appear to be
influenced by bedrock topography, but rather, by general flow direction toward the South
Platte River.
3.2.3 Saturated Thickness
As shown in Figure 5, the saturated thickness of the alluvial aquifer is greatest in the
vicinity of SWDI-4, 5, and 6 (approximately 14 feet), then decreases with distance
toward the South Platte River to 3.25 feet at SWDI-14.
3.2.4 Groundwater Analytical Results
Similar to the waste, soil, and debris samples discussed above, a Level III validation was
performed on groundwater analytical results. The same data validation protocols and
qualifiers were applied to the groundwater quality data.
Table 4a summarizes metals results in dissolved, potentially dissolved, total recoverable,
and/or totals fractions. Preliminary discharge limits for release of dewatering water to the
South Platte River and Sand Creek are presented at the top of the table. Note: these
preliminary limits are based on published numeric standards under 5 CCR 1002-38
(Regulation No. 38) for Segments 14 and 16c of the South Platte River Basin. Actual
limits under a site-specific Colorado Discharge Permit System (CDPS) remediation
permit, which is currently being prepared Colorado Department of Public Health and

Data Summary Report Page 12
Environment, Water Quality Control Division (CDPHE WQCD), may differ. Assuming
that sand or bag filtration to 25 microns, followed by bag or cartridge filtration to 0.5
microns will be required, metals that may still exceed discharge limits to the South Platte
River and Sand Creek consist of arsenic, iron, and manganese. Additional metals that
might possibly exceed discharge limits to the South Platte River consist of cadmium,
chromium III, lead, silver, and uranium. Of these, only cadmium and lead might possibly
exceed discharge limits to Sand Creek.
Table 4b summarizes results of inorganic compounds of potential concern. With or
without filtration, compounds that may exceed discharge limits to the South Platte River
consist of ammonia, chloride, sulfate, and possibly nitrate, nitrite, and sulfide.
Compounds that may exceed discharge limits to Sand Creek consist of ammonia and
possibly sulfide.
Table 4c summarizes results of VOCs of potential concern. With or without filtration,
compounds that may exceed discharge limits to the South Platte River and Sand Creek
consist of benzene, tetrachloroethene, trichloroethene, and vinyl chloride.

Data Summary Report Page 13
4 CONCLUSIONS AND RECOMMENDATIONS
4.1 Waste Material Handling
Waste material from the Coliseum parking lot, and soil and debris from the Globeville
Landing Park screened negative for hazardous waste by characteristic. In addition, the
samples passed the paint filter test. Therefore, in the absence of RACS, these materials
may be profiled as a special non-hazardous waste and may be disposed at the Denver
Arapahoe Disposal Site (DADS).
A small amount of soil and debris from one boring in the Globeville Landing Park was
found to contain asbestos. Even though the asbestos content was less than 1% of the
material sampled, it was determined to be a RACS. It should be noted that this detection
of RACS in the Globeville Landing Park is consistent with asbestos detections by others
in waste material beneath the Coliseum parking lot (CTL-Thompson, 2013).
Consequently, when waste material from the Coliseum parking lot and soil and debris
from the Globeville Landing Park are excavated, a CABI will need to be present to 1)
observe for the presence of RACS, and 2) if determined to be RACS, manage the
material in accordance with the MMP. RACS may also be disposed at DADS under
special-waste manifest and in accordance with proper handling and disposal protocol.
4.2 Barrier Positioning
A profile illustrating the preliminary alignment of the stormwater drainage feature
relative to ground surface, groundwater surface, and top of bedrock is presented as Figure
6. For stationing reference, please see Figure 1. Key observations relative to the
“environmental components” of the stormwater drainage feature consist of:
1) The potentiometric surface is at or slightly below the bottom of the proposed
reinforced concrete box (RCB) culvert that begins at station 15+00 and extends
downstream to station 8+30. Little, if any, dewatering may be necessary through
this reach.
2) The potentiometric surface is at, slightly below, or slightly above the channel
grade of the open channel reach between stations 8+30 and 2+80, where the open
channel ends. However, in order to construct a channel liner beneath this segment
that will be about 3 feet lower than the channel grade shown on the figure, the
water table may need to be lowered by about 5 feet.
3) Further to the west, where the 10-year stormwater flow will be conveyed via RCB
beneath the sanitary sewers, then into an open channel to the South Platte River,
the alluvium will need to be dewatered to the top of bedrock, which translates to 5
to 7 feet below the current groundwater table.

Data Summary Report Page 14
4) Subsoils in the Coliseum parking lot beneath the proposed RCB and open channel
segment contain decomposed organics, are very soft, and have little, if any
compressive strength (personal communication with CTL Thompson). These
soils will need to be strengthened with in-situ conditioning, or replaced with
competent sand/gravel fill, to support the weight of the RCB and open channel.
The strengthened/replaced material will need to have an in-situ hydraulic
conductivity equal to or greater than the current material so as not to impede the
existing northwestern direction of groundwater flow.
5) Treatment of groundwater extracted during dewatering operations and any surface
water that comes in contact with waste materials will require treatment prior to
release to the South Platte River or Sand Creek. A preliminary assessment of
treatment needs indicates that filtration will be necessary to remove suspended
solids down to approximately 0.5 microns in size. In addition, processes such as
green sand filtration, ion exchange or reverse osmosis, aeration, oxidation, and
activated carbon adsorption may be necessary to remove:
a. The metals arsenic, iron, manganese and possibly cadmium, chromium III,
lead, silver, and uranium;
b. The inorganics ammonia, chloride, sulfate, and possibly nitrate, nitrite,
and sulfide; and
c. The VOCs benzene, tetrachloroethene, trichloroethene, and vinyl chloride.
This assessment of treatment needs will need to be revisited upon receipt of site-
specific CDPS remediation requirements, which are currently being prepared by
CDPHE WQCD.
4.3 Odor and Methane Control
An odor and methane mitigation program will be necessary to protect workers and the
general public when waste material from the Coliseum parking lot and soil and debris
from the Globeville Landing Park are exposed. The Respondent will develop such a
program as part of the removal action design.

Data Summary Report Page 15
REFERENCES
CTL Thompson, 2013. Limited Phase II Environmental Site Assessment, 40th
Street
Outfall, Letter Report to Ms. Jeanne Boyle. June 13, 2013
Engineering Management Support, Inc. (EMSI), 2015. Final Removal Action Work
Plan, High Street Outfall and 40th
Avenue, Storm Sewer System, Vasquez
Boulevard/Interstate 70 Site, Operable Unit 2, prepared for City and County of Denver.
June 19, 2015.
EMSI, 2009. Remedial Investigation, VB/I-70 Superfund Site, Operable Unit 2, prepared
for City and County of Denver, December 16, 2009.

Data Summary Report
TABLES

Table 1: Geologic and Piezometer/Well Completion Summary
SWDI-1 5170.93 22.0 NE 4 to 20 10 to 20
SWDI-2 5171.14 25.0 NE 4 to 14 10 to 25
SWDI-3 5166.25 25.0 23.5 3 to 23.5 10 to 25
SWDI-4 5166.55 25.0 23.0 3 to 14 10 to 25
SWDI-5 5167.89 26.0 25.0 3 to 25 16 to 26
SWDI-6 5169.58 26.0 25.5 3 to 25 11 to 26
SWDI-7 5169.35 25.0 24.5 3 to 19 10 to 25
SWDI-8 5171.78 28.0 27.0 4 to 15 8 to 28
SB-4-3 5163.4 25.0 24.0 9 to 22 abandoned
TH-17 5172 35 27.0 NR abandoned
TH-31 5171.4 30 27.9 NR abandoned
TH-32 5166.3 30 26.1 NR abandoned
TH-33 5165.3 25 23.1 NR abandoned
TH-34 5168.6 35 26.4 NR abandoned
TH-35 5166.8 35 22.1 NR abandoned
TH-213A 5160.2 17.2 15.2 NR abandoned
MW-2 5161.66 19.0 NE 0.3 to 15 8.3 to 18.3
MW-3 5162.02 20.0 NE 0.3 to 20 8.8 to 18.8
SWDI-9 5175.39 27.0 NE 2 to 8; 20 to 20.5 15 to 25
SWDI-10 5177.16 32.0 32.0 4 to 31.8 17 to 32
SWDI-11 5179.70 22.0 NE 2 to 9 not completed*
CTL-MW6 5180 31.0 NE NR 10 to 30
SWDI-12 5174.79 26.5 NE 4 to 20 14.5 to 24.5
SWDI-13 5163.22 19.0 18.0 none 9 to 19
SWDI-14 5154.04 9.0 8.0 none 4 to 9
SWDI-15 5174.64 27.0 NE 2 to 25 15 to 25
SWDI-16 5153.91 20.0 17.0 none 6 to 16
MW-1 5173.6 29.0 NE 0.3 to 20 18.8 to 28.8
TH-9 5196.5 30 25.5 NR abandoned
TH-10 5162 30 19.5 NR abandoned
TH-23 5154 20 17.0 NR abandoned
TH-25 5164 30 21.0 NR abandoned
TH-26 5163 25 19.0 NR abandoned
TH-36 5175.4 45.4 34.4 NR abandoned
TH-39 5177.1 43.6 27.9 NR abandoned
TH-40 5154.5 32.5 12.0 NR abandoned
TH-214A 5171.5 32.5 25.2 NR abandoned
TH-216A 5167 22 20.5 NR abandoned
ft bgs = feet below ground surface
NE = Not Encountered
NR = Not Reported
* Not completed because well CTL-MW6, located nearby, served same purpose.
Coliseum Parking Lot
Globeville Landing Park
Screened
Interval
(ft bgs)
Top of
Bedrock
(ft bgs)
Well/Piezometer
Ground Surface
Elevation
(ft amsl)
Total Depth
(ft bgs)
Interval of Waste
or Debris (ft bgs)
Page 1 of 1

Table 2: Groundwater Elevations
depth
(ft btoc)
Elevation
(ft amsl)
depth
(ft btoc)
Elevation
(ft amsl)
SWDI-1 5170.50 11.80 5158.70 11.93 5158.57
SWDI-2 5170.73 11.69 5159.04 11.79 5158.94
SWDI-3 5165.80 8.55 5157.25 8.6 5157.20
SWDI-4 5166.16 9.90 5156.26 9.83 5156.33
SWDI-5 5167.44 10.47 5156.97 10.42 5157.02
SWDI-6 5169.12 10.19 5158.93 10.71 5158.41
SWDI-7 5168.91 12.16 5156.75 12.21 5156.70
SWDI-8 5171.06 13.81 5157.25 13.83 5157.23
MW-2 5161.66 9.71 5151.95 9.81 5151.85
MW-3 5163.34 11.92 5151.42 9.28 5154.06
SWDI-9 5175.01 19.35 5155.66 19.49 5155.52
SWDI-10 5176.45 20.09 5156.36 20.04 5156.41
CTL-MW6 5179.25 23.42 5155.83 23.45 5155.80
SWDI-12 5174.38 19.01 5155.37 18.91 5155.47
SWDI-13 5162.84 11.80 5151.04 11.71 5151.13
SWDI-14 5153.73 4.44 5149.29 4.35 5149.38
SWDI-15 5174.34 23.09 5151.25 22.98 5151.36
SWDI-16 5153.60 10.79 5142.81 16 5137.60
MW-1 5173.50 22.67 5150.83 22.6 5150.90
TOC = top of PVC casing
ft amsl = feet above mean seal level
ft btoc = feet below top of casing
Globeville Landing Park
7/15/2015
Well/PiezometerTOC
(ft amsl)
8/26/2015
Coliseum Parking Lot
Page 1 of 1

Table 3a: Waste Material TCLP Metals
Result Unit Result Unit Result Unit Result Unit Result Unit Result Unit Result Unit Result Unit
Regulatory Criteria 5.0 mg/L 100.0 mg/L 1.0 mg/L 5.0 mg/L 5.0 mg/L 0.20 mg/L 1.0 mg/L 5.0 mg/L
SWDI-1-COMP 0.08 J mg/L 1 mg/L 0.048 J mg/L <0.003 U mg/L 2.5 mg/L 0.00007 J mg/L 0.038 J mg/L <0.004 U mg/L
SWDI-2-COMP 0.095 J mg/L 1.6 mg/L 0.031 J mg/L <0.003 U mg/L 0.54 mg/L 0.001 J mg/L 0.043 J mg/L <0.004 U mg/L
SWDI-3-COMP 0.055 J mg/L 1.4 mg/L 0.07 J mg/L <0.003 U mg/L 3.1 mg/L <0.00003 U mg/L 0.07 J mg/L <0.004 U mg/L
SWDI-4-COMP 0.14 J mg/L 2.3 mg/L 0.18 mg/L <0.003 U mg/L 0.52 mg/L <0.00003 U mg/L 0.069 J mg/L <0.004 U mg/L
SWDI-5-COMP 0.079 J mg/L 2 mg/L 0.1 mg/L <0.003 U mg/L 1 mg/L <0.00003 U mg/L 0.051 J mg/L <0.004 U mg/L
SWDI-6-COMP 0.048 J mg/L 1.4 mg/L 0.069 J mg/L <0.003 U mg/L 3 mg/L 0.00024 J mg/L 0.044 J mg/L <0.004 U mg/L
SWDI-7-COMP 0.033 J mg/L 1 mg/L 0.0071 J mg/L <0.003 U mg/L 0.18 J mg/L <0.00003 U mg/L 0.045 J mg/L <0.004 U mg/L
SWDI-8-COMP 0.038 J mg/L 1.7 mg/L 0.023 J mg/L <0.003 U mg/L 0.36 J mg/L 0.00025 J mg/L 0.047 J mg/L <0.004 U mg/L
SWDI-9-COMP 0.1 J mg/L 0.83 J mg/L 0.051 J mg/L 0.0033 J mg/L 1.1 mg/L <0.00003 U mg/L <0.024 U mg/L <0.004 U mg/L
SWDI-10-COMP 0.13 J mg/L 1.1 mg/L 0.097 J mg/L <0.003 U mg/L 0.84 mg/L 0.000077 J mg/L 0.047 J mg/L <0.004 U mg/L
SWDI-11-COMP 0.073 J mg/L 0.53 J mg/L 0.22 mg/L <0.003 U mg/L 0.3 J mg/L 0.0001 J mg/L 0.086 J mg/L <0.004 U mg/L
SWDI-12-COMP 0.067 J mg/L 1.3 mg/L 0.034 J mg/L <0.003 U mg/L 0.48 J mg/L 0.000071 J mg/L 0.058 J mg/L <0.004 U mg/L
SWDI-13-COMP 0.022 J mg/L 0.98 J mg/L <0.002 U mg/L 0.0063 J mg/L 0.032 J mg/L <0.00003 U mg/L <0.024 U mg/L <0.004 U mg/L
SWDI-14-COMP <0.022 U mg/L 0.82 J mg/L 0.0027 J mg/L 0.004 J mg/L 0.022 J mg/L <0.00003 U mg/L <0.024 U mg/L <0.004 U mg/L
SWDI-15-COMP 0.028 J mg/L 1.7 mg/L 0.014 J mg/L <0.003 U mg/L 0.91 mg/L <0.00003 U mg/L <0.024 U mg/L <0.004 U mg/L
SWDI-16-COMP 0.066 J mg/L 0.56 J mg/L 0.039 J mg/L 0.0048 J mg/L 0.13 J mg/L <0.00003 U mg/L <0.024 U mg/L <0.004 UJ- mg/LNotes:
UJ- = The analyte was not present above the reported SQL. The associated numerical value may not accurately or precisely represent the concentration necessary to detect the analyte in the sample. Validation
indicates a negative bias in the associated value.
Sample IDArsenic Barium Cadmium Chromium Mercury Selenium SilverLead
J = The analyte was analyzed for and was positively identified, but the associated numerical value may not be consistent with the amount actually present in the environmental sample. The data should be
considered as a basis for decision-making and are usable for many purposes.
U = The analyte was analyzed for and is not present above the reported SQL.
Page 1 of 1

Table 3b: Waste Material TCLP Volatile Organic Compounds
Result Unit Result Unit Result Unit Result Unit Result Unit Result Unit Result Unit Result Unit Result Unit Result Unit
Regulatory Criteria mg/L mg/L mg/L mg/L mg/L mg/L mg/L mg/L mg/L mg/L
SWDI-1-COMP < 0.0023 U mg/L < 0.0013 U mg/L < 0.018 U mg/L < 0.0016 U mg/L < 0.0019 U mg/L < 0.0017 U mg/L < 0.0016 U mg/L < 0.002 U mg/L < 0.0016 U mg/L < 0.001 U mg/L
SWDI-2-COMP < 0.0023 U mg/L < 0.0013 U mg/L < 0.018 U mg/L < 0.0016 U mg/L < 0.0019 U mg/L < 0.0017 U mg/L < 0.0016 U mg/L < 0.002 U mg/L < 0.0016 U mg/L < 0.001 U mg/L
SWDI-3-COMP < 0.0023 U mg/L < 0.0013 U mg/L < 0.018 U mg/L < 0.0016 U mg/L < 0.0019 U mg/L < 0.0017 U mg/L < 0.0016 U mg/L < 0.002 U mg/L < 0.0016 U mg/L < 0.001 U mg/L
SWDI-4-COMP < 0.0023 U mg/L < 0.0013 U mg/L < 0.018 U mg/L < 0.0016 U mg/L < 0.0019 U mg/L < 0.0017 U mg/L < 0.0016 U mg/L < 0.002 U mg/L < 0.0016 U mg/L < 0.001 U mg/L
SWDI-5-COMP < 0.0023 U mg/L < 0.0013 U mg/L < 0.018 U mg/L < 0.0016 U mg/L < 0.0019 U mg/L < 0.0017 U mg/L < 0.0016 U mg/L < 0.002 U mg/L < 0.0016 U mg/L < 0.001 U mg/L
SWDI-6-COMP < 0.0023 U mg/L < 0.0013 U mg/L < 0.018 U mg/L < 0.0016 U mg/L < 0.0019 U mg/L < 0.0017 U mg/L < 0.0016 U mg/L < 0.002 U mg/L < 0.0016 U mg/L < 0.001 U mg/L
SWDI-7-COMP < 0.0023 U mg/L < 0.0013 U mg/L < 0.018 U mg/L < 0.0016 U mg/L < 0.0019 U mg/L < 0.0017 U mg/L < 0.0016 U mg/L < 0.002 U mg/L < 0.0016 U mg/L < 0.001 U mg/L
SWDI-8-COMP < 0.0023 U mg/L < 0.0013 U mg/L < 0.018 U mg/L < 0.0016 U mg/L < 0.0019 U mg/L < 0.0017 U mg/L < 0.0016 U mg/L < 0.002 U mg/L < 0.0016 U mg/L < 0.001 U mg/L
SWDI-9-COMP < 0.0023 U mg/L < 0.0013 U mg/L < 0.018 U mg/L < 0.0016 U mg/L < 0.0019 U mg/L < 0.0017 U mg/L < 0.0016 U mg/L < 0.002 U mg/L < 0.0016 U mg/L < 0.001 U mg/L
SWDI-10-COMP < 0.0023 U mg/L < 0.0013 U mg/L < 0.018 U mg/L < 0.0016 U mg/L < 0.0019 U mg/L < 0.0017 U mg/L < 0.0016 U mg/L < 0.002 U mg/L < 0.0016 U mg/L < 0.001 U mg/L
SWDI-11-COMP < 0.0023 U mg/L < 0.0013 U mg/L < 0.018 U mg/L < 0.0016 U mg/L < 0.0019 U mg/L < 0.0017 U mg/L < 0.0016 U mg/L < 0.002 U mg/L < 0.0016 U mg/L < 0.001 U mg/L
SWDI-12-COMP < 0.0023 U mg/L < 0.0013 U mg/L < 0.018 U mg/L < 0.0016 U mg/L < 0.0019 U mg/L < 0.0017 U mg/L < 0.0016 U mg/L < 0.002 U mg/L < 0.0016 U mg/L < 0.001 U mg/L
SWDI-13-COMP < 0.0023 U mg/L < 0.0013 U mg/L < 0.018 U mg/L < 0.0016 U mg/L < 0.0019 U mg/L < 0.0017 U mg/L < 0.0016 U mg/L < 0.002 U mg/L < 0.0016 U mg/L < 0.001 U mg/L
SWDI-14-COMP < 0.0023 U mg/L < 0.0013 U mg/L < 0.018 U mg/L < 0.0016 U mg/L < 0.0019 U mg/L < 0.0017 U mg/L < 0.0016 U mg/L < 0.002 U mg/L < 0.0016 U mg/L < 0.001 U mg/L
SWDI-15-COMP < 0.0023 U mg/L < 0.0013 U mg/L < 0.018 U mg/L < 0.0016 U mg/L < 0.0019 U mg/L < 0.0017 U mg/L < 0.0016 U mg/L < 0.002 U mg/L < 0.0016 U mg/L < 0.001 U mg/L
SWDI-16-COMP < 0.0023 U mg/L < 0.0013 U mg/L < 0.018 U mg/L < 0.0016 U mg/L < 0.0019 U mg/L < 0.0017 U mg/L < 0.0016 U mg/L < 0.002 U mg/L < 0.0016 U mg/L < 0.001 U mg/LNotes:
U = The analyte was analyzed for and is not present above the reported SQL.
100.0 6.0 0.7 0.5 0.2
Chlorobenzene Chloroform Tetrachloroethene Trichloroethene Vinyl chloride
0.7 0.5 200.0 0.5 0.5
Carbon tetrachloride Sample ID
1,1-Dichloroethene 1,2-Dichloroethane 2-Butanone (MEK) Benzene
Page 1 of 1

Table 3c: Soil - Total Metals
Sample ID Unit Unit
SWDI-1-10-12 10 mg/Kg 230 mg/Kg
SWDI-2-10-12 9.6 mg/Kg 96 mg/Kg
SWDI-3-15-17 7.6 mg/Kg 110 mg/Kg
SWDI-4-10-12 67 J- mg/Kg 650 J mg/Kg
SWDI-5-10-12 29 mg/Kg 900 mg/Kg
SWDI-6-10-12 7.9 mg/Kg 120 mg/Kg
SWDI-7-15-17 2.3 mg/Kg 8.5 mg/Kg
SWDI-8-10-12 8.4 J- mg/Kg 98 J+ mg/Kg
SWDI-9-10-12 100 J- mg/Kg 1000 mg/Kg
SWDI-10-20-22 110 mg/Kg 470 mg/Kg
SWDI-11-10-12 13 mg/Kg 450 mg/Kg
SWDI-12-15-17 8.6 mg/Kg 170 mg/Kg
SWDI-13-10-12 3.9 mg/Kg 11 mg/Kg
SWDI-14-5-7 6.7 mg/Kg 21 mg/Kg
SWDI-15-15-17 5.9 mg/Kg 130 mg/Kg
SWDI-16-15-17 4.2 mg/Kg 23 mg/KgNotes:
J+ = The analyte was analyzed for and was positively identified, but the associated numerical value may
not be consistent with the amount actually present in the environmental sample and validation indicates
a positive bias. The data should be considered as a basis for decision-making and are usable for many
purposes.
J = The analyte was analyzed for and was positively identified, but the associated numerical value may
not be consistent with the amount actually present in the environmental sample. The data should be
considered as a basis for decision-making and are usable for many purposes.
J- = The analyte was analyzed for and was positively identified, but the associated numerical value may
not be consistent with the amount actually present in the environmental sample and validation indicates
a negative bias. The data should be considered as a basis for decision-making and are usable for many
purposes.
Result Result
Arsenic Lead
Page 1 of 1

Table 3d: Soil - Volatile Organic Compounds
Unit Unit Unit Unit Unit Unit
1,4-Dichlorobenzene 2.2 J ug/Kg
2-Butanone (MEK) 13 J ug/Kg 15 J ug/Kg
Acetone 41 ug/Kg 74 ug/Kg 47 ug/Kg 70 ug/Kg 42 ug/Kg 77 ug/Kg
Benzene 2.1 J ug/Kg 0.6 J ug/Kg
cis-1,2-Dichloroethene 3.1 ug/Kg 5.2 ug/Kg
Ethylbenzene 1.1 J ug/Kg 1.3 J ug/Kg
Isopropylbenzene 1.1 J ug/Kg 3.1 J ug/Kg 2.3 J ug/Kg
Methylene Chloride 2.3 J ug/Kg 2.4 J ug/Kg 2.7 J ug/Kg
m-Xylene & p-Xylene 1.4 J ug/Kg 1.7 J ug/Kg 2.4 J ug/Kg 3.8 ug/Kg 1.9 J ug/Kg
o-Xylene 1.5 J ug/Kg 1.1 J ug/Kg 2.9 J ug/Kg 1.9 J ug/Kg
Tetrachloroethene
Toluene 1.3 J ug/Kg
Trichloroethene
Table does not show "non-detect" values
Notes:
J = The analyte was analyzed for and was positively identified, but the
associated numerical value may not be consistent with the amount
actually present in the environmental sample. The data should be
considered as a basis for decision-making and are usable for many
purposes.
SWDI-4-10-12 SWDI-5-10-12 SWDI-6-10-12
Result Result ResultAnalyte
SWDI-1-10-12
Result Result Result
SWDI-2-10-12 SWDI-3-15-17
Page 1 of 3

Table 3d: Soil - Volatile Organic Compounds
Unit Unit Unit Unit Unit Unit
1,4-Dichlorobenzene
2-Butanone (MEK)
Acetone 14 J ug/Kg 78 ug/Kg 49 ug/Kg 34 ug/Kg 22 J ug/Kg
Benzene 0.77 J ug/Kg
cis-1,2-Dichloroethene 0.77 J ug/Kg
Ethylbenzene 1.4 J ug/Kg
Isopropylbenzene 3.1 J ug/Kg
Methylene Chloride 2.4 J ug/Kg
m-Xylene & p-Xylene 1.6 J ug/Kg 5.3 ug/Kg
o-Xylene 3.3 ug/Kg
Tetrachloroethene
Toluene
Trichloroethene 0.36 J ug/Kg
Notes:
Table does not show "non-detect" values
J = The analyte was analyzed for and was positively identified, but the associated numerical
value may not be consistent with the amount actually present in the environmental sample.
The data should be considered as a basis for decision-making and are usable for many
purposes.
ResultResult Result
SWDI-11-10-12SWDI-10-20-22SWDI-7-15-17 SWDI-8-10-12 SWDI-9-10-12
Result ResultAnalyte
Result Result
SWDI-12-15-17 SWDI-13-10-12
Page 2 of 3

Table 3d: Soil - Volatile Organic Compounds
Unit Unit
1,4-Dichlorobenzene
2-Butanone (MEK)
Acetone
Benzene
cis-1,2-Dichloroethene
Ethylbenzene
Isopropylbenzene
Methylene Chloride
m-Xylene & p-Xylene
o-Xylene
Tetrachloroethene 8.3 ug/Kg
Toluene
Trichloroethene 0.76 J ug/Kg
Notes:
Table does not show "non-detect" values
J = The analyte was analyzed for and was positively identified, but the associated
numerical value may not be consistent with the amount actually present in the
environmental sample. The data should be considered as a basis for decision-making
and are usable for many purposes.
Result Result
SWDI-14-5-7 SWDI-15-15-17Analyte
Page 3 of 3

Table 3e: Soil - Polynuclear Aromatic Hydrocarbons
Unit Unit Unit Unit Unit Unit
1-Methylnaphthalene 32 J ug/Kg 28 J ug/Kg 25 J ug/Kg
2-Methylnaphthalene 42 J ug/Kg 29 J ug/Kg 30 J ug/Kg
Acenaphthene 64 J ug/Kg 45 J ug/Kg 22 J ug/Kg
Acenaphthylene 25 J ug/Kg
Anthracene 160 J ug/Kg 47 J ug/Kg 51 J ug/Kg 43 J ug/Kg
Benzo[a]anthracene 330 J ug/Kg 59 J ug/Kg 94 J ug/Kg 130 J ug/Kg 160 J ug/Kg
Benzo[a]pyrene 310 J ug/Kg 65 J ug/Kg 150 J ug/Kg
Benzo[b]fluoranthene 350 J ug/Kg 84 J ug/Kg 130 J ug/Kg 180 J ug/Kg 220 J ug/Kg
Benzo[g,h,i]perylene 180 J ug/Kg 48 J ug/Kg 40 J ug/Kg 120 J ug/Kg 120 J ug/Kg
Benzo[k]fluoranthene 80 J ug/Kg
Chrysene 380 J ug/Kg 84 J ug/Kg 110 J ug/Kg 170 J ug/Kg 290 J ug/Kg
Dibenz(a,h)anthracene
Fluoranthene 620 J ug/Kg 140 J ug/Kg 190 J ug/Kg 210 J ug/Kg 380 J ug/Kg
Fluorene 66 J ug/Kg 48 J ug/Kg 29 J ug/Kg
Indeno[1,2,3-cd]pyrene 140 J ug/Kg 41 J ug/Kg 61 J ug/Kg 99 J ug/Kg
Naphthalene 89 J ug/Kg
Phenanthrene 640 J ug/Kg 230 J ug/Kg 170 J ug/Kg 120 J ug/Kg 370 J ug/Kg 390 J ug/Kg
Pyrene 710 J ug/Kg 160 J ug/Kg 190 J ug/Kg 230 J ug/Kg 380 J ug/Kg 410 J ug/Kg
Note: Table does not show "non-detect" values
U = The analyte was analyzed for and is not present above the reported SQL.J = The analyte was analyzed for and was positively identified, but the associated
numerical value may not be consistent with the amount actually present in the
environmental sample. The data should be considered as a basis for decision-
making and are usable for many purposes.
SWDI-2-10-12 SWDI-6-10-12Analyte
SWDI-1-10-12 SWDI-5-10-12SWDI-4-10-12SWDI-3-15-17
Result Result Result Result Result Result
Page 1 of 3

Table 3e: Soil - Polynuclear Aromatic Hydrocarbons
Unit Unit Unit Unit Unit Unit Unit
1-Methylnaphthalene 15 J ug/Kg 64 J ug/Kg 33 J ug/Kg 97 J ug/Kg 240 J ug/Kg
2-Methylnaphthalene 78 J ug/Kg 44 J ug/Kg 95 J ug/Kg 260 J ug/Kg
Acenaphthene 36 J ug/Kg 98 J ug/Kg 440 ug/Kg 330 J ug/Kg 1100 J ug/Kg
Acenaphthylene 26 J ug/Kg 110 J ug/Kg
Anthracene 65 J ug/Kg 190 J ug/Kg 720 ug/Kg 620 J ug/Kg 1300 J ug/Kg
Benzo[a]anthracene 140 J ug/Kg 430 ug/Kg 1600 ug/Kg 1300 J ug/Kg 2000 J ug/Kg
Benzo[a]pyrene 140 J ug/Kg 380 ug/Kg 1600 ug/Kg 1200 J ug/Kg 2100 J ug/Kg
Benzo[b]fluoranthene 250 J ug/Kg 520 ug/Kg 2100 ug/Kg 1600 J ug/Kg 2400 J ug/Kg
Benzo[g,h,i]perylene 140 J ug/Kg 190 J ug/Kg 1100 ug/Kg 690 J ug/Kg 1300 J ug/Kg
Benzo[k]fluoranthene 79 J ug/Kg 160 J ug/Kg 810 ug/Kg 590 J ug/Kg 1100 J ug/Kg
Chrysene 250 J ug/Kg 490 ug/Kg 1800 ug/Kg 1300 J ug/Kg 2300 J ug/Kg
Dibenz(a,h)anthracene 54 J ug/Kg 260 J ug/Kg 330 J ug/Kg
Fluoranthene 380 ug/Kg 880 ug/Kg 3500 ug/Kg 2700 J ug/Kg 4700 ug/Kg
Fluorene 38 J ug/Kg 80 J ug/Kg 430 ug/Kg 290 J ug/Kg 810 J ug/Kg
Indeno[1,2,3-cd]pyrene 120 J ug/Kg 200 J ug/Kg 1100 ug/Kg 650 J ug/Kg 1200 J ug/Kg
Naphthalene 140 J ug/Kg 48 J ug/Kg 200 J ug/Kg 670 J ug/Kg
Phenanthrene 330 J ug/Kg 850 ug/Kg 3000 ug/Kg 2400 J ug/Kg 5000 ug/Kg 34 J ug/Kg
Pyrene 13 J ug/Kg 420 ug/Kg 980 ug/Kg 3700 ug/Kg 2900 J ug/Kg 5300 ug/Kg 37 J ug/Kg
Note: Table does not show "non-detect" values
U = The analyte was analyzed for and is not present above the reported SQL.
SWDI-12-15-17 SWDI-13-10-12SWDI-8-10-12SWDI-7-15-17 SWDI-9-10-12 SWDI-11-10-12
Result
SWDI-10-20-22Analyte
Result Result Result Result Result Result
J = The analyte was analyzed for and was positively identified, but the associated
numerical value may not be consistent with the amount actually present in the
environmental sample. The data should be considered as a basis for decision-
making and are usable for many purposes.
Page 2 of 3

Table 3e: Soil - Polynuclear Aromatic Hydrocarbons
Unit Unit Unit
1-Methylnaphthalene
2-Methylnaphthalene
Acenaphthene 230 J ug/Kg
Acenaphthylene
Anthracene 360 J ug/Kg 26 J ug/Kg
Benzo[a]anthracene 59 J ug/Kg 710 J ug/Kg 53 J ug/Kg
Benzo[a]pyrene 54 J ug/Kg 720 J ug/Kg 51 J ug/Kg
Benzo[b]fluoranthene 66 J ug/Kg 950 J ug/Kg 61 J ug/Kg
Benzo[g,h,i]perylene 31 J ug/Kg 420 J ug/Kg 19 J ug/Kg
Benzo[k]fluoranthene 320 J ug/Kg
Chrysene 59 J ug/Kg 770 J ug/Kg 57 J ug/Kg
Dibenz(a,h)anthracene 130 J ug/Kg
Fluoranthene 87 J ug/Kg 1600 J ug/Kg 110 J ug/Kg
Fluorene 280 J ug/Kg
Indeno[1,2,3-cd]pyrene 28 J ug/Kg 400 J ug/Kg 26 J ug/Kg
Naphthalene
Phenanthrene 41 J ug/Kg 1200 J ug/Kg 110 J ug/Kg
Pyrene 110 J ug/Kg 1800 ug/Kg 120 J ug/Kg
Note: Table does not show "non-detect" values
U = The analyte was analyzed for and is not present above the reported SQL.
SWDI-14-5-7 SWDI-15-15-17 SWDI-16-15-17
J = The analyte was analyzed for and was positively identified, but the associated
numerical value may not be consistent with the amount actually present in the
environmental sample. The data should be considered as a basis for decision-
making and are usable for many purposes.
AnalyteResult ResultResult
Page 3 of 3

Table 4a: Groundwater Quality - Metals
Unit Unit Unit Unit Unit Unit Unit Unit Unit Unit Unit Unit Unit
Dissolved 0.8 ug/L 54 ug/L 0.157 mg/L 0.011 mg/L 300 ug/L 7 ug/L 50 ug/L 113 ug/L 4.6 ug/L 0.4 ug/L 30 ug/L 271 ug/L
Potentially Dissolved 340 ug/L
Total Recoverable 3 ug/L 0.05 mg/L 1000
Total
Dissolved 1.2 ug/L 78 ug/L 0.231 mg/L 0.011 mg/L 11 ug/L 2618 ug/L 168 ug/L 4.6 ug/L 0.8 ug/L 6915 ug/L 405 ug/L
Potentially Dissolved 340 ug/L
Total Recoverable 100 ug/L 1000 ug/L
Total
CTL-MW6 Dissolved <0.27 U ug/L <0.56 U ug/L <0.02 U mg/L <0.004 U mg/L 26 J ug/L <0.18 U ug/L 350 ug/L 3.0 ug/L 1.1 J ug/L <0.033 U ug/L 4.0 J ug/L
Potentially Dissolved 9 ug/L 2.4 ug/L 150 ug/L 6.1 ug/L 1.5 J ug/L <0.02 U ug/L 8.8 ug/L 110 ug/L
Total Recoverable 16 ug/L 51000 ug/L
Total 17 ug/L 2.8 ug/L 45 ug/L 0.029 mg/L <0.02 U mg/L 48000 ug/L 200 ug/L 840 ug/L 20 ug/L 2.1 J ug/L 0.94 J ug/L 12 ug/L 230 ug/L
SWDI-1 Dissolved 6.9 ug/L 3.1 ug/L <0.02 U mg/L <0.008 U mg/L 210 ug/L 2.3 ug/L 860 ug/L 14 ug/L <0.7 U ug/L <0.033 U ug/L 53 ug/L
Potentially Dissolved 47 ug/L 900 ug/L 890 ug/L 43 ug/L 1.3 J ug/L <0.02 U ug/L 8.5 ug/L 3600 ug/L
Total Recoverable 500 ug/L 650000 ug/L
Total 380 ug/L 2200 ug/L 1100 ug/L 0.25 mg/L 0.11 J mg/L 540000 ug/L 4400 ug/L 14000 ug/L 290 ug/L 9.1 ug/L 12 ug/L 52 ug/L 13000 ug/L
SWDI-2 Dissolved 0.59 J ug/L 0.87 J ug/L <0.02 U mg/L <0.004 U mg/L 160 ug/L 1.7 ug/L 3300 ug/L 5.9 ug/L 3.1 J ug/L <0.033 U ug/L 15 ug/L
Potentially Dissolved 68 ug/L 530 ug/L 330 ug/L 110 ug/L 4.2 J ug/L <0.02 U ug/L 7.2 ug/L 5700 ug/L
Total Recoverable 520 ug/L 1200000 ug/L
Total 290 ug/L 1300 ug/L 1700 ug/L 0.65 mg/L <0.04 U mg/L 300000 ug/L 5000 ug/L 45000 ug/L 630 ug/L 28 ug/L 23 ug/L 150 ug/L 20000 ug/L
SWDI-3 Dissolved <0.27 U ug/L 0.97 J ug/L 0.055 mg/L 0.0059 J mg/L 4300 ug/L 2.2 ug/L 2800 ug/L 3.3 ug/L <0.7 U ug/L <0.033 U ug/L 4.6 J ug/L
Potentially Dissolved 68 ug/L 7.6 ug/L 74 ug/L 64 ug/L 1.5 J ug/L <0.02 U ug/L 13 ug/L 3400 ug/L
Total Recoverable 830 ug/L 1300000 ug/L
Total 140 ug/L 88 ug/L 590 ug/L 0.18 mg/L <0.2 U mg/L 1100000 ug/L 1800 ug/L 14000 ug/L 140 ug/L 2.9 J ug/L 10 ug/L 44 ug/L 5900 ug/L
SWDI-4 Dissolved <0.27 U ug/L <0.56 U ug/L <0.02 U mg/L <0.004 U mg/L <22 U ug/L 2.0 ug/L 3800 ug/L 2.9 ug/L 1.5 J ug/L <0.033 U ug/L 28 ug/L
Potentially Dissolved 280 ug/L 330 ug/L 2800 ug/L 200 ug/L 2.1 J ug/L <0.02 U ug/L 13 ug/L 15000 ug/L
Total Recoverable 920 ug/L 1100000 ug/L
Total 480 ug/L 390 ug/L 1600 ug/L 0.34 mg/L <0.004 U mg/L 720000 ug/L 7300 ug/L 44000 ug/L 440 ug/L 8.7 ug/L 19 ug/L 93 ug/L 22000 ug/L
SWDI-5 Dissolved <0.27 U ug/L <0.56 U ug/L 0.022 J- mg/L <0.008 R mg/L 28 J ug/L 3.1 ug/L 3100 ug/L 9.2 ug/L <0.7 U ug/L <0.033 U ug/L 16 ug/L
Potentially Dissolved 80 ug/L 23 J ug/L 1200 ug/L 110 J- ug/L 2 J- ug/L <0.02 U ug/L 4.3 ug/L 15000 J ug/L
Total Recoverable 690 J ug/L 670000 J ug/L
Total 550 J ug/L 300 J ug/L 2700 J ug/L 0.37 J- mg/L <0.04 R mg/L 580000 J ug/L 14000 J ug/L 29000 J ug/L 460 J ug/L 12 J- ug/L 39 J- ug/L 57 J- ug/L 34000 J- ug/L
SWDI-5D Dissolved <0.27 U ug/L <0.56 U ug/L <0.02 R mg/L <0.004 R mg/L 150 ug/L 2.0 ug/L 3400 ug/L 8.0 ug/L <0.7 U ug/L <0.033 U ug/L 15 ug/L
Potentially Dissolved 89 ug/L 40 J ug/L 1600 ug/L 54 J- ug/L 2 J- ug/L 0.02 J ug/L 6.1 ug/L 7000 J ug/L
Total Recoverable 280 J ug/L 230000 J ug/L
Total 280 J ug/L 110 J ug/L 1000 J ug/L 0.15 J- mg/L <0.04 R mg/L 190000 J ug/L 5100 J ug/L 12000 J ug/L 170 J- ug/L 6.5 J- ug/L 17 J- ug/L 22 J- ug/L 12000 J- ug/L
SWDI-6 Dissolved <0.27 U ug/L 0.67 U ug/L <0.02 U mg/L <0.004 U mg/L 12000 ug/L 3.0 ug/L 1200 ug/L 4.7 ug/L <0.7 U ug/L 0.052 U ug/L 39 ug/L
Potentially Dissolved 15 ug/L 4.9 ug/L 460 ug/L 22 ug/L <1 U ug/L <0.02 U ug/L 2.3 ug/L 2500 ug/L
Total Recoverable 85 ug/L 120000 ug/L
Total 77 ug/L 25 ug/L 460 ug/L 0.1 mg/L <0.02 U mg/L 100000 ug/L 2100 ug/L 2900 ug/L 62 ug/L 2.6 J ug/L 32 ug/L 8.6 ug/L 3700 ug/L
SWDI-7 Dissolved <0.27 U ug/L <0.56 U ug/L <0.02 UJ mg/L <0.004 UJ-mg/L 61 J ug/L 0.20 J ug/L 1800 ug/L 4.9 ug/L <0.7 U ug/L <0.033 U ug/L 7.5 J ug/L
Potentially Dissolved 12 ug/L 27 ug/L 110 ug/L 24 ug/L <1 U ug/L 0.032 U ug/L 12 ug/L 820 ug/L
Total Recoverable 130 ug/L 340000 ug/L
Total 81 ug/L 42 ug/L 230 ug/L 0.14 R mg/L <0.004 R mg/L 210000 ug/L 400 ug/L 9000 ug/L 110 ug/L 6.2 J- ug/L 12 ug/L 43 ug/L 1700 ug/L
SWDI-8 Dissolved <0.27 U ug/L <0.56 U ug/L 0.047 J mg/L <0.004 UJ-mg/L 31 J ug/L 0.29 J ug/L 4200 ug/L 4.4 ug/L <0.7 U ug/L <0.033 U ug/L 4.7 J ug/L
Potentially Dissolved 58 ug/L 40 ug/L 850 ug/L 77 ug/L <1 U ug/L <0.02 U ug/L 45 ug/L 17000 ug/L
Total Recoverable 290 ug/L 690000 ug/L
Total 280 ug/L 130 ug/L 1200 ug/L 0.38 R mg/L <0.004 R mg/L 570000 ug/L 3700 ug/L 18000 ug/L 280 ug/L 5.6 J+ ug/L 15 ug/L 150 ug/L 39000 ug/L
SWDI-9 Dissolved 0.71 J ug/L 11 ug/L 0.023 J mg/L <0.004 UJ-mg/L 180 ug/L 160 ug/L 750 ug/L 3.7 ug/L 0.78 J ug/L 0.81 J ug/L 38 ug/L
Potentially Dissolved 2000 ug/L 50 ug/L 310 ug/L 98 ug/L 3.4 J ug/L 1.7 ug/L 0.86 J ug/L 25000 ug/L
Total Recoverable 11000 ug/L 760000 ug/L
Total 11000 ug/L 2600 ug/L 23000 ug/L 0.29 R mg/L <0.02 R mg/L 660000 ug/L 160000 ug/L 46000 ug/L 490 ug/L 29 ug/L 62 ug/L 55 ug/L 83000 ug/L
SWDI-10 Dissolved <0.27 U ug/L 0.62 U ug/L 0.032 mg/L <0.004 U mg/L 3300 ug/L 1.6 ug/L 6000 ug/L 9.7 ug/L 1.7 J ug/L 0.038 U ug/L 6.7 J ug/L
Potentially Dissolved 150 ug/L 14 ug/L 580 ug/L 110 ug/L 3.6 J ug/L <0.02 U ug/L 21 ug/L 3200 ug/L
Total Recoverable 450 ug/L 450000 ug/L
Total 390 ug/L 120 ug/L 1200 ug/L 0.39 mg/L <0.02 U mg/L 350000 ug/L 6000 ug/L 15000 ug/L 310 ug/L 13 ug/L 18 ug/L 130 ug/L 6400 ug/L
SWDI-12 Dissolved <0.27 U ug/L 3.4 J+ ug/L 0.037 mg/L <0.004 U mg/L 480 ug/L 22 ug/L 740 ug/L 8.3 ug/L 3.5 J ug/L 0.077 U ug/L 23 ug/L
Potentially Dissolved 45 ug/L <0.04 U ug/L 2.3 J+ ug/L 150 ug/L 4.5 J ug/L <0.02 U ug/L 0.73 J ug/L 2400 ug/L
Total Recoverable 1100 ug/L 1400000 ug/L
Total 720 ug/L 340 ug/L 6000 ug/L 2.2 mg/L <0.02 U mg/L 890000 ug/L 34000 ug/L 25000 ug/L 1700 ug/L 29 ug/L 37 ug/L 130 ug/L 40000 ug/L
Uranium Zinc
Preliminary South
Platte Regulatory
Criteria
(Segment 14)
Preliminary Sand
Creek Regulatory
Criteria
(Segment 16c)
Copper Iron Lead Manganese Nickel SeleniumSample ID Fraction
Arsenic Cadmium Cr (III) Cr (VI) Silver
Result Result Result Result Result Result Result ResultResult Result Result Result Result
Page 1 of 2

Unit Unit Unit Unit Unit Unit Unit Unit Unit Unit Unit Unit Unit
Dissolved 0.8 ug/L 54 ug/L 0.157 mg/L 0.011 mg/L 300 ug/L 7 ug/L 50 ug/L 113 ug/L 4.6 ug/L 0.4 ug/L 30 ug/L 271 ug/L
Potentially Dissolved 340 ug/L
Total Recoverable 3 ug/L 0.05 mg/L 1000
Total
Dissolved 1.2 ug/L 78 ug/L 0.231 mg/L 0.011 mg/L 11 ug/L 2618 ug/L 168 ug/L 4.6 ug/L 0.8 ug/L 6915 ug/L 405 ug/L
Potentially Dissolved 340 ug/L
Total Recoverable 100 ug/L 1000 ug/L
Total
Uranium Zinc
Preliminary South
Platte Regulatory
Criteria
(Segment 14)
Preliminary Sand
Creek Regulatory
Criteria
(Segment 16c)
Copper Iron Lead Manganese Nickel SeleniumSample ID Fraction
Arsenic Cadmium Cr (III) Cr (VI) Silver
Result Result Result Result Result Result Result ResultResult Result Result Result Result
SWDI-13 Dissolved 1.2 ug/L 2.6 ug/L 0.086 mg/L <0.004 U mg/L <22 U ug/L <0.18 U ug/L 1700 ug/L 8.3 ug/L 1.1 J ug/L 0.17 J ug/L 45 ug/L
Potentially Dissolved 30 ug/L 16 ug/L 170 ug/L 66 ug/L 2.2 J ug/L <0.02 U ug/L 160 ug/L 1400 ug/L
Total Recoverable 210 ug/L 190000 ug/L
Total 190 ug/L 23 ug/L 310 ug/L 0.26 mg/L <0.02 U mg/L 240000 ug/L 620 ug/L 12000 ug/L 140 ug/L 17 ug/L 2.4 J ug/L 230 ug/L 2600 ug/L
SWDI-14 Dissolved <0.27 U ug/L 0.86 J ug/L 0.035 mg/L <0.004 U mg/L <22 U ug/L <0.18 U ug/L 750 ug/L 3.6 ug/L 2.1 J ug/L 0.093 J ug/L 11 ug/L
Potentially Dissolved 45 ug/L 16 ug/L 170 ug/L 87 J- ug/L 1.9 J ug/L 0.026 J ug/L 5.8 ug/L 990 ug/L
Total Recoverable 200 ug/L 540000 ug/L
Total 140 ug/L 26 ug/L 570 ug/L 0.41 mg/L <0.02 U mg/L 370000 ug/L 1200 ug/L 7200 ug/L 250 ug/L 21 J- ug/L 6.1 J- ug/L 76 ug/L 2800 ug/L
SWDI-15 Dissolved 1.5 ug/L 3.8 J+ ug/L 0.072 mg/L <0.004 U mg/L 4000 ug/L 6.5 ug/L 790 ug/L 5.8 ug/L 4.2 J ug/L 0.050 U ug/L 14 ug/L
Potentially Dissolved 58 ug/L 270 ug/L 58 ug/L 160 ug/L 6.2 ug/L 0.031 U ug/L 83 ug/L 1300 ug/L
Total Recoverable 2300 ug/L 1600000 ug/L
Total 2100 ug/L 560 ug/L 1600 ug/L 1.2 mg/L <0.02 U mg/L 1800000 ug/L 3200 ug/L 60000 ug/L 790 ug/L 53 ug/L 24 ug/L 380 ug/L 6900 ug/L
SWDI-16 Dissolved 0.69 J ug/L 4.4 ug/L 0.21 mg/L <0.004 U mg/L 68 J ug/L <0.18 U ug/L 550 ug/L 20 ug/L 1.8 J ug/L <0.033 U ug/L 42 ug/L
Potentially Dissolved 23 ug/L 15 ug/L 35 ug/L 270 ug/L 1.8 J ug/L <0.02 U ug/L 27 ug/L 4800 ug/L
Total Recoverable 230 ug/L 600000 ug/L
Total 150 ug/L 15 ug/L 800 ug/L 0.93 mg/L <0.02 U mg/L 540000 ug/L 420 ug/L 4900 ug/L 430 ug/L 13 ug/L 1.1 J ug/L 110 ug/L 6300 ug/L
Legend
Will likely meet S. Platte Limit with bag and cartridge filtration
Might meet S. Platte Limit with bag and cartridge filtration
May exceed S. Platte Limit with bag and cartridge filtration
Notes:
U = The analyte was analyzed for and is not present above the reported SQL.
J = The analyte was analyzed for and was positively identified, but the associated numerical
value may not be consistent with the amount actually present in the environmental sample.
The data should be considered as a basis for decision-making and are usable for many
purposes.
J+ = The analyte was analyzed for and was positively identified, but the associated numerical
value may not be consistent with the amount actually present in the environmental sample and
validation indicates a positive bias. The data should be considered as a basis for decision-
making and are usable for many purposes.
J- = The analyte was analyzed for and was positively identified, but the associated numerical
value may not be consistent with the amount actually present in the environmental sample and
validation indicates a negative bias. The data should be considered as a basis for decision-
making and are usable for many purposes.
Page 2 of 2

Table 4b: Groundwater Quality - Inorganics
Result Unit Result Unit Result Unit Result Unit Result Unit Result Unit
Preliminary South
Platte Regulatory
Criteria (Segment 14)
36.1
(acute
only)
mg/L 250 mg/L 10 mg/L 0.5 mg/L 250 mg/L 0.002 mg/L
Preliminary Sand Creek
Regulatory Criteria
(Segment 16c)
36.1
(acute
only)
mg/L none mg/L 100 mg/L 0.5 mg/L none mg/L 0.002 mg/L
CTL-MW6 31 mg/L 290 mg/L 4.5 mg/L 0.059 J mg/L 120 mg/L <0.79 U mg/L
SWDI-1 120 mg/L 390 mg/L 0.16 J mg/L <0.049 U mg/L 4.5 U mg/L 1.6 J mg/L
SWDI-2 4.2 mg/L 270 mg/L 12 mg/L 0.2 J mg/L 250 mg/L 1.1 J mg/L
SWDI-3 45 mg/L 160 mg/L <0.042 U mg/L <0.049 U mg/L 69 mg/L 74 mg/L
SWDI-4 2.9 mg/L 150 mg/L 5.9 mg/L 0.12 J mg/L 190 mg/L 1.1 J mg/L
SWDI-5 33 J+ mg/L 250 mg/L 0.16 J mg/L <0.049 U mg/L 44 mg/L 3.2 J mg/L
SWDI-5D 33 J+ mg/L 250 mg/L 0.41 J mg/L <0.049 U mg/L 47 mg/L 2.7 J mg/L
SWDI-6 140 mg/L 400 mg/L 0.15 J mg/L <0.098 U mg/L 0.9 J mg/L 9.9 mg/L
SWDI-7 45 J+ mg/L 460 mg/L 0.27 J mg/L <0.049 U mg/L 53 mg/L 1.1 J mg/L
SWDI-8 8.9 J+ mg/L 250 mg/L 0.098 J mg/L <0.049 U mg/L 150 mg/L 15 mg/L
SWDI-9 130 J+ mg/L 320 mg/L 0.56 J mg/L 0.18 J mg/L 27 mg/L 20 mg/L
SWDI-10 72 mg/L 840 mg/L 0.2 J mg/L 0.61 J mg/L 84 mg/L 4.3 mg/L
SWDI-12 12 mg/L 200 mg/L 9.4 mg/L 0.16 J mg/L 170 mg/L 59 mg/L
SWDI-13 0.5 mg/L 150 mg/L 2.2 mg/L <0.049 U mg/L 270 mg/L <0.79 U mg/L
SWDI-14 0.43 mg/L 190 mg/L 9 mg/L 0.31 J mg/L 270 mg/L 0.8 J mg/L
SWDI-15 0.18 mg/L 190 mg/L 9.7 mg/L 0.069 J mg/L 320 mg/L <0.79 U mg/L
SWDI-16 0.3 mg/L 190 mg/L 4.7 mg/L 0.12 J mg/L 250 mg/L <0.79 U mg/L
Legend
Passes Inorganic standard
Exceeds inorganic Standard
Unknown - need clarification on standard
Notes:
U = The analyte was analyzed for and is not present above the reported SQL.
J+ = The analyte was analyzed for and was positively identified, but the associated numerical value may not be consistent with the amount actually present in the
environmental sample and validation indicates a positive bias. The data should be considered as a basis for decision-making and are usable for many purposes.
Sulfide (H2S)SulfateSample ID
Ammonia as N Chloride Nitrate as N Nitrite as N
J = The analyte was analyzed for and was positively identified, but the associated numerical value may not be consistent with the amount actually present in the
environmental sample. The data should be considered as a basis for decision-making and are usable for many purposes.
Page 1 of 1

Table 4c: Groundwater Quality - Detected Volitle Organic Compounds
Result Unit Result Unit Result Unit Result Unit Result Unit Result Unit Result Unit Result Unit Preliminary
Regulatory Criteria
(Segments 14 and
16c)2.2 ug/L 100 ug/L 3.4 ug/L 530 ug/L 5 ug/L 510 ug/L 2.5 ug/L 0.023 ug/L
CTL-MW6 <0.16 U ug/L <0.17 U ug/L <0.16 U ug/L <0.16 U ug/L 3 ug/L <0.17 U ug/L 1.7 ug/L <0.1 U ug/L
SWDI-1 6 ug/L 11 ug/L <0.16 U ug/L 2.9 ug/L 0.47 J ug/L 0.5 J ug/L <0.16 U ug/L 0.42 J ug/L
SWDI-2 <0.16 U ug/L <0.17 U ug/L 0.49 J ug/L <0.16 U ug/L 13 ug/L 0.2 J ug/L 7.9 ug/L <0.1 U ug/L
SWDI-3 0.78 J ug/L <0.17 U ug/L <0.16 U ug/L <0.16 U ug/L 0.92 J ug/L 0.41 J ug/L 0.41 J ug/L <0.1 U ug/L
SWDI-4 <0.16 U ug/L <0.17 U ug/L <0.16 U ug/L <0.16 U ug/L 19 ug/L <0.17 U ug/L 8.3 ug/L <0.1 U ug/L
SWDI-5 <0.16 U ug/L <0.17 U ug/L <0.16 U ug/L <0.16 U ug/L 1.4 J- ug/L 0.18 J ug/L 0.31 J ug/L <0.1 U ug/L
SWDI-5D <0.16 U ug/L <0.17 U ug/L <0.16 U ug/L <0.16 U ug/L 1.1 J- ug/L 0.17 J ug/L 0.3 J ug/L <0.1 U ug/L
SWDI-6 0.25 J ug/L <0.17 U ug/L <0.16 U ug/L <0.16 U ug/L <0.2 U ug/L 0.3 J ug/L <0.16 U ug/L <0.1 U ug/L
SWDI-7 0.27 J+ ug/L 0.21 J+ ug/L <0.16 U ug/L <0.16 U ug/L 5.2 J+ ug/L <0.17 U ug/L 3 J+ ug/L 2.4 J+ ug/L
SWDI-8 <0.16 U ug/L <0.17 U ug/L <0.16 U ug/L <0.16 U ug/L 2.2 ug/L <0.17 U ug/L 6.2 ug/L 0.58 J ug/L
SWDI-9 <0.16 U ug/L <0.17 U ug/L <0.16 U ug/L <0.16 U ug/L <0.2 U ug/L <0.17 U ug/L <0.16 U ug/L <0.1 U ug/L
SWDI-10 <0.16 U ug/L <0.17 U ug/L <0.16 U ug/L <0.16 U ug/L 1.1 ug/L <0.17 U ug/L 0.46 J ug/L <0.1 U ug/L
SWDI-12 <0.16 U ug/L <0.17 U ug/L 0.56 J ug/L <0.16 U ug/L 11 ug/L <0.17 U ug/L 5 ug/L <0.1 U ug/L
SWDI-13 <0.16 U ug/L <0.17 U ug/L 0.18 J ug/L <0.16 U ug/L 2.1 ug/L <0.17 U ug/L 1 ug/L <0.1 U ug/L
SWDI-14 <0.16 U ug/L <0.17 U ug/L 0.36 J ug/L <0.16 U ug/L 7.1 ug/L 0.18 J ug/L 2.4 ug/L <0.1 U ug/L
SWDI-15 <0.16 U ug/L <0.17 U ug/L 0.22 J ug/L <0.16 U ug/L 5.2 ug/L <0.17 U ug/L 2.3 ug/L <0.1 U ug/L
SWDI-16 <0.16 U ug/L <0.17 U ug/L <0.16 U ug/L <0.16 U ug/L 12 ug/L <0.17 U ug/L 5.7 ug/L <0.1 U ug/L
LegendPasses VOC standard
Exceeds VOC Standard
Notes:
U = The analyte was analyzed for and is not present above the reported SQL.
J = The analyte was analyzed for and was positively identified, but the associated numerical value may not be consistent with the amount actually present in the environmental sample. The data should be
considered as a basis for decision-making and are usable for many purposes.
J+ = The analyte was analyzed for and was positively identified, but the associated numerical value may not be consistent with the amount actually present in the environmental sample and validation
indicates a positive bias. The data should be considered as a basis for decision-making and are usable for many purposes.
Toluene Trichloroethene Vinyl chlorideSample ID
Benzene Chlorobenzene Chloroform Ethylbenzene Tetrachloroethene
Page 1 of 1

Data Summary Report
FIGURES

S
S
S
S
S
S
S
S
S
S
S
S
S
S
S
S
S
S
S
S
S
S
S
S
S
S
S
S
S
S
S
S
S
S
S
S
S
S
S
S
S
S
S
S
S
S
S
S
S
S
S
S
S
S
S
S
MW-2
MW-3
Sanitary Sewer
TH-25
TH-26
TH-213A
TH-216A
TH-31
SWDI-6
TH-32
TH-33
TH-17
TH-34
TH-35
SWDI-7
TH-214A
SWDI-5
SWDI-4
SWDI-3
SWDI-10
TH-36
SWDI-8
TH-40
TH-10
TH-39
SWDI-16
TH-23
TH-9
SWDI-12
SWDI-11
SWDI-9
MW-1
SWDI-2
SWDI-1
SWDI-13
SWDI-14
SWDI-15
SB-4-3
LEGEND
SS Sanitary Sewer
M:\clients\EMSI\VB-I70\2015\Design Investigation\DSR-Report\Fig1-Base.dwg 8/19/15
SCALE IN FEET
0 200100
Limits of Fill Material Within the Coliseum
Parking Area as Defined During the OU2
Remedial Investigation (EMSI, 2009)
Engineering Management Support, Inc.EMSI
Figure 1
BASE MAP
OPERABLE UNIT #2, VB I70 SUPERFUND SITE
Boring by EMSI, 2009
Monitoring Well Location
Temporary Piezometer Location by
Respondent
Boring by Respondent
Boring by CTL Thompson
Boring by Metro Wastewater
Stormwater Channel Center Alignment
Surface Cut for Open Channel
Surface Cut for Box Culvert

S
S
S
S
S
S
S
S
S
S
S
S
S
S
S
S
S
S
S
S
S
S
S
S
S
S
S
S
S
S
S
S
S
S
S
S
S
S
S
S
S
S
S
S
S
S
S
S
S
S
S
S
S
S
S
S
MW-2
MW-3
Sanitary Sewer
TH-213A
TH-216A
TH-214A
TH-212
MW-1
SB-4-3
LEGEND
SS Sanitary Sewer
M:\clients\EMSI\VB-I70\2015\Design Investigation\DSR-Report\Fig2-Bedrock-Surface-add4-3.dwg 4/14/2015
SCALE IN FEET
0 200100
Limits of Fill Material Within the Coliseum
Parking Area as Defined During the OU2
Remedial Investigation (EMSI, 2009)
Engineering Management Support, Inc.EMSI
Figure 2
BEDROCK SURFACE MAP
OPERABLE UNIT #2, VB I70 SUPERFUND SITE
Monitoring Well Location
Temporary Piezometer Location by
Respondent
Boring by CTL Thompson
Boring by Metro Wastewater
Bedrock Elevation (Feet)(5142.25)
Bedrock Elevation Contour (Feet)
*
Data Not Used in Contouring
Stormwater Channel Center Alignment
Boring by EMSI, 2009
Surface Cut for Open Channel
Surface Cut for Box Culvert

S
S
S
S
S
S
S
S
S
S
S
S
S
S
S
S
S
S
S
S
S
S
S
S
S
S
S
S
S
S
S
S
S
S
S
S
S
S
S
S
S
S
S
S
S
S
S
S
S
S
S
S
S
S
S
S
MW-2
MW-3
Sanitary Sewer
(18.20)
(28.50)
TH-213A
(26.05)
TH-32
(27.90)
TH-31
TH-35
(24.50)
SWDI-5
(25.00)
TH-214A
SWDI-16
(17.00)
(17.00)
TH-23
TH-40
(12.00)
SWDI-14
(8.00)
(18.00)
SWDI-13TH-10
(19.50)
TH-212
TH-25
(21.00)
TH-26
TH-216A
(25.50)
(23.50)
(19.00)
TH-39
(27.90)
SWDI-10
TH-18
(25.50)
SWDI-6
(26.35)
TH-34
TH-17
(27.00)
MW-1
SWDI-8
(27.00)
(34.40)
TH-36
TH-9
(23.05)
TH-33
SWDI-4
(23.00)
(22.05)
SWDI-7
SB-4-3
(24.00)
(23.50)
SWDI-3
LEGEND
SS Sanitary Sewer
M:\clients\EMSI\VB-I70\2015\Design Investigation\DSR-Report\Fig3-Waste Overburden Thickness.dwg 4/14/2015
SCALE IN FEET
0 200100
Limits of Fill Material Within the Coliseum
Parking Area as Defined During the OU2
Remedial Investigation (EMSI, 2009)
Engineering Management Support, Inc.EMSI
Figure 3
WASTE/OVERBURDEN THICKNESS MAP
OPERABLE UNIT #2, VB I70 SUPERFUND SITE
Boring by Respondent
Monitoring Well Location
Temporary Piezometer Location by
Respondent
Boring by CTL Thompson
Boring by Metro Wastewater
Waste/Overburden Thickness (Feet)(18.20)
Waste/Overburden Thickness Contour (Feet)
Stormwater Channel Center Alignment
Surface Cut for Open Channel
Surface Cut for Box Culvert
Boring by EMSI, 2009

S
S
S
S
S
S
S
S
S
S
S
S
S
S
S
S
S
S
S
S
S
S
S
S
S
S
S
S
S
S
S
S
S
S
S
S
S
S
S
S
S
S
S
S
S
S
S
S
S
S
S
S
S
S
S
S
Sanitary Sewer
5156.26
51556.97
5157.25
5159.04
5158.70
5158.93
5156.75
5157.25
5156.36
5155.66
5155.37
5155.83
NM
5151.04
5149.29
5151.25
5142.81
5150.83
5151.95
5151.42
MW-3
MW-2
MW-1
SWDI-14
SWDI-12
SWDI-13
SWDI-16
SWDI-15
SWDI-10
SWDI-9
SWDI-11
SWDI-4
SWDI-3
SWDI-5
SWDI-7
SWDI-8 SWDI-6
SWDI-2
SWDI-1
LEGEND
SS Sanitary Sewer
M:\clients\EMSI\VB-I70\2015\Design Investigation\DSR-Report\Fig4a-July-Potentiometric.dwg 4/14/2015
SCALE IN FEET
0 200100
Limits of Fill Material Within the Coliseum
Parking Area as Defined During the OU2
Remedial Investigation (EMSI, 2009)
Engineering Management Support, Inc.EMSI
Figure 4a
POTENTIOMETRIC SURFACE MAP
JULY 2015
OPERABLE UNIT #2, VB I70 SUPERFUND SITE
Boring By Respondent
Boring Installed by Others
Temporary Piezometer Location by
Respondent
Monitoring Well Location
Potentiometric Surface Elevation
Potentiometric Surface Contour
Not MeasuredNM
5150.83
Groundwater Flow
Stormwater Channel Center Alignment
Surface Cut for Open Channel
Surface Cut for Box Culvert

S
S
S
S
S
S
S
S
S
S
S
S
S
S
S
S
S
S
S
S
S
S
S
S
S
S
S
S
S
S
S
S
S
S
S
S
S
S
S
S
S
S
S
S
S
S
S
S
S
S
S
S
S
S
S
S
Sanitary Sewer
5137.60
5149.38
5151.13
NM
5155.80
5156.41
5155.52
5150.90
5156.70
5157.02
5157.20
5158.57
5158.94
5158.41
5151.85
5154.06
SWDI-14
SWDI-13
SWDI-10
SWDI-11
SWDI-9
SWDI-16
MW-1
SWDI-2
SWDI-1
SWDI-5
SWDI-3
SWDI-6
MW-2
MW-3
5156.33
SWDI-4
SWDI-7
SWDI-8
5157.23
5155.47
SWDI-12
5151.36
SWDI-15
LEGEND
SS Sanitary Sewer
M:\clients\EMSI\VB-I70\2015\Design Investigation\DSR-Report\Fig4b-Aug-Potentiometric.dwg 4/14/2015
SCALE IN FEET
0 200100
Limits of Fill Material Within the Coliseum
Parking Area as Defined During the OU2
Remedial Investigation (EMSI, 2009)
Engineering Management Support, Inc.EMSI
Figure 4b
POTENTIOMETRIC SURFACE MAP
AUGUST 2015
OPERABLE UNIT #2, VB I70 SUPERFUND SITE
Boring By Respondent
Boring Installed by Others
Temporary Piezometer Location by
Respondent
Monitoring Well Location
Potentiometric Surface Elevation
Potentiometric Surface Contour
Not MeasuredNM
5150.83
Groundwater Flow
Stormwater Channel Center Alignment
Surface Cut for Open Channel
Surface Cut for Box Culvert

S
S
S
S
S
S
S
S
S
S
S
S
S
S
S
S
S
S
S
S
S
S
S
S
S
S
S
S
S
S
S
S
S
S
S
S
S
S
S
S
S
S
S
S
S
S
S
S
S
S
S
S
S
S
S
S
MW-1
MW-2
MW-3
Sanitary Sewer
SWDI-14
SWDI-13
SWDI-9
SWDI-15
SWDI-16
SWDI-6
SWDI-12
SWDI-2
SWDI-1
SWDI-5
SWDI-10
SWDI-11
(5.90)
(3.25)
(5.82)
(14.85)
(14.08)
(14.50)
SWDI-3
SWDI-4
(12.71)
SWDI-7
(11.90)
SWDI-8
(12.47)
LEGEND
SS Sanitary Sewer
M:\clients\EMSI\VB-I70\2015\Design Investigation\DSR-Report\Fig5-Saturated Thickness.dwg 4/14/2015
SCALE IN FEET
0 200100
Limits of Fill Material Within the Coliseum
Parking Area as Defined During the OU2
Remedial Investigation (EMSI, 2009)
Engineering Management Support, Inc.EMSI
Figure 5
SATURATED THICKNESS MAP
JULY 2015
OPERABLE UNIT #2, VB I70 SUPERFUND SITE
Boring By Respondent
Boring Installed by Others
Temporary Piezometer Location by
Respondent
Monitoring Well Location
Saturated Thickness Elevation
Saturated Thickness Contour
(3.26)
Stormwater Channel Center Alignment
Surface Cut for Open Channel
Surface Cut for Box Culvert

Ele
va
tio
n
5135
5140
5145
5150
5155
5160
5165
5170
5175
5180
5185
0+00 1+00 2+00 3+00 4+00 5+00 6+00 7+00 8+00 9+00 10+00 11+00 12+00 13+00 14+00 15+00
5135
5140
5145
5150
5155
5160
5165
5170
5175
5180
5185
16+00
4' B
ELO
W C
HA
NN
EL G
RA
DE
1' BE
LOW
BA
SE
OF
RC
B
1' BELO
W B
ASE OF R
CB
M:\clients\EMSI\VB-I70\2015\Design Investigation\DSR-Report\Fig6-Channel-Profiles.dwg 8/19/15
Engineering Management Support, Inc.EMSI
Figure 6
SUBSURFACE PROFILE
ALONG CHANNEL ALIGNMENT
OPERABLE UNIT #2, VB I70 SUPERFUND SITE
200
FEET
0
100
10
FE
ET
5
200
FEET
0
100
50
FE
ET
25
LEGEND
Ground Surface (Topography)
Top of Bedrock
Groundwater Table (July 2015)
VERTICAL EXAGGERATION 20X

Data Summary Report
APPENDIX A
Boring Logs, Piezometer Construction Diagrams,
and Groundwater Sampling Records


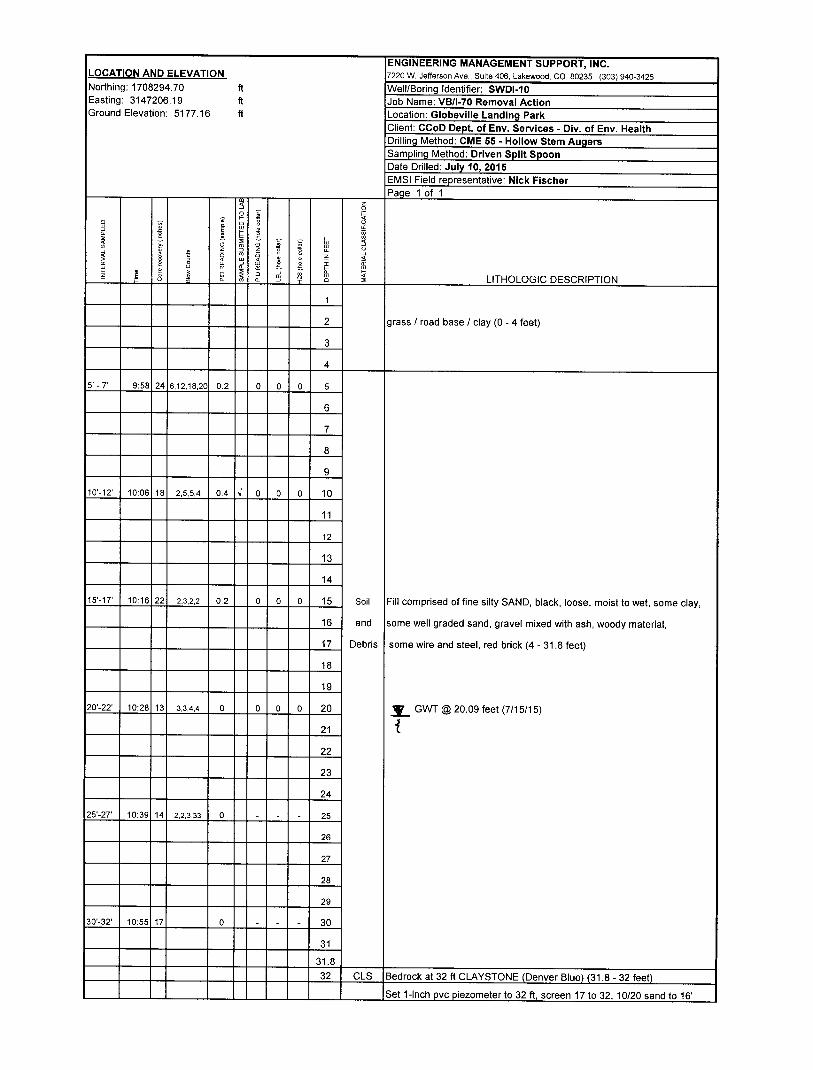


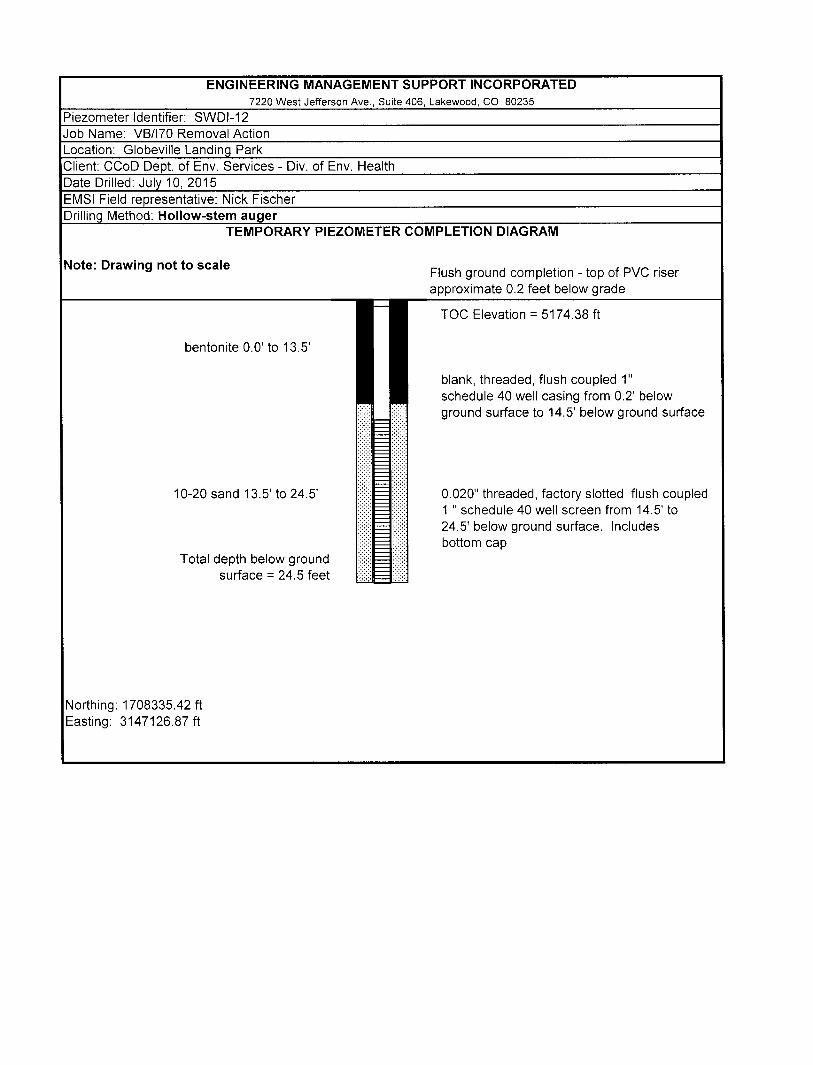


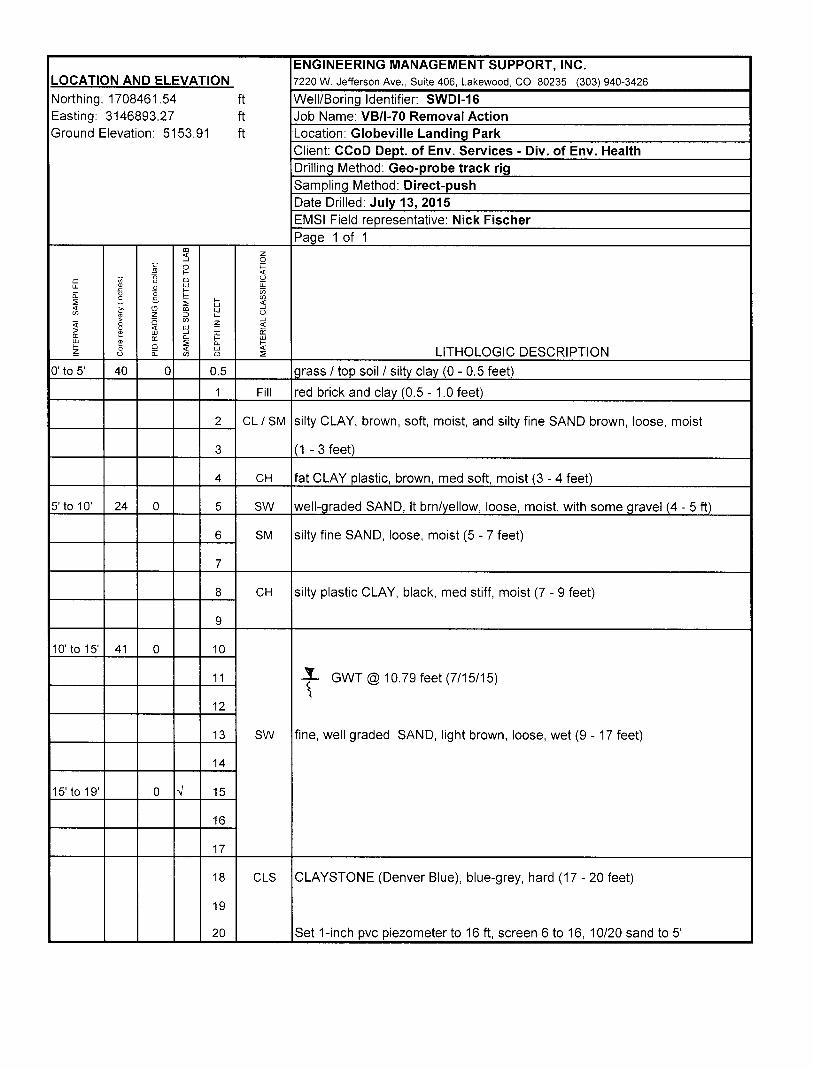


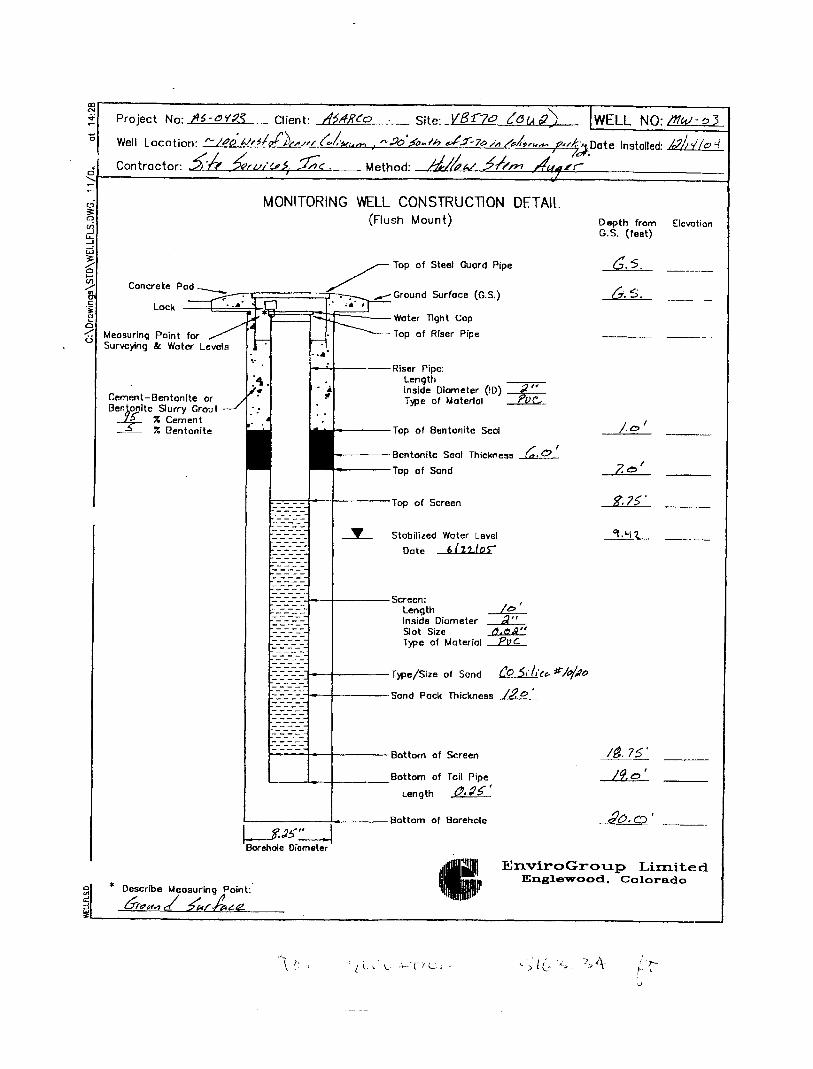
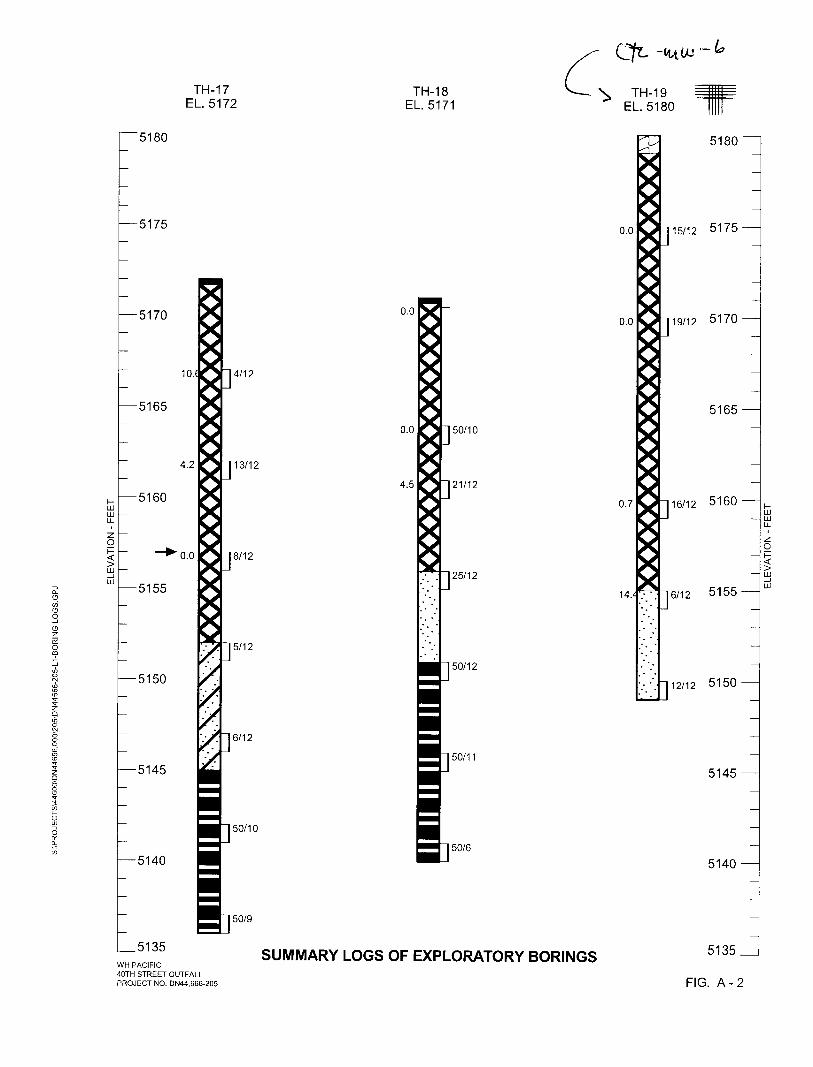


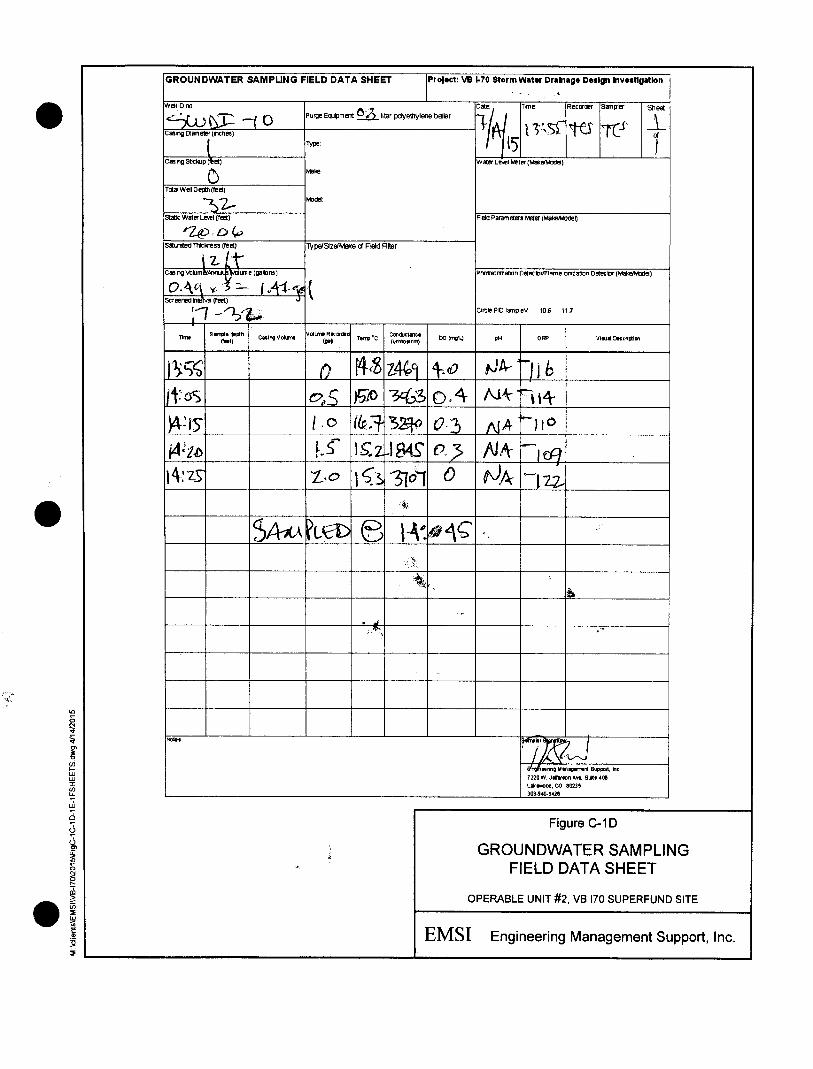


Data Summary Report
APPENDIX B
Waste Screening Results, Analytical Results,
and Data Validation Reports

Hazardous Waste Characteristic Screening Results
VB/I-70 Removal Action Design Investigation
Sample Date Performed by
Ignitability Screen
Corrosivity Screen
Reactive Cyanides
Screen
Reactive Sulfides Screen
Oxidizer Screen
Paint Filter Test
SWDI-1 7/11/15 TCS Pass pH 7.0 Pass None None None Pass
SWDI-2 7/11/15 TCS Pass pH 7.0 Pass None None None Pass
SWDI-3 7/11/15 TCS Pass pH 8.0 Pass None None None Pass
SWDI-4 7/11/15 TCS Pass pH 8.0 Pass None None None Pass
SWDI-5 7/11/15 TCS Pass pH 7.5 Pass None None None Pass
SWDI-6 7/11/15 TCS Pass pH 7.5 Pass None None None Pass
SWDI-7 7/11/15 TCS Pass pH 8.5 Pass None None None Pass
SWDI-8 7/11/15 TCS Pass pH 8.0 Pass None None None Pass
SWDI-9 7/19/15 TCS Pass pH 9.5 Pass None None None Pass
SWDI-10 7/19/15 TCS Pass pH 7.0 Pass None None None Pass
SWDI-11 7/19/15 TCS Pass pH 7.0 Pass None None None Pass
SWDI-12 7/19/15 TCS Pass pH 7.5 Pass None None None Pass
SWDI-13 7/19/15 TCS Pass pH 7.5 Pass None None None Pass
SWDI-14 7/19/15 TCS Pass pH 7.0 Pass None None None Pass
SWDI-15 7/19/15 TCS Pass pH 7.0 Pass None None None Pass
SWDI-16 7/19/15 TCS Pass pH 7.5 Pass None None None Pass

Data Summary Report
APPENDIX C
Asbestos Report


