ESA Gaia: Expectation
for Astroparticle Physics
René Hudec, Vojtěch Šimon, Lukáš Hudec
& Collaborators & Gaia CU7 consortiumGroup of High Energy Astrophysics
Astronomical Institute of Academy of Sciences of the Czech
Republic, Ondřejov, Czech Republic
ISDC Versoix, SwitzerlandSanta Fe GRB Workshop 2007
Reference: http://sci.esa.int/gaia/
2
ESA Mission Gaia
Unraveling the chemical and dynamical history of our Galaxy
Albeit focusing on astrometry, Gaia will also providespectrophotometry for all objects down to mag 20 over 5 years operation period. Typically 50 to 200 measurements per object
including optical counterparts of HE sources.
3
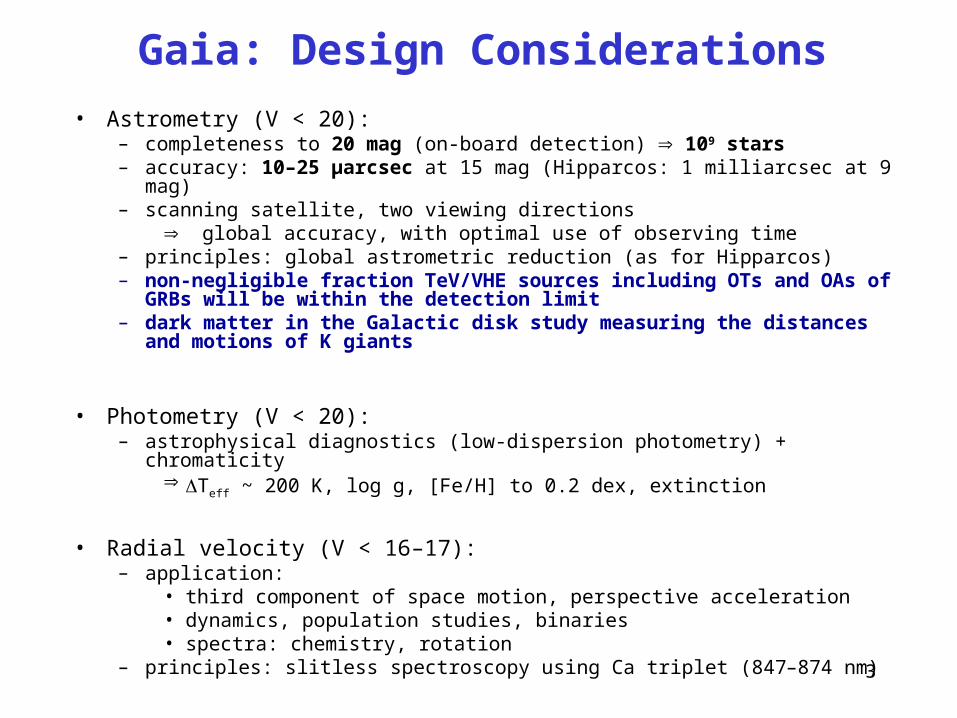
Gaia: Design Considerations
• Astrometry (V < 20):– completeness to 20 mag (on-board detection) 109 stars– accuracy: 10–25 μarcsec at 15 mag (Hipparcos: 1 milliarcsec at 9 mag)– scanning satellite, two viewing directions
global accuracy, with optimal use of observing time– principles: global astrometric reduction (as for Hipparcos)– non-negligible fraction TeV/VHE sources including OTs and OAs of GRBs
will be within the detection limit– dark matter in the Galactic disk study measuring the distances and
motions of K giants
• Photometry (V < 20):– astrophysical diagnostics (low-dispersion photometry) + chromaticity
Teff ~ 200 K, log g, [Fe/H] to 0.2 dex, extinction
• Radial velocity (V < 16–17):– application:
• third component of space motion, perspective acceleration• dynamics, population studies, binaries• spectra: chemistry, rotation
– principles: slitless spectroscopy using Ca triplet (847–874 nm)
4
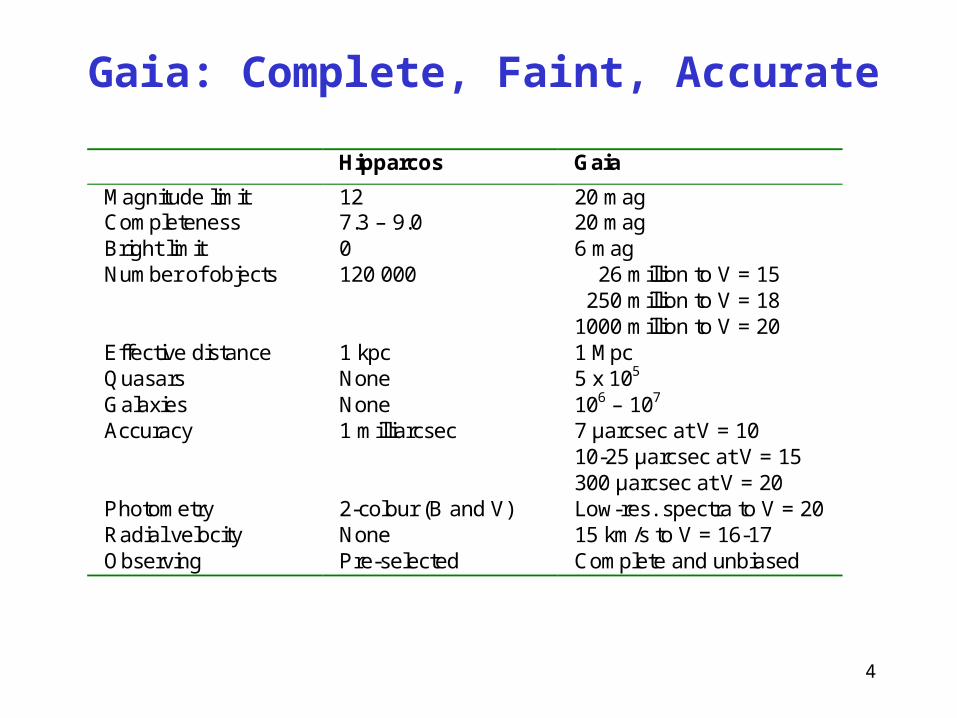
Gaia: Complete, Faint, Accurate
Hipparcos Gaia
Magnitude limit 12 20 mag Completeness 7.3 – 9.0 20 mag Bright limit 0 6 mag Number of objects 120 000 26 million to V = 15 250 million to V = 18 1000 million to V = 20 Effective distance limit
1 kpc 1 Mpc Quasars None 5 x 10⁵
Galaxies None 106 – 107 Accuracy 1 milliarcsec 7 µarcsec at V = 10 10-25 µarcsec at V = 15 300 µarcsec at V = 20 Photometry photometry
2-colour (B and V) Low-res. spectra to V = 20 Radial velocity None 15 km/s to V = 16-17 Observing programme
Pre-selected Complete and unbiased
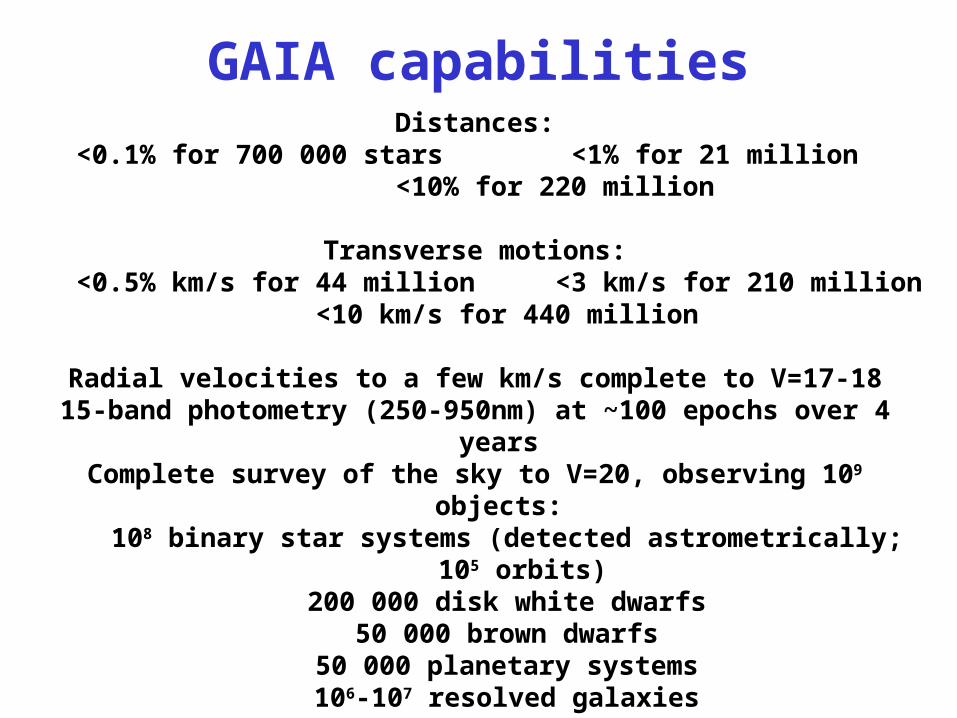
GAIA capabilitiesDistances:
<0.1% for 700 000 stars <1% for 21 million <10% for 220 million
Transverse motions:<0.5% km/s for 44 million <3 km/s for 210 million <10 km/s for 440
million
Radial velocities to a few km/s complete to V=17-1815-band photometry (250-950nm) at ~100 epochs over 4 years
Complete survey of the sky to V=20, observing 109 objects: 108 binary star systems (detected astrometrically; 105 orbits)
200 000 disk white dwarfs 50 000 brown dwarfs
50 000 planetary systems 106-107 resolved galaxies
105 quasars 105 extragalactic supernovae
105-106 Solar System objects (65 000 presently known)
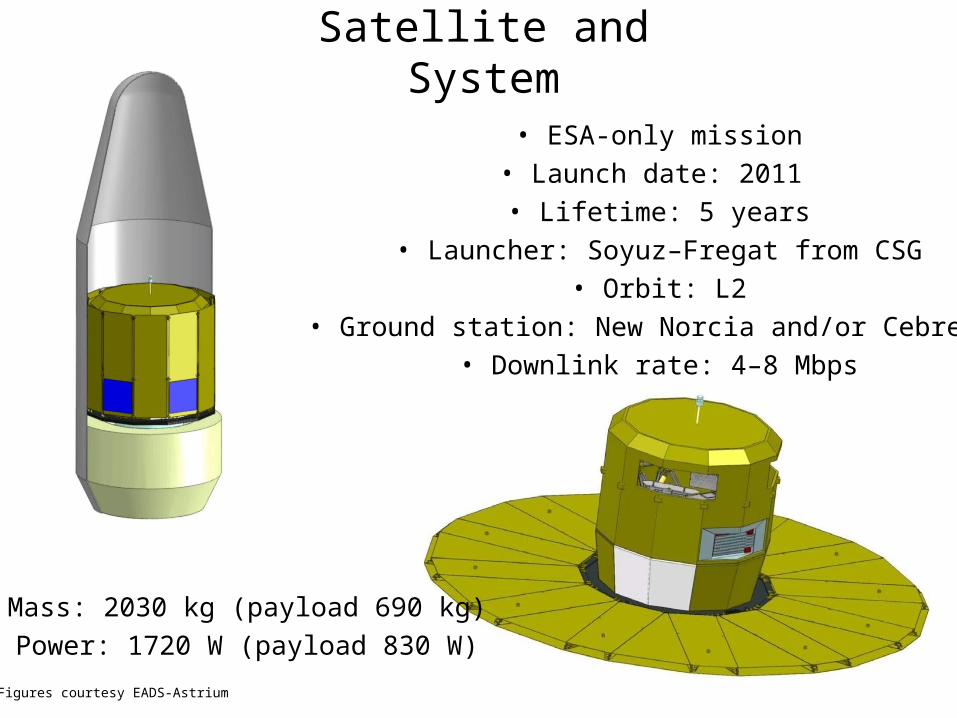
Satellite and System
• ESA-only mission• Launch date: 2011
• Lifetime: 5 years• Launcher: Soyuz–Fregat from CSG
• Orbit: L2• Ground station: New Norcia and/or Cebreros
• Downlink rate: 4–8 Mbps
• Mass: 2030 kg (payload 690 kg)• Power: 1720 W (payload 830 W)
Figures courtesy EADS-Astrium
7
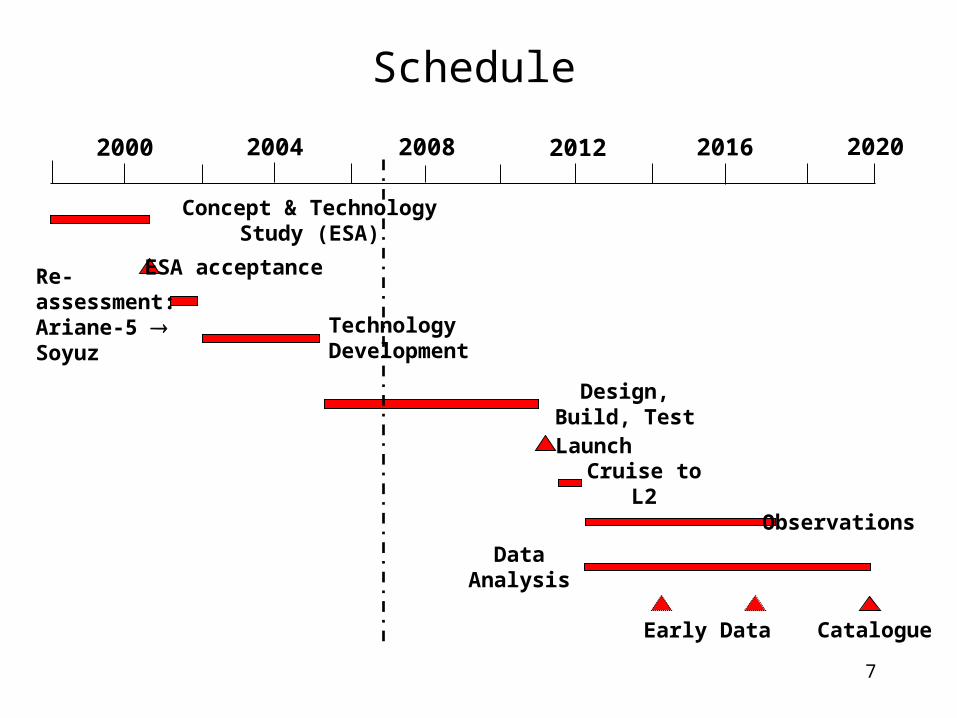
Schedule
Catalogue
2000 2004 2008 2012 2016 2020
ESA acceptance
Technology Development
Design, Build, Test
Launch
Observations
Data Analysis
Early Data
Concept & Technology Study (ESA)
Re-assessment:Ariane-5 Soyuz
Cruise to L2
8
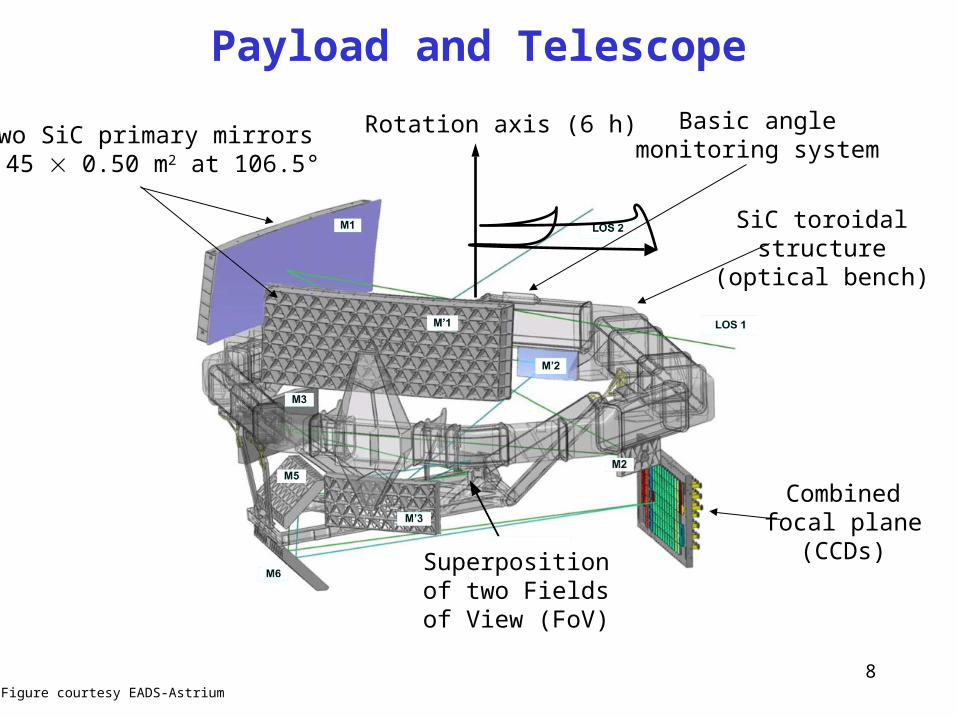
Payload and Telescope
Two SiC primary mirrors1.45 0.50 m2 at 106.5°
SiC toroidalstructure
(optical bench)
Basic anglemonitoring system
Combinedfocal plane
(CCDs)
Rotation axis (6 h)
Figure courtesy EADS-Astrium
Superposition of two Fields of View
(FoV)
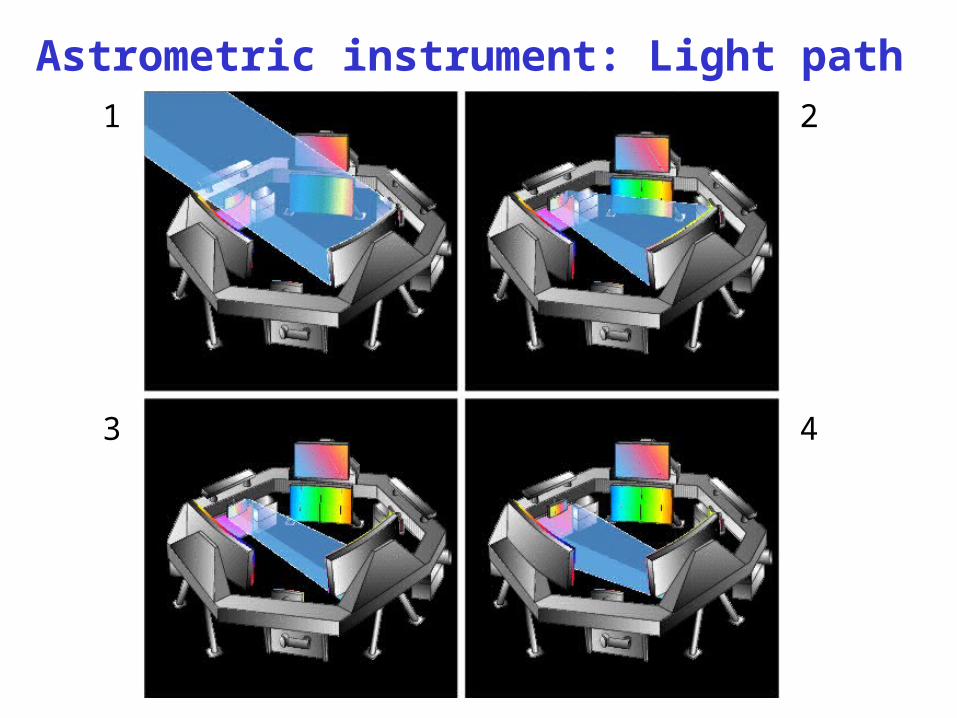
Astrometric instrument: Light path1 2
3 4

10
Photometry Measurement Concept
Figures courtesy EADS-Astrium
Blue photometer:330–680 nm
Red photometer:640–1000 nm
11
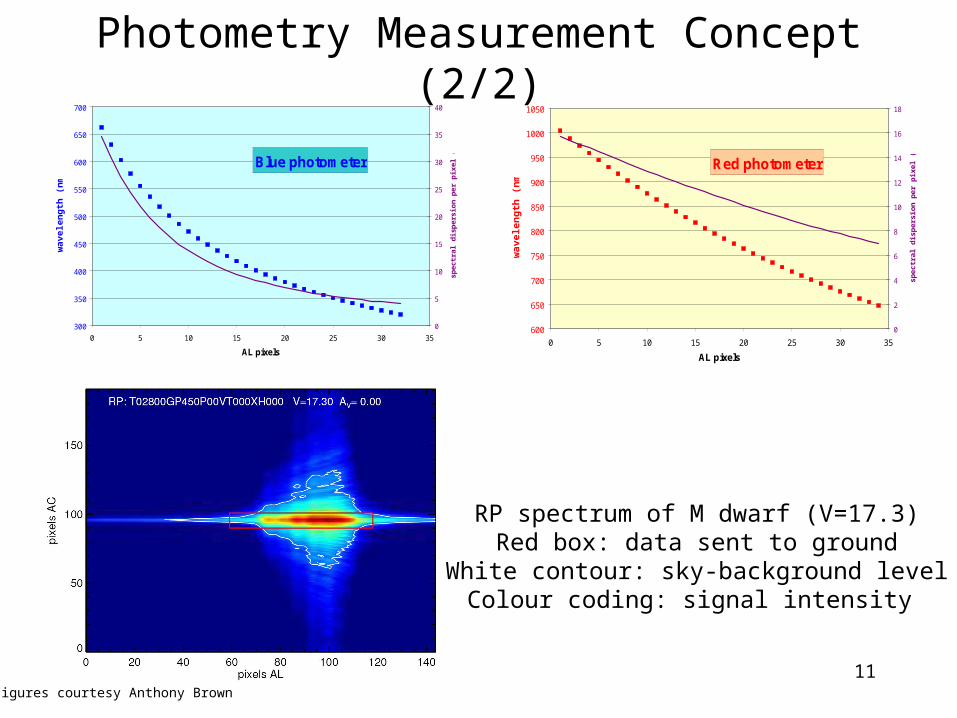
Photometry Measurement Concept (2/2)
Figures courtesy Anthony Brown
Blue photometer
300
350
400
450
500
550
600
650
700
0 5 10 15 20 25 30 35
AL pixels
wav
elen
gth
(n
m)
0
5
10
15
20
25
30
35
40
spec
tral
dis
pers
ion
per
pixe
l (nm
) . Red photometer
600
650
700
750
800
850
900
950
1000
1050
0 5 10 15 20 25 30 35
AL pixels
wav
elen
gth
(n
m)
0
2
4
6
8
10
12
14
16
18
spec
tral
dis
pers
ion
per
pixe
l (nm
) .
RP spectrum of M dwarf (V=17.3)Red box: data sent to ground
White contour: sky-background levelColour coding: signal intensity
12
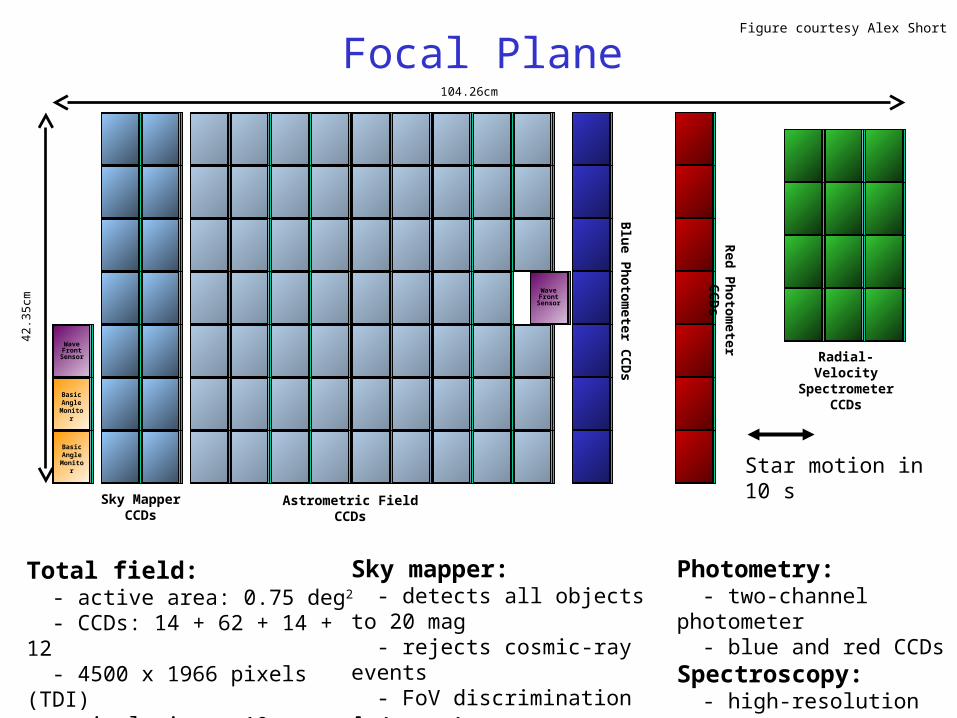
Focal Plane
Star motion in 10 s
Total field: - active area: 0.75 deg2
- CCDs: 14 + 62 + 14 + 12 - 4500 x 1966 pixels (TDI) - pixel size = 10 µm x 30 µm
= 59 mas x 177 mas
Astrometric Field CCDs
Blue P
hotometer C
CD
s
Sky Mapper CCDs
104.26cm
Red P
hotometer C
CD
s Radial-Velocity Spectrometer
CCDs
Basic Angle
Monitor
Wave Front Sensor
Basic Angle
Monitor
Wave Front Sensor
Sky mapper: - detects all objects to 20 mag - rejects cosmic-ray events - FoV discriminationAstrometry: - total detection noise: 6 e-
Photometry: - two-channel photometer - blue and red CCDsSpectroscopy: - high-resolution spectra - red CCDs
42.3
5cm
Figure courtesy Alex Short
13
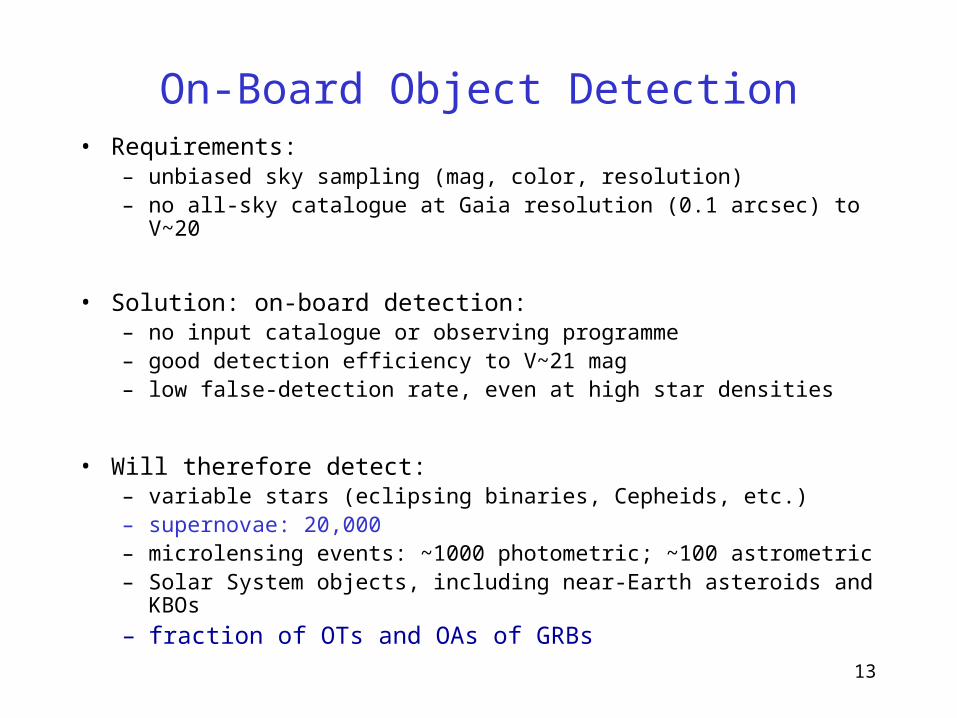
On-Board Object Detection• Requirements:
– unbiased sky sampling (mag, color, resolution)– no all-sky catalogue at Gaia resolution (0.1 arcsec) to V~20
• Solution: on-board detection:– no input catalogue or observing programme– good detection efficiency to V~21 mag– low false-detection rate, even at high star densities
• Will therefore detect:– variable stars (eclipsing binaries, Cepheids, etc.)– supernovae: 20,000– microlensing events: ~1000 photometric; ~100 astrometric– Solar System objects, including near-Earth asteroids and KBOs
– fraction of OTs and OAs of GRBs
14
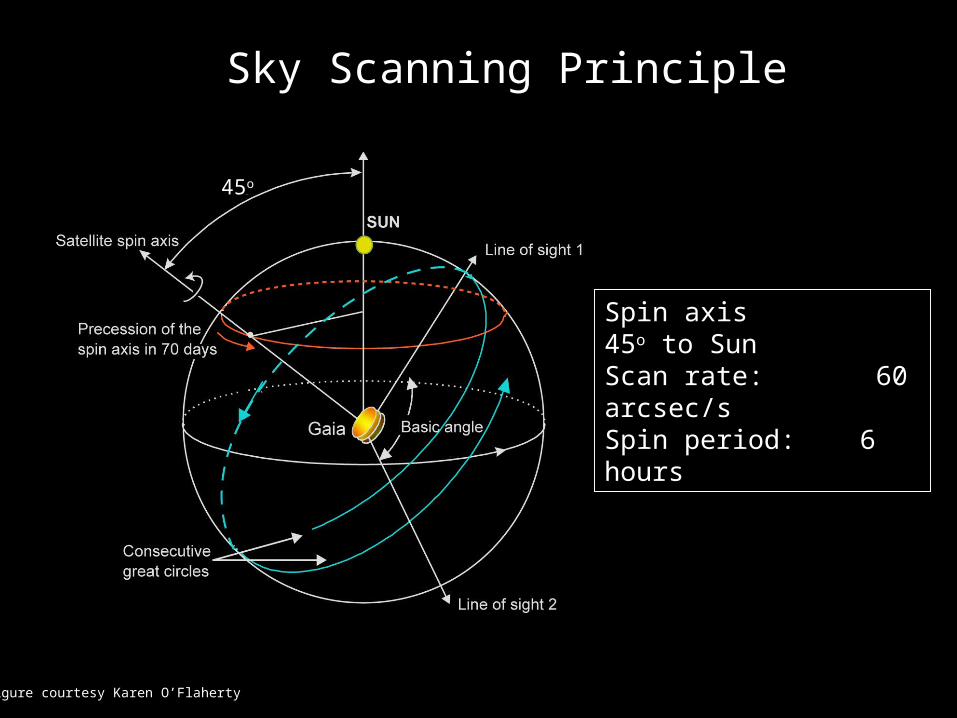
Sky Scanning Principle
Spin axis 45o to SunScan rate: 60 arcsec/sSpin period: 6 hours
45o
Figure courtesy Karen O’Flaherty
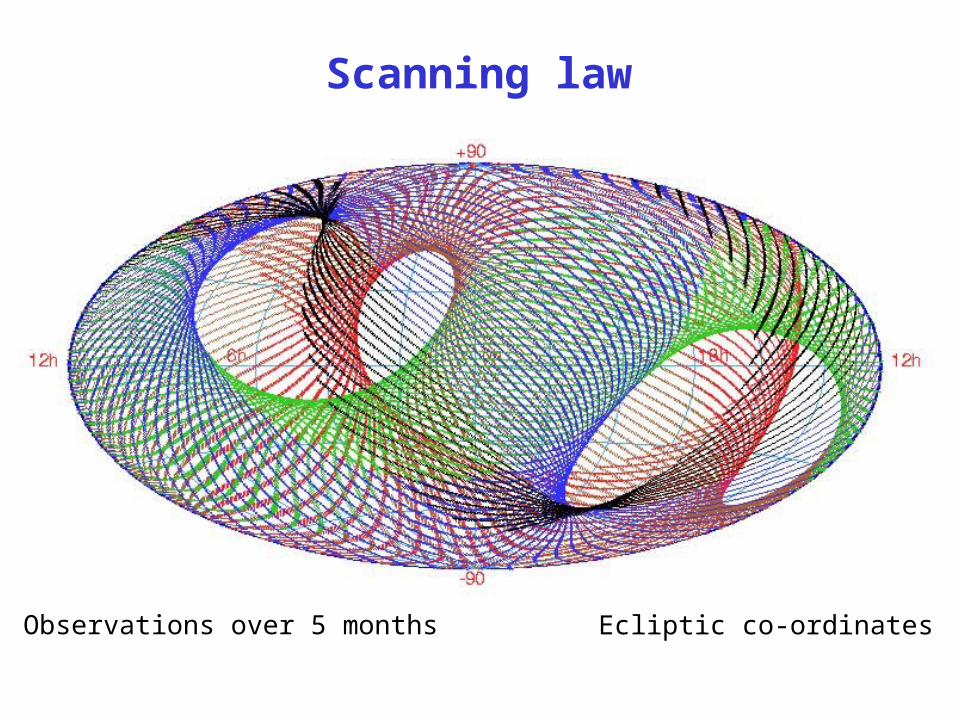
Scanning law
Observations over 5 months Ecliptic co-ordinates
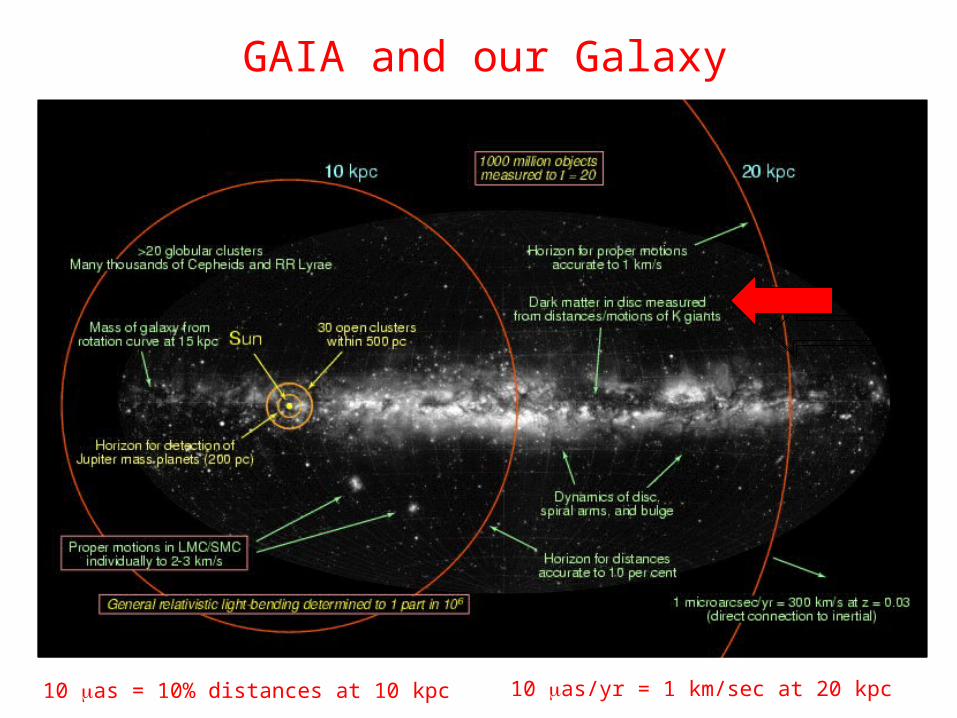
GAIA and our Galaxy
10 as = 10% distances at 10 kpc 10 as/yr = 1 km/sec at 20 kpc
17
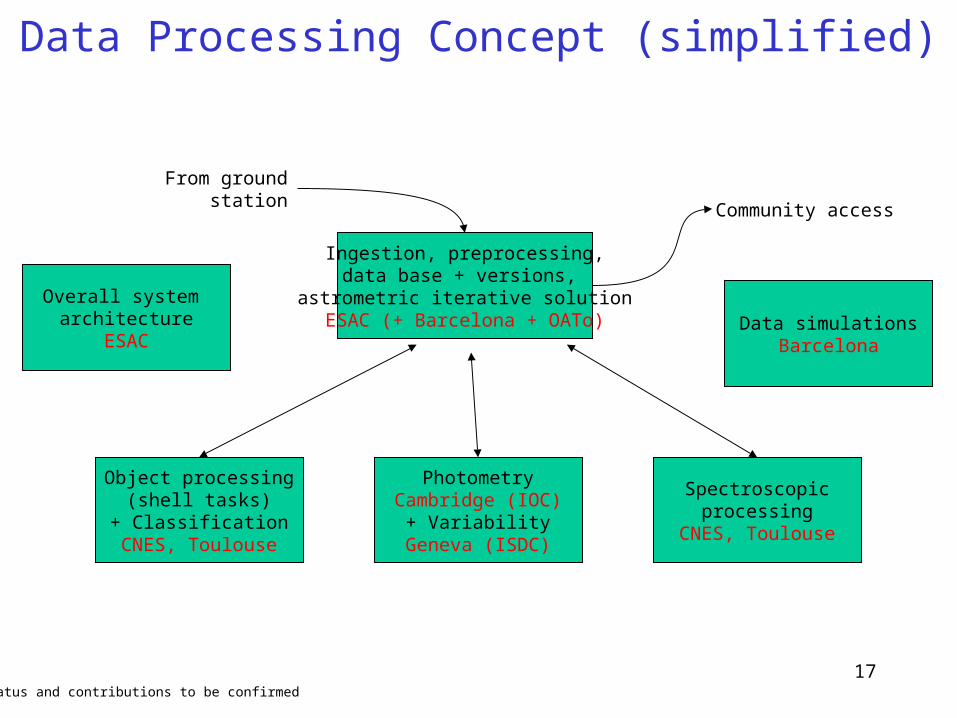
Ingestion, preprocessing,data base + versions,
astrometric iterative solutionESAC (+ Barcelona + OATo)
Object processing(shell tasks)
+ ClassificationCNES, Toulouse
PhotometryCambridge (IOC)
+ VariabilityGeneva (ISDC)
Spectroscopicprocessing
CNES, Toulouse
Overall system architecture
ESACData simulations
Barcelona
From ground station
Community access
Data Processing Concept (simplified)
Status and contributions to be confirmed
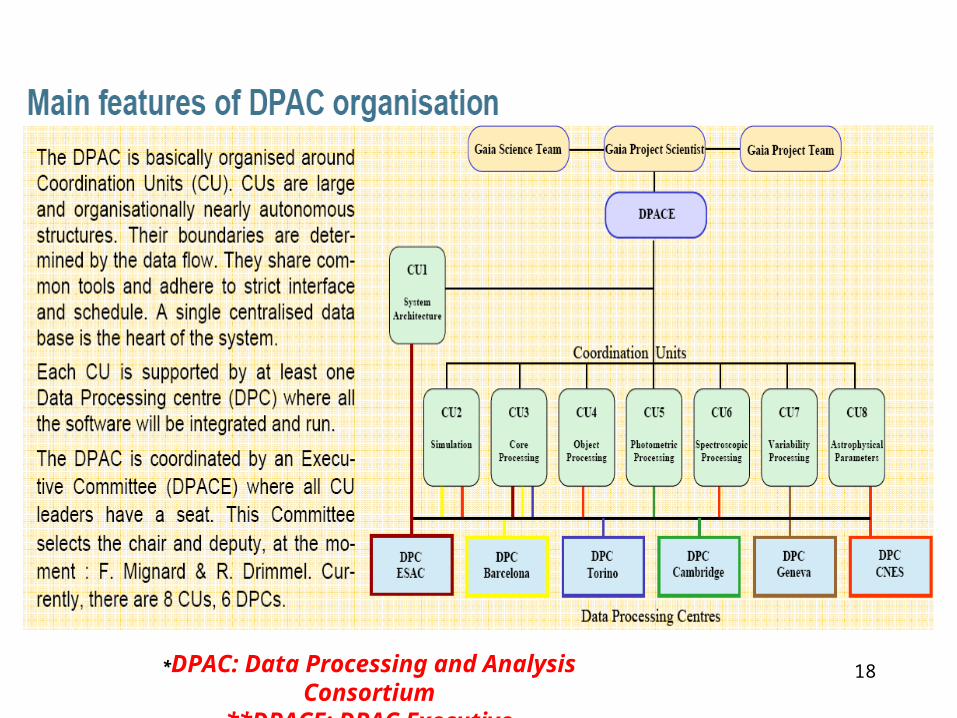
18*DPAC: Data Processing and Analysis Consortium**DPACE: DPAC Executive
19
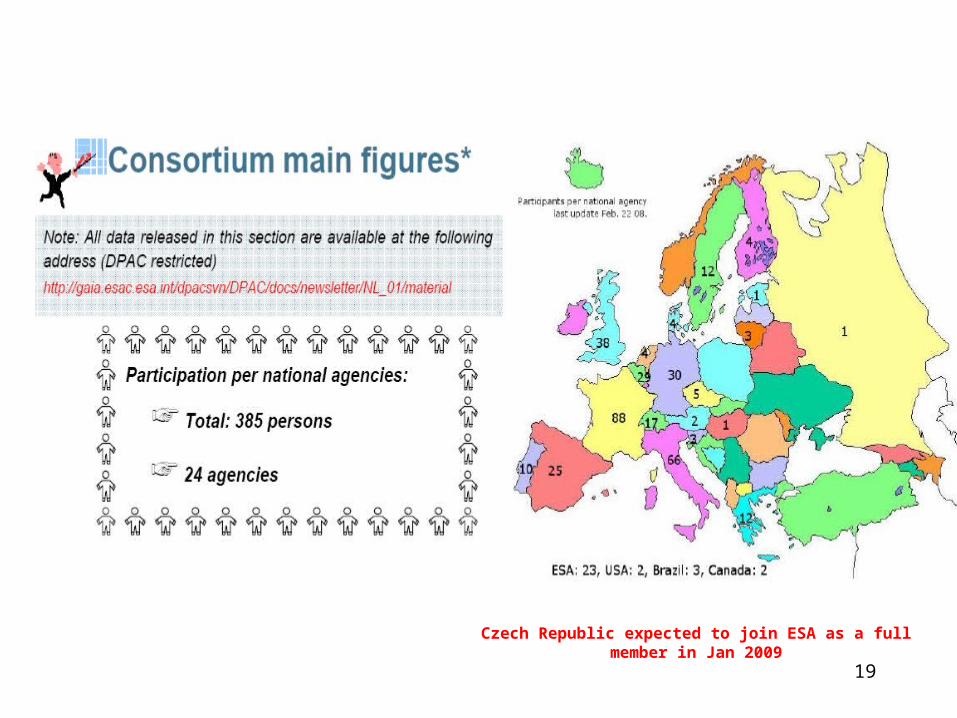
Czech Republic expected to join ESA as a full member in Jan 2009
20
Gaia CU7 Sub-workpackage
on Optical Counterparts of
High-Energy SourcesRené Hudec & Collaborators
Leuven, Nov 9-10, 2006
22
Motivation of the Gaia CU7 Sub-workpackage on Optical Counterparts of
High-Energy Sources
• Many of HE&VHE sources (including OAs and OTs of GRBs) have also optical emission, mostly variable and accessible by Gaia
• Monitoring of this variable optical emission provides important input to understanding the physics of the source
• Multispectral analyses
23
Optical Counterparts of High Energy Sources
The objective of the work package:
• The investigations and analyses of optical counterparts of high energy astrophysics sources based on Gaia data and complex analyses with additional data. Specifically:
• For selected targets, multispectral analyses using Gaia and other databases (such as the satellite X-ray and gamma-ray data, optical ground-based data etc) may be feasible.
• Analyses of long-term light changes and their evolution• Analyses of active states and flares• The study and understanding of related physical processes.• Spectrophotometry, relation of brightness and spectrum/colour.• For selected sources, dedicated complex analyses.• Statistics of the whole sample of objects.
24
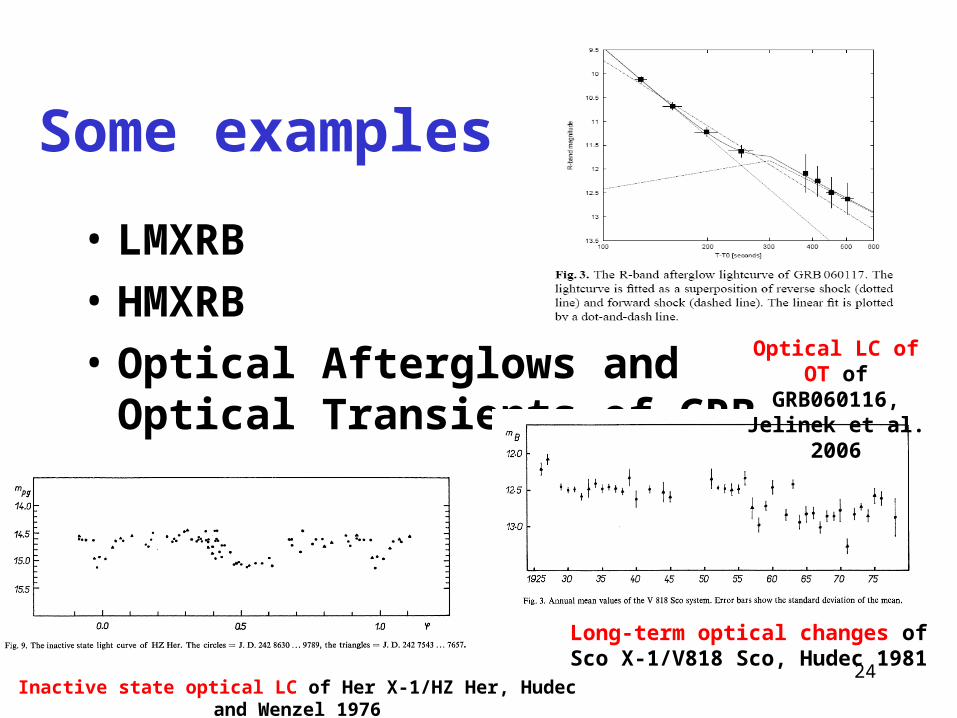
Some examples
• LMXRB
• HMXRB
• Optical Afterglows and Optical Transients of GRB
Inactive state optical LC of Her X-1/HZ Her, Hudec and Wenzel 1976
Long-term optical changes of Sco X-1/V818 Sco, Hudec 1981
Optical LC of OT of GRB060116,
Jelinek et al. 2006
25
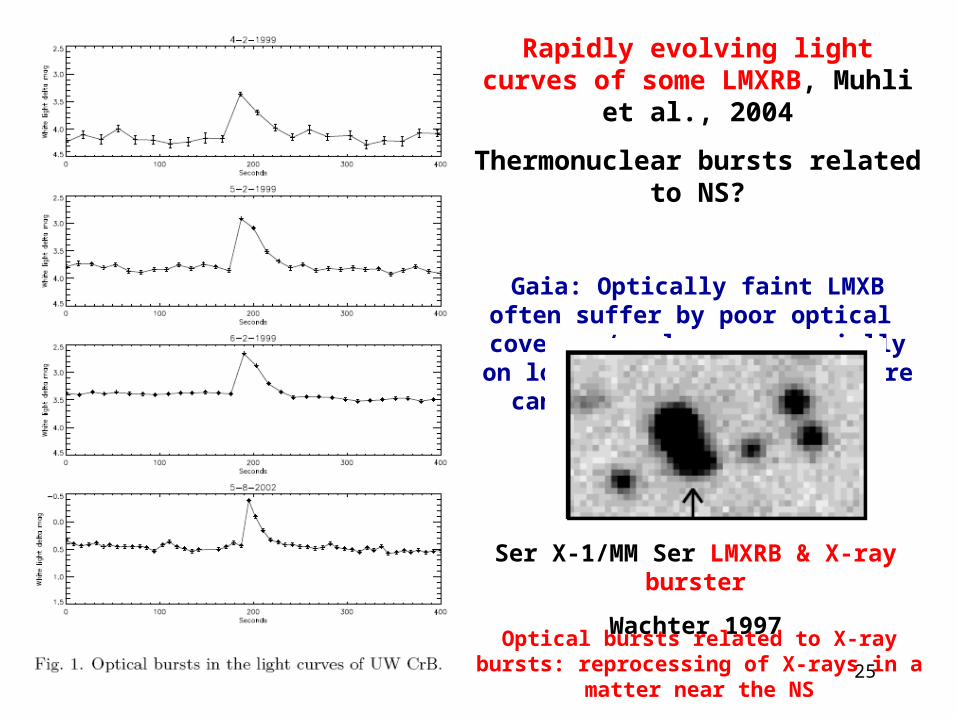
Rapidly evolving light curves of some LMXRB, Muhli et al., 2004
Thermonuclear bursts related to NS?
Gaia: Optically faint LMXB often suffer by poor optical coverage/analyses, especially on long-term time scales. Here can Gaia
provide important inputs.
Ser X-1/MM Ser LMXRB & X-ray burster
Wachter 1997
Optical bursts related to X-ray bursts: reprocessing of X-rays in a matter near the NS
26
B magnitudy
1% 13%
40%38%
8% 1
2
3
4
5
V magnitudy
1% 17%
43%
34%
5% 1
2
3
4
5
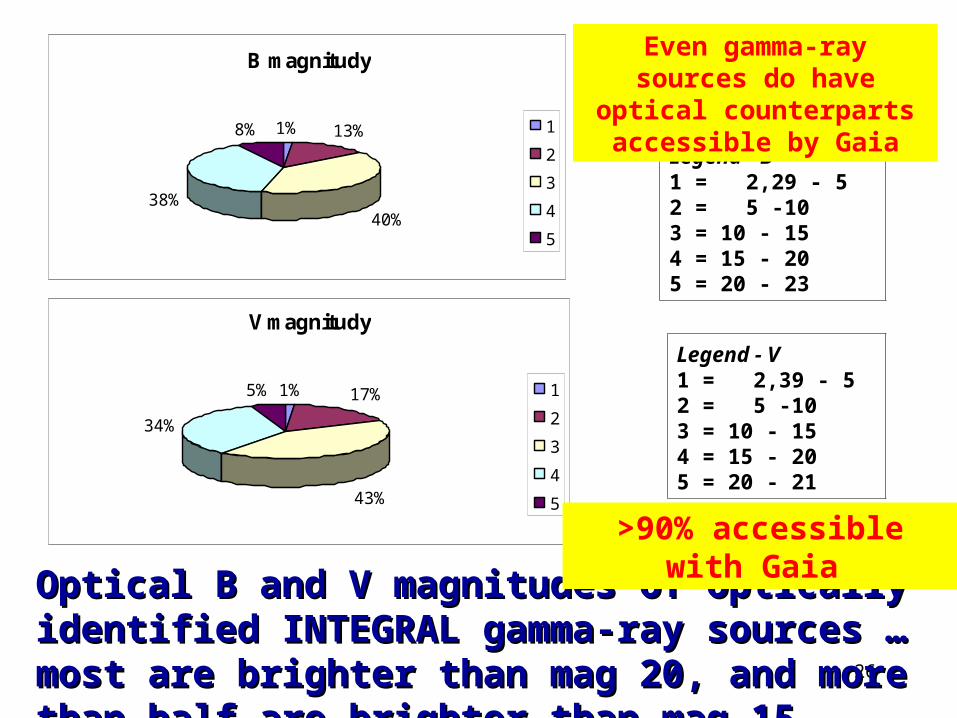
Legend - B1 = 2,29 - 52 = 5 -103 = 10 - 154 = 15 - 205 = 20 - 23
Legend - V1 = 2,39 - 52 = 5 -103 = 10 - 154 = 15 - 205 = 20 - 21
Optical B and V magnitudes of optically identified INTEGRAL Optical B and V magnitudes of optically identified INTEGRAL gamma-ray sources … most are brighter than mag 20, and gamma-ray sources … most are brighter than mag 20, and more than halfmore than half are brighter are brighter than mag 15 than mag 15
>90% accessible with Gaia
Even gamma-ray sources do have optical counterparts
accessible by Gaia
27
Gaia and GRBs: Photometry
• There will be a variety of OTs detected by Gaia• The real OTs and OAs of GRBs can be, among
these, recognized according to their characteristic power-law fading profie
• However, the sampling provided by Gaia, is not optimal for these goals, hence not always we can expect realiable and confirmed detection of OT of GRB based only on photometry by Gaia
28
Gaia and GRBs: Spectroscopy
• The primary strength of Gaia for GRB study is the fine spectro-photometry
• The OAs of GRBs are known to exhibit quite typical colors, distiguishing them from other types of astrophysical objects (Simon et al. 2001, 2004)
• Hence a realiable classification of OTs will be possible using this method
29
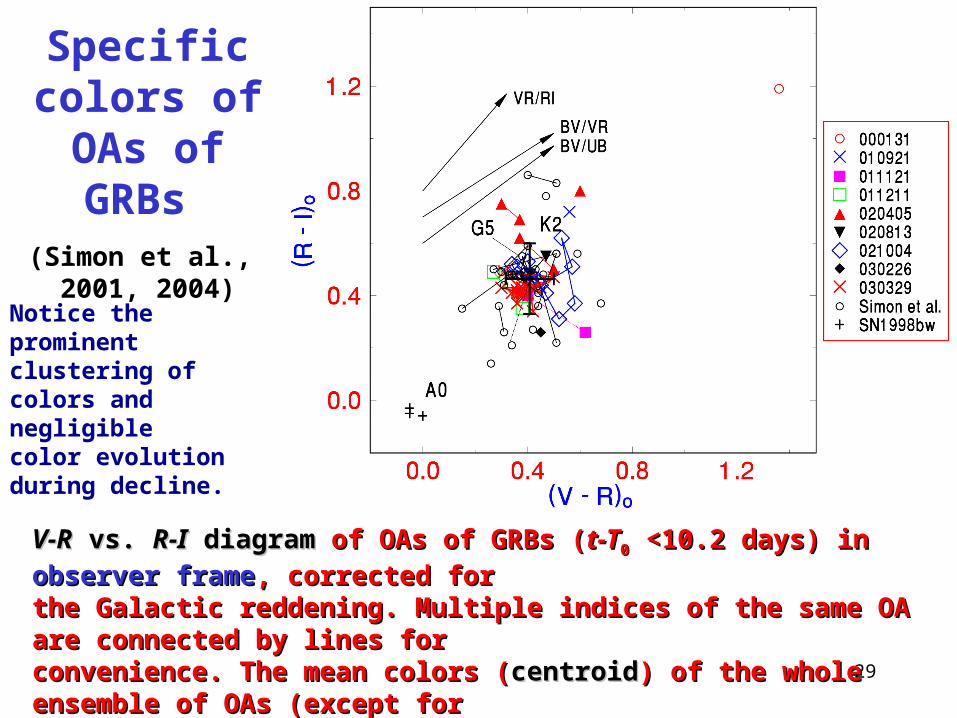
V-RV-R vs. vs. R-IR-I diagram diagram of of OAs OAs of GRBs of GRBs ((t-Tt-T00 <10.2 <10.2 daysdays) in ) in observer frameobserver frame,, corrected for corrected for tthehe Galactic reddening. Multiple indices of the same OA are connected by lines forGalactic reddening. Multiple indices of the same OA are connected by lines forconvenience. The mean colors (convenience. The mean colors (centroidcentroid) of the whole ensemble of OAs (except for) of the whole ensemble of OAs (except forGRB000131) are marked by the large cross. The colors of SN1998bw are shown GRB000131) are marked by the large cross. The colors of SN1998bw are shown onlyonly for for compcomparison. The representative reddening paths for arison. The representative reddening paths for EEB-VB-V=0.5=0.5 are also shown. are also shown.
Positions of the main-sequence stars are included Positions of the main-sequence stars are included only only for comparison.for comparison.
Specific colors of OAs
of GRBs (Simon et al., 2001,
2004)
Notice the prominent clustering of colors and negligible color evolution during decline.

Gaia CU7 Sub-workpackage
on Cataclysmic VariablesRené Hudec & Collaborators
Leuven, Nov 9-10, 2006

31
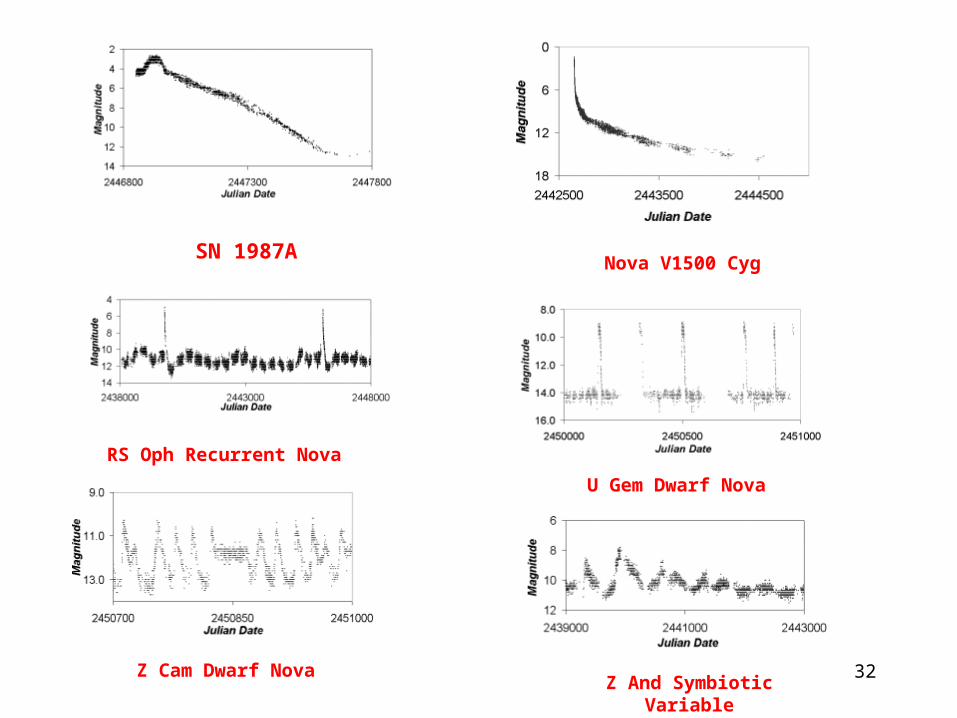
Cataclysmic Variables and Related Objects
The objective of the sub-work package:
• The investigations and analyses of Cataclysmic Variables and related objects (including supernovae, novae, recurrent novae, nova-like variables, dwarf novae, polars, intermediate polars, symbiotic stars) based on Gaia data (photometry and spectrophotometry) as well as complex analyses with additional data.
• Some of the CVs are candidates for VHE emission (SNe, AE Aqr, AM Her...)
32
SN 1987ANova V1500 Cyg
RS Oph Recurrent Nova
Z Cam Dwarf Nova
U Gem Dwarf Nova
Z And Symbiotic Variable
Gaia CU7 Sub-workpackage
on AGN
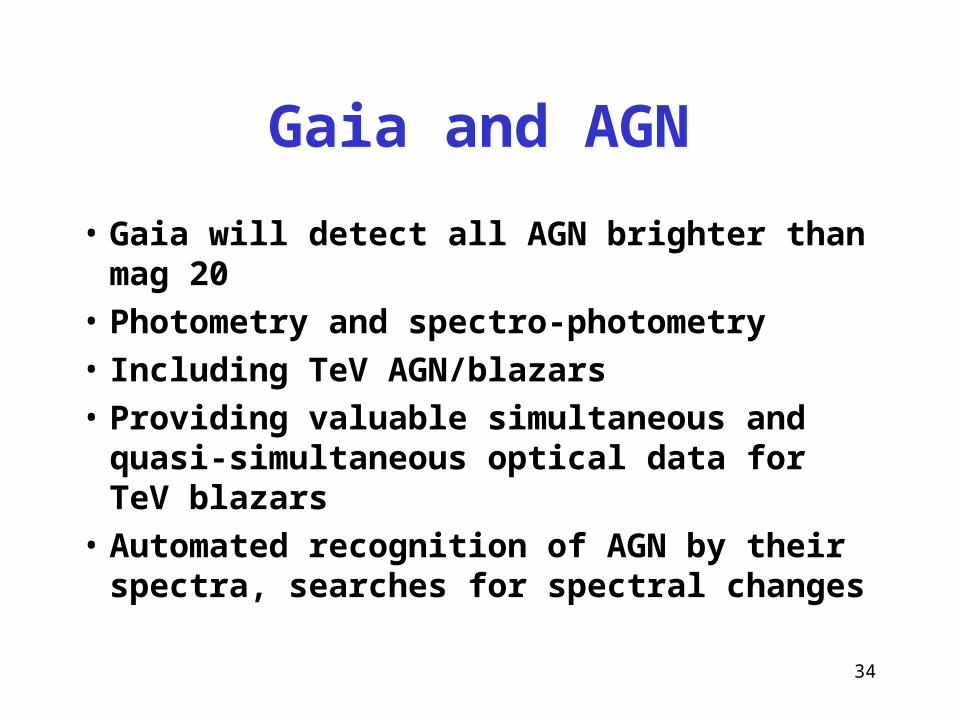
Gaia and AGN
• Gaia will detect all AGN brighter than mag 20
• Photometry and spectro-photometry
• Including TeV AGN/blazars
• Providing valuable simultaneous and quasi-simultaneous optical data for TeV blazars
• Automated recognition of AGN by their spectra, searches for spectral changes
34
35
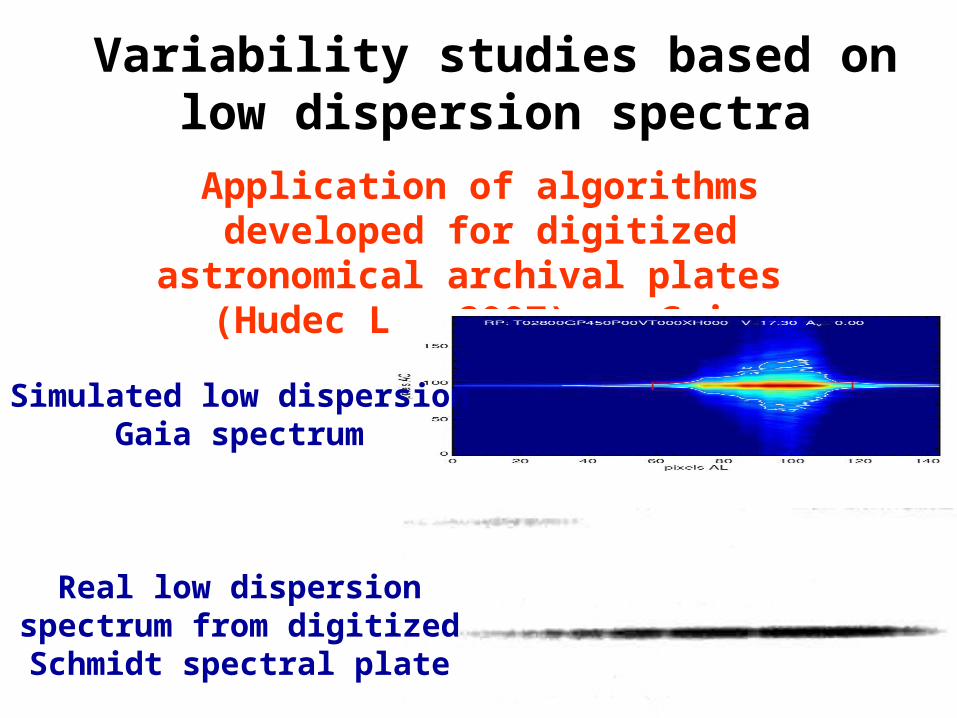
Variability studies based on low dispersion spectra
Application of algorithms developed for digitized astronomical archival plates
(Hudec L., 2007) on Gaia
Simulated low dispersion Gaia spectrum
Real low dispersion spectrum from digitized Schmidt spectral
plate

36
Relation of spectral and photometric variations
T. Jarzebowski, 1959
X Cam
Mira Variable
Spectral Variations M0 to M6.5
Amplitude 1.4 mag in R
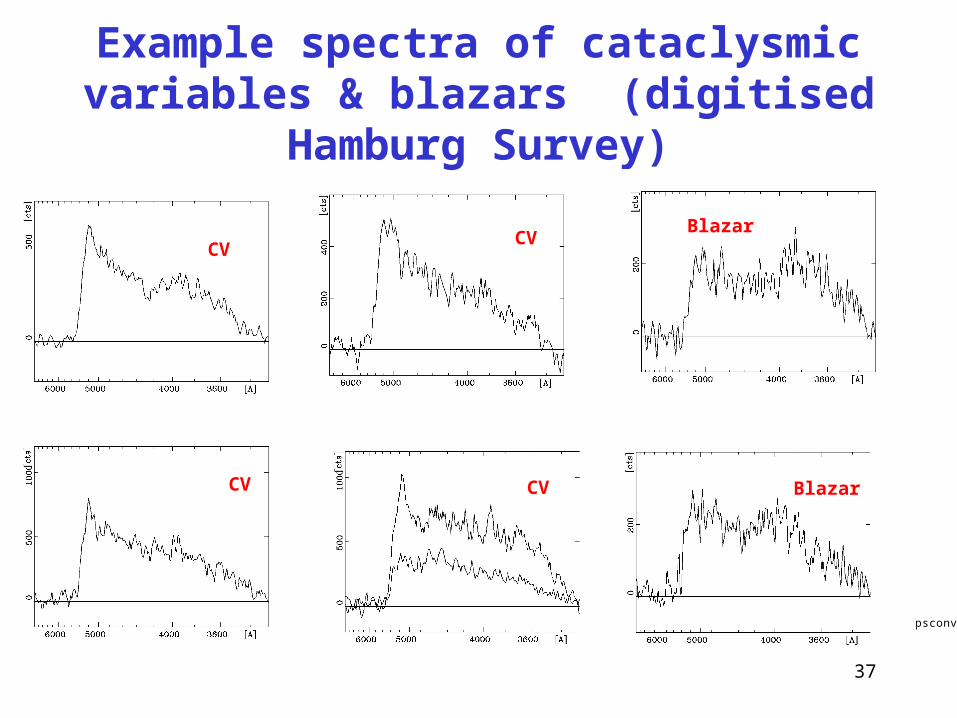
Example spectra of cataclysmic variables & blazars (digitised Hamburg Survey)
37
psconvert_setup.exe
CV
CV CV
CV
Blazar
Blazar
38
Novel algorithms for automated analyses of digitized spectral plates• Developed by informatics students• Automated classification of spectral
classes• Searches for spectral variability (both
continuum and lines)• Searches for objects with specific spectra• Correlation of spectral and light changes• Searches for transients
39
The Motivation
• The archival spectral plates taken with objective prisma offer the possibility to simulate the Gaia low dispersion spectra and related procedures such as searches for spectral variability and variability analyses based on spectro-photometry
• Focus on sets of spectral plates of the same sky region covering long time intervals with good sampling
40
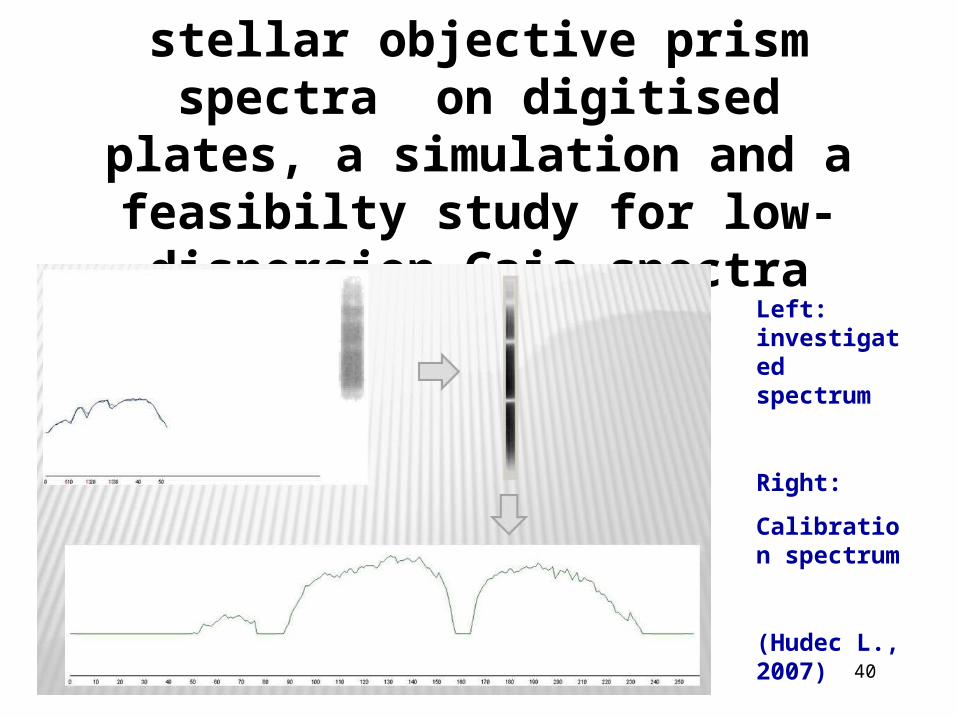
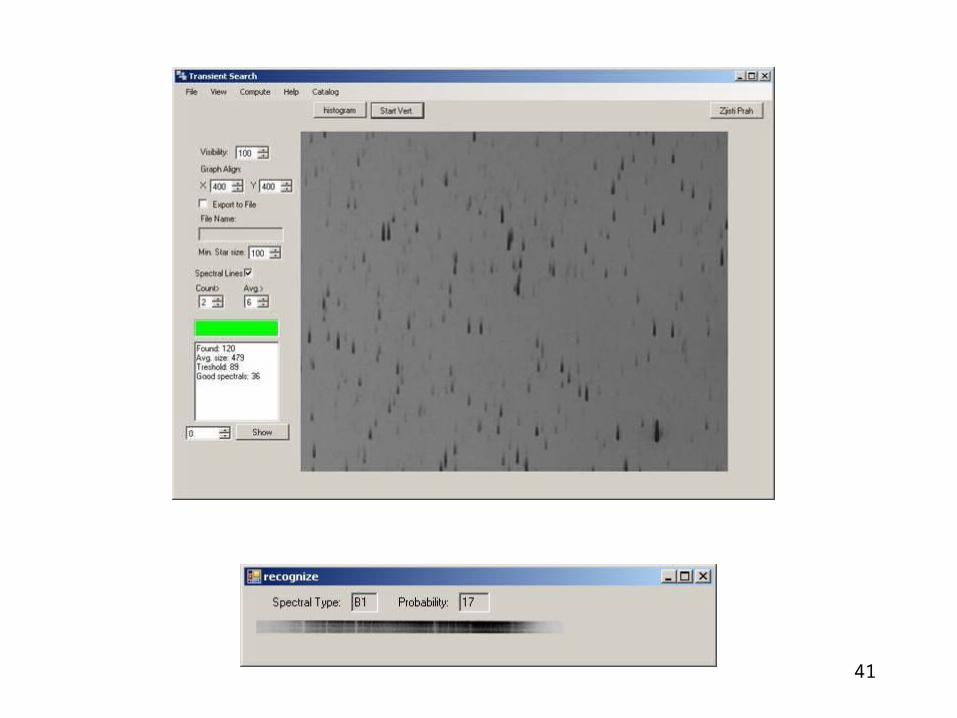
Automatic classification of stellar objective prism spectra on digitised plates, a simulation and a feasibilty
study for low-dispersion Gaia spectra
Left: investigated spectrum
Right:
Calibration spectrum
(Hudec L., 2007)
41

42
The End


