
ESTEC July 2000
Estimation of Aerosol Properties from CHRIS-PROBA Data
Jeff Settle
Environmental Systems Science Centre
University of Reading

ESTEC July 2000
The Importance of Aerosols
Atmospheric Correction of Images
Aerosols and Climate
Aerosols and Air Quality

ESTEC July 2000
The Need for Directional Measurements
Reflection properties of the surface depend on position of the sun, and the geometry of sensing.
Multi-temporal data can be properly evaluated only if they are normalised for these directional effects.
Albedo is determined accurately only by integrating incoming and outgoing flux over all directions.
Information on the structure of vegetation canopies may be retrievable by inversion of directional reflectance
Data driven atmospheric correction is possible

ESTEC July 2000
The Need for Atmospheric Correction
Ground and TOA NDVI valuesGround and TOA Reflectance
Values in Green Light
The main source of error in atmospheric correction is uncertain knowledge of aerosol loading

ESTEC July 2000
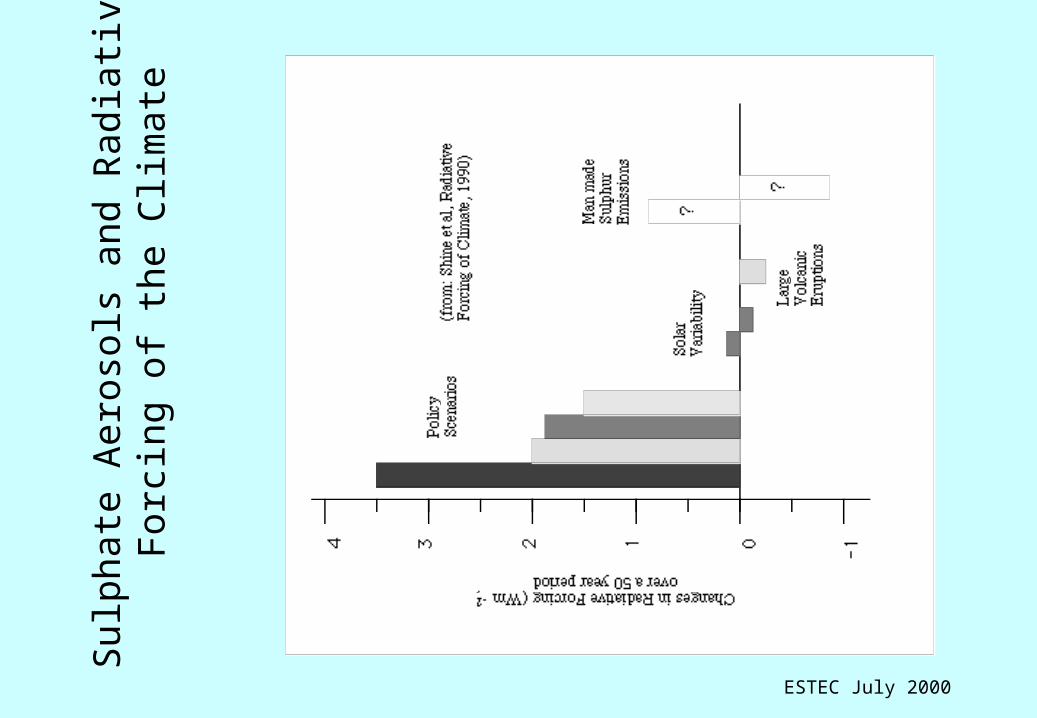
Aerosols and Climate
Aerosols have direct and indirect effects on atmospheric radiation
DirectThey scatter and absorb radiation
IndirectThey act as cloud condensation nuclei, and affect the
microphysical structure of the clouds formed
Interaction between aerosols and clouds a major source of uncertainty
ESTEC July 2000
Sul
phat
e A
eros
ols
and
Rad
iati
ve F
orci
ng o
f th
e C
lim
ate

ESTEC July 2000
Global Aerosol Data
Aerosols are highly variable in space and time: concentrations vary by a factor ~1000.
Global climatologies are model based, or extrapolations from a small number of observations.
Aerosol models exist, limited validation.
Observational network (Aeronet) highly skewed
“…tropospeheric aerosol loading is very poorly measured” (NASA 1993, Modeling the Earth System in the Mission to Planet Earth

ESTEC July 2000
Aeronet Network

ESTEC July 2000
Aeronet Sites, Quality Assured

ESTEC July 2000
Correction of ATSR2 Images
ATSR2 characteristics
1 km pixel size
2 view angles (0-20 and 50-55)
4 spectral channels (555, 655, 870, 1600 nm)
Correction approach based on premise that surface reflectance is of the form (shape function) x (spectral function)

ESTEC July 2000
Methodology
The essential method is inversion of a radiative transfer model for the TOA radiance field.
The inversion is constrained by requiring the surface reflectance field to follow a certain generic pattern. A simpler version has been used successfully on ATSR2 data (2 view directions, 4 wavelength channels). It is robust to the aerosol optical depth.
The method is described in North et al (1999) (IEEE Trans. Geoscience and Remote Sensing, 37(1) pp 526-537)

ESTEC July 2000
ATSR-2 Atmospheric Correction(With thanks to Peter North, ITE)
Before Correction After Correction
Green Channel Correction

ESTEC July 2000
ATSR-2 Atmospheric Correction(With thanks to Peter North, ITE)
Before Correction After Correction
NDVI Correction
ESTEC July 2000
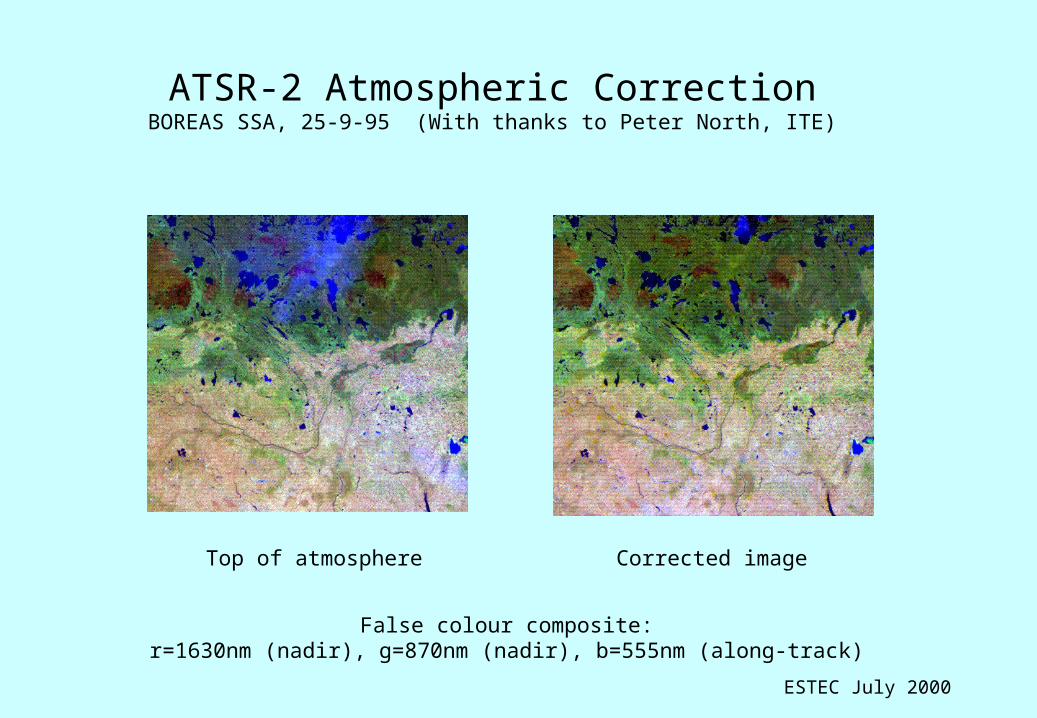
ATSR-2 Atmospheric CorrectionBOREAS SSA, 25-9-95 (With thanks to Peter North, ITE)
Top of atmosphere Corrected image
False colour composite:r=1630nm (nadir), g=870nm (nadir), b=555nm (along-track)

ESTEC July 2000
Validation of AATSR atmospheric correction(with thanks to Peter North, ITE)
Aerosol optical thickness Validation against sun photometer data

ESTEC July 2000
Sit
es to
be
Use
d in
th
is S
tudy
ESTEC July 2000
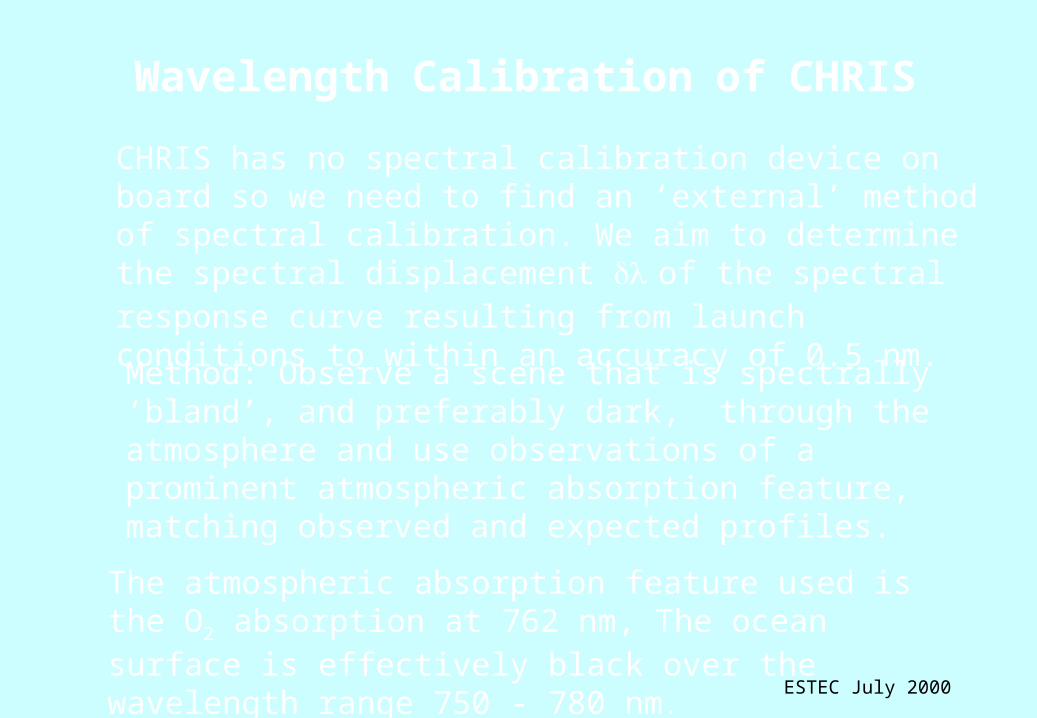
CHRIS has no spectral calibration device on board so we need to find an ‘external’ method of spectral calibration. We aim to determine the spectral displacement of the spectral response curve resulting from launch conditions to within an accuracy of 0.5 nm.
Method: Observe a scene that is spectrally ‘bland’, and preferably dark, through the atmosphere and use observations of a prominent atmospheric absorption feature, matching observed and expected profiles.
The atmospheric absorption feature used is the O2 absorption at 762 nm, The ocean surface is effectively black over the wavelength range 750 - 780 nm.
Wavelength Calibration of CHRIS

ESTEC July 2000
Within a spectral region encompassing just the O2 absorption, locate the detector ‘j’ recording the lowest observed signal and read the signals from adjacent detectors ‘j-2’,’j-1’ and ‘j+1’,’j+2’.
Compare the observed signals with those predicted using Radiative Transfer Theory and the known CHRIS Spectral Response Curves Ri() shifted by a range of possible between ±3.5 nm (See the figure).This is done for a typical range of atmospheric optical depths (i.e. visibilities) - the instrument signal is effectively independent of moisture and ozone content in this spectral range. The predicted signals constitute a Look-Up Table (LUT).
j j+1 j+2j-2 j-1
ObservedDetector
Signal
This dip is due to the O2
absorption
CCD detector cells about the minimumsignal cell ‘j’ - aligned in the spectral direction
Wavelength Calibration of CHRIS Data

ESTEC July 2000
Increasing tonmstep 0.5 nm
nm
Simulated detector signals for an increasing spectral shift at 2 different atmospheric visibilities
Increasing
nm
nm
nm
±NEdL
±NEdL
nm
nm
Visibility 26 km
Visibility 17 km
CCD detector index
Det
ecto
r R
adia
nce W
/cm
2 /sr
/nm
Solar zenith is 40 degreesView zenith is 45 degrees

ESTEC July 2000
The mean rms retrieval accuracy (over all wavelength shifts) of the was found to be better than 0.53 nm in the presence of detector noise. Worst case 1.3 nm (50km visibility).
We found that the method was robust to uncertainties in the (unknown) surface albedo and atmospheric optical depth.
Averaging the darkest pixels in a calibration image will reduce the uncertainty. The method will be extended to include the water vapour absorption profile at 900-1000
Results
ESTEC July 2000
10009008007006005004004000.0
1.0
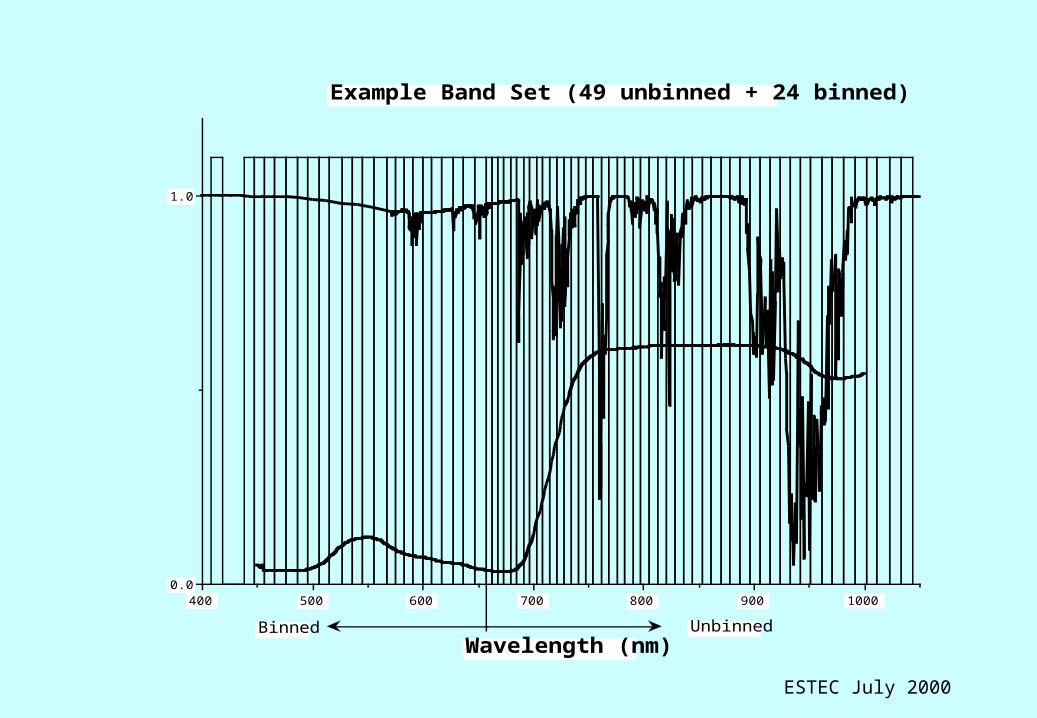
Example Band Set (49 unbinned + 24 binned)
Wavelength (nm)Binned Unbinned

ESTEC July 2000
1000900800700600500500
0.0
1.0
Wavelength (nm)
Bands at Full Spectral Resolution

ESTEC July 2000
1000900800700600500400400
0.0
1.0
Location of Bands for Over-Land Sites Full Swath, 25m Resolution (Barton)
Wavelength (nm)
The arrows indicate the locations of filters in the Cimel Sun Photometer

ESTEC July 2000
1000900800700600500400400
0.0
1.0
Locations of Bands over Land Aerosol Sites Half Swath, 25m Resolution
Wavelength (nm)

ESTEC July 2000
1000900800700600500400400
0.0
1.0
Band Locations over Aerosol Land Sites Full Swath, 50m Resolution
Wavelength (nm)

ESTEC July 2000
1000900800700600500400400
-2
0
Provisional Location of Bands over Marine Aerosol Sites Full Swath, 25m Resolution
MERIS Bands
Wavelength (nm)

ESTEC July 2000
1000900800700600500400400
0.0
0.2
0.4
0.6
0.8
1.0
1.2
Candidate Bandset over Water. Half Swath, 25m Resolution
Wavelength (nm)

ESTEC July 2000
1000900800700600500400400
0.0
1.0
Candidate Bandset over Water 50m Resolution, Full swath
Wavelength (nm)


