
Estimating surface soil moisture over Sahel
using ENVISAT radar altimetry
C. Fatras, F. Frappart*, E. Mougin, M. Grippa, P. Hiernaux
Université de Toulouse, OMP, GET (UMR 5563 CNRS-UPS-IRD)
14 avenue Edouard Belin 31400 Toulouse – France
*Corresponding author: Géosciences Environnement Toulouse (GET)
Observatoire Midi-Pyrénées
14 avenue Edouard Belin 31400 Toulouse, France
E-mail address: [email protected] (Christophe Fatras)
1
1
2
3
4
5
6
7
8
9
10
11
12
13
14
12

ABSTRACT
This paper analyses the potential of the radar altimeter onboard ENVISAT for
estimating surface soil moisture in the semi-arid Gourma region in Northern Mali. To this
end, the relationships between observed backscattering coefficients derived from 4 retracking
algorithms, namely Ocean, Ice-1, Ice-2 and Sea-Ice, and ground data, including soil type,
topography, vegetation and soil moisture are investigated. The considered period is 2002-
2010. Results show a strong linear relationship between the backscattering coefficients and
surface soil moisture measured at six different stations along the satellite track. The best
results are obtained with the Ice-1 and Ice-2 algorithms. In these cases, correlation
coefficients are higher than 0.8 with RMSE smaller than 2%. Vegetation effects are found to
be small due both to the nadir-looking configuration of the radar altimeter and to the low
vegetation cover. Finally, the relationship between soil moisture and normalized
backscattering coefficient is used to retrieve soil moisture from the altimeter data. These
estimates are then compared to soil moisture estimations obtained from the METeorological
Operational (METOP) Advanced SCATterometer (ASCAT). These results highlight the high
capabilities of Ku-band altimeters to provide an accurate estimation of surface soil moisture in
semiarid regions.
Keywords: surface soil moisture; radar altimetry; backscattering coefficient; Sahel
2
151617
18
19
20
21
22
23
24
25
26
27
28
29
30
31
32
33
3435
34
1. Introduction
In the Sahelian region of West-Africa, soil moisture drives many surface processes
including soil organic matter mineralization (e.g. Zech et al., 1997), vegetation productivity
(e.g. Hiernaux et al., 2009), land surface fluxes (e.g. Brümmer et al., 2008) and land surface-
atmosphere interactions (e.g. Taylor et al., 2010). Particularly, the Sahel is identified as one of
the regions of the world with the strongest feedbacks between soil moisture and precipitation
(Koster et al., 2004). Monitoring of the spatio-temporal variability of soil moisture is
therefore an important issue within the frame of the AMMA (African Monsoon
Multidisciplinary Analysis) project which aims at providing a better understanding of the
West African Monsoon and its physical, chemical and biological environments (Redelsperger
et al., 2006).
Active microwave remote sensing has demonstrated considerable capabilities in
estimating surface soil moisture (SSM), in semi-arid regions (e.g. Wagner and Scipal, 2000;
Mladenova et al., 2010). The potential of radar sensors for detecting changes in SSM results
from their high sensitivity to the variation of surface dielectric properties that are mainly
linked to changes in SSM. Moreover, in semi-arid regions, observations made at low
incidence angles are found to be strongly correlated to SSM because vegetation effects are
minimized (Tansey et al., 1999; Moran et al., 2000; Baup et al., 2007).
Initially designed to make accurate measurements of the sea surface topography,
satellite radar altimetry (RA) has been successfully employed to derive valuable information
for land hydrology by providing an estimation of water level variations of lakes (Birkett,
1995; Cazenave et al., 1997; Crétaux et al., 2009), rivers (Birkett, 1998; Birkett et al., 2002,
Frappart et al., 2006a) and floodplains (Frappart et al., 2005; 2006b; Santos da Silva et al.,
2010). The magnitude of RA backscattering coefficients σ0 provided by the
TOPEX/POSEIDON altimeter mission at Ku- and C- bands, and by the European
3
36
37
38
39
40
41
42
43
44
45
46
47
48
49
50
51
52
53
54
55
56
57
58
59
60
56
ENVIronmental SATellite (ENVISAT), at Ku and S bands, is related to the dynamics of
surface properties (e.g. Papa et al., 2003; Legrésy et al., 2005). Particularly, spatial and
temporal variations of RA backscattering coefficients are found to be related to soil roughness
and surface soil moisture (SSM) changes in the Sahara and Australian deserts (Cudlip et al.,
1994; Ridley et al., 1996). Moreover, a semi-empirical model was recently proposed to
estimate SSM using RA backscattering coefficients over semi-arid surfaces (Bramer et al.,
2010). Comparisons were made with soil moisture outputs from a hydrological model
showing a link between modeled and altimetry derived soil moisture. Radar altimeters are a
priori suitable to SSM retrieval since attenuation by the vegetation layer is minimized by their
nadir-looking configuration. This is particularly true in semi-arid regions where vegetation
cover is sparse. However, their potentials for SSM retrieval have not been demonstrated yet.
The objective of the present study is to investigate whether the backscattering coefficient
delivered by radar altimetry can be used to provide an accurate estimation of surface soil
moisture over semi-arid areas. To this end, the data acquired by the ENVISAT RA-2 over
Northern Sahel in Mali are analyzed over the 2002-2010 period and relationships are
investigated between observed backscattering coefficients and ground data including soil
type, topography, vegetation and soil moisture acquired at six different stations along the
satellite track. For the sandy soils sites, a linear relationship is derived between the altimetry
backscatter and the in situ SSM. Finally, this relationship is used to retrieve soil moisture
from the altimeter data and the resulting soil moisture estimate is compared to the estimate
obtained from the METeorological Operational (METOP) Advanced SCATterometer
(ASCAT).
2. Study area and data
2.1. The study site
4
61
62
63
64
65
66
67
68
69
70
71
72
73
74
75
76
77
78
79
80
81
82
83
84
85
78
The African Monsoon Multi-disciplinary Analysis – Couplage de l’Atmosphère
Tropicale et du Cycle Hydrologique (AMMA-CATCH) meso-scale site is located in the
Gourma region (1°W-2°W, 14.5°N-17.5°N) in Mali (Fig. 1), and stretches from the loop of
the Niger River southward down to the country border with Burkina-Faso (Mougin et al.,
2009). This site is entirely located within the Sahel bioclimatic zone and is bracketed by the
150 and 500 mm annual isohyets. The rain distribution is strictly mono-modal with rainfall
starting in June and ending in September with a maximum in August (Frappart et al., 2009).
During the wet season, rangeland vegetation is composed of a low herbaceous layer
dominated by annuals and a sparse woody plant population (canopy cover <5%). Annual
herbs germinate with the first significant rains, in June or July, and unless the plants wilt
before maturity owing to a lack of rainfall, the senescence coincides approximately with the
end of the rainy season. This short rainy season is followed by a long dry season during which
there is no green vegetation except for rare perennial herbaceous and the foliage of some of
scattered trees and shrubs.
The Gourma region is a vast peneplain at between 250 and 330 m altitude with highest
isolated sandstone buttes reaching 900-1100 m close to the town of Hombori. The eroded and
exposed rock-surfaces (23% of the whole area) are locally capped by iron pan but larger areas
of the region (58%) are covered by deep and fixed sand. At meso-scale, predominantly sandy
or shallow soils distribute in large alternant swaths of contrasted land cover (Fig. 1). Besides
these two major landforms, remnants of alluvial systems and lacustrine depressions form a
web of narrow valleys often slotted in between sandy and shallow soils.
The overall observation strategy of the AMMA-CATCH site is based on the
deployment of a variety of instrument networks, from local- to meso-scales, dedicated to the
monitoring and documentation of the major variables characterizing the climate and the
spatio-temporal variability of geophysical and land surface variables. Long term
5
86
87
88
89
90
91
92
93
94
95
96
97
98
99
100
101
102
103
104
105
106
107
108
109
110
910
measurements monitor meteorological variables, vegetation and surface hydrology including
soil moisture.
2.2 Surface soil moisture measurements
Six automatic soil moisture stations are located at the vicinity of the ENVISAT’s path
#302 (Fig. 1). These stations are part of the soil moisture network set up from 2005 within the
frame of the AMMA project (de Rosnay et al., 2009). Characteristics (name, location, date of
installation, soil type, sensor depth) of the 6 soil moisture stations are given in Table 1. The
same installation protocol is used for all the soil moisture stations equipped by Time Domain
Reflectometry sensors (Campbell Scientific CS616) that provide measurements at 15 min
time step, except for the the Eguerit erosion surface site where delta-T sensors have been
installed. Sensors are calibrated by using in situ gravimetric measurements and estimation of
soil bulk density. Only surface measurements recorded at 5, 10, 30 and 40 cm depth are
considered here in agreement to the microwave soil penetration depth (Ulaby et al., 1981). In
the following, Surface Soil Moisture (SSM) data are expressed in volumetric water content
(m3 m-3). Local SSM data typically range between 0.05% (dry season) and 28% (wet season)
for the sandy soils.
2.3 ENVISAT RA-2 backscattering coefficients
In the framework of its Earth observation programme, the European Space Agency
(ESA) launched the ENVIronmental SATellite (ENVISAT) satellite on February 2002.
ENVISAT carries 10 scientific instruments which provide atmosphere, ocean, land, and ice
measurements, including a nadir-pointing radar altimeter (RA-2 or Advanced Radar
Altimeter) (Wehr & Attema, 2001). ENVISAT flies in a sun-synchronous polar orbit at an
6
111
112
113
114
115
116
117
118
119
120
121
122
123
124
125
126
127
128
129
130
131
132
133
134
135
1112
altitude of about 800 km, with a 35-day repeat cycle and an inclination of 98.6°, providing
observations of the Earth surface (ocean and land) from 81.5° latitude North to 81.5° latitude
South, with a ground-track spacing of around 80 km at the Equator. RA-2 is a nadir-looking
pulse-limited radar altimeter operating at two frequencies at Ku- (13.575 GHz / 2.3 cm of
wavelength) and S- (3.2 GHz / 9.3 cm) bands (Zelli, 1999). Its main characteristics are
summarized in Table 2. The diameter of the pulse-limited footprint are respectively 3.4km in
Ku and 4.8km in S bands (ESA, 2002). However, the surface footprint size is uncertain and its
nominal diameter varies approximately between 2km and 10km for Ku band (Chelton et al.,
2001; Peacock & Laxon, 2004). These variations are caused by the topography and the
inhomogeneities of the surface. Over flat surfaces, an approximate radius of 2 km is generally
considered as a good approximation for Ku band (Chelton et al., 2001). Over land, the
presence of open water in the footprint produces strong specular reflections that can be off-
nadir. The returned signal can be dominated by these off-nadir reflections causing tracking
errors (altimeter mispointing) even if they are off-nadir by several (1-10) km for Ku band, and
beyond for S band due to a larger beam width. Processing of radar echoes or altimeter
waveforms is performed on the ground to obtain range values, i.e. the distance between the
satellite and the surface estimated from the round-trip time of the electromagnetic pulse, and
backscattering coefficients σ0 derived from the power of the altimeter return pulse. The
Geophysical Data Records (GDRs) distributed by ESA (ESA, 2002) include accurate satellite
positions (longitude, latitude and altitude of the satellite on its orbit) and timing, altimeter
ranges, instrumental, propagation and geophysical corrections applied to the range, and
several other parameters such as the backscattering coefficients. For the ENVISAT mission,
four different retracking algorithms are operationally applied to RA-2 raw-data to provide
range estimates and backscattering coefficients. Each retracking algorithm namely Ocean
(Brown, 1977; Hayne, 1980), Ice-1 (Wingham et al., 1986; Bamber, 1994), Ice-2 (Legrésy,
7
136
137
138
139
140
141
142
143
144
145
146
147
148
149
150
151
152
153
154
155
156
157
158
159
160
1314

1995; Legrésy and Rémy, 1997) and Sea-Ice (Laxon, 1994) has been developed for a specific
type of surface but none of them has been specifically designed for processing altimeter
echoes over land. The backscattering coefficient is directly related to the integral against time
of the radar echo or waveform. Ocean and Ice-2 algorithms are based on the fit of a
theoretical waveform shape corresponding to sea and ice cap surfaces to estimate precisely the
position of the leading front of the waveform. The value of the backscattering coefficient is
determined by integration of the theoretical waveform. For Ice-1 and Sea Ice these parameters
are estimated empirically using thresholds on the amplitude of the waveform. The errors on
the estimated σ0 (instrument noise, orbit variations, atmosphere interferences) are expected to
be lower than 0.29 dB in Ku band and 0.37 dB in S band (Pierdicca et al., 2006).
The variables used in this study, include the satellite positions, times of acquisition,
the 1 Hz Ocean-retracked (Ku and S bands), the 18 Hz Ice-1, Ice-2 (Ku and S bands), and the
18 Hz Sea Ice (Ku band) backscattering coefficients measured at 23.8 and 36.5 GHz
contained in the ENVISAT RA-2 GDRs made available by the Centre de Topographie des
Océans et de l’Hydrosphère (CTOH - http://ctoh.legos.obs-mip.fr/) for the ground track #302
over the AMMA mesoscale site in Gourma (see Fig.1). The considered period is September
2002 – October 2010 (8 years). However, S-band data are only available until January 2008
(5.4 years).
2.4 ASCAT SSM products
The METeorological Operational (METOP) Advanced SCATterometer (ASCAT) is
the enhanced successor of the scatterometers flown on the European Remote Sensing (ERS-1
and ERS-2) satellites. ASCAT operates at C-band (5.255 GHz) with VV polarization. Two
triplets of spatially averaged backscattering coefficient values at a spatial resolution of around
30 and 50 km for each location along the swath are derived from continuous observations
8
161
162
163
164
165
166
167
168
169
170
171
172
173
174
175
176
177
178
179
180
181
182
183
184
185
1516

performed by three radar antenna beams at three different azimuth angles (45°, 90°, and 135°
sideward from the direction of the satellite motion) on both side of the METOP satellite
(Naeimi et al., 2009). Technical information concerning ASCAT measurements are presented
in Table 3. SSM products based on these observations are then generated using the SSM
retrieving algorithm developed by Wagner (1998) from ERS data. The backscattering
coefficients are first normalized to a standard incidence of 40°, and then inverted into SSM
assuming a linear relationship between these two quantities. In this study, we use the
interpolated SSM products given at a resolution of 30 km following a nodal grid of 12.5 km,
which correspond to the closest time to the altimetry measurements (with a variation from a
few minutes to 18h), for the period June 2007 - October 2010.
3. Spatio-temporal variations of RA-2 backscattering coefficients
Along-track profiles (Fig. 2) of σ0 in Ku- and S- bands are averaged at each satellite
pass at a spatial resolution of 0.008° (~1km) for the rainy (JJAS) and the core of the dry
(JFMA) seasons for Ocean, Ice-1, Ice-2, and Sea Ice retracking algorithms over the
ENVISAT RA-2 groundtrack #302 between latitudes 14.5° and 16.25°. This spatial resolution
is chosen as it captures the spatial heterogeneity of the surface (Mougin et al., 2009) and of
the local soil moisture condition (Baup et al., 2007; de Rosnay et al., 2009). It corresponds to
three different 18 Hz measurements which footprint centers are separated by 370 m for Ice-1,
Ice-2, and Sea Ice σ0, and one 1 Hz measurements (corresponding to a distance of 7.5 km) for
Ocean σ0.
In the followings, only the results obtained with the Ice-1 retracking algorithm are
displayed. Results using the three other retracking algorithms are cited and discussed in the
text.
9
186
187
188
189
190
191
192
193
194
195
196
197
198
199
200
201
202
203
204
205
206
207
208
209
1718

3.1 Backscattering coefficient seasonal variations along the latitudinal transect
The extrema values reached per grid cell over the whole observation periods by σ0 for
Ku-band (8years) and S-band (5.4years) are identified for the Ice-1 processing during the wet
seasons (June to September) and the core of the dry season (January to April). Similar profiles
are obtained for Ku and S bands with a lower dynamics for the S band in general, especially
over sandy areas. The spatial σ0 dynamics during the dry season is slightly larger for S-band
than for Ku-band. On the contrary, the spatial dynamics during the wet season is lower for S-
band than for Ku-band. This can be due both to the larger footprint of S band that
encompasses surfaces of different types (i.e., mix between rocky, sandy and clay soils, or
presence of permanent ponds far from nadir that have a signature in S but not in Ku bands)
and to a lower sensitivity of the S band (wavelength of 9 cm) to changes in surface roughness.
Lower values of backscattering coefficients are generally observed over sandy surfaces (fixed
dunes) whereas higher values are found over rocky surfaces (erosion surfaces) and surfaces
containing temporary open water (ponds and wadi). The higher surface roughness of the
sandy surfaces could account for a smaller backscattering response in the nadir direction. The
yearly amplitude of the backscattered signal exhibits large variations along the latitudinal
transect, from 10 to 30 dB for Ku-band and from 10 to 20dB for S-band over sandy surfaces,
from 15 to 30 dB for Ku-band and from 15 to 20dB for S-band over erosion rocky surfaces,
and reaches 45 dB over water bodies for both bands, as illustrated by the response of the Ekia
wadi (16.05° N).
Similar along-track profiles are obtained with the other retracking algorithms.
However the profiles established with Ocean are smoother as only 1 Hz data are available
with this processing.
10
210
211
212
213
214
215
216
217
218
219
220
221
222
223
224
225
226
227
228
229
230
231
232
233
1920
3.2 Spatio-temporal variations along the latitudinal transect
The latitudinal variations of the backscattering coefficient from the track #302 are
plotted as a function of time over the 2002-2010 period for Ku-band (Fig. 3a) and over the
2002-2007 period for S-band (Fig. 3b). They both exhibit a well-marked seasonality with
higher values of 0 during the rainy season, particularly at latitudes above 15.4°N where
rocky soil types and ponds are more important. However, for the same type of surface, the
values are generally higher in the South than in the North in agreement with the rainfall
gradient (Frappart et al., 2009). During the wet season, three zones in the North (around
15.75°, 16.1° and 16.2° of latitude) present very strong backscattering coefficients at both
frequencies. They correspond to the temporarily open waters of Ouart Fotou valley, Ekia wadi
and Karouassa valley. High 0 values are observed over wide portions of the latitudinal
transect for several annual cycles. They can be related to rainfall events affecting the whole or
large parts of the Gourma region as for example the strong rainfalls that occurred on August
11th, 2006 simultaneously with ENVISAT cycle 50 and the rainfall on June 26 th, 2009 a few
hours before ENVISAT cycle 80.
Figure 3
Besides, locally harsh topography affects data availability. The retracking algorithms based on
modeling of the surface response (Ice-2 and Ocean) are unable to provide valid data over the
erosion surface at 15.15° of latitude, and at the vicinity of the Hombori mounts (15.3° of
latitude). This is likely due to the inability to fit the parameters of theoretical waveforms on
the observed ones whereas the empirical retracking processes (centre of gravity for Ice-1 and
maximum for Sea Ice of the waveform) are more robust.
11
234
235
236
237
238
239
240
241
242
243
244
245
246
247
248
249
250
251
252
253
254
255
256
257
2122
4. Surface soil moisture estimation
4.1 Relationship between backscattering coefficient and SSM
In this section, the time variation of RA backscattering coefficients at the vicinity of
the 6 in situ soil moisture stations (Ekia, Eguerit, Bangui Mallam, Agoufou, Kyrnia and
Kobou) are analyzed and compared to the temporal variation of SSM measured in situ.
Two methods are used to build time series of backscattering coefficients at the vicinity
of a ground soil moisture station. The first approach is based on the definition of a rectangular
window of a few kilometers width around the nominal altimeter track corresponding to an
area homogeneous in soil texture and topography. To obtain the backscattering coefficients
time series, all the measurements that fall within this window are averaged for each cycle.
This method is similar to the one used to derive water levels of rivers and lakes from radar
altimetry data (e.g. Frappart et al., 2006a). The second approach consists in selecting the
backscattering coefficient data the closest from the soil moisture site. However, at Ekia site
(see Fig.1 and Table 1), the selected data are the closest from a location 7 km to the South-
west of the site instead, in order to minimize the effect of the presence of a temporary pond
northward of the soil moisture site. The results presented below are obtained using the second
approach that provides better results (i.e. higher correlation and lower RMSE).
The backscattering coefficients for Ku- and S- bands display a strong seasonality.
Maxima of σ0 are observed during the peak of the rainy season in close relation with SSM
content measured at 5 and 10 cm depths, as illustrated for the Agoufou site for the Ice-1
algorithm (Fig. 4).
Figure 4
12
258
259
260
261
262
263
264
265
266
267
268
269
270
271
272
273
274
275
276
277
278
279
2324
Rainfall events (not shown in Fig. 4) trigger an increase of SSM and as a consequence,
an increase of the backscattering coefficient. The stronger the rainfall, the larger the response
of the surface is. The variations of σ0 during the dry season (< 2 dB in Ku band and < 3 dB in
S band) can be related to instrumental noise and changes in the sampled surface caused by
variations around the nominal track of the satellite. The variations over time of Ku-band σ0
calculated with the Ice-1 retracking algorithm are compared to the variations of SSM
measured at 5cm depth for the different SSM sites. The yearly amplitudes of Ku-band σ0 i.e.
the difference in dB between the highest and lowest observed backscattering values vary from
4 to 20 dB, the highest values corresponding to the wettest years when in situ SSM is
maximum. Although the seasonal σ0 variations exhibit similar amplitudes across different
sites, backscattering absolute values differ from one site to another. This may be caused by
the heterogeneity of landscapes, the dispersion of radar measurements along the satellite
track, and the presence of surface water. Higher correlations (by at least 0.15) between σ0 and
SSM are found when the closest σ0 data to the soil moisture sites are selected rather than when
several measurements are averaged over a given window. Correlation coefficients (r) and
RMSE obtained by linear regression between both bands backscattering coefficients and SSM
are presented in Table 4 for S-band and Table 5 for Ku-band. If the sites with a small number
of observations (Eguerit and Kyrnia at S-band) are excluded, both frequencies show similar
results with higher correlation found for Agoufou (at 5 and 10 cm) at Ku-band and Ekia (at 10
and 30 cm) at S-band. Since the period of observations is longer at Ku-band (~8 years) than at
S-band (~5 years), in the following, analysis are performed only with the measurements
acquired at Ku band.
Figure 5
A very good agreement is found for the sites presenting homogeneous surface
conditions within the altimeter footprint. For instance, the Agoufou and Bangui Mallam sites
13
280
281
282
283
284
285
286
287
288
289
290
291
292
293
294
295
296
297
298
299
300
301
302
303
304
2526

are located in large fixed sandy dunes with low and gentle elevation changes (a few meters).
The closer to the ENVISAT track the measurements site, the better the correlation is.
Correlation coefficients of 0.95 and 0.86 and RMSE of 1.98% and 1.74% are obtained
between 5cm depth SSM and Ice-1 estimated σ0 for short distances of 2 – 3 km (Eguerit and
Agoufou) whereas correlation coefficients (RMSE) range from 0.7 to 0.52 (3.61% to 5.84%)
for distances larger than 5.5 km (Bangui Mallam, Ekia and Kobou). The poor results obtained
at the Kyrnia site located at only 3 km from the altimeter swath are likely due to the presence
of a temporary pond close to the site. Overall, the results are quite similar for SSM measured
at 5 and 10 cm depth, as a mark of the soil moisture homogeneity close to soil surface. Similar
results are found with Ice-2 and Sea Ice based σ0. Overall, lower performances are obtained
for Ocean processed data as no high frequency data (18 Hz) are available.
Figure 6
Scatterplots of backscattering coefficients as a function of measured SSM (Fig. 6)
sometime display very high values of σ0 (> 30 dB) that do not correspond to high SSM
measured in situ (see for example Figs 6e-6f). These off layers can be related to strong rainfall
events that took place a couple of hours before the altimeter overpass (e.g. on June 26 th, 2009)
generating temporary puddles that enhanced the radar signal. In the case of Bangui Mallam, in
situ soil moisture measurements are not available after mid-July 2008 at 5cm depth.
4.2 Effect of seasonal dynamics of vegetation on SSM estimation
To determine whether the presence of vegetation affects the SSM – σ0 relationships the
variation of Ice-1 estimated σ0 is plotted against the measured Leaf Area Index (LAI) during
the 2005 - 2010 growing seasons for the Agoufou site. Methodology of LAI in situ
measurements are detailed in Mougin et al. (2012). The maximum corresponding herbaceous
vegetation cover at the Agoufou site is about 50%.
14
305
306
307
308
309
310
311
312
313
314
315
316
317
318
319
320
321
322
323
324
325
326
327
328
329
2728
Figure 7
For LAI>0.2, the backscattering coefficient decreases (< 2 dB) as the LAI increases with a
correlation coefficient of -0.6 suggesting a weak attenuation of the radar wave by the
vegetation layer. The impact of vegetation remains anyway small because (i) the radar
altimeter is a nadir-looking instrument which means that the electromagnetic field crosses less
vegetation (smaller canopy optical thickness) than side-looking radars (SAR or scatterometer)
that observe the surface at angles greater than 10°, (ii) the Sahelian vegetation cover remains
low even at the peak of the wet season (except in seasonally flooded forests that are not
considered here).
For low LAI (LAI< 0.2) the observed increase of the backscattering coefficient with LAI
could be attributed to an enhancement of the scattering by the vegetation layer as already
observed on crops by Ulaby et al. (1984).
4.3 Linear regression and SSM estimation
Based on the experimental relationships displayed in Fig. 6, a general linear regression
is established between normalized σ0 and SSM for the sandy soils dominant across the
Gourma mesoscale window (58 % of the whole surface). Coefficients of the linear regression
between normalized backscattering coefficients and in situ SSM measurements for the three
sandy sites (Agoufou, Bangui Mallam and Ekia,) are determined and averaged (Fig. 8).
Following the methodology proposed by Wagner and Scipal (2000) and Zribi et al. (2007),
the normalized backscattering coefficients is calculated as the difference between the actual
backscattering value and the mean backscattering value estimated over the core of the dry
season (January to April) for each site. Indeed, the normalized backscattering coefficients
reflect the radar dynamics of the different surface types.
15
330
331
332
333
334
335
336
337
338
339
340
341
342
343
344
345
346
347
348
349
350
351
352
353
2930

Finally, altimeter-derived SSM time series are estimated by inverting the general
linear relationship between backscattered and SSM established on sandy soils, for both 5cm
and 10cm depths.
Figure 8
Comparisons between in situ and altimetry-derived SSM are analyzed for the sandy sites
using the four retracking algorithms. Results of these comparisons (RMSE and correlation
coefficients) are summarized in Table 6 and an example of time series of altimetry-derived
SSM is given for the Agoufou site (Fig. 9). The error introduced by the inverse function in the
SSM derived from σ 0 is 0.4% SSM obtained as the ratio between the error on σ 0 (maximum
value of 0.3 dB according to Pierdicca et al., 2006) and the slope of the mean linear
regression.
Figure 9
4.4 Comparisons with ASCAT-derived SSM estimates
To compare the ASCAT derived SSM products at a resolution of 35 km to the
ENVISAT RA-2 derived estimates, correlation coefficients have been calculated. For each
product, the reference point is the location of the in-situ measurement site. Hence the
ASCAT-derived SSM chosen for each study site is the one of the pixel containing the
reference point. Outliers in the ASCAT-derived SSM are filtered out using a threshold of 30%
of SSM. All the values of ENVISAT RA-2 derived SSM that fall within the ASCAT pixel
corresponding to the site (see 4.1) are averaged. Consequently, at a given time, between 80
and 100 backscattering coefficients are taken into account. The acceptable time offset
between ASCAT measurements and ENVISAT RA-2 data has been limited to 18hours.
Comparisons between altimetry derived SSM (for both 5cm and 10cm inverse
functions) and ASCAT SSM products are performed for the measurements sites of Agoufou,
16
354
355
356
357
358
359
360
361
362
363
364
365
366
367
368
369
370
371
372
373
374
375
376
377
3132

Bangui Mallam, and Ekia. For the Agoufou site the time series are established from May 2007
to October 2010 (Fig.10), the common period of availability of the ASCAT and ENVISAT
data. The altimetry-derived SSM averaged over the ASCAT pixel exhibit similar temporal
variations in phase with ASCAT-based SSM but with large difference of amplitudes reaching
up to 12% m3m-3 of SSM. The correlation coefficients and RMSE calculated between the four
different altimetry-based and ASCAT-derived SSM for the three selected sites (Table 7)
exhibit large variations from one region to another with correlations around 0.5 for Agoufou,
0.4-0.5 for Ekia and only 0.3-0.4 for Bangui Mallam, and RMSE lower than 5% except at
Ekia. These discrepancies can be accounted for the widely different scales observed by each
sensor. ASCAT-based estimates are representative of larger areas (~1,200km²) than
ENVISAT-derived SSM (~ 250km²) using the ENVISAT integration over the ASCAT pixel.
Figure 10
5. Conclusion
This study has shown that backscattering coefficients at Ku- obtained from ENVISAT
RA-2 data can be related to the temporal variation of moisture content in the upper soil
profile. In situ SSM measurements and backscattering coefficients have been found generally
well correlated, even if the quality of the relationships highly depends on i) the distance
between the measurement site and the altimeter track, ii) the presence of open water in the
altimeter footprint, iii) the topography of the site and the retracking algorithm. The best
results are obtained for backscattering coefficients processed with Ice-1, Ice-2, and Sea-Ice
algorithms compared to the Ocean retracking algorithm as no 20 Hz measurements are
available with the latter one. A linear relationship between radar altimetry backscattering
coefficients and SSM is established for the dominant sandy sites, similar to the ones
17
378
379
380
381
382
383
384
385
386
387
388
389
390
391
392
393
394
395
396
397
398
399
400
401
3334

previously found using ENVISAT-ASAR data over the same study area (see Baup et al.,
2007; 2011). Only a small attenuation by the vegetation cover is found allowing SSM to be
accurately estimated from radar altimetry data without any correction. To our knowledge, this
is the first demonstration of the potentialities of radar altimetry to derive surface soil moisture
in a semi-arid environment.
Comparisons of altimetry derived SSM with low spatial resolution SSM products
obtained from ASCAT scatterometer data show reasonable correlation between the two
satellite-derived estimates. Radar altimetry-based SSM products offer new and
complementary information to relate the local (in situ) to the regional (~25 km) scales, and
demonstrate a strong potential to evaluate low resolution satellite SSM products to be used in
a down-scaling approach.
Improvements of altimetry derived SSM are expected from the use of higher spatial
resolution altimetry data such as those that will be provided by the French-Indian AltiKa radar
altimetry mission to be launched in August 2012.
Acknowledgements
This work was performed within the framework of the AMMA project. Based on a French
initiative, AMMA has been constructed by an international group and is currently funded by
large number of agencies, especially from France, the UK, the US and Africa. It has been the
beneficiary of a major financial contribution from the European Community’s Sixth
Framework Research Programme. Detailed information on the scientific coordination and
funding is available on the AMMA international web site (https://www.amma-eu.org/). This
work was funded by the Programme National en Télédétection Spatiale (PNTS) in the
18
402
403
404
405
406
407
408
409
410
411
412
413
414
415
416
417
418
419
420
421
422
423
424
425
3536

framework of the project “Potentialités des altimètres radars spatiaux pour l’hydrologie en
zone sahélienne. Perspectives pour la mission SWOT".
The authors thank the Centre de Topographie des Océans et de l'Hydrosphère (CTOH) at
Laboratoire d'Etudes en Géophysique et Océanographie Spatiales (LEGOS), Observatoire
Midi-Pyrénées (OMP), Toulouse, France for providing the ENVISAT RA-2 GDR dataset
used in the present study.
19
426
427
428
429
430
431
432
3738
References
Bamber, J. L. (1994). Ice sheet altimeter processing scheme. International Journal of Remote
Sensing, 15(4), 925–938.
Baup F., Mougin E., de Rosnay P., Timouk F., Chênerie I. (2007). Surface soil moisture
estimation over the AMMA Sahelian site in Mali using ENVISAT/ASAR data.
Remote Sensing of Environment, 109(4), 473–481.
Baup F., Mougin E., de Rosnay P., Hiernaux P., Frappart F., Frison P.L., Zribi M., Viarre J.
(2011). Mapping surface soil moisture over the Gourma mesoscale site (Mali) by
using ENVISAT-ASAR data. Hydrology and Earth System Sciences, 15, 603-616.
Birkett, C. M. (1995). The contribution of TOPEX/POSEIDON to the global monitoring of
climatically sensitive lakes. Journal of Geophysical Research, 100(C12), 25,179–
25,204.
Birkett, C. M. (1998). Contribution of the TOPEX NASA radar altimeter to the global
monitoring of large rivers and wetlands. Water Resources Research, 34(5), 1223–
1239.
Birkett, C. M., Mertes, L. A. K., Dunne, T., Costa, M. H., & Jasinski, M. J. (2002). Surface
water dynamics in the Amazon basin: Application of satellite radar altimetry. Journal
of Geophysical Research, 107(D20), 8059–8080.
Bramer, S.M.S., Berry, P.A.M., & Carter, J. (2010). The use of radar altimetry in soil
moisture monitoring in support of the SMOS mission. Proceedings of Earth
Observation and Water Cycle Science, Frascati, Italy, 18–20 November 2009 (ESA
SP-674, January 2010).
Brown, G. S. (1977). The average impulse response of a rough surface and is applications.
IEEE Transactions on Antennas and Propagation, 25(1), 67–74.
20
433
434
435
436
437
438
439
440
441
442
443
444
445
446
447
448
449
450
451
452
453
454
455
456
3940
Brümmer, C., Falk U., Papen H., Szarzynski J., Wassmann R., Brüggemann N. (2008).
Diurnal, seasonal, and interannual variation in carbon dioxide and energy exchange in
shrub savanna in Burkina Faso (West Africa). Journal of Geophysical Research, 113,
G02030, 11p., doi:10.1029/2007JG000583.
Cazenave, A., Bonnefond, P., & Do Minh, K. (1997). Caspian sea level from Topex/Poseidon
altimetry: Level now falling, Geophysical Research Letters, 25 (2), 155-158.
Chelton, B. C., Ries, J. C., Haines, B. J., Fu, L., & Callahan, P. S. (2001). Satellite altimetry.
In L. Fu & A. Cazenave (Eds.), Satellite Altimetry and Earth Sciences: An Handbook
of Techniques and Applications (pp. 1-131): Academic Press.
Crétaux, J.F., Calmant, S., Romanovski, V., Shibuyin, A., Lyard, F., Berge-Nguyen, M.,
Cazenave, A., Hernandez, F., & Perosanz, F. (2009). An absolute calibration site for
radar altimeters in the continental domain: lake Issykkul in Central Asia. Journal of
Geodesy, 83(8), 723-735.
Cudlip, W., Ridley, J.K., Strawbridge, F., Harris, A. and Rapley, C.G. (1994): Detecting
surface roughness and moisture variations in deserts. Proceedings of the 2nd ERS-1
Symposium, Hamburg 1993, ESA SP-361, 849-853.
de Rosnay P., Gruhier C., Timouk F., Baup F., Mougin E., Hiernaux P., Kergoat L., LeDantec
V. (2009). Multi-scale soil moisture measurements over the Gourma meso-scale site in
Mali. Journal of Hydrology, AMMA CATCH special issue, 375(1-2), 241–252.
ESA (2002). ENVISAT RA2/MWR Product handbook, RA2/MWR products user guide.
Frappart, F., Seyler, F., Martinez, J. -M., Leon, J. -G., & Cazenave, A. (2005). Floodplain
water storage in the Negro River basin estimated from microwave remote sensing of
inundation area and water levels. Remote Sensing of Environment, 99(4), 387−399.
21
457
458
459
460
461
462
463
464
465
466
467
468
469
470
471
472
473
474
475
476
477
478
479
4142
Frappart, F., Calmant, S., Cauhopé, M., Seyler, F., & Cazenave, A. (2006a). Preliminary
results of ENVISAT RA-2-derived water levels validation over the Amazon basin.
Remote Sensing of Environment, 100(2), 252−264, doi:10.1016/j.rse.2005.10.027
Frappart, F., Do Minh, K., L'Hermitte, J., Cazenave, A., Ramillien, G., Le Toan, T., &
Mognard-Campbell N. (2006b). Water volume change in the lower Mekong from
satellite altimetry and imagery data. Geophysical Journal International, 167(2),
570−584, doi:10.1111/j.1365246X.2006.03184.x.
Frappart F., Hiernaux P., Guichard F., Mougin E., Kergoat L., Arjounin M., Lavenu F., Koité
M., Paturel J.E., Lebel T., 2009, Rainfall regime over the Sahelian climate gradient in
the Gourma, Mali. Journal of Hydrology, AMMA CATCH special issue, 375(1-2), 128-
142.
Hayne, G. S. (1980). Radar altimeter mean return waveforms from near normal-incidence
ocean surface scattering. IEEE Transactions on Antennas and Propagation, 28(5),
687–692.
Hiernaux, P., Mougin, E., Diarra, L., Soumaguel, N., Lavenu, F., Tracol, Y., Diawara, M.,
Jarlan, L. (2009). Rangeland response to rainfall and grazing pressure over two
decades: herbaceous growth pattern, production and species composition in the
Gourma, Mali. Journal of Hydrology, 375, 114-127.
Koster, R.D., Dirmeyer, P., Guo, Z., Bonan, G., Cox, P., Gordon, C., Kanae, S., Kowalczyk,
E., Lawrence, D., Liu, P., Lu, C., Malyshev, S., McAvaney, B., Mitchell, K., Mocko,
D., Oki, T., Oleson, K., Pitman, A., Sud, Y., Taylor, C., Verseghy, D., Vasic, R., Xue,
Y., Yamada, T. (2004). Regions of strong coupling between soil moisture and
precipitation. Sciences, 305, 1038−1040.
Laxon, S. (1994). Sea ice altimeter processing scheme at the EODC. International Journal of
Remote Sensing, 15(4), 915–924.
22
480
481
482
483
484
485
486
487
488
489
490
491
492
493
494
495
496
497
498
499
500
501
502
503
504
4344
Legrésy B. (1995). Etude du retracking des surfaces des formes d’onde altimétriques au-
dessus des calottes, rapport CNES, CT/ED/TU/UD96.188, contrat n°
856/2/95/CNES/006, 81 pp.
Legrésy, B., & Rémy, F. (1997). Surface characteristics of the Antarctic ice sheet and
altimetric observations. Journal of Glaciology, 43(144), 197–206.
Legrésy, B., Papa, F., Rémy, F., Vinay, G., van den Bosch, M., & Zanife, O.Z. (2005).
ENVISAT radar altimeter measurements over continental surfaces and ice caps using
the ICE-2 retracking algorithm. Remote Sensing of Environment, 95, 150-163,
doi:10.1016/j.rse.2004.11.018.
Mladenova, I., Lakshmi, V., Walker, J.P., Panciera, R., Wagner, W., Doubkova, M. (2010):
Validation of the ASAR Global Monitoring Mode Soil Moisture Product Using the
NAFE'O5 Data Set. IEEE Transaction on Geoscience and Remote Sensing, 48, 2498-
2508.
Moran, M. S., Hymer, D. C., Qi, J., Sano, E. E. (2000). Soil moisture evaluation using-
temporal synthetic aperture radar (SAR) in semiarid rangeland. Agricultural and Forest
Meteorology 105, 69–80.
Mougin E., Lopes A., Frison P.L., Proisy C., 1995, Preliminary analysis of the ERS-1 wind-
scatterometer data over land surfaces. Int. J. Remote Sensing, 16(2), 391-398.
Mougin, E., Hiernaux, P., Kergoat, L., de Rosnay, P., Grippa, M., Timouk, F., Arjounin, M.,
Le Dantec, V., Demarez, V., Ceschia, E., Mougenot, B., Baup, F., Frappart, F., Frison,
P-L., Gardelle, J., Gruhier, C., Jarlan, L., Mangiarotti, S., Sanou, B., Tracol, Y.,
Guichard, F., Trichon, V., Diarra, L., Soumaré, A., Koité, M., Dembélé, F., Lloyd, C.,
Hanan, N.P., Damesin, C., Delon, C., Serça, D., Galy-Lacaux, C., Seghiéri, J.,
Becerra, S., Dia, H., Gangneron, F., Mazzega, P. (2009). The AMMA-CATCH
Gourma observatory site in Mali: Relating climate variations to changes in vegetation,
23
505
506
507
508
509
510
511
512
513
514
515
516
517
518
519
520
521
522
523
524
525
526
527
528
529
4546
surface hydrology, fluxes and natural resources, Journal of Hydrology, 375(1-2), 14-
33, doi:10.1016/j.hydrol.2009.06.0045
Mougin, E., Demarez, V., Hiernaux, P., Diawara, M., Berg, A. (2012) Estimation of LAI,
fCover and fAPAR of a Sahelian grassland (Gourma, Mali). Submitted to Agricultural
and Forest Meteorology.
Naeimi, V., Scipal, K., Bartalis, Z., Hasenauer, S., & Wagner, W. (2009). An improved soil
moisture retrieval algorithm for ERS and METOP scatterometer observations. IEEE
Transactions on Geoscience and Remote Sensing, 47(7), 1999–2013,
doi:10.1109/TGRS.20082011617.
Papa, F., Legrésy, B., & Rémy, F. (2003). Use of the Topex-Poseidon dual-frequency radar
altimeter over land surfaces. Remote Sensing of Environment, 87, 136-147,
doi:10.1016/S0034-4257(03)00136-6.
Peacock, N. R., & Laxon, S. W. (2004). Sea surface height determination in the Arctic Ocean
from ERS altimetry. Journal of Geophysical Research-Oceans, 109, C07001.
Pierdicca, N., Greco, B., Bignami, C., Ferrazzoli, P., Mattioli, V. & Pulvirenti, L. (2006). The
calibration of the Envisat radar altimeter by a passive technique, IEEE Transactions
on Geoscience and Remote Sensing, 44(11), 3297–3307.
Redelsperger, J.-L., Thorncroft, C., Diedhiou, A., Lebel, T., Parker, D., Polcher, J.( 2006)
African monsoon, multidisciplinary analysis (AMMA): an international research
project and field campaign. Bulletin of the American Meteorological Society 87(12),
1739–1746.
Ridley, J., Strawbridge, F., Card, R., & Phillips, H. (1996). Radar Backscatter Characteristics
of a Desert Surface, Remote Sensing of Environment, 57(2), 63-78.
Santos da Silva, J.,Calmant, S., Seyler, F., Rottuno Filho, O.C., Cochonneau, G., &
Mansur,W.J.(2010). Water levels in the Amazon basin derived from the ERS 2 and
24
530
531
532
533
534
535
536
537
538
539
540
541
542
543
544
545
546
547
548
549
550
551
552
553
554
4748

ENVISAT radar altimetry missions. Remote Sensing of Environment, 114(10), 2160-
2181, doi:10.1016/j.rse.2010.04.020.
Tansey, K. J., Millington, A. C., Battikhi, A. M., White, K. H. (1999). Monitoring soil
moisture dynamics using satellite imaging radar in northeastern Jordan. Applied
Geography, 19, 325-344.
Taylor, C.T., Harris, P. P., Parker, D. J. (2010).Impact of soil moisture on the development of
a Sahelian mesoscale convective system: a case-study from the AMMA Special
Observing Period. Q. J. R. Meteorol. Soc., 136, 456-470.
Ulaby, F. T., Fung, A. K., Moore, R. K. (1981). Microwave and remote sensing active and
passive. Norwood, MA: Artech House.
Ulaby, F.T., Allen, C.T., Eger, G., and Kanemasu, E. (1984). Relating the microwave
backscattering coefficient to Leaf Area Index. Remote Sensing of Environment, 14,
113-133.
Wagner, W. (1998). Soil moisture retrieval from ERS scatterometer data. PhD dissertation,
Institute for Photogrammetry and Remote Sensing, Vienna, University of Technologu,
111p.
Wagner, W., and Scipal, K. (2000): Large-scale Soil moisture mapping in western Africa
using the ERS Scatterometer. IEEE Transaction on Geosciences and Remote Sensing
38, 1777-1782.
Wehr, T., & Attema, E. (2001). Geophysical validation of ENVISAT data products. Advances
in Space Research, 28(1), 83–91.
Wingham, D. J., Rapley, C. G., & Griffiths, H. (1986). New techniques in satellite altimeter
tracking systems. Proceedings of IGARSS’86 Symposium, Zürich, 8–11 Sept. 1986,
Ref. ESA SP-254 (pp. 1339–1344).
25
555
556
557
558
559
560
561
562
563
564
565
566
567
568
569
570
571
572
573
574
575
576
577
578
4950
Zech W., Senesi N.,Guggenberger G., Kaiser K., Lehmann J., Miano T.M., Miltner A.,
Schroth G. (1997). Factors controlling humification and mineralization of soil organic
matter in the tropics. Geoderma, 79 (1-4), 117-161.
Zelli, C. (1999). ENVISAT RA-2 advanced radar altimeter: Instrument design and pre-launch
performance assessment review. Acta Astronautica, 44, 323–333.
Zribi, M., Andre, C., Saux-Picard, S., Descroix, L., Otlle, C., Kallel, A. (2007). Soil moisture
mapping based on ASAR/ENVISAT radar data over a Sahelian region. International
Journal of Remote Sensing, 29, 3547-3565.
26
579
580
581
582
583
584
585
586
5152

Table captions
Table 1 - Description of study sites and surface soil moisture (SSM) and precipitation data
Table 2 - ENVISAT RA-2 technical specifications
Table 3 - ASCAT technical specifications.
Table 4 – Correlation coefficient (r) and Root Mean Square Error (RMSE) between in-situ measurement of surface soil moisture and S-band backscattering coefficients for the study sites.
Table 5 - Correlation coefficient (r) and Root Mean Square Error (RMSE) between in-situ measurement of surface soil moisture and Ku-band backscattering coefficients for the study sites.
Table 6 - Correlation coefficient (r) and Root Mean Square Error (RMSE) between in-situ measurement of surface soil moisture and Ku-band altimetry-derived surface soil moisture estimation for the 3 sandy sites of Agoufou, Bangui Mallam and Ekia.
Table 7 - Correlation coefficients, bias and RMSE between ASCAT SSM products and RA-2 Ku-band derived SSM for 3 study sites (Agoufou, Bangui-Mallam and Ekia).
27
587
588
589
590
591592593594595596597598599600601602
603604605
606
5354
Table 1:
Description of study sites and surface soil moisture (SSM) and precipitation data
Site name Agoufou Bangui Mallam Eguerit Ekia Kobou Kyrnia
Latitude 15.3453° 15.3978° 15.5026° 15.9651° 14.7284° 15.051°
Longitude -1.47913° -1.34556° -1.391° -1.2534° -1.502° -1.546°
Soil type sand sand, clay rock sand sand, rock sand, clay
SSM
Period 2005 -2010 2005 -2010 2008 -2009 2005 -2010 2008 -2010 2007 -2010
Depth(cm) 5, 10, 40 5*, 10, 30 5 5, 10, 30 5, 10, 30 5, 10, 30
Resolution(min) 15 15 15 15 15 15
Rain gauge
Period 2005 -2010 2005 -2010 2008 -2009 2005 -2010 2005 -2010 2005 -2009
Resolution(min) 5 5 5 5 5 5
*Measurements at 5cm are only available during the 2005-2008 period
28
607608609610611612
613614615
5556

Table 2:
ENVISAT RA-2 technical specifications
Repeat cycle 35 days
Altitude 782.4 - 799.8 km
Emitted frequencies (GHz) (Ku) 13.575 - (S) 3.2
Antenna beam width (°) (Ku) 1.29 - (S) 5.5
Backscatter maximum error (dB) (Ku) 0.29 - (S) 0.37
Pulse-limited footprint diameter (km) (Ku) 3.4 - (S) 4.8
Swath dispersion (km) 2
29
616
617
618619
620621622
5758
Table 3
ASCAT technical specifications
Altitude ~822km
Emitted frequencies (GHz) 5.255
Incidence angles 25° to 65°
Spatial resolution 50km
Nodal grid 25km
Orbit cycle 29days
Accuracy of SSM products 0.04-0.08 m3m-3
Data availability over Gourma daily
30
623624625626627
628629630
5960
Table 4:Correlation coefficient (r) and Root Mean Square Error (RMSE) between in-situ measurement of surface soil moisture and S-band backscattering coefficients for the study sites.
Site Agoufou Bangui Mallam Ekia Kyrnia
Period 2005-2007 2005-2007 2005-2007 2007
Mean distance(km) 3 9.5 5.5 3
SSM depth (cm) 5 10 40 5 10 30 5 10 30 5 10 30
Ice-1
N 25 25 25 20 20 20 22 22 22 8 8 8
r 0.50* 0.41* 0.43*
0.64**
0.73**
0.40 0.70**
0.82**
0.80**
0.68 0.94**
0.98**
RMSE (%) 3.87 6.34 4.97 4.52 3.28 6.77 2.62 1.93 2.14 4.44 1.98 1.34
Ice-2
N 24 24 24 20 20 20 22 22 22 8 8 8
r 0.68**
0.66**
0.70**
0.75**
0.62**
0.58**
0.73**
0.83**
0.80** 0.76* 0.97*
*0.99*
*RMSE (%) 2.4 3.27 2.41 3.37 4.35 4.11 2.41 1.87 2.13 3.54 1.29 0.78
Ocean
N 26 26 26 21 21 21 23 23 23 8 8 8
r 0.27 0.36 0.41* 0.65* 0.64*
*0.34 0.55*
*0.70*
*0.70*
* 0.73* 0.96**
0.99**
RMSE (%) 7.94 7.37 5.19 4.36 4.12 7.88 3.93 2.77 2.86 3.96 1.55 0.84
*: significance >95% **: significance >99%
31
631632633634635636
637
638
6162

Table 5:Correlation coefficient (r) and Root Mean Square Error (RMSE) between in-situ measurement of surface soil moisture and Ku-band
backscattering coefficients for the study sites.
Site Agoufou Bangui Mallam Eguerit Ekia Kobou Kyrnia
Period 2005-2010 2005-2010 2008-2009 2005-2010 2008-2010 2007-2010
Mean distance (km) 3 9.5 2 5.5 9.7 3SSM depth (cm) 5 10 40 5 10 30 5 5 10 30 5 10 30 5 10 30
Number of samples 56 56 56 27 49 49 13 51 51 51 28 28 28 29 29 29
Ice-1 r 0.85**
0.85**
0.55**
0.7**
0.73**
0.3*
0.95**
0.59**
0.63**
0.55**
0.52**
0.33 0.54**
0.66**
0.66**
0.6**
RMSE (%) 1.74 1.85 3.29 3.61 3.22 8.35 1.98 3.32 2.84 3.65 5.84 10.8 4.61 4.59 5.09 6.26
Ice-2 r 0.83**
0.86**
0.54**
0.7**
0.73**
0.26 0.94**
0.59**
0.61**
0.52**
0.55**
0.36 0.54**
0.66**
0.64**
0.52**
RMSE (%) 1.85 1.76 3.4 3.54 3.23 9.67 2.36 3.33 2.99 3.94 5.34 10.03 4.66 4.51 5.38 7.79
Sea Ice r 0.82**
0.83**
0.54**
0.69**
0.73**
0.3*
0.95**
0.58**
0.63**
0.55**
0.52**
0.33 0.55**
0.64**
0.64**
0.59**
RMSE (%) 1.9 2.02 3.4 3.66 3.19 8.32 2 3.44 2.86 3.61 5.8 10.83 4.55 4.78 5.35 6.53
Ocean r 0.52**
0.54**
0.34**
0.62**
0.71**
0.23 0.95**
0.46**
0.54**
0.56**
0.55**
0.39*
0.58**
0.53**
0.49**
0.45*
RMSE (%) 4.52 4.63 5.89 4.38 3.41 11.12 2.05 4.74 3.65 3.6 5.35 8.85 4.25 6.44 8 9.29*: significance >95% **: significance >99%
32
639640641642
643
644
645
6364
Table 6:Correlation coefficient (r) and Root Mean Square Error (RMSE) between in-situ measurement of surface soil moisture and Ku-band altimetry-derived surface soil moisture estimation for the 3 sandy sites of Agoufou, Bangui Mallam and Ekia.
Site Agoufou Bangui Mallam Ekia
In-situ SSM measurement depth (cm)
5 10 5 10 5 10
Ice-1 r 0.88** 0.87** 0.72** 0.73** 0.73** 0.64**RMSE (%) 1.39 1.50 3.29 3.79 2.26 2.33
Ice-2 r 0.86** 0.88** 0.76** 0.73** 0.74** 0.64**RMSE (%) 1.62 1.53 2.35 2.93 2.40 2.70
Sea Ice r 0.87** 0.85** 0.71** 0.74** 0.72** 0.66**RMSE (%) 1.44 1.58 3.03 3.36 2.22 2.21
Ocean r 0.69** 0.68** 0.65** 0.71** 0.49** 0.54**RMSE (%) 3.15 3.26 2.76 2.52 3.16 2.99
*: significance >95% **: significance >99%
33
6566
646647648649650651
652653654
67

Table 7:
Correlation coefficients (r), bias and RMSE between ASCAT SSM products and RA-2 Ku-band derived SSM for 3 study sites (Agoufou, Bangui-Mallam and Ekia).
Site Agoufou Bangui Mallam Ekia
Inversion function (depth in cm)
5 10 5 10 5 10
Ice-1 r 0.49* 0.47* 0.30 0.30 0.42 0.43
RMSE (%) 4.92 4.92 4.04 3.95 10.41 9.25
bias 0.9062 0.72 -0.90 -1.18 -8.01 -6.77
Ice-2 r 0.56* 0.54* 0.39 0.39 0.48* 0.48*
RMSE (%) 4.59 4.67 3.70 3.65 7.98 7.45
bias 1.48 1.09 -0.99 -1.46 -6.97 -6.56
Sea Ice
r 0.49* 0.47* 0.30 0.30 0.43 0.43
RMSE (%) 4.89 4.91 3.99 3.91 9.83 8.79
bias 0.91 0.69 -0.99 -1.29 -7.35 -6.31
Ocean
r 0.50* 0.50* 0.29 0.29 0.45 0.45
RMSE (%) 4.82 4.83 3.72 3.71 5.45 5.43
bias 0.3135 -0.0865 -1.21 -1.64 -4.51 -4.78
*: significance >95% **: significance >99%
34
6869
655656657658659660661
662663
70
Figure captions
Fig. 1: The AMMA-CATCH mesoscale site in Mali, showing the 6 automatic soil moisture stations
(squares) and ENVISAT path 302 (black line).
Fig. 2: Spatial variations of the backscattering coefficient along the ENVISAT RA-2 groundtrack 302 for
dry (January - April) and wet (JJAS) seasons using Ice-1 algorithm. a) Ku band; b) S band. Image from
Google-Earth is shown for comparison.
Fig. 3: Space-time diagram of ENVISAT RA-2 data over the AMMA-CATCH mesoscale window with Ku-
band Ice-1 backscattering coefficient values for a sampling rate in latitude of 0.008° (about 1 km). Blank
stripes correspond to missing or corrupted values. a) Ku-band (2002-2010); b) S- band (2002-2007).
Fig. 4: Time variation of volumetric soil moisture in % (___), and Ice-1 algorithm backscattering coefficient
σ 0 in dB for S-band (---) and Ku-band (---) at Agoufou site for year 2007. a) Soil moisture measurements at
5cm depth; b) Soil moisture measurements at 10cm depth and c) soil moisture measurements at 40cm depth.
Fig. 5: Temporal variations of Ku-band Ice-1 backscattering coefficient σ 0 (___) in dB and volumetric soil
moisture (SSM in %) at 5cm depth (- - -) over the period January 2005 - October 2010. a) Ekia ; b) Eguerit;
c) Bangui Mallam; d) Agoufou; e) Kyrnia; f) Kobou.
Fig. 6: Scatterplot of Ku-band Ice-1 backscattering coefficient σ 0 (in dB) versus volumetric soil moisture
(SSM in %) at 5cm depth. Correlation coefficient (r), Root Mean Square Error (RMSE) in % of soil
moisture, and number of data (n) are also indicated. a) Ekia; b) Eguerit; c) Bangui Mallam; d) Agoufou; e)
Kyrnia; f) Kobou.
Fig. 7: Scatterplot of backscattering coefficient σ 0 (Ice-1 algorithm) versus Leaf Area Index (LAI) for the
Agoufou site. Correlation coefficients (r) and number of samples (n) for LAI>0.2 are given for the period
2005-2010. The linear equation is indicated.
Fig. 8: Linear regression of the Ice-1 normalized backscattering coefficient σ 0 versus volumetric soil
moisture at 5 cm for the sandy sites. The mean sandy site regression equation is indicated, along with the
number of samples considered (n), the correlation coefficient (r) and the Root Mean Square Error (RMSE)
given in % of soil moisture.
35
7172
664
665
666
667
668
669
670
671
672
673
674
675
676
677
678
679
680
681
682
683
684
685
686
687
688
689
73

Fig. 9: Time variation of the volumetric soil moisture at Agoufou, measured at 5cm depth (plain line) and
estimated (circles with error bars) using the general σ 0 - SSM relationships for sandy soils for Ice-1
backscattering coefficients. Are also indicated the number of samples considered (n), the correlation
coefficient (R) and the Root Mean Square Error (RMSE) given in % of soil moisture.
Fig. 10: Time variation of ASCAT SSM product and ENVISAT Ice-1 SSM estimation for the Agoufou site
from 2007 to 2010, with the corresponding error bars. Are also indicated the number of samples considered
(n), the correlation coefficient (r) and the Root Mean Square Error (RMSE) given in % of soil moisture.
36
7475
690
691
692
693
694
695
696
697
76
Fig. 1
37
7778
698699700701
702703704705
79
Fig. 2
38
8081
706707708709
710711
712713714
82
Fig. 3
39
8384
715
716717
718719
85

Fig. 4
40
8687
720721
722723724725
88
Fig. 5
41
8990
726727728
729730731732
91
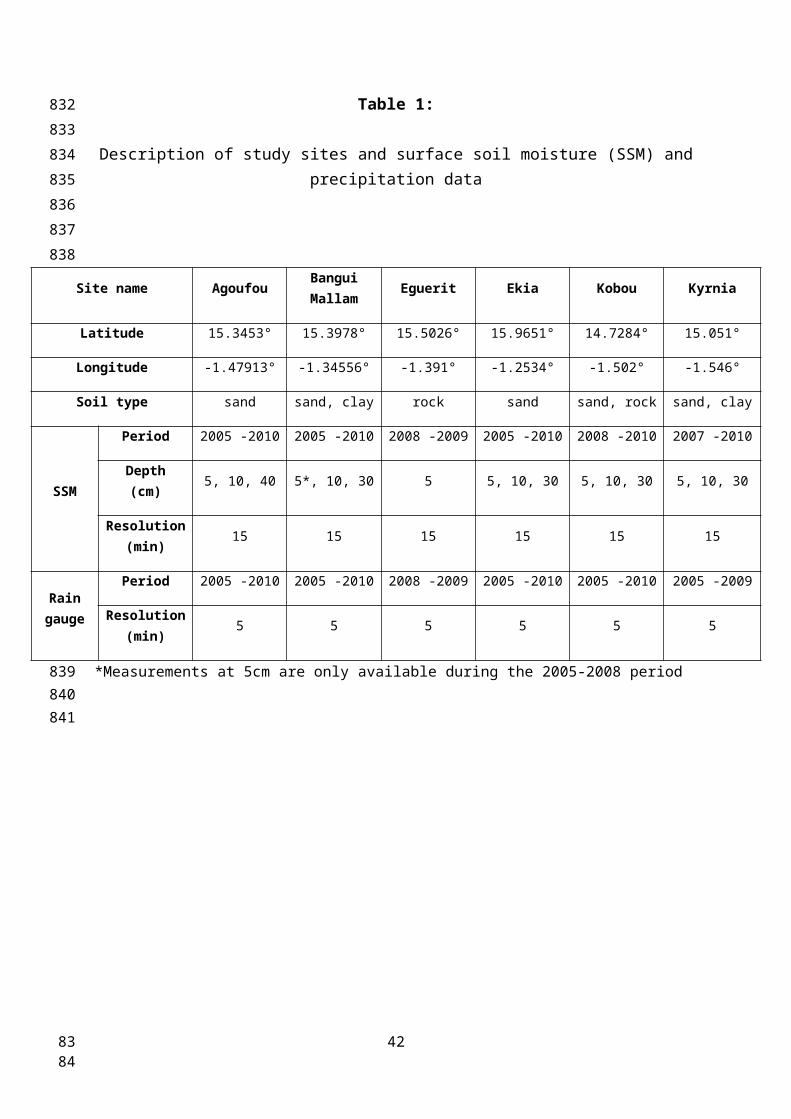
Fig. 6
42
9293
733734735
736737
94

Fig. 7
43
9596
738739740741742
743744745746
97

Fig. 8
44
9899
747748749750751
752753
100
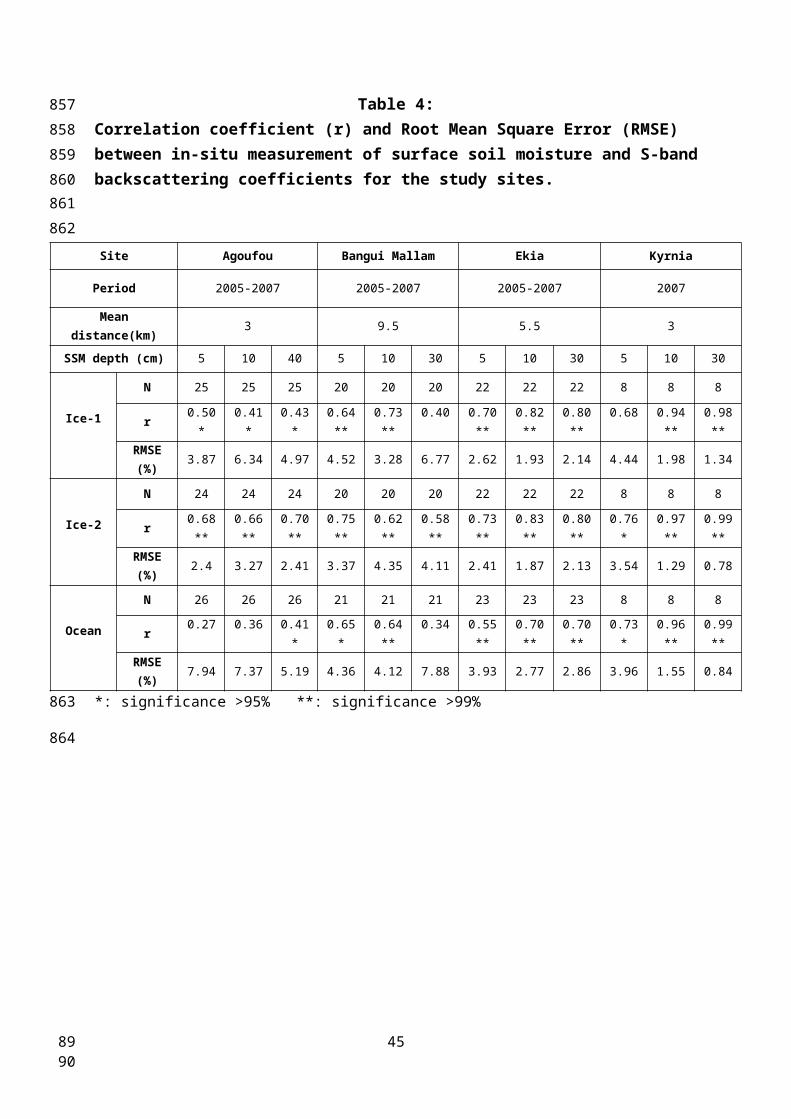
Fig. 9
45
101102754755756
757758
103

Fig. 10
46
104105759
760
761
106


