
ESTIMATING THE URBAN CARRYING CAPACITY OF BAGUIO CITY
127 September 2019
PHILIPPINES ECONOMICS SOCIETY
THE BEDROCK OF CARRYING CAPACITY
Malthusian Principle of Population was
considered the bedrock of carrying capacity
framework. The Malthusian principle was very
simple even in its mathematical model. The
model predicts that when population remains
unchecked, it will grow exponentially while
(food) production will only grow linearly.
Simply put, time will come that land which is a
fixed input to production will yield an output
that will, in the long run, result to a diminishing
return.

URBAN CARRYING CAPACITY
THE ABILITY OF THE URBAN AREA TO ACCOMMODATE
POPULATION GROWTH WITHOUT
CAUSING SUBSTANTIAL
DAMAGES AND DEGRADATION TO THE ENVIRONMENT
THE MAXIMUM ECONOMIC SCALE THAT A REGION’S RESOURCE CAN
SUPPORT
THE LEVEL OF HUMAN ACTIVITIES,
POPULATION GROWTH AND
PHYSICAL DEVELOPMENT WHICH CAN BE
SUSTAINED WITHOUT CAUSING
IRREVERSIBLE DAMAGES

CONTEXT OF DIMINISHING RETURN
LAND AND HABITAT
WATER AND SANITATION (SEWAGE
AND WATER TREATMENT)
ROADS AND TRANSPORTATION
ENVIRONMENT AND AIR QUALITY
QU
ALI
TY O
F L
IFE

Theoretical Framework
P
ttw t1 t2
K3
K1 Q1
K2Q2
Q3

K1 – calculated population carrying capacity of a locality considering
limiting factor(s) (e.g., land or water)
K2 – degraded carrying capacity due to population overshoot of K1
K3 – enhanced carrying capacity due to technology development
and resource sustainability
t1 - critical year when K overshoots K1
t2 - year when K is degraded to K2
tw - year when P is approaching its K limits (warning and alert year)
and interventions are urgently needed (e.g., build dam, vertical
growth of green buildings, mass transport, etc.)
Q1 – quality of life at K1
Q2 – quality of life at K2
Q3 – quality of life at K3

THE MALTHUSIAN MODEL OF UCC FOR BAGUIO CITY
DATAPOPULATION
(SOURCE: PSA)LAND
(SOURCE: Estoque,2011)
DIMINISHING RETURNS
EMPIRICAL EVIDENCE OF THE
MODEL
PUBLIC SERVICES QUALITY OF LIFE ENVIRONMENT AND
ECOLOGY

Demographic Trends
Figure 3: Estimated Population Growth in Baguio
25,000 pop in 1918
398,552 pop as of 2018
Population linear Path CAPACITY

ESTIMATE OF BAGUIO’S CARRYING CAPACITY
2018
A
B
60:40
2010

Demographic Trends and the Malthusian
Principle: The Case of Baguio
Figure 1: Population Trend and Estimated Water Supply/Person/Day
Functional Relationship: Diminishing Water Water Supply/person/day
𝑊𝑎𝑡𝑒𝑟 = 20.729 + 1
𝑃𝑜𝑝𝑢𝑙𝑎𝑡𝑖𝑜𝑛 1.646
R = 0.813, sig..000***

URBAN CARRYING
CAPACITY OF BAGUIO CITYSUMMARY OF FINDINGS

UCC = f (ecology and environment,
urban facilities and services,
infrastructure and transport,
and public perception)
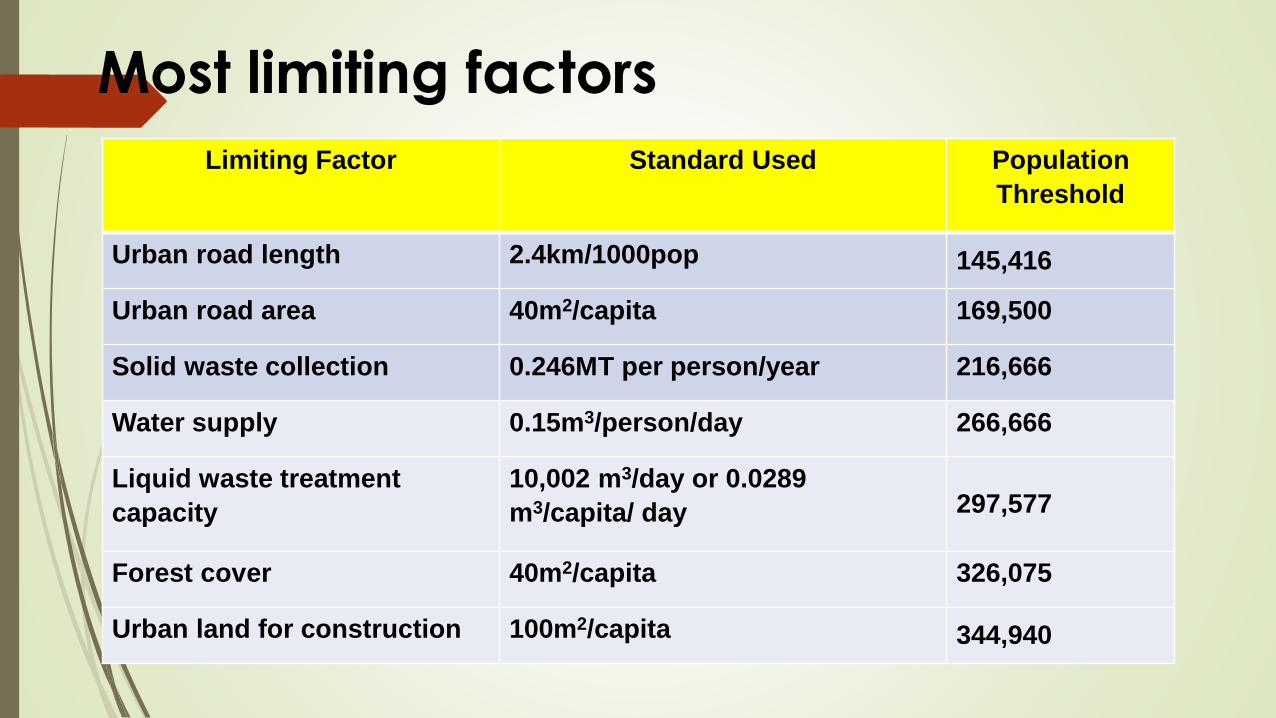
Most limiting factors
Limiting Factor Standard Used Population
Threshold
Urban road length 2.4km/1000pop 145,416
Urban road area 40m2/capita 169,500
Solid waste collection 0.246MT per person/year 216,666
Water supply 0.15m3/person/day 266,666
Liquid waste treatment
capacity
10,002 m3/day or 0.0289
m3/capita/ day 297,577
Forest cover 40m2/capita 326,075
Urban land for construction 100m2/capita 344,940

0
100,000
200,000
300,000
400,000
500,000
600,000
2015 2020 2025 2030 2035 2040 2045
Po
pu
lati
on
Year
Population Carrying Capacity of Urban Road Length: Baguio City
Projected Population Current Carrying Capacity of Urban Road Length

0
100,000
200,000
300,000
400,000
500,000
600,000
2015 2020 2025 2030 2035 2040 2045
Po
pu
lati
on
Year
Population Carrying Capacity of Urban Road Area: Baguio City
Projected Population Current Population Carrying Capacity of Urban Road Area

0
100,000
200,000
300,000
400,000
500,000
600,000
2015 2020 2025 2030 2035 2040 2045
Po
pu
lati
on
Year
Population Carrying Capacity of Solid Waste Collection: Baguio City
Projected Population

0
100,000
200,000
300,000
400,000
500,000
600,000
2015 2020 2025 2030 2035 2040 2045
Po
pu
lati
on
Year
Population Carrying Capacity of Water Supply: Baguio City
Projected Population Current Carrying Capacity of Water Supply

0
100,000
200,000
300,000
400,000
500,000
600,000
2015 2020 2025 2030 2035 2040 2045
Po
pu
lati
on
Year
Population Carrying Capacity of Liquid Waste Treatment: Baguio City
Projected Population
0
100,000
200,000
300,000
400,000
500,000
600,000
2015 2020 2025 2030 2035 2040 2045
Po
pu
lati
on
Year
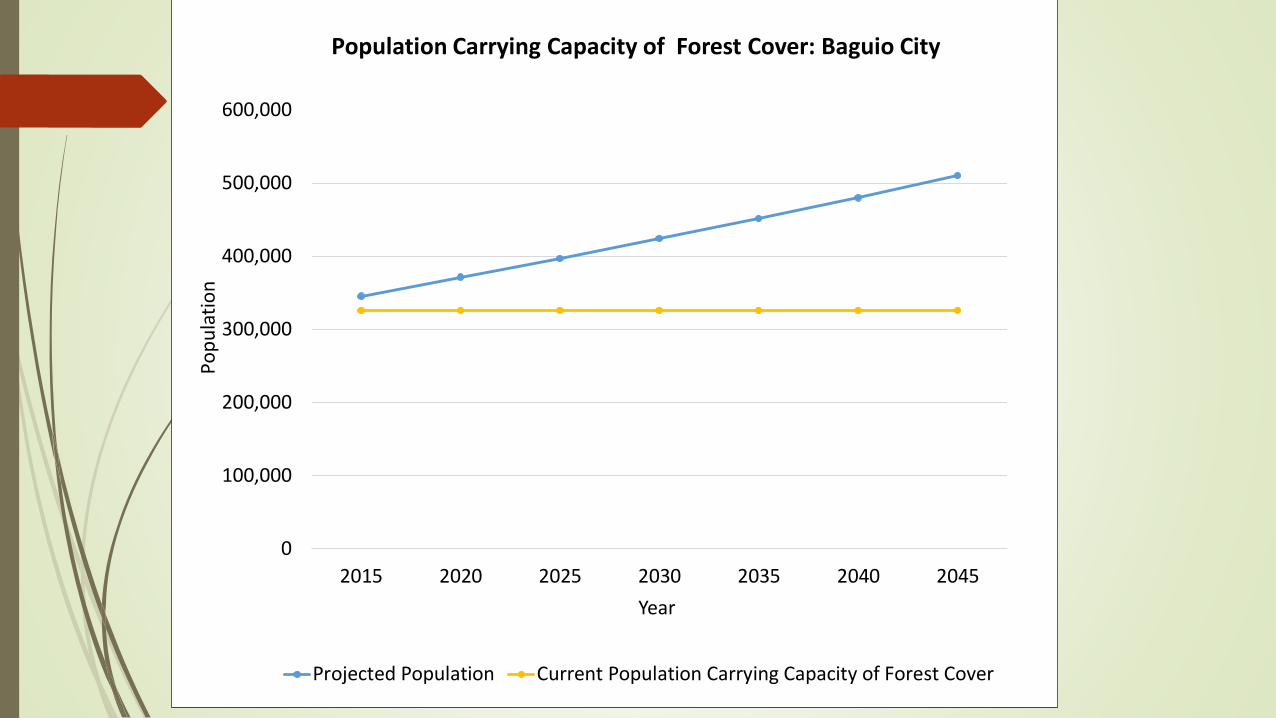
Population Carrying Capacity of Forest Cover: Baguio City
Projected Population Current Population Carrying Capacity of Forest Cover

0
100,000
200,000
300,000
400,000
500,000
600,000
2015 2020 2025 2030 2035 2040 2045
Po
pu
lati
on
Year
Population Carrying Capacity of Land for Construction/Development: Baguio City
Projected Population
Tc

1. SUITABLE SLOPE
2. SUITABLE GEOLOGIC
FORMATION3. NON-FOREST AREA
4. NON-BUILT-UP AREA
5. NOT UNDER FAULT LINE
6. NOT A
ROAD
7. NOT UNDER PROTECTED
AREAS8. NOT VULNERABLE TO
LANDSLIDE

NET DEVELOPABLE AREAS
( 399.19 HECTARES)
1. BAGUIO ANCESTRAL
CLAIMS
2. PROCLAMATION LOTS
3. HERITAGE SITES
1. SUITABLE SLOPE
2. SUITABLE GEOLOGIC
FORMATION3. NON-FOREST AREA
4. NON-BUILT-UP AREA
5. NOT UNDER FAULT LINE
6. NOT A
ROAD
7. NOT UNDER PROTECTED
AREAS8. NOT VULNERABLE TO
LANDSLIDE

Sector
Standard or
benchmark
applied
Population
Carrying Capacity
of Resource x (Pt)
t = estimated
number of
years from
2015
Y = Actual
year
Green cover (forest
+ other green
vegetation)
80m2/capita*
350,458 +1 2016
Forest cover (forest
trees)
40 m2/capita*326,075 - 3 2012
Land for construction
or development
100m2/capita344,940 0 2015
Water supply 0.15m3/person/
Day 266,666 -13 2002
Urban road length 2.4km/1000pop 145,416 -30 1985
Urban road area 40m2/capita** 169,500 -27 1988
Parks 5m2/capita*** 413,320 +13 2028
Open space 20m2/capita*** 306,370 -7 2008
Solid waste
collected
0.246MT per
person/year216,666 -21 1994
Liquid waste
treatment capacity
0.0289
m3/capita/ day297,577 -8 2007
Critical UCC Indicators and Estimated Year of Reaching Threshold Population Carrying CapacityActual PGR (PSA): 1980-1990 = 4.41% 1990-1995 = 4.09% 1995-2000 = 2.31% 2000-2007 = 2.50% 2007-2010 = 1.98% 2010-2015 = 1.54%*Based on Consultant’s estimate in the absence of official estimates from DENR.
**Half of DILG standard of 80m2 per capita based on Consultant’s estimate considering the high value of DILG’s estimate which may be intended for provincial roads.
*** Based on Consultant’s estimate in the absence of official estimates from government agencies and Baguio City.

THE MALTHUSIAN
PREDICTION IS BECOMING
TRUE FOR BAGUIO CITY

POLICY IMPLICATION
The Malthusian has two major variables, population growth and fixed resources (i.e. water, public services, land). Both are policy variables.
Controlling population in the light of urbanization is not a short run solution to the current state of urban carrying capacity. The pull factors of the
urban development, will remain to be the major factor of migration.
POLICY IMPLICATION
POPULATION CONTROL
DO SOMETHING POLICY: To deter migration via the market mechanism can be a short and long run
policy option. Stricter policy on rents, land ownership, and standardizing housing
construction, can make the city expensive, hence deterring fast growth of migration, therefore
slower deterioration of resources.

POLICY IMPLICATION
DO NOTHING POLICY (Let it be, the self-correcting mechanism): Allow Baguio to reach population
threshold, results to low quality of life, out-migration, eventually reaches urban decay. Baguio
in the long run goes through a process of urban decay and in the longer run gentrification
preservation/rebuilding of what remains of the city.

POLICY IMPLICATION
EXPANSION OF FIXED RESOURCES
DO SOMETHING POLICY: Services
(1) Expansion of fixed resources, such as the creation of smart buildings that can house
increasing population with strict provisions for green building ideas such as solar power, water
catchment designs, and private septic and sewer systems to sustain good quality of life.

POLICY IMPLICATION
EXPANSION OF FIXED RESOURCES
DO SOMETHING POLICY: On Services
(2) Strengthen the creation of Circular Economies at the barangay level by converting waste into
inputs for upcycled or recycled products.

POLICY IMPLICATION
EXPANSION OF FIXED RESOURCES
DO SOMETHING POLICY: On Land
(3) Expand land resource through consolidated land mapping and land use plans among the
contiguous municipalities. Pursue the BLISTT plan.

POLICY IMPLICATION
EXPANSION OF FIXED RESOURCES
DO SOMETHING POLICY: On Land
(4) Create hubs of economic activity, i.e. techhubs, fintech, agritech, and creative hubs, in the
contiguous municipalities to disperse economic activities from Baguio City.

32
ADD
A
FOO
TER
THANK YOU


