
Policy Research Working Paper 8106
Estimating the Welfare Costs of Reforming the Iraq Public Distribution System
A Mixed Demand Approach
Nandini KrishnanSergio Olivieri
Racha Ramadan
Poverty and Equity Global Practice GroupJune 2017
WPS8106P
ublic
Dis
clos
ure
Aut
horiz
edP
ublic
Dis
clos
ure
Aut
horiz
edP
ublic
Dis
clos
ure
Aut
horiz
edP
ublic
Dis
clos
ure
Aut
horiz
ed

Produced by the Research Support Team
Abstract
The Policy Research Working Paper Series disseminates the findings of work in progress to encourage the exchange of ideas about development issues. An objective of the series is to get the findings out quickly, even if the presentations are less than fully polished. The papers carry the names of the authors and should be cited accordingly. The findings, interpretations, and conclusions expressed in this paper are entirely those of the authors. They do not necessarily represent the views of the International Bank for Reconstruction and Development/World Bank and its affiliated organizations, or those of the Executive Directors of the World Bank or the governments they represent.
Policy Research Working Paper 8106
This paper is a product of the Poverty and Equity Global Practice Group. It is part of a larger effort by the World Bank to provide open access to its research and make a contribution to development policy discussions around the world. Policy Research Working Papers are also posted on the Web at http://econ.worldbank.org. The authors may be contacted at [email protected].
The Iraqi Public Distribution System is the largest universal, in-kind subsidy system in the world. In 2012, the Public Distribution System transfers accounted for as much as 30 percent of incomes of the poorest 10 percent of the Iraqi population and provided 70 percent of the calories of the poorest 40 percent. In effect, the Public Distribution System remains the only safety net program that covers all the poor and vulnerable in the country. Yet, it is a very inefficient and expensive means to deliver transfers to the poor and creates distortions in the economy as well as an unsustainable fiscal burden. The fiscal crisis since mid-2014 has put reform of the Public Distribution System back on the agenda. This paper employs a mixed demand approach to analyze the consumption patterns of Iraqi households and quantify the
welfare impact of a potential reform of the Public Distribu-tion System in urban areas. The results show that household consumption of Public Distribution System items is rela-tively inelastic to changes in price. Consumption is more inelastic for the poorest quintiles and, for much of the population, these goods are not inferior, but rather normal goods. Cross-sectional comparisons suggest that with improvements in welfare levels, and with well-functioning markets, some segments of the population are substituting away from the Public Distribution System and increasing their consumption of market substitutes. The removal of all subsidies will require compensating poor households by 74.4 percent of their expenditures compared with nearly 40 percent for the richest households in urban areas.

Estimating the Welfare Costs of Reforming the Iraq Public Distribution System:
A Mixed Demand Approach1
Nandini Krishnan2, Sergio Olivieri3 and Racha Ramadan4
Keywords: Public Distribution System, Iraq, quota, demand analysis, Mixed Demand Approach, food subsidy
JEL: D12, D39, O12, O53
1 This paper has been benefited from our reviewers; Cesar Cancho and Gabriela Inchauste, and seminar participants at the World Bank, workshops and conversations with senior technical counterparts from Government of Iraq and Kurdistan Region in Erbil, Iraq, May, 2014. 2 Senior Economist, Poverty and Equity Global Practice, The World Bank Group, 1818 H St, NW – Washington DC, 20433 [email protected] 3 Senior Economist, Poverty and Equity Global Practice, The World Bank Group, 1818 H St, NW – Washington DC, 20433: [email protected] 4 Assistant Professor- Faculty of Economics and Political Science- Cairo University: [email protected]

2
1. Introduction
Subsidies are an important social protection tool used by many countries to provide economically vulnerable
populations with basic needs such as food and fuel at affordable prices. Subsidies are also used to redistribute
revenues and protect the population as a whole from spikes in the prices of necessities. Especially in the case
of universal subsidies, the objective of protection is typically counteracted by their regressive nature, in absolute
terms, and the large costs and inefficiencies associated with running these programs. The latter can be
particularly acute when transfers are in-kind and involve large-scale operations for import and procurement,
transportation, storage and distribution. Moreover, such large programs can also crowd out spending on health,
education and productive investment, which are arguably more progressive in nature. This paper considers the
largest universal, in-kind subsidy system in the world, Iraq’s Public Distribution System (PDS), which
exemplifies these difficult trade-offs. Using a Mixed Demand approach, we quantify the welfare impacts of
alternate reform scenarios, in a context of long term dependence on the PDS for basic food needs and recurrent
and unpredictable exposure of the population to economic and non-economic shocks.
Iraq’s PDS has its origins in the sanctions era of the 1990s, when it began as a program to distribute
domestically-produced food. In 1996, the United Nations agreed to allow food imports under the Oil for Food
Programme, and since then, the PDS has been almost entirely sourced through imports. In its current form,
the PDS distributes heavily subsidized food rations to almost every household in Iraq. A family’s allocation is
determined by the size and composition of the family as registered in their ration card and these are acquired
for a negligible amount.
The value of transfers from the PDS alone accounts for 13 percent of incomes for the average Iraqi household
[World Bank (2014a)]. For households in the bottom 10 percent of the distribution, PDS transfers account for
as much as 16.5 percent of their total expenditure (Figure 1), 60 percent of non-labor income or 30 percent of
their total income [World Bank (2014a)]. Roughly 70 percent of the calories of the bottom 40 percent of the
distribution come from the PDS in 2012, but it accounted for only a third of calories consumed by the richest
20 percent of the consumption distribution (Figure 2). Likely related, food or extreme poverty rates are almost
negligible in Iraq [World Bank (2014a)]. The PDS is the only safety net program that covers all the poor and
vulnerable in a country where other social protection programs such as the Social Security Network, have
started only recently and cover at most a fifth of the poor. It is seen to be one of the more tangible benefits
delivered by the state and has increasingly become viewed as a general entitlement. As a result, any discussions
of reforms or changes to the PDS are politically sensitive and contingent on the establishment of a
comprehensive social protection system.
However, the need to reform the PDS is well recognized, and various proposals have been put forward for its
reform since 2003. The fact remains that the PDS represents a large fiscal burden, even for oil-rich Iraq,
3
accounting for 1 trillion Iraqi dinars and 5% of Iraq’s GDP [Silva, Levin and Morgandi (2012)]. While the PDS
provides a level of broad food security to the poor and vulnerable in Iraq, it also covers more than 95 percent
of the non-poor, and therefore, the cost is considerably higher than is typical for a targeted safety net. In its
current form, it suffers from large inefficiencies in procurement, distribution, and management, and implies
significant macro-economic distortions because of its heavy reliance on food imports and its universal nature.
Due to its large scale, it distorts the market for food and discourages local production. For this and many other
reasons, including the need for the introduction of a comprehensive safety net system going beyond food
subsidies, the Government of Iraq is considering further reforms to the PDS.5 The sharp decline in oil prices
and the Islamic State insurgency since mid-2014 have severely constrained the fiscal environment and made
PDS reform even more imperative.
In considering any reform options, it will be extremely important to quantify and understand the potential
welfare impact of a change in the PDS across the distribution of consumers. This is particularly critical because
of the context- a system that is universally accessed; high dependence on imports implying lack of available
substitutes in the market; the large accompanying macro-economic distortions; and the recurrent exposure of
households to unpredictable shocks. Moreover, incorporating the behavioral response of households to
reforms is essential given that the population may have come to think of the PDS transfer as a constant,
unchanging benefit that comes at almost zero cost. Finally, in designing alternatives, it is important to quantify
the adverse welfare impact to be able to (a) assess whether a targeted system is feasible, and what the welfare
cut-off could be; (b) estimate the size of cash transfer that would hold utility constant, at least for the lower
parts of the distribution; and (c) assess the cost-effectiveness of alternatives.
Using a Mixed Demand approach, this paper simulates the impact of hypothetical reform scenarios of the PDS
on consumer welfare. Using the most recently available household survey, the Iraq Household and Socio-
Economic Survey (IHSES) – 2012, we estimate income and price elasticities to be able to model the behavioral
response of households to these reforms. The Iraqi food subsidy system involves partial rationing, where the
PDS food items are available at subsidized prices until a quantity quota is reached. For larger quantities,
consumers can purchase the free market counterparts of these items at the free market price. The Mixed
Demand approach allows us to explicitly take into consideration the partial rationing of the PDS and its dual
price system. Such a demand system explicitly incorporates rationed quantities for a subset of goods with
predetermined prices, in addition to free market goods. The estimated income and price elasticities from such
a model permit us to analyze the impact of reforms on consumer consumption and therefore, welfare
5 The Government of Iraq is currently considering moving to a ‘smart card’ system of delivery of PDS entitlements, and potentially a means-targeted eligibility criterion for the social protection programs.

4
[Houthakker and Tobin (1952), Madden (1991), Huffman and Johnson (2000), Moschini and Rizzi (2007),
Ramadan and Thomas (2011)].
The paper is organized as follows. Section 2 describes the data and issues related to the valuation of subsidized
and rationed goods in the Iraqi context. Section 3 details the methodological approach of the Mixed Demand
Model. Section 4 discusses estimations and results including welfare analysis, and Section 5 concludes.
2. Data and valuation of ration items
The mixed demand model is estimated using the Iraq Household and Socio Economic Survey (IHSES) for
2012. IHSES covers roughly 25,000 households and is designed to be representative at the provincial or
governorate level. The survey collects detailed data on all aspects of household income and expenditure and a
wide variety of socio-economic indicators. These include household composition and demographic information
for each individual member; housing; health; education; job search, past and current employment; wages,
earnings and income; loans and assistance; consumption of food and non-food items; ownership of durable
goods; time use, anthropometrics; access to justice; household shocks and coping strategies, migration; life
satisfaction; and consumption and receipts of PDS or ration items.
There are 13 ration products: rice, brown wheat flour, white wheat flour, children's food, powdered milk,
vegetable fat, vegetable oil, dry white beans, chick peas, lentils, sugar, salt and tea. These ration items differ in
terms of their importance: for instance, 36% of total ration expenditure is spent on brown wheat flour
compared to almost 0% for salt and tea. The other highly consumed ration products are: sugar (26% of total
ration expenditure), vegetable oil (22% of ration expenditure) and rice (14% of ration expenditure) (Figure 3).
Taken together, brown wheat flour, rice, vegetable oil and sugar represent almost 98% of total ration
expenditures. Hence, our analysis focuses on the consumption of these four ration items and their free market
counterparts.
Information about PDS items is collected in two separate modules: the rations module and a 7-day diary for
food purchases. The former collects information about the quantity of ration items received, consumed,
bartered, sold or given away by the household during the last 30 days. In the rations module, households are
also asked how much they would pay in the open market to purchase each PDS or ration item. The diary
records all purchases of food including ration items over the last 7 days (expenditures and quantities). To
estimate a household’s consumption of PDS items, we follow the methodology for the construction of the
official welfare aggregate for estimating poverty [World Bank (2013)]. Any purchases of PDS items recorded in
the diary over the 7-day recall period are multiplied by a factor of 30/7 to obtain 30 day equivalents, and these
quantities are added to the consumption of PDS items over the last 30 days as recorded in the rations module.
In practice, purchases of PDS items (recorded in the diary) are few and far between.

5
Next, these monthly quantities of PDS items need to be valued and two key principles guide this valuation
procedure. Households who consume (or purchase) a larger quantity of PDS items must be assigned higher
consumption and thereby utility. Second, in principle, goods and services ought to be valued equal to their
infra-marginal benefit; i.e.; the market price faced for the marginal unit consumed. In Iraq, ration items are
rarely traded in the market and a market-equivalent price is non-existent. Few transactions are recorded in the
diary and there are two main reasons why market prices or in this case unit values (the ratio of expenditure to
quantity) from market transactions are not used as the reference for valuing ration items. The first is the
insufficient number of observations per item. For instance; the percentage of households reporting purchases
of ration items in the diary questionnaire varies from less than 1 percent in the case vegetable fat, lentils, brown
wheat, and sugar to a maximum of less than 3 percent in the case of rice. Furthermore, there are no transactions
recorded in some geographical divisions for brown wheat, vegetable fat, vegetable oil, lentils and sugar.
Secondly, there is a possibility of selection-bias. In other words, these unit values could be associated with a
select few households who are quantity constrained and purchased PDS items on the market because their
allocation proved insufficient.
Additionally, the unit values for the nearest free market equivalents are significantly higher for some items. For
instance, a significant gap is observed in unit values between market-traded and ration rice. For instance, the
difference between the median unit value of ration rice from diary and commercial local rice is 70 percent. This
gap doubles when comparing with the median unit value of imported commercial rice. This could be mainly
related to important quality differences between these types of goods. This implies that market prices for
commercially available items cannot be used to value all ration items because they are not perfect substitutes.
Another possibility is to use official prices for ration items. Again, two main concerns are relevant: the first is
that these prices are very low. Using these heavily subsidized prices would artificially suppress the value of food
expenditures stemming from rations. The second is that rations should be valued at a price close to that we
expect to be traded. But these official prices are not prices at which households can procure unlimited quantities
(by design).
The remaining candidate to value rations is the self-reported value of ration items. IHSES asks households how
much they would pay for ration-equivalent items in the market.6 In practice, few households expressed an
opinion, and enumerators approached the local ration agent in the cluster, in a manner akin to a price survey.
However, there were variations in these prices that may reflect uncertainty, noise and local variations in supply,
demand and quality. In order to ensure that all those who consume exactly the same amount of a ration item
are assigned the same expenditure, and thereby utility; and that this expenditure increases with higher
6 The actual question from the IHSES questionnaire is: “If you could buy this [ITEM] in the market, how much would you have to pay for it?”

6
consumption; the methodology followed in this paper uses the national median values of prices reported by
ration agents to value ration items [World Bank (2013)].
Using the quantities and ration-agent’s prices for these ration items to estimate expenditures, on average only
6% of total expenditure is allocated to this type of products by Iraqi households in 2012. This aggregate statistic
hides a lot of heterogeneity throughout the consumption distribution. PDS expenditures account for 30 percent
of food expenditures for the poorest 10 percent of Iraqi households, and around 17 percent of their total
expenditures in 2012. The share of PDS expenditures declines as total household expenditures increase or as
households get richer. For instance, it reduces to 12, 7 and 2 percent for the 2nd, 5th and top deciles of the
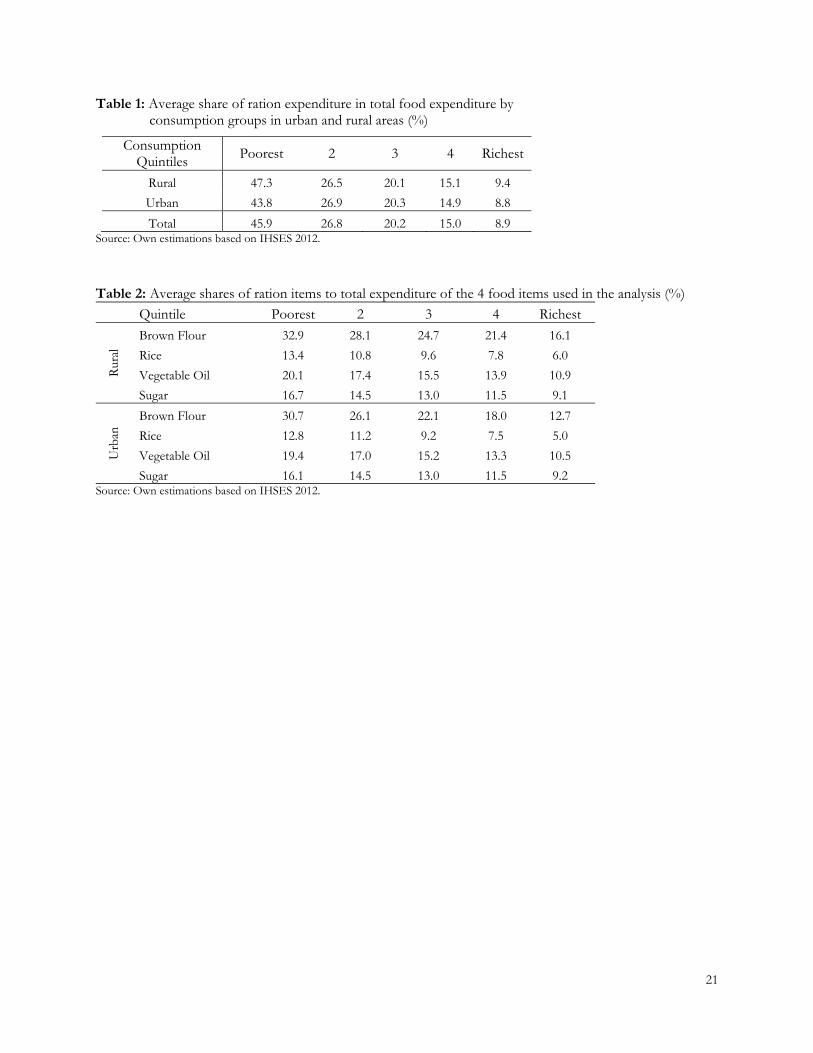
consumption distribution respectively (Figure 1). Table 1 shows the average shares of ration expenditure with
respect to total food expenditure by consumption quintile in urban and rural areas. In urban areas, the richest
spend almost 9% of their total food expenditure on ration products, compared to 44% spent by the poorest
quintile. These shares are slightly higher in rural areas: 9.4% and 47% for the upper and bottom 20 percent of
the consumption distribution respectively.
3. Mixed Demand Model
Estimating the behavioral responses of households to changes in the availability of goods requires the
estimation of the demand functions of consumers of these goods. In this setting, the most common empirical
specifications involve expressing quantity demanded as a function of total expenditure and market prices, or a
direct demand system [Moschini and Rizzi (2006)]. However, standard specifications rely on additional
identifying assumptions, in particular, the implicit assumption that prices are predetermined, or in other words,
that supply functions for these goods are perfectly elastic. This assumption is not likely to hold in the context
under consideration here, where nominally priced PDS items form a significant part of expenditures on food,
and are widely consumed. An alternate approach treats quantities as predetermined, with prices adjusting so
that demand and supply are equalized in the aggregate. This approach, while appropriate for perishable
products, is not appropriate in the scenario considered in this paper either. A third approach, first introduced
by Samuelson (1965), considers mixed demand functions. In this approach, while for some goods, prices are
predetermined, for others, quantities are given. This allows for more flexibility in assumptions regarding
whether prices or quantities are held exogenous for each good, and this is the approach we follow in this paper.
In addition, the presence of a dual system of prices for PDS or ration goods can be incorporated into a mixed
demand model specification; whereas Marshallian demand functions using flexible specifications such as the
Almost Ideal Demand Systems (AIDS) may not be appropriate. The dual system is one where households have
access to quotas of subsidized food products in addition to their free market counterparts. In this setting, a
consumer has to simultaneously choose the subsidized consumption segment (i.e., a quantity above or below

7
the allocated quota) and the free market consumption level. The existence of food subsidies in the consumer
demand system is associated with individual consumption quotas, which introduce nonlinearities in the demand
functions. Households have access to subsidized goods up to their designated quota, but when demand exceeds
this quota, households have to purchase free market goods with the same or a different quality, and of course
a different price [Ramadan and Thomas (2011)].
Following Moschini and Rizzi (2007) and Ramadan and Thomas (2011), we estimate a normalized quadratic
mixed demand model in order to understand consumer behavior. In a mixed demand model where there are n
free market products and m subsidized products, let X = [x1……xn] be the vector of goods whose prices are
determined on the market; Z = [z1…zm] the vector of goods whose quantities are predetermined (quotas); p
and q are the price vectors associated to X and Z respectively. The mixed demand of a representative consumer
is derived from the solution to the following maximization problem: max , ( , ) − ( , , ) (2.1) . . + =
where U and V are the direct and indirect utility functions respectively, and y is the consumer’s income (or
total expenditure). Solving the first-order conditions of the above maximization problem yields the vector of
Marshallian mixed demands:
∗ = ( , , )and ∗ = ( , , ) (2.2)
These yield the following optimum direct and indirect utility functions7: ( ∗, ) = ( , ∗, ) ≡ ( , , ) (2.3)
where ( , , ) is the mixed utility function. The mixed demand functions ( , , ) and ( , , ) satisfy
the adding up conditions and are homogeneous of degree zero and degree one in p and y respectively. The
symmetry property applies to the compensated mixed demand functions that are the same as the compensated
demand under rationing and may be characterized in terms of the restricted cost function as follows [Moschini
and Rizzi (2006) and Moschini and Rizzi (2007)]: ( , , ) ≡ min { . | ( , ) ≥ } (2.4)
7 Given the duality between direct and indirect utility functions; the indirect utility function derived from a utility function achieves a minimum on prices such that: u(x) =min v(p,y). Hence, for each level of x, there is a level of p such that: u(x)= v(p,y).
8
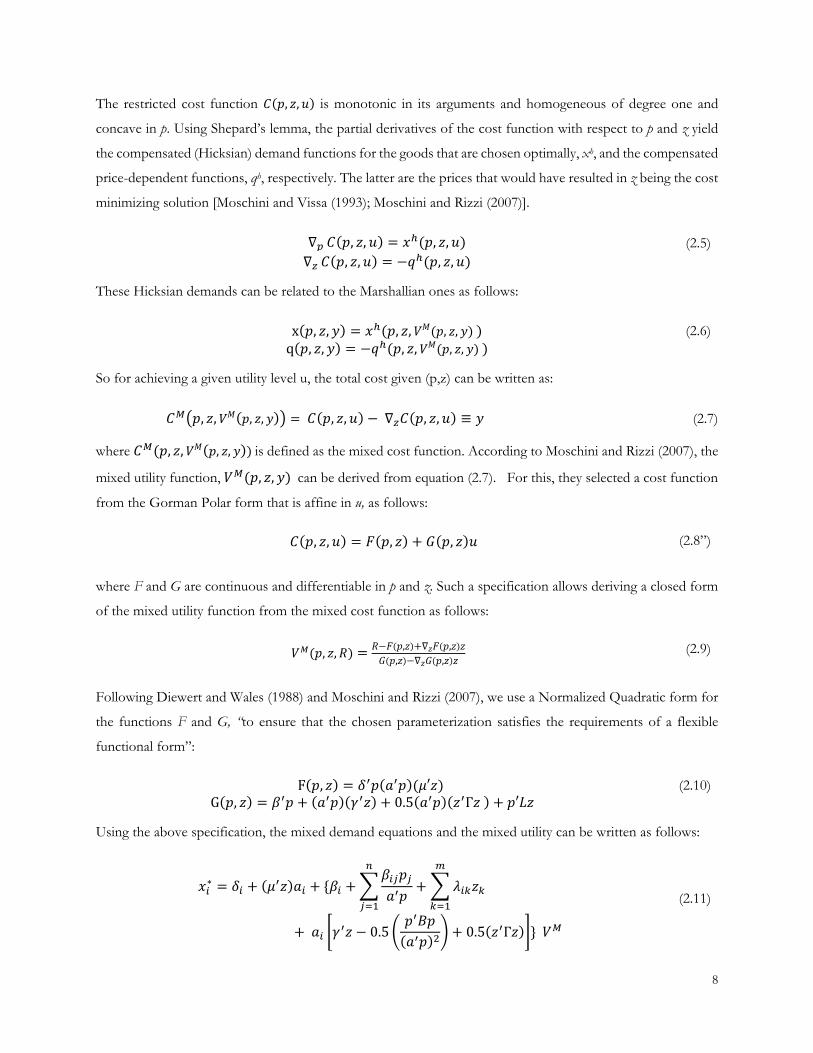
The restricted cost function ( , , ) is monotonic in its arguments and homogeneous of degree one and
concave in p. Using Shepard’s lemma, the partial derivatives of the cost function with respect to p and z yield
the compensated (Hicksian) demand functions for the goods that are chosen optimally, xh, and the compensated
price-dependent functions, qh, respectively. The latter are the prices that would have resulted in z being the cost
minimizing solution [Moschini and Vissa (1993); Moschini and Rizzi (2007)]. ∇ ( , , ) = ( , , ) (2.5) ∇ ( , , ) = − ( , , ) These Hicksian demands can be related to the Marshallian ones as follows: x( , , ) = ( , , ( , , )) (2.6) q( , , ) = − ( , , ( , , )) So for achieving a given utility level u, the total cost given (p,z) can be written as: , , ( , , ) = ( , , ) −∇ ( , , ) ≡ (2.7)
where ( , , ( , , ))is defined as the mixed cost function. According to Moschini and Rizzi (2007), the
mixed utility function, ( , , )can be derived from equation (2.7). For this, they selected a cost function
from the Gorman Polar form that is affine in u, as follows: ( , , ) = ( , ) + ( , ) (2.8”)
where F and G are continuous and differentiable in p and z. Such a specification allows deriving a closed form
of the mixed utility function from the mixed cost function as follows:
( , , ) = − ( , )+∇ ( , )( , )−∇ ( , ) (2.9)
Following Diewert and Wales (1988) and Moschini and Rizzi (2007), we use a Normalized Quadratic form for
the functions F and G, “to ensure that the chosen parameterization satisfies the requirements of a flexible
functional form”: F( , ) = ( )( ′ ) (2.10) G( , ) = + ( )( ) + 0.5( )( Γ ) + ′ Using the above specification, the mixed demand equations and the mixed utility can be written as follows:
∗ = + ( ) + { + ++ − 0.5 ( ) + 0.5( Γ ) } (2.11)

9
− ∗ = ( ′ ) + [( ) + ( )∑ + ∑ ] (2.11)
= − ′+ 0.5 ( ) − 0.5( )( Γ ) (2.12)
Where i=1,2,..n for the free market products and k=1,2,...m for the quantity determined products. Finally, the
structural estimation equations of the demand system can be written in terms of budget shares as follows: = [ + ( )+ ++ + − 0.5 ( ) + 0.5( Γ ) ] +
(2.10’)
− = [( ) + [( ) + ( ′ ) + ] ] + (2.11’)
The Wi’s and the Wk’s are the budget shares of the goods with predetermined prices and fixed quantities
respectively. and are m x 1 vectors of parameters, B = [β ] is the n x n matrix of parameters, Γ = [γ ]is the m x m matrix of parameters, and are parameters to be estimated. a = [a1, a2, …., an]’ is a vector of
arbitrarily chosen coefficients in order to ensure the homogeneity property. and are error terms.
The estimated parameters of the model will be used to compute price and income elasticities. These elasticities
are used to estimate the quantity response for items with predetermined prices, and for those with pre-
determined quantities, the price response. These allow us to measure the impact of hypothetical reform
scenarios on consumption and therefore on welfare.
4. Results
This section presents the results of the estimation of the Mixed Demand model, including estimates of the price
and income elasticities of each of the PDS items, and based on these, estimates of the welfare impacts of
potential reform scenarios for the PDS. The share equations (2.10’) and (2.11’) of the mixed demand model,
described in Section 3, are estimated using a system of nonlinear Seemingly Unrelated Regression (SUR)

10
criterion, by using iterated feasible generalized least squares (IFGLS).8. The model is estimated by imposing
cross-equation restrictions such as symmetry, adding up and homogeneity constraints. Given that the share
equations sum up to one, we dropped one equation to avoid singularity of the residual covariance matrix.
Parameters of dropped equations are recovered through the homogeneity and symmetry constraints (Moschini
and Rizzi, 2007; Poi, 2008).
The model is estimated assuming that the products with predetermined quantities, Z, are the four ration
products: brown wheat flour, rice, sugar and vegetable oil, representing 98% of ration expenditure. These are
the quantity-rationed items, i.e., items for which only a certain quota can be purchased at the associated prices.
For the X group of foods with predetermined price, we choose to include the free market counterparts of these
rations. These are aggregated into four groups; wheat, sweets, rice and oil.9 The model therefore includes 8
items representing, on average, 35% of food expenditure.
Total expenditure on the eight food items is used as a proxy of income, because measurement errors may be
important with the latter, and because we concentrate on consumption of these eight items only [Löfgren and
El-Said (2001)]. Prices of all commodities are computed as unit values by dividing the product expenditure on
its consumed quantity. All prices are included in their logarithmic form. For the aggregate free market food
groups, the share-weighted Stone formula is used to compute composite price indices:
= ∗.∈
where is the price index for the Ith food group (I=Free market wheat, Free market rice, Free market sweets
and Free market oil), is the share of each product included in group I from the total expenditure of I, and Pi
is its price in logarithmic form.
Table 2 shows the average share of each ration product in the expenditure of the four ration items included in
the model. Brown wheat flour has the highest expenditure share, in both urban and rural areas for all income
quintiles, followed by vegetable oil, sugar and rice. The ration expenditure share is lower in urban areas than
rural areas, which is natural given the lower welfare levels and consequently higher rates of poverty in rural Iraq.
And as expected, the rationed products are mainly consumed by the two lowest expenditure quintiles.
Given that consumption is very heterogeneous across commodity groups, we followed Ramadan and Thomas
(2011) to solve the issue of frequent zero expenditures for some food items in the following way. We estimate
8 The model is estimated using the nlsur command in STATA 13. 9 For more details about the items included in each group, see Appendix I.

11
average shares at the stratum level for the different quintiles in urban and rural areas, instead of the household
level. The choice of aggregating over the stratum level generates a loss in information in the data compared to
an analysis at the household level, but it avoids the need to adopt more sophisticated procedures for dealing
with multiple corner solutions in demand systems [Ramadan and Thomas (2011); Shonkwiler and Yen (1999);
Millimet and Tchernis (2009)].
The share equations (2.10’) and (2.11’) are estimated with all explanatory variables normalized by their sample
mean. The coefficients of vector (a) in the two equations (2.10’) and (2.11’) are set to the mean share of the
different non-rationed product groups. Using the estimated parameters from the mixed demand model,10 we
compute price and income elasticities at the mean of the prices, the quantities and the total expenditure of
different quintile levels in urban and rural areas.11
Price and income elasticities for ration items and equivalent free market products
Overall, the results suggest that except for free market oils, ration items and their closest free market
counterparts are essential in the consumption basket of Iraqis. The own price elasticity of free market cereals
is close to zero for Iraqi households in both urban and rural areas for all the quintiles. In other words,
consumption of cereals (primarily wheat) is inelastic with respect to any changes in the price. Free market rice
consumption is highly inelastic as well, and it constitutes a substitute for wheat in both urban and rural areas
(Table 3).
Compared with cereals/wheat and rice, both free market sugar and oil have higher elasticities for all the quintiles
in both urban and rural areas. However, in absolute terms, their consumption is inelastic with changes to their
own prices. Free market oil is the least inelastic item among the three, with own price elasticity higher than 0.5
for the two lowest quintiles in both urban and rural areas. Both sweets and oil are more important for the higher
income groups as the price elasticities of these two free market products fall with increasing quintiles. For
instance, in urban areas, a 1-unit increase in the price of oil decreases its consumption by 0.84 for the poorest
quintile, while the consumption falls 0.31 units for the richest quintile (Table 3).
Table 4 displays the own quantity mixed elasticities of rationed PDS goods in rural and urban areas, respectively.
The own quantity elasticities of the price equations of the ration goods are negative and less than 1 in absolute
values for all income levels in urban and rural areas. Thus, consumption of ration products is inelastic, and is
more inelastic for the poorest quintiles compared with the richest, given their importance in terms of caloric
10 The estimated parameters from the mixed demand model are available in Appendixes II and III. 11 The elasticities formulas are presented in Appendix IV.

12
contribution to the diet of the less well-off. Among the four products, vegetable oil and sugar are the most
inelastic.
Following the R classification (R for Rations) of Madden (1991), one can define complementary or substitute
rationed goods depending on their price elasticities, as follows. Let and denote two quantity-constrained
goods, with respective prices and . and are substitutes if ( / )( / ) < 0 and complements
otherwise. Let be an unconstrained good with unit price , and are substitutes (respectively
complements) if ( / )( / ) > 0 (respectively < 0) and ( / )( / ) < 0 (respectively > 0)
(Ramadan and Thomas, 2011). Thus, both ration brown (wheat) flour and ration rice are substitutes in rural
and urban areas (Table 4). In addition, ration brown flour is also a substitute for free market cereals but
complementary to free market rice. Rationed rice complements the consumption of free market cereals as well
as free market rice. Moreover, free market sweets and rationed sugar are complements (Table 5 through Table
8). Hence, the results show that, despite the quality difference between the rations and free market goods, they
are complementing each other in the diet of Iraqi households.
Expenditure (income) elasticities are presented in Table 9. Overall, most products show a positive expenditure
elasticity of value less than 1 in both rural and urban areas and across quintiles. This implies that these are
normal goods and necessary goods. But more expensive free market goods have relatively high expenditure
elasticities for all quintiles relative to ration items. At the same time, less well-off households are more
responsive than their well-off counterparts to changes in the prices of free market goods. In other words, less
well-off households would increase their consumption of free market goods (except for free market oils) to a
greater degree when faced with an increase in their incomes.
Free market cereals, rice and sweets are normal goods for all income levels in both urban and rural areas.
Expenditure elasticities for these three products decrease with the income level. For instance, in rural areas, a
one-unit increase in income increases consumption of wheat, rice and sweets by 0.086, 0.353 and 0.359
respectively for the lowest income group compared with an increase of 0.033, 0.072 and 0.166 units respectively
for the highest income group. Comparing rural and urban areas, there is no significant difference in elasticities
of the three items.
Surprisingly, free market oil is considered as an inferior good for all income groups in rural areas, a result that
requires more investigation. Subsidized or rationed brown flour is also an inferior good for urban households,
showing that an increase in income will yield to a decrease in consumption of PDS brown flour with an increase
in its substitute, free market cereals. Surprisingly, it is the opposite for ration oil; an increase in income increases
subsidized oil consumption and decreases the consumption of free market oil.
13
How would consumers adjust their consumption responses over time?
Given the lack of information of future consumer responses to changes in prices and expenditure, one way to
understand behavior over time is by exploiting the spatial disparities that Iraq has. In other words, consumer
behavior in better off regions may be a rough approximation of how less well-off regions today will behave in
the future as their welfare levels improved, holding everything else constant. Thus, we consider how households
would adjust their consumption patterns over time, as welfare levels improved, by comparing current demand
responses in Kurdistan and the rest of Iraq. We take Kurdistan (i.e. three north-east governorates: Erbil, Duhok
and Sulaimaniya) as the reference region because their current consumption levels of ration items are the lowest
in the country and because their per capita expenditure levels are the highest on average.
Similar consumption responses to changes in own prices of ration and free market goods are seen for Kurdistan
and for the rest of Iraq relative to previous findings for urban and rural areas (Table 10). Overall, most goods
are ordinary goods meaning that demand for this type of goods decreases when there is an increase in their
own prices. Not surprisingly, demand for ration items is much less elastic than free market goods. However, all
level responses are higher in Kurdistan than in the rest of Iraq and higher than the estimates for urban areas
shown above. At the same time, well-off households in Kurdistan region are much more responsive to
variations in prices of ration goods and the opposite is true for their free market equivalents, compared to the
rest of Iraq and urban Iraq. In other words, in line with higher welfare levels in Kurdistan relative to urban Iraq,
and in urban Iraq relative to rural Iraq, the flexibility of consumer demand to changes in prices increases. Thus,
as the economy grows, consumers in Iraq will likely face a larger set of options and the ability to substitute away
from ration items and increase their consumption of free market goods. Similarly, if economic conditions
worsen, consumer dependence on rations and their inelasticity of response will likely increase.
This pattern in consumer behavior is quite clear when inspecting demand responses for goods to variations in
total household expenditure and income. In general, most ration items are marginally “inferior” goods in the
Kurdistan region irrespective of the level of per capita consumption. In other words, as household expenditures
increase by 10 percent, demand will fall by between 0.4 and 3.4 percent for brown flour and by around 0.7
percent for rice (Table 11). Opposite responses are obtained in the Rest of Iraq: ration items are considered
“normal” goods. We speculate therefore that, as the economy evolves and the levels of income increase across
the distribution, and as the rest of the country approaches the higher welfare levels of Kurdistan, these types
of ration goods would be less demanded.
Welfare analysis
The elasticities estimated above permit the measurement of changes in consumer welfare induced by changes
in the PDS. More precisely, these elasticities are used to compute the change in the total expenditure of the

14
households and the different product shares in total expenditures when faced with a removal of the PDS. The
implicit assumption here is that since PDS goods have predetermined quantities, households will procure these
on the market in the absence in of the PDS. Thus, the removal of any of the subsidized products will yield a
change in the consumption of their free market counterpart as well as in the corresponding free market prices.
Consumers will react to the removal of the subsidized quota by adjusting their consumption of the other free
market products consumed. This will yield a change in their total expenditure.
Two sets of reform scenarios for the PDS are implemented to illustrate its distributional impact. Both sets
consider the complete removal of the PDS only in urban households – in other words, urban households will
no longer be able to purchase wheat, rice, sugar and oil up to their quota at the subsidized prices. Such a
scenario, with phased implementation of reform beginning with urban areas, is plausible for logistical and
implementation reasons, and for welfare considerations. We focus only on households living in urban areas
because these have relatively better initial conditions than their rural counterparts, which might ease the
implementation of the reform. Even though the reduction in rural poverty has been significantly higher than
in urban areas between 2007 and 2012, rural poverty levels remain double those in urban areas [World Bank
(2014a)]. Moreover, urban households presumably have better access to free market products than those living
in rural areas. This would make the implicit assumption of being able to substitute PDS goods for their free
market counterparts reasonable.
The first set of scenarios (i.e. Scenarios A) focuses on removing the rations products from the highest two
income quintiles in urban areas. The implementation of such a scenario assumes the ability to relatively well-
target PDS beneficiaries in urban areas and exclude the top 40% of the welfare distribution from the program.
This extreme case would have no impact on rural areas or on the urban poor. In other words, we are excluding
the public transfer from those segments of the population which may need them the least or who could
reasonably adjust their consumption or a combination of both, given their relative better-off welfare conditions.
To measure the household responses to changes in the PDS, we gradually remove the quotas in increasing
order of the share of each ration item in the total expenditure. More precisely, scenarios A are defined as
follows:
Scenario A1: decrease the ration rice quota by 100% for the two highest quintiles in urban areas;
Scenario A2: Scenario A1 in addition to the decrease of the ration vegetable oil quota by 100% for the
two highest quintiles in urban areas;
Scenario A3: Scenario A2 in addition to the decrease of the sugar quota by 100% for the two highest
quintiles in urban areas;
Scenario A4: scenario A3 in addition to the decrease of the brown flour quota by 100% for the two
highest quintiles in urban areas.

15
Given the substitutive and complementary relations between the ration products and free market products; the
prices and quantities for each product will change based on the own price and cross price elasticities estimated.
According to scenarios A, the removal of the quotas of each of the subsidized products will result in an increase
in the shares of the other subsidized products and free market products in total expenditures (Figures 4-7). The
removal of the quotas for each subsidized product represents a decrease in its share in total expenditures by
100%, computed with respect to the initial value of expenditure on that product.
Overall, the highest increase in expenditures because of the removal of subsidies is observed for free market
oil. Under scenario A1 (Figure 4), where only the rice quota was removed, the free market oil share increases
by 17% and 20% for the fourth and fifth quintiles respectively. Under scenario A4 (Figure 7), where all
subsidized products were removed, the shares of free market oil increase by 116% and 107%, compared with
its original share, for the fourth and fifth quintiles respectively. This high impact is not surprising given the
large cross price elasticities of free market oil with respect to all subsidized products.
Under scenario A1, the removal of the rice quota will increase the expenditure shares on its free market
counterpart by 5% and 2% for the fourth and fifth quintile, respectively. And given the complementarity
between the rationed rice and free market cereals, we find that the removal of rice quota increases free market
cereals share by 1% for the fourth quintile while it deceases by 3% for the fifth quintile. At the same time, the
share of expenditures on subsidized flour will increase, as it is a substitute for PDS rice (Figure 4).
The removal of the subsidized sugar (Scenario A3), in addition to the subsidized rice and oil, results in an
increase in the share of its free market counterpart by 52% and 20% for the fourth and fifth income groups
respectively. Eliminating the quotas for all four subsidized products (Scenario A4) results in a large increase in
the share of the free market products. For the fourth quintile urban households, their share of free market
cereals, rice and sweet increase by 61%, 53% and 24%, respectively. The impact is lower in the case of the fifth
quintile, whose shares of free market cereals, free market rice and free market sweet increase by 31%, 27% and
11%, respectively. These results are not surprising given that households should compensate for the removal
of the subsidized products through an increase in expenditures on their free market counterparts.
The second set of scenarios (Scenarios B) involves the removal of access to rations products from all income
quintiles in urban areas. While for Scenarios A, only the highest income quintiles of urban areas were affected,
for Scenarios B, all urban areas will be affected with no impact on rural areas. This is a strong assumption, given
that markets are interlinked and may be difficult to isolate such change from affecting the rural areas. Moreover,
when such policies are applied, this may result in black market and leakage if no strong targeting policies are
implemented. However, this assumption is used for simplification of the analysis.
16
Similarly, as in Scenarios A, the different quotas will be removed gradually according to the importance of the
share of each ration item. More precisely, scenarios B are:
Scenario B1: decrease the ration rice quota by 100% in urban areas.
Scenario B2: ScenarioA1 in addition to the decrease of the ration vegetable oil quota by 100% in urban
areas.
Scenario B3: Scenario A2 in addition to the decrease of the sugar quota by 100% in urban areas.
Scenario B4: scenario A3 in addition to the decrease of the brown flour quota by 100% in urban areas.
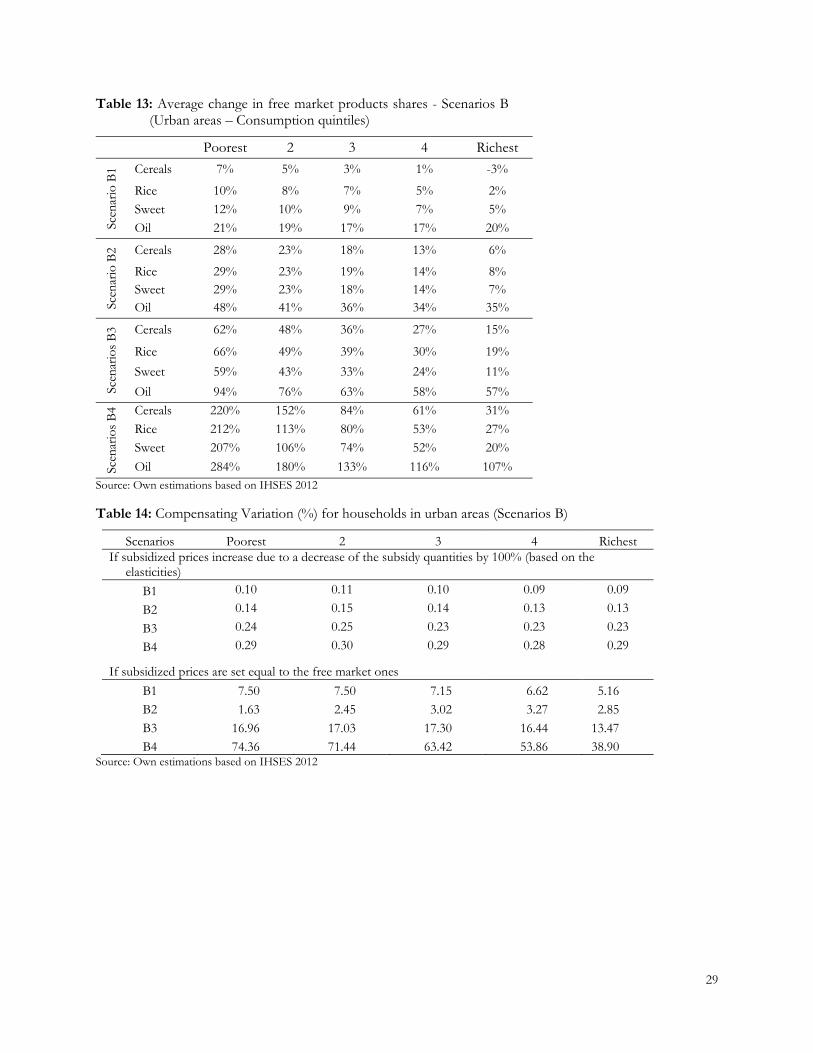
Under scenarios B, the urban poor are the most affected, given the importance of the subsidized products in
their diet. Eliminating rice subsidies will increase the expenditure share of its free market counterpart by 10%
for the poorest households compared with only 2% for the richest (Table 13). While removing the quotas of
the four subsidized products will yield an increase in the share of their free market counterparts by more than
200% for the lowest quintiles compared with an increase of less than 50% for the richest group, except for oil,
whose share increases by more than 100% for the richest group.
Holding incomes constant, such increases in expenditure shares imply that affected households will likely have
to cut back on other food and non-food expenditures. A more direct measure of the utility or welfare impact
of the removal of the PDS can be estimated by computing the Compensating Variation (CV). The CV
represents the difference between the minimum expenditure required to attend an original level of utility at the
new price level and the initial level of expenditure that is the minimum expenditure required to achieve this
original utility level at the initial prices [Ackah and Appleton (2007); Huang and Huang (2009)]. As explained
by Huang and Huang (2009), holding the utility level constant, the CV reflects the change of the expenditure
necessary to compensate consumers for the effects of the change in prices from to . The CV can be
written as follows:
= ( , ) − ( , ) Following Ramadan and Thomas (2011), the subsidized price is the initial price , while is the new price
after the removal of subsidies. A negative (positive) CV means that the change in prices results in an increase
(decrease) of the consumer’s welfare [Ackah and Appleton (2007); Huang and Huang (2009)]. Positive change
represents an increase in the expenditure with the new prices to keep the same initial utility level. This means a
decrease in the consumer’s welfare.
Assuming that the households will continue consuming the same quotas but the subsidized price will increase
as if the quotas were removed (i.e. the quantity decreases by 100%), households will have to increase their total

17
expenditure to keep their utility level constant. Table 14 shows the compensating variation is positive for all
households under Scenario B. This implies that the removal of subsidies will result in a decrease in their welfare.
The two lowest income quintiles are the most affected by this reform, given the importance of the subsidized
products in their total expenditures. The elimination of access to subsidized rice will require compensating the
poorest households by 0.10% of their total expenditures to maintain their welfare level, compared with 0.09%
for the richest group. While the removal of all the subsidies will have almost the same impact on all income
groups; they would need to be compensated by around 0.3% of their total expenditures. This low level of CV
can be explained by the fact that the increase in the price resulting from a decrease of the quota by 100% is
very low given the low own price elasticities.
However, if the previously subsidized products are only available at the prices of the free market counterparts
(or at relatively similar prices, which is a reasonable assumption), this will imply an important change in the
households’ total expenditures (Table 14) to keep utility constant, especially for the poor households. The
removal of all subsidies in this case will require compensating poor households by 74.4% of their expenditures
compared with nearly 40% for the richest. This large decrease in the households’ welfare reflected by the high
positive value of compensating variation is due to the high price differential between the official/subsidized
prices and free market prices.

18
5. Concluding Remarks
The poorer segments of the consumption distribution in Iraq are disproportionately dependent on public and
private transfers to supplement their relatively low earnings on the labor market [World Bank (2014)]. Most of
these transfers are however, small, and cover a fraction of the poor. The single exception is the Public
Distribution System, which guarantees a minimum amount of caloric consumption for not just the poor, but
the whole population.
Given the universality of consumption of PDS goods, the lack of a market for ration items, and the low levels
of income for much of the population [World Bank (2014)], household consumption of PDS items is relatively
inelastic to changes in price. The own quantity elasticities of price are negative and less than 1 in absolute values
for all income levels in urban and rural areas. However, they are more inelastic for the poorest quintiles
compared with the richest, given their importance in terms of caloric contribution to the diet of the less well-
off. In addition, for much of the population, these goods are not inferior, but rather normal goods. Most
products show a positive expenditure elasticity of value less than 1 in both rural and urban areas and across
quintiles.
However, there are some signs that with improvements in welfare levels, and faced with well-functioning
markets, some segments of the population are substituting away from the PDS and increasing their
consumption of market substitutes. For instance, most ration items are marginally “inferior” goods in the
Kurdistan region irrespective of the level of per capita consumption, while the opposite occurs in the rest of
Iraq where ration items are considered “normal” goods.
Overall, our findings suggest that any one-shot reform of the PDS will have adverse and sizeable welfare
impacts. The removal of all subsidies will require compensating the poor households by 74.4% of their
expenditures compared with nearly 40% for the richest in urban areas. However, over time, and with increases
in welfare, some households may not be as significantly affected.

19
References
Ackah, C.and Appleton, S., 2007, “Food price changes and consumer welfare in Ghana in the 1990’s”, CREDIT Research Paper. University of Nottingham. No.07/03
Bhagwati, J.N. and Sihag, B.S., 1980, “Dual Markets, Rationing, and Queues”, The Quarterly Journal of Economics, Vol.95, No.4, pp 775-779
Chavas, J-P, 1984, “The theory of Mixed Demand Functions”, European Economic Review Vol. 24, No3, pp 321-344
Deaton, A. and Tarozzi, A., 2000, “Prices and poverty in India” Research in Development Studies, Princeton University
Diewert, W.E and Wales, T.J., 1987, “Flexible Functional Forms and Global Curvature Conditions”, Econometrica, Vol. 55, No. 1, pp. 43-68
Diewert, W.E and Wales, T.J., 1988, “Normalized Quadratic Systems of Consumer Demand Fucntions”, Journal of Business and Economic Statistics 6:303-312.
FAO, 2006, “Development in the European Agrifood Markets: Impacts on producers and Consumers and Perspectives”. European Commission on Agriculture. Thirty Fourth Session.
FAO, 2014- GIEWS-Iraq: http://www.fao.org/giews/countrybrief/country.jsp?code=IRQ. Visited in February 2015
Foster, A. and Hahn, J., 2000, “A consistent semiparametric estimation of the consumer surplus distribution”, Economics Letters, Vol. 69, No 3, pp 245-251
Gajanan, S.N., Ramaiah, K.C., 1996, “An econometric estimation of Hicksian and Marshallian elasticities in Indian Manufacturing”, Southern Economic Journal, Vol.63, No.2, pp 406-417
Gao, X.M., Wailes, E.J. and Cramer, G.L., 1996, “Partial Rationing and Chinese urban household food demand analysis”, Journal of Comparative Economics, Vol 22, Issue 1, pp 43-62
Gibson, J., 2007, “A guide to using prices in Poverty Analysis” World Bank, Washington, DC
Guilkey, D.K., Knox Lovell, C.A. and Sickles, R.C., 1983, “A comparison of the performance of three flexible functional forms”, International Economic Review, Vol.24, No.3, pp.591-616
Hausman, J.A. and Newey, W.K., 1995, “Nonparametric Estimation of Exact consumer surplus and Deadweight Loss”, Econometrica, Vol 63, No.6, pp 1445-1476
Houthakker, H.S. and Tobin, J., 1952, “Estimates of the free demand for rationed foodstuffs”, The Economic Journal, Vol 62, No.245, pp 103-118
Houthakker, H.S. and Tobin, J., 1951, “The effects of rationing on demand elasticities”, Review of Economic Studies, Vol 18, No.3, p140-153
Huang, K and S. Huang, 2009 “How Increased Food and Energy Prices Affect Consumer Welfare”, in Agricultural & Applied Economics Association 2009 AAEA & ACCI Joint Annual Meeting, Milwaukee, Wisconsin
Huffman, S.K. and Johnson, S.R., 2004,” Empirical tests of Impacts of Rationing: The case of Poland in Transition”, Economic Systems 28: 79–99
Madden, P, 1991. “A generalization of Hicksian q substitutes and complements with application to demand rationing”, Econometrica Vol. 59, No 5, pp. 1497-1508
Matsuda, T., 2004, “Incorporating Generalized marginal budget shares in a mixed demand system”, American Journal of Agricultural Economics, Vol. 86, No 4, pp. 1117-1127

20
Moschini, G. C. and Rizzi, P.L., 2006, “Coherent specification of a mixed demand system: The Stone-Geary model” in Exploring Frontiers in Applied Economics: Essays in honor of Stanley R. Johnson, edited by M. Holt and J-P, Chavas, Electronic Press, Berkeley
Moschini, G. C. and Rizzi, P.L., 2007, “Deriving a flexible mixed demand system: The normalized Quadratic Model”, American Journal of Agricultural Economics, Vol. 89, No 4, pp. 1034-1045
Moschini, G. C., 1998, “The semi flexible Almost Ideal Demand System”, European Economic Review, Vol. 42, No 2, pp. 349- 364
Pendakur, K. and Sperlisch, S., 2010, “Semi parametric estimation of consumer demand systems in real expenditure”, Journal of Applied Econometrics”, Vol 25, Issue 3, pp 420-457
Poi, B.P., 2008, “ Demand-System estimation: Update”. The Stata Journal 8, Number 4, pp.554-556.
Ramadan, R., and Thomas, A., 2011, “Evaluating the impact of reforming the food subsidy program in Egypt: A Mixed Demand approach”, Food Policy, Vol. 36, No. 5, pp. 637-645
Ryan, D.L. and Wales, T.J., 1998, “A Simple Method for Imposing Local Curvature n Some Flexible Consumer-Demand Systems”, Journal of Business and Economic Statistics, Vol. 16, No. 3, pp. 331-338
Samuelson, P.A. 1965, “Using Full duality to show that simultaneously Additive Direct and Indirect Utilities implies Unitary Price Elasticity of Demand”, Econometrica, Vol 33, No.4, pp781-796.
Silva, J., Levin, V. and Morgandi, M., 2013, “Inclusion and Resilience: The Way Forward for Safety Nets in the Middle East and North Africa”, Washington, DC: World Bank
World Bank, 2011, “Confronting Poverty in Iraq. Main Findings”, Washington, DC.
World Bank, 2013, “Poverty in Iraq: 2007-2012. Methodological Note”, Washington, DC.
World Bank, 2014a, “The Unfulfilled Promise of Oil and Growth: Poverty, Inclusion and Welfare in Iraq, 2007-2012” Washington, DC
World Bank, 2014b, “Expanding Protection to the Poor and Vulnerable.” POLICY NOTE III, Washington, DC.
21
Table 1: Average share of ration expenditure in total food expenditure by consumption groups in urban and rural areas (%)
Consumption Quintiles
Poorest 2 3 4 Richest
Rural 47.3 26.5 20.1 15.1 9.4
Urban 43.8 26.9 20.3 14.9 8.8
Total 45.9 26.8 20.2 15.0 8.9 Source: Own estimations based on IHSES 2012.
Table 2: Average shares of ration items to total expenditure of the 4 food items used in the analysis (%) Quintile Poorest 2 3 4 Richest
Rur
al
Brown Flour 32.9 28.1 24.7 21.4 16.1
Rice 13.4 10.8 9.6 7.8 6.0
Vegetable Oil 20.1 17.4 15.5 13.9 10.9
Sugar 16.7 14.5 13.0 11.5 9.1
Urb
an Brown Flour 30.7 26.1 22.1 18.0 12.7
Rice 12.8 11.2 9.2 7.5 5.0
Vegetable Oil 19.4 17.0 15.2 13.3 10.5
Sugar 16.1 14.5 13.0 11.5 9.2 Source: Own estimations based on IHSES 2012.

22
Table 3: Price Elasticities of Free Market Goods
Poorest 2 3 4 Richest
Rural Areas
Cereals with respect to price of Cereals -0.003 -0.004 -0.001 0.000 -0.004
Rice 0.022 0.011 0.011 0.011 0.006
Sweets -0.062 -0.043 -0.037 -0.032 -0.030
Oils -0.025 -0.007 -0.013 -0.017 -0.019
Rice with respect to price of Cereals 0.083 0.044 0.034 0.026 0.010
Rice -0.019 -0.015 -0.008 -0.006 -0.005
Sweets -0.062 -0.046 -0.031 -0.025 -0.019
Oils -0.282 -0.162 -0.134 -0.120 -0.089
Sweets with respect to price of Cereals -0.062 -0.050 -0.035 -0.028 -0.028
Rice -0.036 -0.029 -0.020 -0.017 -0.018
Sweets -0.035 -0.034 -0.026 -0.024 -0.032
Oils -0.151 -0.092 -0.110 -0.124 -0.155
Oil with respect to price of Cereals 0.201 0.104 0.076 0.068 0.038
Rice 0.180 0.088 0.067 0.068 0.039
Sweets 0.394 0.202 0.164 0.159 0.092
Oils -0.761 -0.378 -0.288 -0.280 -0.105
Urban Areas Cereals with respect to price of
Cereals 0.003 0.002 0.002 0.001 0.001
Rice 0.023 0.017 0.015 0.012 0.011
Sweets -0.058 -0.041 -0.036 -0.031 -0.027
Oils -0.015 -0.016 -0.014 -0.013 -0.019
Rice with respect to price of Cereals 0.091 0.067 0.045 0.031 0.019
Rice -0.017 -0.012 -0.008 -0.006 -0.002
Sweets -0.077 -0.054 -0.039 -0.031 -0.021
Oils -0.273 -0.222 -0.162 -0.129 -0.116
Sweets with respect to price of Cereals -0.045 -0.034 -0.027 -0.023 -0.018
Rice -0.028 -0.021 -0.017 -0.015 -0.010
Sweets -0.035 -0.026 -0.024 -0.024 -0.023
Oils -0.117 -0.112 -0.107 -0.108 -0.170
Oil with respect to price of Cereals 0.171 0.139 0.095 0.078 0.054
Rice 0.182 0.148 0.109 0.094 0.073
Sweets 0.423 0.336 0.247 0.212 0.162
Oils -0.843 -0.696 -0.509 -0.429 -0.313 Source: Own estimations based on IHSES 2012.

23
Table 4: Own quantity mixed elasticities of ration items Poorest 2 3 4 Richest Rural Areas
Brown flour price with respect to:
Rat
ion
Brown Flour -0.032 -0.034 -0.041 -0.047 -0.066
Rice -0.005 -0.001 -0.004 -0.007 0.002
Sugar 0.034 0.033 0.043 0.051 0.062
Vegetable Oil 0.018 0.021 0.024 0.027 0.042
Rice price with respect to:
Rat
ion
Brown Flour -0.004 -0.004 -0.005 -0.006 -0.009
Rice -0.030 -0.030 -0.036 -0.042 -0.050
Sugar 0.020 0.020 0.025 0.028 0.036
Vegetable Oil -0.043 -0.045 -0.054 -0.062 -0.082
Sugar price with respect to:
Rat
ion
Brown Flour 0.012 0.012 0.015 0.017 0.023
Rice 0.010 0.010 0.012 0.014 0.018
Sugar -0.006 -0.006 -0.008 -0.009 -0.013
Vegetable Oil 0.004 0.004 0.005 0.006 0.008
Vegetable Oil price with respect to:
Rat
ion
Brown Flour 0.004 0.004 0.005 0.006 0.008
Rice -0.012 -0.013 -0.016 -0.018 -0.024
Sugar 0.002 0.002 0.002 0.002 0.003
Vegetable Oil -0.001 -0.001 -0.001 -0.002 -0.002 Urban Areas
Brown Flour price with respect to:
Rat
ion
Brown Flour -0.030 -0.034 -0.037 -0.042 -0.059
Rice -0.009 -0.011 -0.012 -0.013 -0.018
Sugar 0.035 0.041 0.046 0.053 0.082
Vegetable Oil 0.016 0.018 0.020 0.024 0.035
Rice price with respect to:
Rat
ion
Brown Flour -0.004 -0.004 -0.005 -0.006 -0.008
Rice -0.028 -0.033 -0.035 -0.039 -0.051
Sugar 0.019 0.022 0.024 0.027 0.041
Vegetable Oil -0.041 -0.049 -0.054 -0.061 -0.092
Sugar price with respect to:
Rat
ion
Brown Flour 0.011 0.013 0.014 0.016 0.023
Rice 0.009 0.010 0.011 0.013 0.017
Sugar -0.006 -0.006 -0.007 -0.008 -0.013
Vegetable Oil 0.004 0.004 0.005 0.005 0.008
Vegetable Oil price with respect to:
Rat
ion
Brown Flour 0.004 0.004 0.005 0.005 0.007
Rice -0.012 -0.014 -0.015 -0.017 -0.023
Sugar 0.002 0.002 0.002 0.002 0.004
Vegetable Oil -0.001 -0.001 -0.001 -0.002 -0.003 Source: Own estimations based on IHSES 2012

24
Table 5: Elasticities of free market goods with respect to ration items in Rural Areas - quintiles Poorest 2 3 4 Richest
Cereals with respect to:
Rat
ion
Brown Flour -0.034 -0.021 -0.015 -0.008 -0.003
Rice 0.116 0.068 0.059 0.048 0.035
Sugar 0.008 0.005 0.004 0.002 0.001
Vegetable Oil -0.025 -0.016 -0.013 -0.010 -0.007
Rice with respect to:
Rat
ion
Brown Flour 0.300 0.184 0.131 0.102 0.061
Rice 0.085 0.051 0.035 0.027 0.015
Sugar -0.017 -0.010 -0.008 -0.006 -0.004
Vegetable Oil -0.009 -0.006 -0.004 -0.003 -0.001
Sweets with respect to:
Rat
ion
Brown Flour 0.245 0.162 0.139 0.120 0.100
Rice 0.033 0.021 0.018 0.014 0.010
Sugar 0.060 0.042 0.034 0.028 0.022
Vegetable Oil 0.014 0.009 0.009 0.008 0.007
Oil with respect to:
Rat
ion
Brown Flour -1.107 -0.532 -0.432 -0.395 -0.227
Rice -0.313 -0.150 -0.123 -0.116 -0.066
Sugar -0.086 -0.042 -0.035 -0.033 -0.018
Vegetable Oil -0.074 -0.037 -0.030 -0.027 -0.016 Source: Own estimations based on IHSES 2012
Table 6: Elasticities of ration item’s price with respect to free markets goods’ price in rural areas - quintiles Poorest 2 3 4 Richest
Ration Brown flour with respect to
Fre
e m
arke
t
Cereals 0.088 0.103 0.093 0.067 0.058
Rice -0.408 -0.405 -0.494 -0.627 -0.866
Sweets -0.342 -0.360 -0.465 -0.582 -0.782
Oils 0.976 0.989 1.211 1.477 1.910
Ration Rice with respect to
Fre
e m
arke
t
Cereals -0.205 -0.204 -0.239 -0.255 -0.291
Rice -0.064 -0.062 -0.073 -0.087 -0.111
Sweets -0.012 -0.012 -0.013 -0.013 -0.012
Oils 0.235 0.230 0.275 0.306 0.364 Ration Sugar with respect to
Fre
e m
arke
t
Cereals -0.009 -0.009 -0.010 -0.009 -0.007
Rice 0.001 0.001 0.002 0.003 0.006
Sweets -0.036 -0.039 -0.048 -0.056 -0.071
Oils 0.020 0.021 0.029 0.036 0.045
Ration Vegetable oil with respect to
Fre
e m
arke
t
Cereals 0.021 0.021 0.024 0.024 0.025
Rice 0.009 0.009 0.010 0.012 0.014
Sweets 0.000 0.000 0.000 -0.002 -0.005
Oils -0.015 -0.015 -0.016 -0.016 -0.018 Source: Own estimations based on IHSES 2012

25
Table 7: Elasticities of free market goods with respect to ration items in Urban Areas - quintiles Poorest 2 3 4 Richest Cereals with respect to ration of:
Rat
ion
Brown Flour -0.028 -0.017 -0.012 -0.008 -0.003
Rice 0.092 0.067 0.053 0.043 0.033
Sugar 0.007 0.005 0.003 0.002 0.001
Vegetable Oil -0.021 -0.015 -0.012 -0.010 -0.008 Rice with respect to ration of:
Rat
ion
Brown Flour 0.318 0.231 0.160 0.119 0.078
Rice 0.090 0.065 0.043 0.031 0.018
Sugar -0.016 -0.012 -0.008 -0.006 -0.005
Vegetable Oil -0.011 -0.008 -0.005 -0.004 -0.002 Sweets with respect to ration of:
Rat
ion
Brown Flour 0.197 0.156 0.129 0.109 0.103
Rice 0.026 0.020 0.015 0.012 0.010
Sugar 0.051 0.040 0.032 0.027 0.025
Vegetable Oil 0.011 0.010 0.008 0.007 0.008 Oil with respect to ration of:
Rat
ion
Brown Flour -0.994 -0.778 -0.555 -0.463 -0.354
Rice -0.281 -0.225 -0.157 -0.133 -0.098
Sugar -0.082 -0.067 -0.048 -0.042 -0.035
Vegetable Oil -0.067 -0.053 -0.038 -0.032 -0.026 Source: Own estimations based on IHSES 2012 Table 8: Elasticities of Ration items’ prices with respect to Free Market goods’ prices in Urban Areas
Poorest 2 3 4 Richest Ration Brown flour with respect to
Fre
e m
arke
t
Cereals 0.067 0.063 0.054 0.048 0.021
Rice -0.422 -0.500 -0.574 -0.667 -1.002
Sweets -0.393 -0.463 -0.537 -0.627 -0.932
Oils 1.063 1.227 1.389 1.581 2.250 Ration price of rice with respect to
Fre
e m
arke
t
Cereals -0.181 -0.210 -0.219 -0.230 -0.296
Rice -0.063 -0.073 -0.080 -0.089 -0.126
Sweets -0.013 -0.014 -0.014 -0.013 -0.013
Oils 0.210 0.249 0.263 0.283 0.385 Ration price of sugar with respect to
Fre
e m
arke
t
Cereals -0.010 -0.010 -0.010 -0.010 -0.009
Rice 0.000 0.001 0.001 0.002 0.005
Sweets -0.042 -0.048 -0.054 -0.061 -0.085
Oils 0.027 0.031 0.037 0.042 0.063 Ration price of oil with respect to
Fre
e m
arke
t
Cereals 0.019 0.021 0.022 0.022 0.026
Rice 0.010 0.011 0.012 0.012 0.016
Sweets 0.001 0.000 -0.001 -0.002 -0.005
Oils -0.013 -0.014 -0.015 -0.015 -0.020 Source: Own estimations based on IHSES 2012

26
Table 9: Expenditure Elasticities by Quintile of Per Capita Consumption and Area
Ration products Equivalent Free Market Product
Brown Flour
Rice Sugar Vegetable
Oil Cereal Rice Sweets Oils
Rural 1 0.015 -0.024 0.005 0.021 0.086 0.353 0.359 -0.017
2 0.084 -0.005 0.006 0.023 0.054 0.227 0.259 -0.021
3 0.059 -0.009 0.005 0.027 0.045 0.155 0.213 -0.022
4 0.027 0.003 0.005 0.030 0.037 0.118 0.180 -0.013
5 0.263 0.082 0.017 0.044 0.033 0.072 0.166 -0.046
Urban 1 -0.057 -0.008 0.000 0.019 0.060 0.359 0.292 0.087
2 -0.073 -0.014 0.000 0.022 0.044 0.256 0.224 0.085
3 -0.093 -0.004 -0.001 0.025 0.035 0.175 0.187 0.061
4 -0.088 0.012 -0.001 0.028 0.029 0.129 0.162 0.042
5 -0.146 0.035 -0.002 0.041 0.023 0.082 0.152 0.017 Source: Own estimations based on IHSES 2012
Table 10: Own-Price Elasticities of Ration Items by quintile of per-capita consumption and area, 2012
Ration products Equivalent Free Market Product
Brown Flour
Rice Sugar Vegetable
Oil Cereal Rice Sweets Oils
Kurdistan
1 -0.032 -0.038 -0.006 -0.005 0.010 -0.004 -0.013 -1.034
2 -0.037 -0.046 -0.007 -0.007 0.006 -0.002 -0.005 -0.941
3 -0.040 -0.044 -0.007 -0.007 0.003 -0.004 -0.013 -0.457
4 -0.048 -0.055 -0.009 -0.009 0.005 0.000 -0.011 -0.541
5 -0.076 -0.080 -0.016 -0.015 0.006 0.002 -0.010 -0.398
Rest of Iraq
1 -0.030 -0.029 -0.005 -0.004 0.009 -0.007 -0.048 -0.533
2 -0.033 -0.032 -0.006 -0.005 0.007 -0.005 -0.035 -0.370
3 -0.038 -0.038 -0.007 -0.005 0.007 0.000 -0.028 -0.321
4 -0.043 -0.042 -0.007 -0.006 0.006 0.000 -0.026 -0.271
5 -0.058 -0.053 -0.011 -0.009 0.003 0.000 -0.029 -0.133 Source: Own estimations based on IHSES 2012

27
Table 11: Expenditure Elasticities by Quintile of Per Capita Consumption and Region
Ration products Equivalent Free Market Product
Brown Flour
Rice Sugar Vegetable
Oil Cereal Rice Sweets Oils
Kurdistan 1 -0.04 -0.07 0.00 0.03 0.04 0.29 0.21 0.16
2 -0.10 -0.11 0.00 0.03 0.04 0.18 0.20 0.17
3 -0.02 -0.07 0.00 0.04 0.03 0.12 0.18 0.06
4 -0.13 -0.07 0.00 0.04 0.03 0.09 0.15 0.08
5 -0.34 -0.07 -0.01 0.07 0.02 0.06 0.14 0.05
Rest of Iraq 1 0.03 0.01 0.00 0.02 0.090 0.46 0.37 -0.13
2 0.05 0.02 0.00 0.03 0.06 0.35 0.25 -0.09
3 0.00 0.02 0.00 0.03 0.04 0.25 0.21 -0.07
4 -0.02 0.03 0.00 0.03 0.03 0.20 0.17 -0.06
5 0.06 0.09 0.00 0.05 0.03 0.12 0.16 -0.06 Source: Own estimations based on IHSES 2012
Table 12: Average change in subsidized products shares - Scenarios B (Urban areas -Consumption quintiles)
Poorest 2 3 4 Richest
Scen
ario
B1 Rice -100% -100% -100% -100% -100%
Oil 15% 13% 11% 10% 10%
Sugar 13% 11% 9% 8% 6%
Flour 14% 12% 10% 9% 8%
Scen
ario
B2 Rice -100% -100% -100% -100% -100%
Oil -100% -100% -100% -100% -100%
Sugar 31% 25% 20% 16% 10%
Flour 31% 25% 20% 16% 11%
Scen
ario
B3 Rice -100% -100% -100% -100% -100%
Oil -100% -100% -100% -100% -100%
Sugar -100% -100% -100% -100% -100%
Flour 67% 50% 38% 30% 18%
Scen
ario
B4 Rice -100% -100% -100% -100% -100%
Oil -100% -100% -100% -100% -100%
Sugar -100% -100% -100% -100% -100%
Flour -100% -100% -100% -100% -100%
Poorest 2 3 4 Richest
Scen
ario
B1 Rice -100% -100% -100% -100% -100%
Oil 15% 13% 11% 10% 10%
Sugar 13% 11% 9% 8% 6%
Flour 14% 12% 10% 9% 8%

28
Scen
ario
B2 Rice -100% -100% -100% -100% -100%
Oil -100% -100% -100% -100% -100%
Sugar 31% 25% 20% 16% 10%
Flour 31% 25% 20% 16% 11%
Scen
ario
B3 Rice -100% -100% -100% -100% -100%
Oil -100% -100% -100% -100% -100%
Sugar -100% -100% -100% -100% -100%
Flour 67% 50% 38% 30% 18%
Scen
ario
B4 Rice -100% -100% -100% -100% -100%
Oil -100% -100% -100% -100% -100%
Sugar -100% -100% -100% -100% -100%
Flour -100% -100% -100% -100% -100%
Poorest 2 3 4 Richest
Scen
ario
B1 Rice -100% -100% -100% -100% -100%
Oil 15% 13% 11% 10% 10%
Sugar 13% 11% 9% 8% 6%
Flour 14% 12% 10% 9% 8%
Scen
ario
B2 Rice -100% -100% -100% -100% -100%
Oil -100% -100% -100% -100% -100%
Sugar 31% 25% 20% 16% 10%
Flour 31% 25% 20% 16% 11%
Scen
ario
B3 Rice -100% -100% -100% -100% -100%
Oil -100% -100% -100% -100% -100%
Sugar -100% -100% -100% -100% -100%
Flour 67% 50% 38% 30% 18%
Scen
ario
B4 Rice -100% -100% -100% -100% -100%
Oil -100% -100% -100% -100% -100%
Sugar -100% -100% -100% -100% -100%
Flour -100% -100% -100% -100% -100% Source: Own estimations based on IHSES 2012
29
Table 13: Average change in free market products shares - Scenarios B (Urban areas – Consumption quintiles)
Poorest 2 3 4 Richest
Scen
ario
B1 Cereals 7% 5% 3% 1% -3%
Rice 10% 8% 7% 5% 2% Sweet 12% 10% 9% 7% 5% Oil 21% 19% 17% 17% 20%
Scen
ario
B2 Cereals 28% 23% 18% 13% 6%
Rice 29% 23% 19% 14% 8% Sweet 29% 23% 18% 14% 7% Oil 48% 41% 36% 34% 35%
Scen
ario
s B
3 Cereals 62% 48% 36% 27% 15%
Rice 66% 49% 39% 30% 19%
Sweet 59% 43% 33% 24% 11%
Oil 94% 76% 63% 58% 57%
Scen
ario
s B
4 Cereals 220% 152% 84% 61% 31% Rice 212% 113% 80% 53% 27% Sweet 207% 106% 74% 52% 20%
Oil 284% 180% 133% 116% 107% Source: Own estimations based on IHSES 2012
Table 14: Compensating Variation (%) for households in urban areas (Scenarios B)
Scenarios Poorest 2 3 4 Richest If subsidized prices increase due to a decrease of the subsidy quantities by 100% (based on the
elasticities)
B1 0.10 0.11 0.10 0.09 0.09
B2 0.14 0.15 0.14 0.13 0.13
B3 0.24 0.25 0.23 0.23 0.23
B4 0.29 0.30 0.29 0.28 0.29
If subsidized prices are set equal to the free market ones
B1 7.50 7.50 7.15 6.62 5.16 B2 1.63 2.45 3.02 3.27 2.85 B3 16.96 17.03 17.30 16.44 13.47 B4 74.36 71.44 63.42 53.86 38.90
Source: Own estimations based on IHSES 2012

30
Figure 1: PDS Expenditures, Food and Non-Food Expenditures by Consumption Quintile, 2012
Source: Own estimations based on IHSES 2012
Figure 2: Share of Calories from the PDS, by Consumption Quintile, 2007 and 2012
Source: Own estimations based on IHSES 2012
16.52 11.63 9.59 8.03 6.87 5.96 5.05 4.12 3.27 1.93
35.40 36.82 37.15 37.25 36.35 36.71 35.73 36.40 35.53 34.29
0%
20%
40%
60%
80%
100%
1 2 3 4 5 6 7 8 9 10
Ration Non-Ration Non-Food
0.750.68
0.45
0.74
0.64
0.33
0.00
0.10
0.20
0.30
0.40
0.50
0.60
0.70
0.80
1 (poorest) 2 3 4 5 (richest)
% o
f tot
al c
alor
ies
2007 2012

31
Figure 1: Share of different ration products in total ration expenditure (%)
Source: Own estimations based on IHSES 2012
Figure 2: Average change in products shares - Scenario A1 (Urban areas)
Source: Own estimations based on IHSES 2012
Ration rice, 14.21%
Brown wheat flour (ration), 36.14%
White wheat flour (ration), 0.34%
Children's food (ration), 0.16%
powdered milk (ration), 0.67%
Vegetable fat (ration), 0.14%
Vegetable oil (ration), 22.11%Dry white beans
(ration), 0.09%
Chick peas (ration), 0.02%
Lentils (ration), 0.43%
Sugar (ration), 25.66%
Salt (ration), 0.01%Tea (ration), 0.03%
-100%
-80%
-60%
-40%
-20%
0%
20%
Subs
idiz
ed R
ice
Subs
idiz
ed f
lour
Subs
idiz
ed S
ugar
Subs
idiz
ed o
il
Fre
e M
arke
t Cer
eals
Fre
e M
arke
t Ric
e
Fre
e M
arke
t Sw
eet
Fre
e M
arke
t Oil-100%
9% 8% 10% 1% 5% 7%17%
-100%
8% 6% 10%
-3%
2% 5%20%
Fourth quintile Fifth Quintile

32
Figure 3: Average change in products shares - Scenario A2 (Urban areas)
Source: Own estimations based on IHSES 2012
Figure 4: Average change in products shares - Scenario A3 (Urban areas)
Source: Own estimations based on IHSES 2012
-100%
-80%
-60%
-40%
-20%
0%
20%
40%
Subs
idiz
ed R
ice
Subs
idiz
ed o
il
Subs
idiz
ed f
lour
Subs
idiz
ed S
ugar
Fre
e M
arke
t Cer
eals
Fre
e M
arke
t Ric
e
Fre
e M
arke
t Sw
eet
Fre
e M
arke
t Oil-100% -100%
16% 16% 13%
30%
14%
34%
-100% -100%
11% 10% 6%19%
7%
35%
Fourth quintile Fifth Quintile
-100%
-50%
0%
50%
100%
Subs
idiz
ed R
ice
Subs
idiz
ed o
il
Subs
idiz
ed S
ugar
Subs
idiz
ed f
lour
Fre
e M
arke
t Cer
eals
Fre
e M
arke
t Ric
e
Fre
e M
arke
t Sw
eet
Fre
e M
arke
t Oil-100% -100% -100%
30%27%
14%
52% 58%
-100% -100% -100%
18% 15% 8%20%
57%
Fourth quintile Fifth Quintile

33
Figure 5: Average change in products shares - Scenario A3 (Urban areas)
Source: Own estimations based on IHSES 2012
-100%
-50%
0%
50%
100%
150%
Subs
idiz
ed R
ice
Subs
idiz
ed o
il
Subs
idiz
ed S
ugar
Subs
idiz
ed f
lour
Fre
e M
arke
t Cer
eals
Fre
e M
arke
t Ric
e
Fre
e M
arke
t Sw
eet
Fre
e M
arke
t Oil-100% -100% -100% -100%
61% 53%
24%
116%
-100% -100% -100% -100%
31% 27% 11%
107%
Fourth quintile Fifth Quintile

34
Appendix I: Items included in the four free market products
Cereals Sweets Oil Rice
Wheat Assorted sweets Vegetable fat (commercial)
Commercial rice (imported)
Brown wheat flour (commercial) Chocolate Animal fat (ghee) Commercial rice (local)
White wheat flour (commercial) Jam Vegetable oil (commercial) Ground rice
Barley Honey Olive oil Barley flour Date syrup Sesame oil Maize Artificially flavored juice Other oils Burghul (cracked wheat) Chewing gum Habbiya (whole roasted wheat) Ice-cream Jareesh and sameed Ice Maccaroni and vermicelli Starch Cornflakes Corn crisps Corn chips Bread, all types Buns, all types and sizes Kahi (local millefeuille) Klecha (local pastry) Cake Biscuits Rusk and zwieback Readymade pizza Other bread and bakery products
Source: Own estimations based on IHSES 2012

35
Appendix II: The estimated parameters of the Normalized Quadratic Model
Coefficient Standard error 1 -0.175*** (0.0110) 2 0.0360*** (0.00587) 3 0.0409*** (0.00584) 4 -0.0402*** (0.00413) 1 0.0143*** (0.00409) 2 -0.0568*** (0.00680) 3 0.0345*** (0.00276) 4 -0.0940*** (0.00299)
5_1 0.0358*** (0.00254) 6_1 0.342*** (0.00621) 7_1 0.334*** (0.00593) 5_2 0.160*** (0.00348) 6_2 0.0549*** (0.00125) 7_2 -0.000125** (5.59e-05) 5_3 0.000942*** (0.000135) 6_3 -0.00950*** (0.000447) 7_3 0.0753*** (0.00217) 5_4 0.000413*** (0.000151) 6_4 0.000187 (0.000124) 7_4 0.0360*** (0.00110)
b5_5 -0.0213*** (0.000739) b5_6 0.0254*** (0.000801) b5_7 -0.130*** (0.00464) b6_6 -0.0625*** (0.00246) b6_7 -0.0944*** (0.00363) b7_7 -0.0789*** (0.00286)
5 -0.115*** (0.00565) 6 -0.100*** (0.00374)
7 -0.0492*** (0.00436) 5 -0.0275*** (0.00345) 6 -0.0228*** (0.00362)
7 0.00171 (0.00283) g1_1 0.0222*** (0.00247) g1_2 0.00399 (0.00456) g1_3 -0.0251*** (0.00383) g1_4 -0.0130*** (0.00349) g2_2 0.0280*** (0.00362) g2_3 -0.0194*** (0.00288) g2_4 0.0429*** (0.00263) g3_3 0.0127*** (0.00353) g3_4 -0.00792*** (0.00283) g4_4 0.00544** (0.00241)
Total Observations 1140 *** p<0.01, ** p<0.05, * p<0.1 Note: 1=subsidize brown flour, 2=subsidized rice, 3= subsidized sugar, 4= subsidized oil,
5=Free market cereals, 6=free market rice, 7= free market sweets, 8= free market oil.
Source: Own estimations based on IHSES 2012

36
Appendix III: The estimated parameters of the dropped equation (8=Free market Oil) and the remained parameters from the constraints
Coefficient Value b 5_8 0.126366 b 6_5 0.0254108 b 6_8 0.1314652 b 7_5 -0.1304544 b 7_6 -0.0943763 b 7_8 0.3037276 b 8_5 0.126366 b 8_6 0.1314652 b 8_7 0.3037276 b 8_8 -0.5615588
8 0.2642576 8 1.048563
2_1 0.0039866 3_1 -0.0250819 3_2 -0.0194129 4_1 -0.0129679 4_2 0.0429261 4_3 -0.0079164 81 -0.7116576 82 -0.2152323 83 -0.0666918 84 -0.0365806
Source: Own estimations based on IHSES 2012
Appendix IV: The formulas of the estimated elasticities
- Price elasticities of free market goods (i, j=1,2,..n): = ∗( , , ) ∗
- Own quantity mixed elasticities of ration items (k, s=1,2,..m): = ∗( , , ) ∗
- Elasticities of free market goods with respect to ration goods: = ∗( , , ) ∗
- Elasticities of ration item’s price with respect to free markets goods’ price: = ∗( , , ) ∗


