
ESTIMATION OF RELATIVE PERMEABILITY
FROM A DYNAMIC BOILING EXPERIMENT
A REPORT
SUBMITTED TO THE DEPARTMENT OF PETROLEUM ENGINEERING
AND THE COMMITTEE ON GRADUATE STUDIES
OF STANFORD UNIVERSITY
IN PARTIAL FULFILLMENT OF THE REQUIREMENTS
FOR THE DEGREE OF
MASTER OF SCIENCE
Marilou Tanchuling Guerrero
June 1998

ii
Abstract
Thermal and multiphase flow properties of a Berea sandstone core were estimated by
inverse calculation using temperature, pressure, steam saturation, and heat flux data. The
development of the two-phase flow region was strongly related to the temperature
conditions in the core since heat was the only driving force in the experiment. As a result,
the heat input as well as the thermal properties of the sandstone and insulation materials
were a major consideration in understanding the system behavior. The high sensitivity of
the insulation materials to the observation data and their strong correlation with the other
parameters of interest made it difficult to obtain accurate estimates. Although the linear
relative permeability model gave the best fit in the two cases presented in the paper, all
models yielded similar matches. This indicated that the data did not contain sufficient
information to distinguish the different models, giving a non-unique solution.
Nonetheless, almost all models gave a consistent estimate for Sgr, which was around 0.1-
0.2. In addition, the choice for the capillary pressure model depended on the condition in
the core, whether there was single-phase steam or two phases present. Since the
distribution of steam depended heavily on the capillary pressure, the relative permeability
would have been more accurately estimated had the capillary pressure been known. The
comprehensive analysis of all available data from a transient non-isothermal two-phase
flow experiment provided an insight into relation of processes and correlation of
parameters.

iii
Acknowledgments
I sincerely would like to thank Dr. Cengiz Satik for his patience and understanding while
this project was underway. His insights about the experiment itself and possible solutions
to the inverse problem helped me approach the problem from the proper perspective. I am
also deeply grateful to Dr. Stefan Finsterle, whose guidance, support, and ITOUGH2
expertise were truly valuable. His insightful suggestions helped me understand the
difficulties I encountered in the estimation process. I also would like to thank Prof.
Roland Horne for his guidance, encouragement, and sense of humor. His easy-going
nature made my life as a graduate student more bearable and truly enjoyable.
To my all friends, especially Apu Kumar, thank you for the fond memories. When the
going got tough, you were there to lighten the burden.
To my family, thank you for your love, prayers and support. To Jason, you served as my
inspiration to reach for the stars.
This project was funded by the U.S. Department of Energy under grant number DE-
FG07-95ID13370.
Malou T. Guerrero
June 5, 1998
iv
Table of Contents
Abstract ...............................................................................................................................ii
Acknowledgments ..............................................................................................................iii
Table of Contents ............................................................................................................... iv
List of Figures.....................................................................................................................vi
List of Tables.......................................................................................................................x
Introduction .........................................................................................................................1
Review of Related Literature...............................................................................................3
2.1 Relative Permeability and Capillary Pressure............................................................3
2.2 Heat and Mass Transfer .............................................................................................5
2.3 Previous Work ...........................................................................................................6
Relative Permeability and Capillary Pressure Models ........................................................8
3.1 Linear Model..............................................................................................................8
3.4 Corey Model...............................................................................................................9
3.5 Leverett Model .........................................................................................................10
3.2 Brooks-Corey Model................................................................................................11
3.3 van Genuchten Model ..............................................................................................12
Experimental Apparatus and Procedure ............................................................................14
Numerical Simulation .......................................................................................................18
5.1 Model .......................................................................................................................18
5.2 Forward Calculation.................................................................................................20
5.2.1 Input Data .................................................................................................................................... 205.2.2 Sensitivity Analysis...................................................................................................................... 215.2.3 Initial Guesses.............................................................................................................................. 58
5.3 Parameter Estimation ...............................................................................................58
5.3.1 Inverse Modeling ......................................................................................................................... 585.3.2 Results and Discussion................................................................................................................. 60
Conclusion.........................................................................................................................96
References .........................................................................................................................97
Appendix A .....................................................................................................................100
Appendix A.1.1 TOUGH2 input file. ................................................................................................. 100

v
A.1.2 ITOUGH2 input file.................................................................................................................. 113A.2 Linear model calibration input files ............................................................................................. 118A.2.1 TOUGH2 input file. .................................................................................................................. 118A.2.2 ITOUGH2 input file.................................................................................................................. 130

vi
List of Figures
Figure 2.1 Relative permeability as a function of liquid saturation. ...................................4
Figure 2.2 Relative permeability obtained by Ambusso (1996)..........................................7
Figure 2.3 Relative permeability obtained by Satik (1998).................................................7
Figure 3.1 Linear relative permeability. ..............................................................................9
Figure 3.2 Corey relative permeability. .............................................................................10
Figure 3.3 Brooks-Corey relative permeability. ................................................................12
Figure 3.4 van Genuchten relative permeability. ..............................................................13
Figure 4.1. Schematic diagram of the experimental apparatus (after Satik, 1997b). ........14
Figure 4.2 Experimental temperature data. .......................................................................16
Figure 4.3 Experimental pressure data. .............................................................................16
Figure 4.4 Experimental steam saturation data. ................................................................17
Figure 4.5 Experimental heat flux data. ............................................................................17
Figure 5.1. Schematic diagram of the 4×51 TOUGH2 model. Ring 4 is not shown since it
represents ambient conditions. ..........................................................................................19
Figure 5.2. ITOUGH2 input used to generate the elements and connections. ..................20
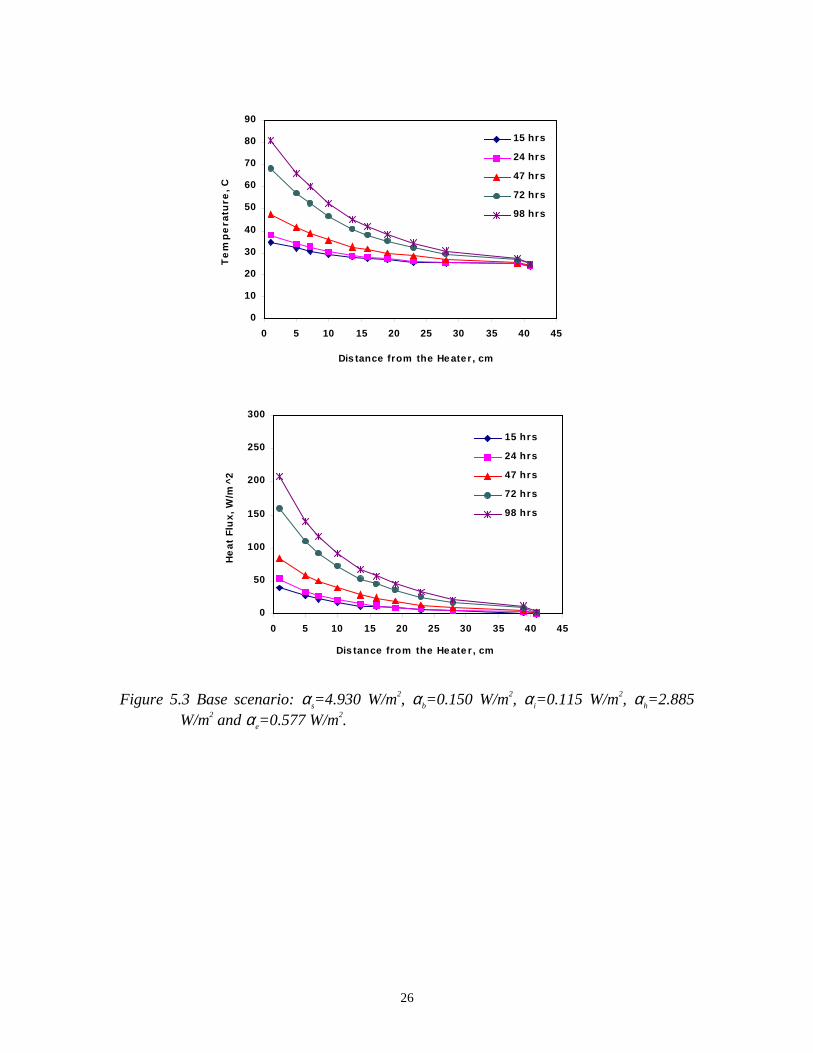
Figure 5.3 Base scenario: αs=4.930 W/m2, αb=0.150 W/m2, αi=0.115 W/m2, αh=2.885
W/m2 and αe=0.577 W/m2. ...............................................................................................26
Figure 5.4 αs=4.300 W/m2, αb=0.150 W/m2, αi=0.115 W/m2, αh=2.885 W/m2 and
αe=0.577 W/m2..................................................................................................................27
Figure 5.5 αs=4.930 W/m2, αb=0.090 W/m2, αi=0.115 W/m2, αh=2.885 W/m2 and
αe=0.577 W/m2..................................................................................................................28
Figure 5.6 αs=4.930 W/m2, αb=0.150 W/m2, αi=0.175 W/m2, αh=2.885 W/m2 and
αe=0.577 W/m2..................................................................................................................29
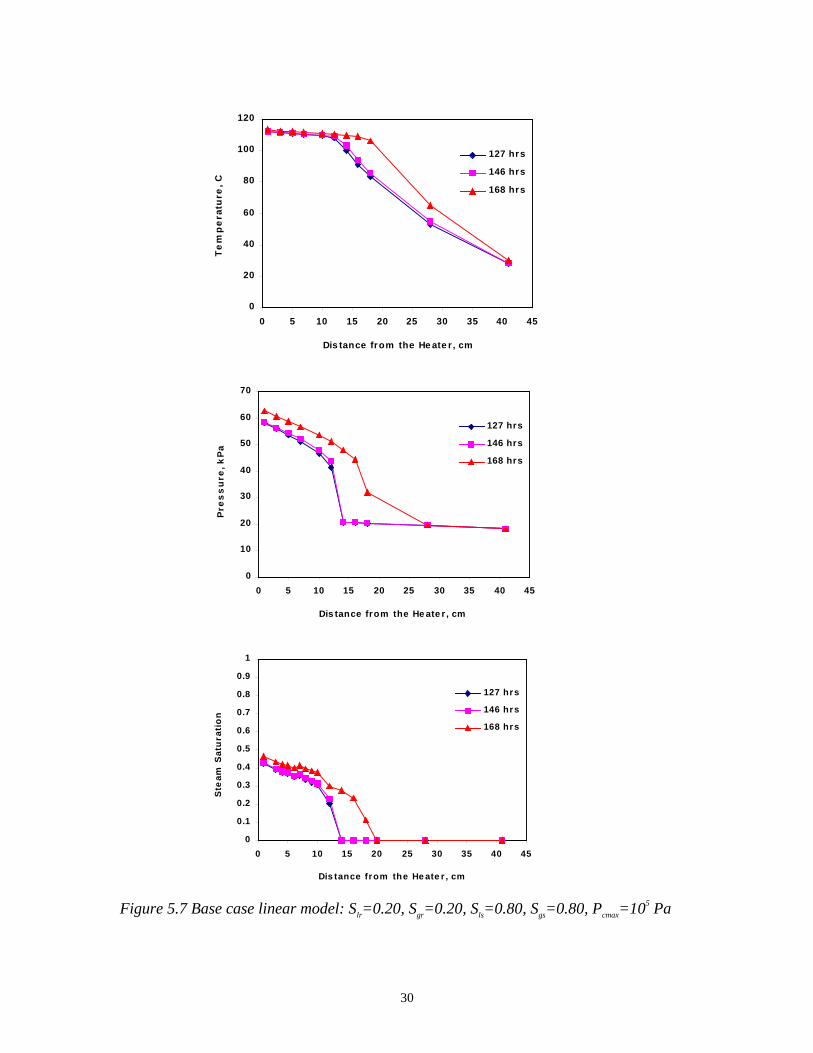
Figure 5.7 Base case linear model: Slr=0.20, Sgr=0.20, Sls=0.80, Sgs=0.80, Pcmax=105 Pa 30
Figure 5.8 Linear model: Slr=0.02, Sgr=0.10, Sls=0.80, Sgs=0.80, Pcmax=105 Pa................31
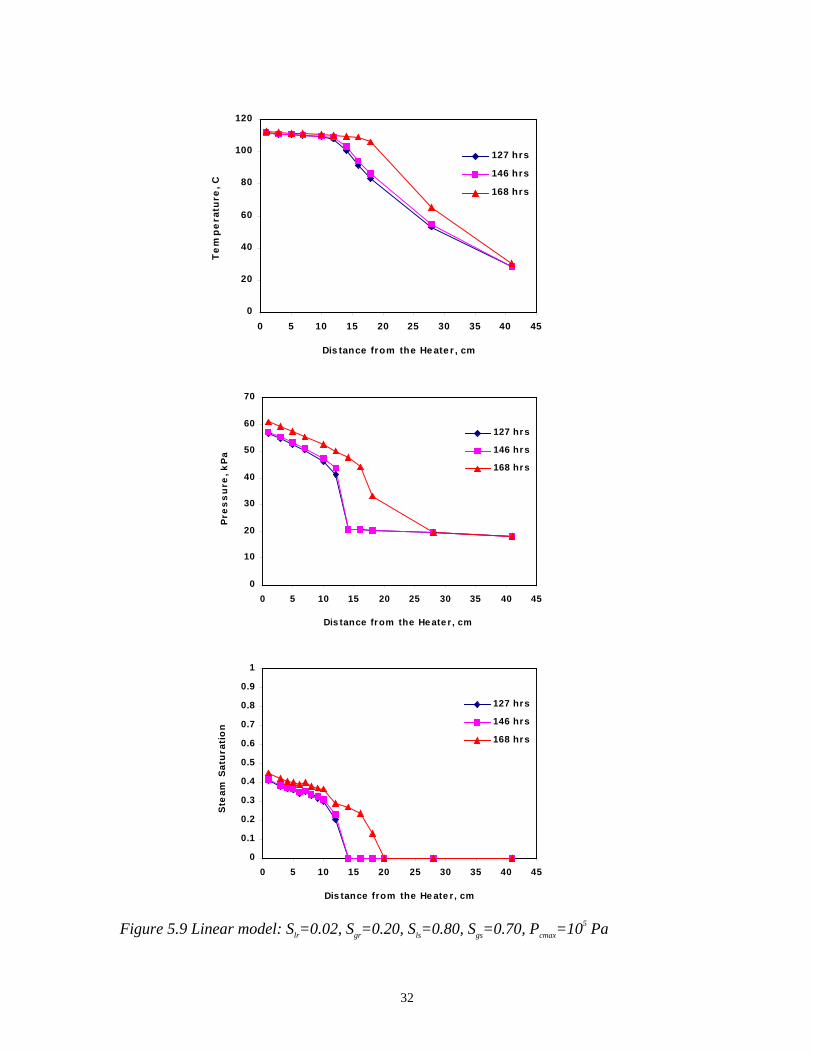
Figure 5.9 Linear model: Slr=0.02, Sgr=0.20, Sls=0.80, Sgs=0.70, Pcmax=105 Pa................32

vii
Figure 5.10 Linear model: Slr=0.02, Sgr=0.20, Sls=0.80, Sgs=0.80, Pcmax=104 Pa..............33
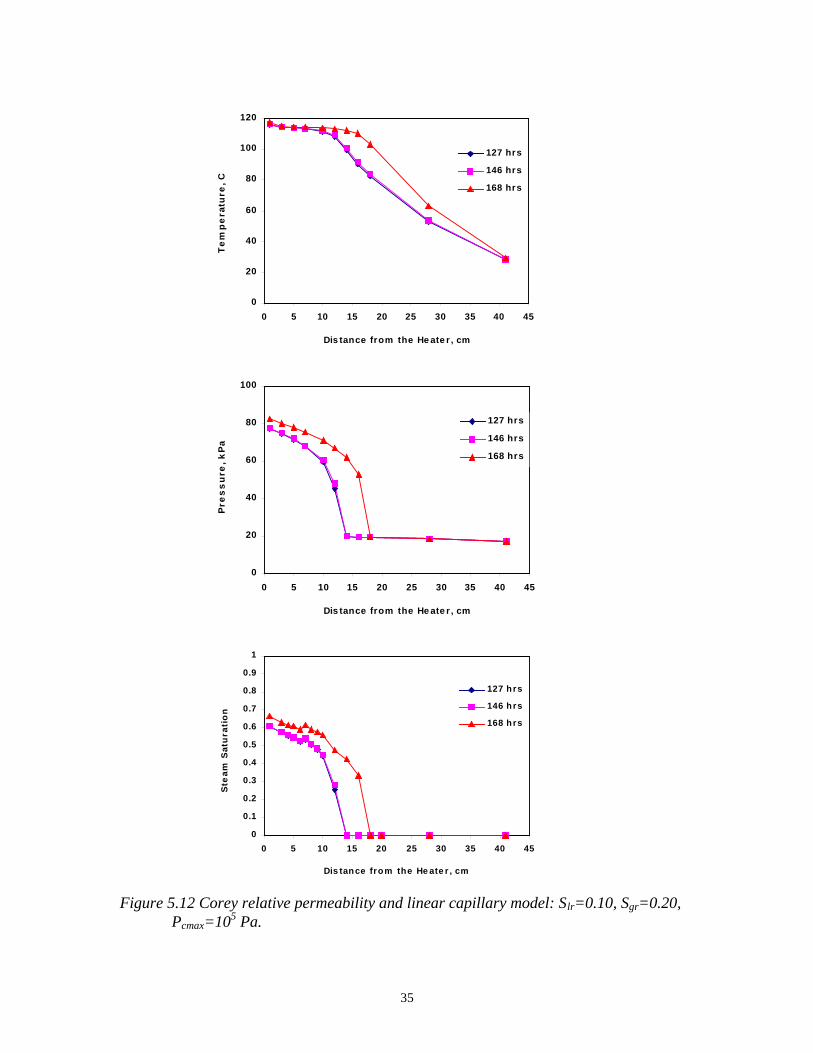
Figure 5.11 Base case: Corey relative permeability and linear capillary model: Slr=0.20,
Sgr=0.20, Pcmax=105 Pa......................................................................................................34
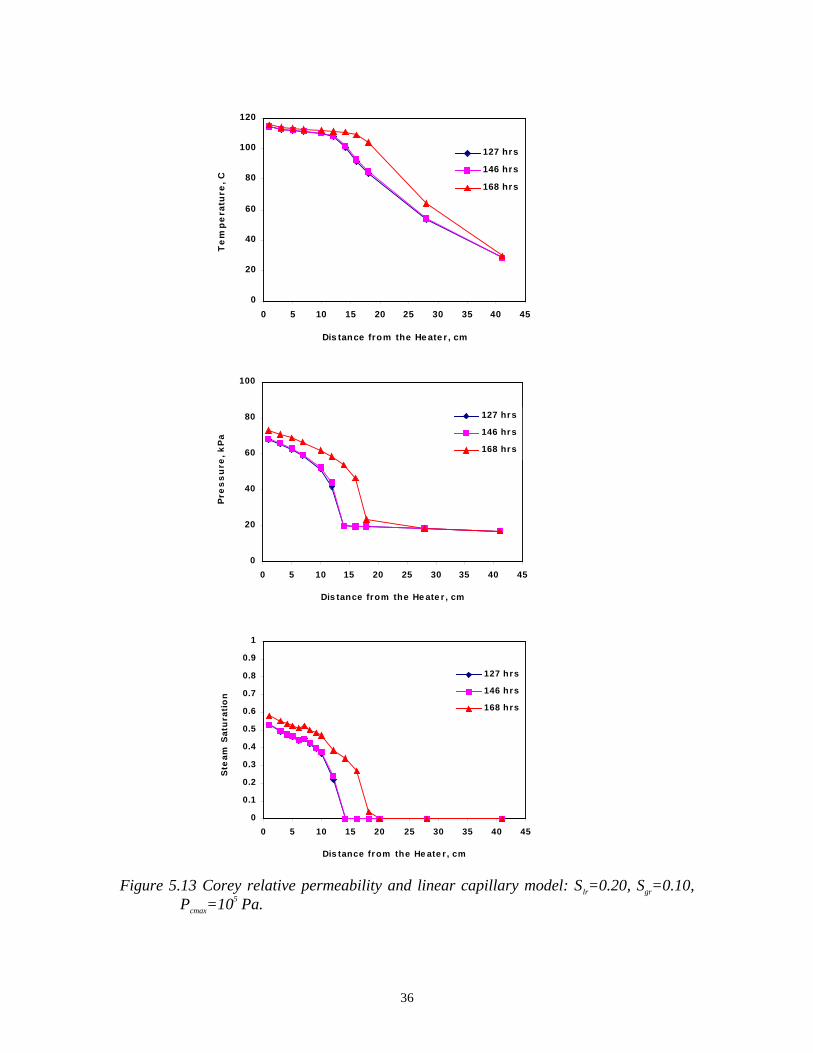
Figure 5.13 Corey relative permeability and linear capillary model: Slr=0.20, Sgr=0.10,
Pcmax=105 Pa. .....................................................................................................................36
Figure 5.14 Corey relative permeability and linear capillary model: Slr=0.20, Sgr=0.20,
Pcmax=104 Pa. .....................................................................................................................37
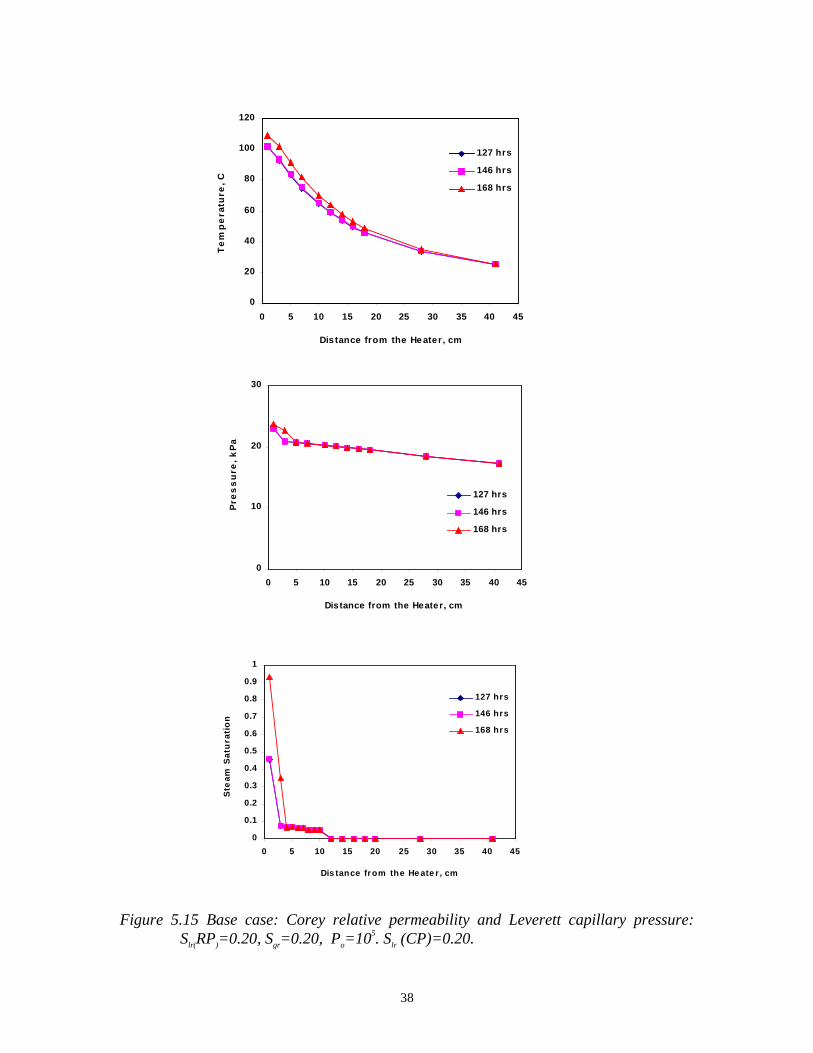
Figure 5.15 Base case: Corey relative permeability and Leverett capillary pressure:
Slr(RP)=0.20, Sgr=0.20, Po=105. Slr (CP)=0.20..................................................................38
Figure 5.16 Corey relative permeability and Leverett capillary pressure: Slr(RP)=0.10,
Sgr=0.20, Po=105. Slr (CP)=0.20. ......................................................................................39
Figure 5.17 Corey relative permeability and Leverett capillary pressure: Slr(RP)=0.20,
Sgr=0.10, Po=105. Slr (CP)=0.20. ......................................................................................40
Figure 5.18 Corey relative permeability and Leverett capillary pressure: Slr(RP)=0.20,
Sgr=0.20, Po=104, Slr (CP)=0.20. ......................................................................................41
Figure 5.19 Corey relative permeability and Leverett capillary pressure: Slr(RP)=0.20,
Sgr=0.20, Po=105, Slr (CP)=0.10. ......................................................................................42
Figure 5.20 Base case: Linear relative permeability and Leverett capillary pressure:
Slr(RP)=0.20, Sgr=0.20, Sls=0.80, Sgs=0.80, Po=105, Slr (CP)=0.20...................................43
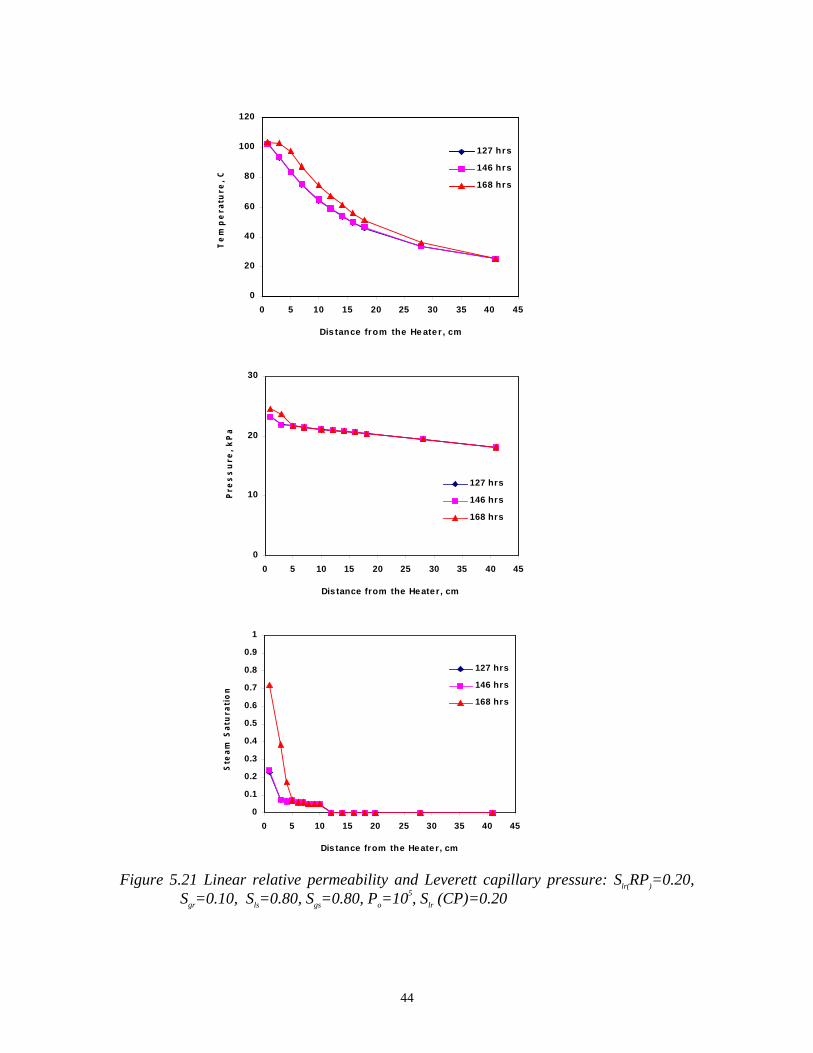
Figure 5.21 Linear relative permeability and Leverett capillary pressure: Slr(RP)=0.20,
Sgr=0.10, Sls=0.80, Sgs=0.80, Po=105, Slr (CP)=0.20 ........................................................44
Figure 5.22 Linear relative permeability and Leverett capillary pressure: Slr(RP)=0.20,
Sgr=0.20, Sls=0.80, Sgs=0.70, Po=105, Slr (CP)=0.2 ..........................................................45
Figure 5.23 Linear relative permeability and Leverett capillary pressure: Slr(RP)=0.20,
Sgr=0.20, Sls=0.80, Sgs=0.80, Po=104, Slr (CP)=0.20 ........................................................46
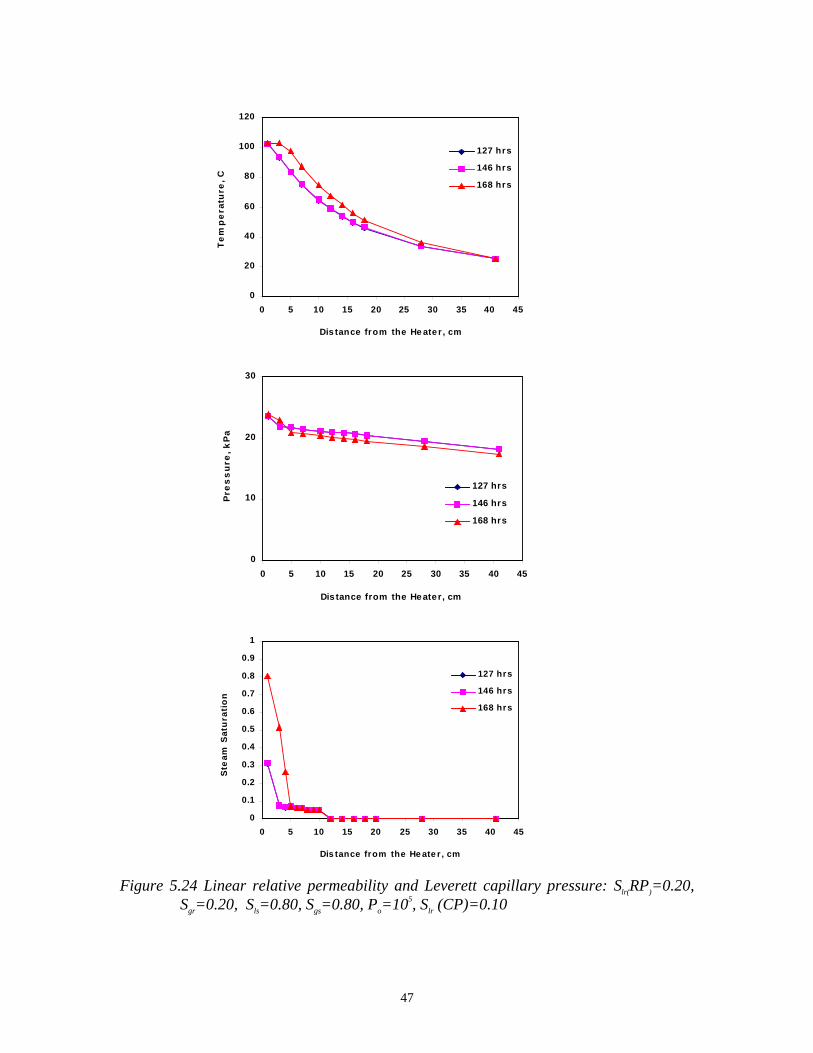
Figure 5.24 Linear relative permeability and Leverett capillary pressure: Slr(RP)=0.20,
Sgr=0.20, Sls=0.80, Sgs=0.80, Po=105, Slr (CP)=0.10 ........................................................47
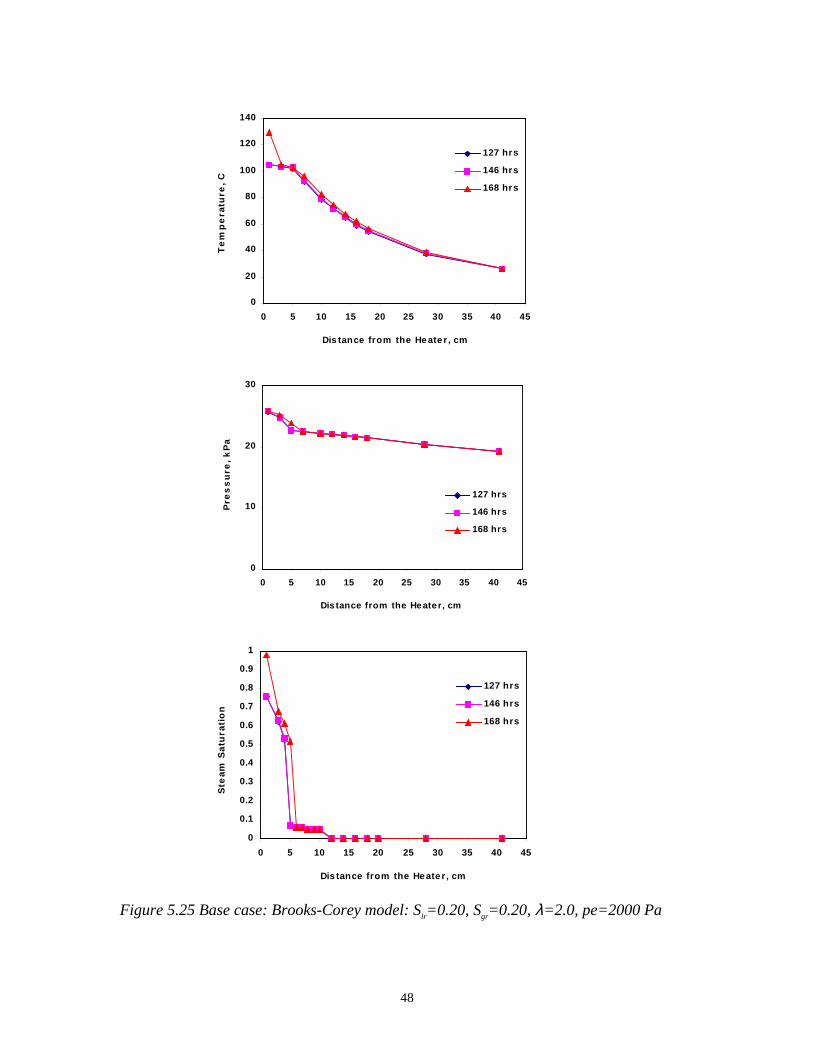
Figure 5.25 Base case: Brooks-Corey model: Slr=0.20, Sgr=0.20, λ=2.0, pe=2000 Pa .....48
Figure 5.26 Brooks-Corey model: Slr=0.10, Sgr=0.20, λ=2.0, pe=2000 Pa.......................49
Figure 5.27 Brooks-Corey model: Slr=0.20, Sgr=0.10, λ=2.0, pe=2000 Pa.......................50

viii
Figure 5.28 Brooks-Corey model: Slr=0.20, Sgr=0.20, λ=1.5, pe=2000 Pa.......................51
Figure 5.29 Brooks-Corey model: Slr=0.20, Sgr=0.20, λ=2.0, pe=1000 Pa.......................52
Figure 5.30 Base case van Genucthen model: Slr=0.2, Sgr=0.2, n=2.0, 1/α=500 ............53
Figure 5.31 van Genucthen: Slr=0.1, Sgr=0.2, n=2.0, 1/α=500........................................54
Figure 5.32 van Genucthen: Slr=0.2, Sgr=0.1, n=2.0, 1/α=500........................................55
Figure 5.33 van Genucthen: Slr=0.2, Sgr=0.2, n=2.5, 1/α=500........................................56
Figure 5.34 van Genucthen: Slr=0.2, Sgr=0.2, n=2.0, 1/α=1000......................................57
Figure 5.35 Inverse modeling flow chart (after Finsterle et al., 1998). .............................60
Figure 5.36 Measured and calculated temperature after single-phase period calibration. 64
Figure 5.37 Measured and calculated heat flux after single-phase period calibration. .....64
Figure 5.38 Measured and calculated temperature. ...........................................................69
Figure 5.39 Measured and calculated pressure.................................................................70
Figure 5.40 Measured and calculated steam saturation....................................................70
Figure 5.41 Measured and calculated heat flux.................................................................71
Figure 5.42 Temperature with respect to time...................................................................71
Figure 5.43 Pressure with respect to time. ........................................................................72
Figure 5.44 Steam saturation with respect to time. ...........................................................73
Figure 5.45 Heat flux with respect to time. .......................................................................74
Figure 5.46 Temperature with respect to distance from the heater. ..................................74
Figure 5.47 Pressure with respect to distance from the heater. .........................................75
Figure 5.48 Steam saturation with respect to distance from the heater.............................75
Figure 5.49 Heat flux with respect to distance from the heater.........................................76
Figure 5.50 Inverse modeling relative permeability results compared with Ambusso’s
results (1996).....................................................................................................................77
Figure 5.51 Leverett capillary pressure. ............................................................................77
Figure 5.52. Relative permeability estimates compared with Ambusso’s (1996) results. 78
Figure 5.53. Relative permeability estimates compared with Satik’s (1996) results. .......78
Figure 5.54 No Sensor 1 data: Measured and calculated temperature after calibration of
model under single-phase conditions. ...............................................................................79
ix
Figure 5.55 No Sensor 1 data: measured and calculated heat flux after calibration of
model under single-phase conditions. ...............................................................................80
Figure 5.56 No Sensor 1 data: Measured and calculated temperature. .............................84
Figure 5.57 No Sensor 1 data: Measured and calculated pressure. ...................................84
Figure 5.58 No Sensor 1 data: Measured and calculated steam saturation. ......................85
Figure 5.59 No Sensor 1 data: Measured and calculated heat flux. ..................................85
Figure 5.60 No Sensor 1 data: Temperature with respect to time. ...................................88
Figure 5.61 No Sensor 1 data: Pressure with respect to time............................................89
Figure 5.62 No Sensor 1 data: Steam saturation with respect to time...............................90
Figure 5.63 No Sensor 1 data: Heat flux with respect to time. .........................................91
Figure 5.64 No Sensor 1 data: Temperature with respect to distance from heater............92
Figure 5.65 No Sensor 1 data: Pressure with respect to distance from heater. .................92
Figure 5.66 No Sensor 1 data: Steam saturation with respect to distance from heater. ....93
Figure 5.67 No Sensor 1 data: Heat flux with respect to distance from heater. ................93
Figure 5.68 No Sensor 1 data: Relative permeability estimate compared with Ambusso’s
results (1996).....................................................................................................................94
Figure 5.69 No Sensor 1 data: Linear capillary pressure...................................................94
Figure 5.70 No Sensor 1 data: Relative permeability estimates compared with Ambusso’s
results. ...............................................................................................................................95
Figure 5.71 No Sensor 1 data: Relative permeability estimates compared with Satik’s
results. ...............................................................................................................................95

x
List of Tables
Table 4.1. Physical properties of the cores, epoxy, core insulation, and heater insulation.
....................................................................................................................................15
Table 5.1. Observation used for model calibration. ..........................................................61
Table 5.2 Parameter estimates after single-phase calibration period. ...............................62
Table 5.3 Variance-covariance matrix (diagonal and lower triangle) and correlation
matrix (upper triangle) after single-phase period calibration. ....................................63
Table 5.4 Statistical measures and parameter sensitivity after single-phase period
calibration. ..................................................................................................................63
Table 5.5 Total sensitivity of observation, standard deviation of residuals, and
contribution to the objective function (COF) after single-phase period calibration...64
Table 5.6 Parameter estimates for linear relative permeability and Leverett capillary
pressure case. ..............................................................................................................67
Table 5.7 Variance-covariance and correlation matrices. .................................................67
Table 5.8 Statistical measures and parameter sensitivity. .................................................68
Table 5.9 Total sensitivity of observation, standard deviation of residuals, and
contribution to the objective function (COF). ............................................................69
Table 5.10 No Sensor 1 data: Parameter estimates after the single-phase calibration
period. .........................................................................................................................80
Table 5.11 No Sensor 1 data: Variance-covariance and correlation matrices after single-
phase period calibration..............................................................................................81
Table 5.12 No Sensor 1 data: Statistical measures and parameter sensitivity after single-
phase period calibration..............................................................................................81
Table 5.13 No Sensor 1 data: Total sensitivity of observation, standard deviation of
residuals, and contribution to the objective function (COF) after single-phase period
calibration. ..................................................................................................................82
Table 5.14 No Sensor 1 data: Parameter estimates. ..........................................................86

xi
Table 5.15 No Sensor 1 data: Variance-covariance and correlation matrices...................86
Table 5.17 No Sensor 1 data: Total sensitivity of observation, standard deviation of
residuals, and contribution to the objective function (COF). .....................................87
Table 5.18 No Sensor 1 data: Total sensitivity of observation, standard deviation of
residuals, and contribution to the objective function (COF). .....................................87

Chapter 1
Introduction
Relative permeability is one of the parameters required in describing multiphase flow in
porous media since it governs movement of one phase or component with respect to
another. It has been studied widely for oil applications (e.g. waterflooding and gas
injection), but less so for geothermal applications, which is the main concern of this
study. So far, relative permeability relations for steam and liquid water have been based
on theoretical methods using field data (e.g. Grant, 1977; Horne and Ramey, 1978), and
laboratory experiments (e.g. Ambusso, 1996; Satik, 1998). Although relative permeability
is best determined through laboratory experiments, it is difficult to measure due to
capillary forces that introduce nonlinear effects on the pressure and saturation distribution
at the core exit (Ambusso, 1996). Also, relative permeability is difficult to measure
directly for steam-water flows due to experimental constraints (Satik, 1997b). Thus, this
study describes a different approach to estimating the relative permeability by matching
data from a transient boiling experiment performed on a Berea sandstone to results
obtained from numerical simulation. This method provides a way to examine the validity
of the relative permeability measurements taken from previous experiments, as well as to
estimate capillary pressure.
Although the focus of this research project is relative permeability, capillary pressure has
also been studied. These two parameters cannot be separated from each other since they
are both important in the behavior of multiphase flow in porous media. However, like
relative permeability, capillary pressure in steam-water systems is unknown. This makes
the estimation process more difficult because the higher number of unknowns in the

2
problem. In addition, other unknown parameters, such as heat input and heat losses,
affect the successful estimation of the relative permeability. To decrease the correlation
between the thermal properties and two-phase parameters of interest, the inversion was
performed in two steps. Several relative permeability and capillary pressure models were
used to solve the inverse problem. The function that best matches the observed data
without over-parameterization can be considered the likely scenario.
This report will begin by discussing the concepts of relative permeability, capillary
pressure, and heat and mass transfer. Results of recent relative permeability experiments
will also be discussed. Following this, a brief summary of the relative permeability and
capillary pressure models used in the study will be given. Then a description of the
experimental apparatus and procedures will be given, followed by a discussion of the
steps involved in the numerical simulation. This report will end with an analysis of results
and conclusion of the study.
3
Chapter 2
Review of Related Literature
In this chapter, relative permeability and capillary pressure will be defined in order to
understand their role in mass flow calculations. Since the system being considered is a
boiling system, a discussion of heat transfer will also be included. Finally, two recent
relative permeability experiments will be reviewed to provide a reference for comparison
for the simulation results.
2.1 Relative Permeability and Capillary Pressure
When two fluids are flowing simultaneously in a porous medium, each fluid has its own
effective permeability, kβ (Dake, 1978). The effective permeability is related to the
absolute permeability, k, a property that is independent of the properties of the single-
phase fluid flowing through the porous medium, by the following equation:
k k krβ β= β = l (liquid), g (gas) ………………………………………… (2.1)
where krβ is the relative permeability of the phase, β. The effective permeabilities are
normally expressed as a function of the saturation of each fluid, and their sum is usually
less than the absolute permeability. For single-component two-phase systems (e.g. liquid
and gas phases in water), the liquid would not flow (kl=0) when the liquid saturation, Sl,
is equal to the residual liquid saturation, Slr. Also, when Sl=1, or when the rock is fully
saturated with water, kl=k. Similarly, the gas would not flow (kg=0) when the gas
saturation, Sg=1-Sl, is equal to the residual gas saturation, Sgr. Also, kg=k when Sg=1. In
terms of relative permeability, krl=0 when Sl=Slr, krl=1 when Sl=1, kgr=0 when Sg=Sgr,
and kgr=1 when Sl=1. A simple illustration of the relative permeability as a function of

4
liquid saturation is shown in Figure 2.1. Apart from saturation, other factors can influence
relative permeability or phase distribution in a porous medium. They include matrix (or
pore) structure, history, interfacial tension, wettability, viscosity ratio, and density ratio
(Dullien, 1992; Kaviany, 1995).
0
0.1
0.2
0.3
0.4
0.5
0.6
0.7
0.8
0.9
1
0 0.1 0.2 0.3 0.4 0.5 0.6 0.7 0.8 0.9 1
Sl
kr
Slr Sgr
k r l
k rg
Figure 2.1 Relative permeability as a function of liquid saturation.
Incorporating relative permeability in the generalized Darcy’s law (Dullien, 1992),
( ) ( )δ δµ
ρβ
ββ βQ A
kkp g
r/ n =
∇ −
………………………………………………… (2.2)
where Q is the volumetric flow rate, A is the normal cross sectional area of the porous
medium, n is the unit normal vector of surface area A, µβ is the viscosity of β, ∇pβ is the
pressure drop in β across two points in the porous medium, ρβ is the density of β, and g is
the acceleration due to gravity. The pressures pβ in the two phases are related to each
other by the capillary pressure, pc. Hence, if gas is the non-wetting phase and liquid is the
wetting phase, the two pressure gradients are related to each other by the gradient of the
capillary pressure (Leverett, 1941):

5
∇ = ∇ − ∇p p pc g l ……………………………………………………………………. (2.3)
The general expression for calculating the capillary pressure at any given point on an
interface between liquid and gas is given by the Young-Laplace equation
p p pr r
c g l= − = +
σ 1 1
1 2
…………………………………………………...……… (2.4)
where σ is the interfacial tension between the two liquid and gas phases, and r1 and r2 are
the principal radii of curvature at any point on the interface where the pressures in the
liquid and gas are pl and pg, respectively. Some of the more commonly used relative
permeability and capillary pressure models will be discussed in the next chapter.
2.2 Heat and Mass Transfer
For two phases of a single component in porous media, the conservation of energy can be
simplified as
M C T S uR Rl g
1 1= − +=∑( )
,
φ ρ φ ρβ β ββ
…………………………………………….… (2.5)
where φR is the rock porosity, ρR is the rock grain density, CR is the specific heat of the
rock, T is the temperature, Sβ is the saturation of phase β (liquid or gas), and uβ is the
specific internal energy of β. The first term in Equation 2.1 is the energy of the rock, and
the second term is the summation of the energy of the two phases present. The phase
transition, pressure-work, and viscous dissipation terms are neglected since they are small
in liquid-dominated systems in the absence of an adsorbed phase (Garg and Pritchett,
1977). For a multiphase single component system, the conservation of mass is written as
M S Xl g
2 ==∑φ ρ
ββ β β
,
…………………………………………………………….… (2.6)
Pruess and Narasimhan (1985) expressed the energy-balance and mass-balance equations
in integral form. For an arbitrary flow domain, Vn
d
dtM dv F q dv
n nnVV
( ) ( ) ( ).κ κ κ= +∫ ∫∫
Γ
Γn κ=1:heat and κ=2:water …………….. (2.7)

6
The first term on the right-hand side of Equation 2.7 is the flux term, where the heat flux
is
F K T h Fl g
1 = − ∇ −=∑ β β
β ,
…………………………………………………………….. (2.8)
and the mass flux is
F Fl g
2 ==∑ β
β ,
…………………………………………………………………………. (2.9)
The parameter, K, is the heat conductivity of the rock-fluid mixture, and hβ is the specific
enthalpy of water in β. Equation 2.8 includes conductive and convective heat terms only,
neglecting dispersion. The mass flux in each phase is
F kk
X P g D Xβl g
rg va= − ∇ − − ∇
=∑
β
β
ββ β β β β β βµ
ρ ρ δ ρ,
) ….……………………. (2.10)
The last term in Equation 2.10 represents a binary diffusive flux and contributes only to
gas phase flow (Pruess, 1987).
2.3 Previous Work
A wide range of relative permeability relations has been reported. However, only a few
studies on single-component two-phase systems, particularly steam and liquid water
systems, have been done. In the past, attempts to measure the relative permeability of
single-component two-phase flow directly produced questionable results (Sanchez et al,
1980; Verma, 1986; Clossman and Vinegar) since measurement of the liquid saturation
was inaccurate and the assignment of pressure gradient may have been inappropriate
(Ambusso, 1996). Recently, significant improvements in measuring water and steam
saturation and collecting data from steam-water flow experiments were achieved. Results
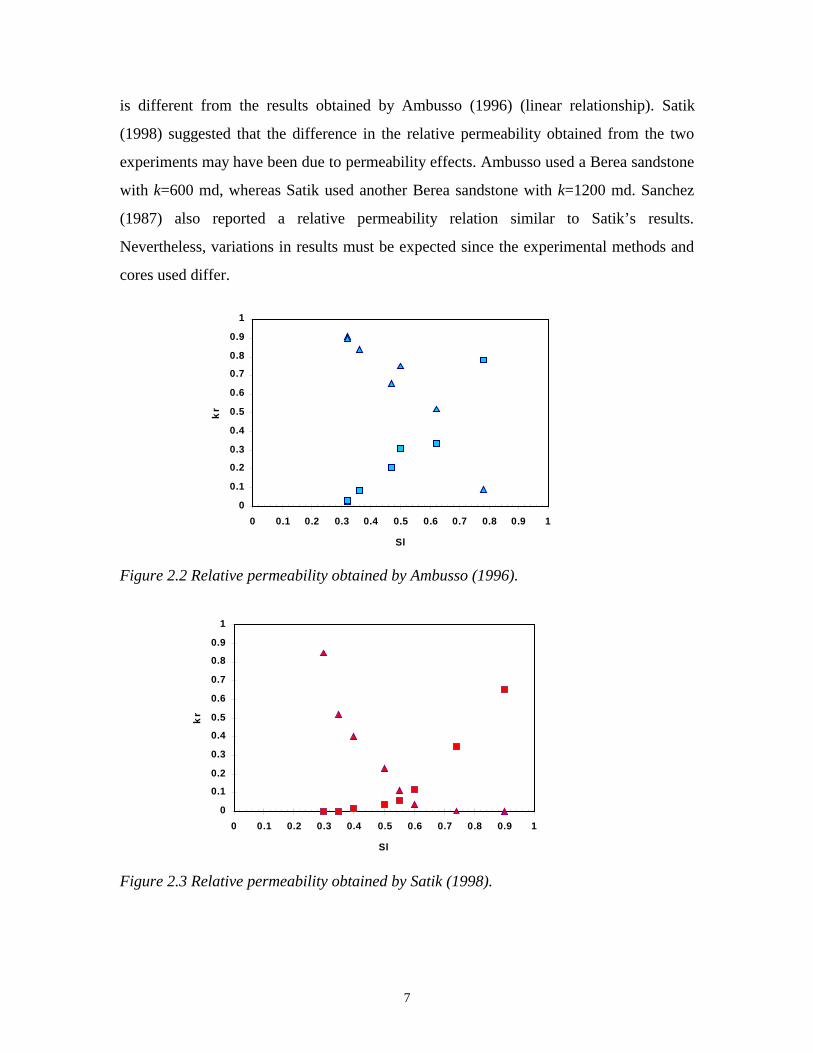
of the steady-state experiment conducted by Ambusso (1996) on a Berea sandstone
indicated a linear relationship for steam-water relative permeability (Fig. 2.2). In
attempting to repeat these results, Satik (1998) improved the design of the experimental
apparatus. A successful experiment was conducted and steam-water relative permeability
was obtained. These recent results suggest a more curvilinear relationship (Fig. 2.3) that
7
is different from the results obtained by Ambusso (1996) (linear relationship). Satik
(1998) suggested that the difference in the relative permeability obtained from the two
experiments may have been due to permeability effects. Ambusso used a Berea sandstone
with k=600 md, whereas Satik used another Berea sandstone with k=1200 md. Sanchez
(1987) also reported a relative permeability relation similar to Satik’s results.
Nevertheless, variations in results must be expected since the experimental methods and
cores used differ.
0
0.1
0.2
0.3
0.4
0.5
0.6
0.7
0.8
0.9
1
0 0.1 0.2 0.3 0.4 0.5 0.6 0.7 0.8 0.9 1
Sl
kr
Figure 2.2 Relative permeability obtained by Ambusso (1996).
0
0.1
0.2
0.3
0.4
0.5
0.6
0.7
0.8
0.9
1
0 0.1 0.2 0.3 0.4 0.5 0.6 0.7 0.8 0.9 1
Sl
kr
Figure 2.3 Relative permeability obtained by Satik (1998).
8
Chapter 3
Relative Permeability and CapillaryPressure Models
Several semi-empirical relative permeability and capillary pressure relationships have
been proposed by different authors. However, only four relative permeability and four
capillary pressure models are included in this study. These are the linear, Corey, and
Leverett models, and coupled relative permeability and capillary pressure functions, the
Brooks-Corey and van Genuchten models. The selection of the models was based on the
experimental results obtained by Ambusso (1996) and Satik (1998).
3.1 Linear Model
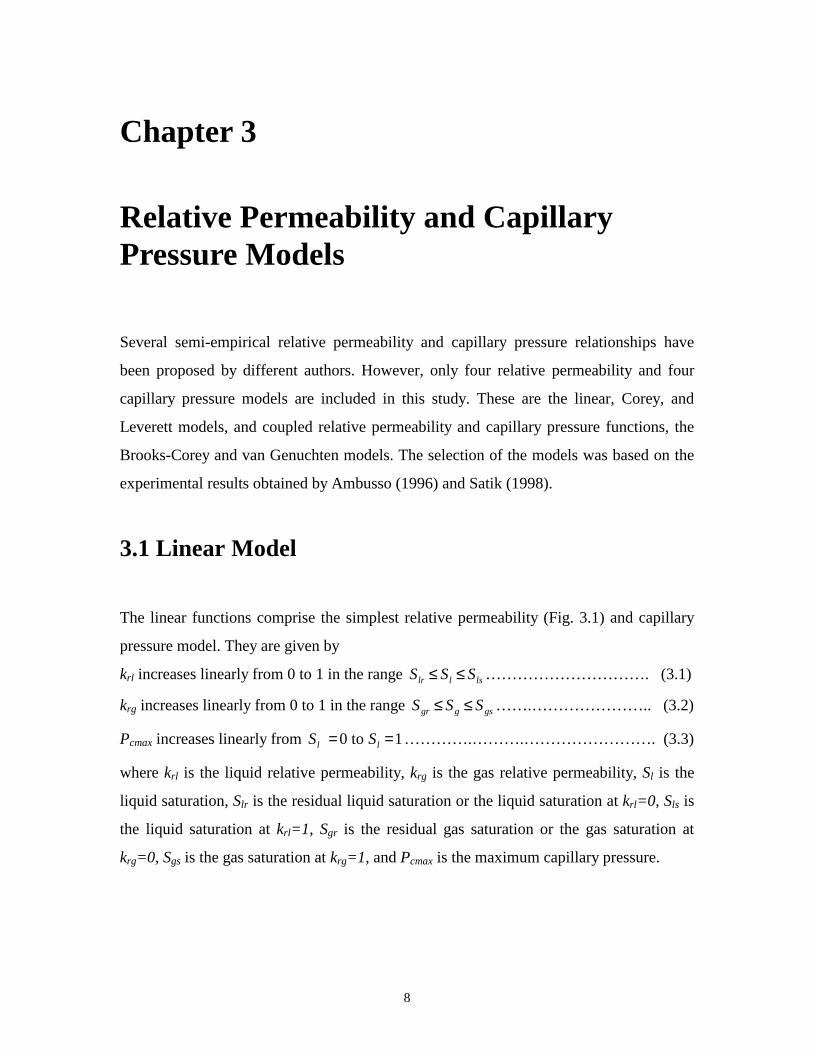
The linear functions comprise the simplest relative permeability (Fig. 3.1) and capillary
pressure model. They are given by
krl increases linearly from 0 to 1 in the range S S Slr l ls≤ ≤ …………………………. (3.1)
krg increases linearly from 0 to 1 in the range S S Sgr g gs≤ ≤ …….………………….. (3.2)
Pcmax increases linearly from S Sl l= =0 1to ………….……….……………………. (3.3)
where krl is the liquid relative permeability, krg is the gas relative permeability, Sl is the
liquid saturation, Slr is the residual liquid saturation or the liquid saturation at krl=0, Sls is
the liquid saturation at krl=1, Sgr is the residual gas saturation or the gas saturation at
krg=0, Sgs is the gas saturation at krg=1, and Pcmax is the maximum capillary pressure.
9
0
0.1
0.2
0.3
0.4
0.5
0.6
0.7
0.8
0.9
1
0 0.1 0.2 0.3 0.4 0.5 0.6 0.7 0.8 0.9 1
S l
kr
k r l
k rg
Figure 3.1 Linear relative permeability.
3.4 Corey Model
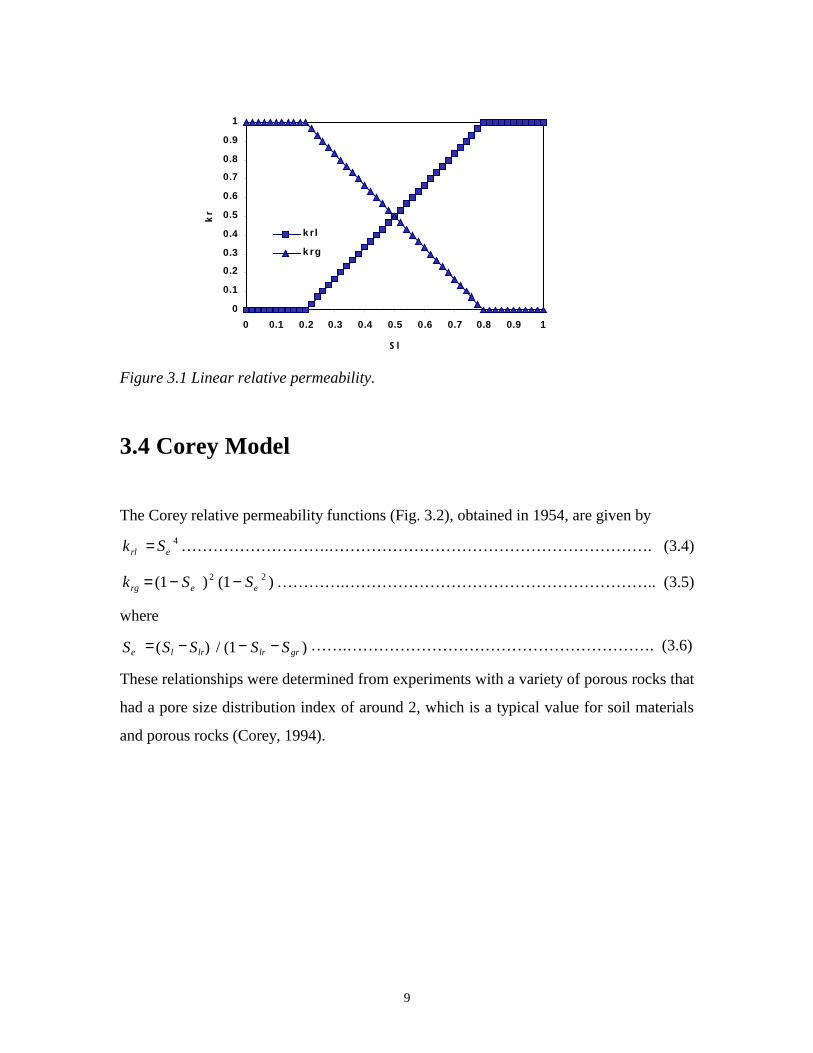
The Corey relative permeability functions (Fig. 3.2), obtained in 1954, are given by
k Srl e= 4 ……………………….……………………………………………………. (3.4)
k S Srg e e= − −( ) ( )1 12 2 ………….………………………………………………….. (3.5)
where
S S S S Se l lr lr gr= − − −( ) / ( )1 …….…………………………………………………. (3.6)
These relationships were determined from experiments with a variety of porous rocks that
had a pore size distribution index of around 2, which is a typical value for soil materials
and porous rocks (Corey, 1994).

10
0
0.1
0.2
0.3
0.4
0.5
0.6
0.7
0.8
0.9
1
0 0.1 0.2 0.3 0.4 0.5 0.6 0.7 0.8 0.9 1
S l
kr
k r l
k rg
Figure 3.2 Corey relative permeability.
3.5 Leverett Model
Leverett (1941) defined a reduced capillary pressure function, which was eventually
named Leverett J function by Rose and Bruce (1949) and used for correlating capillary
pressure data. Expressing the Leverett J function in terms of capillary pressure
pc P T Jo= − σ ( ) …………………………………………………………………… (3.7)
where
J S S S= − − − + −1 417 1 2 120 1 1 263 12 3. ( ) . ( ) . ( )* * * ……………………………….. (3.8)
S S S Sl lr lr* ( ) / ( )= − −1 …………………………………………………………….. (3.9)
σ is the surface tension of water and Po is a scale factor. One limitation of the function is
that it cannot account for the individual differences between the pore structures of various
materials since the scale factor, Po=√k/φ, is inadequate (Dullien, 1992).
11
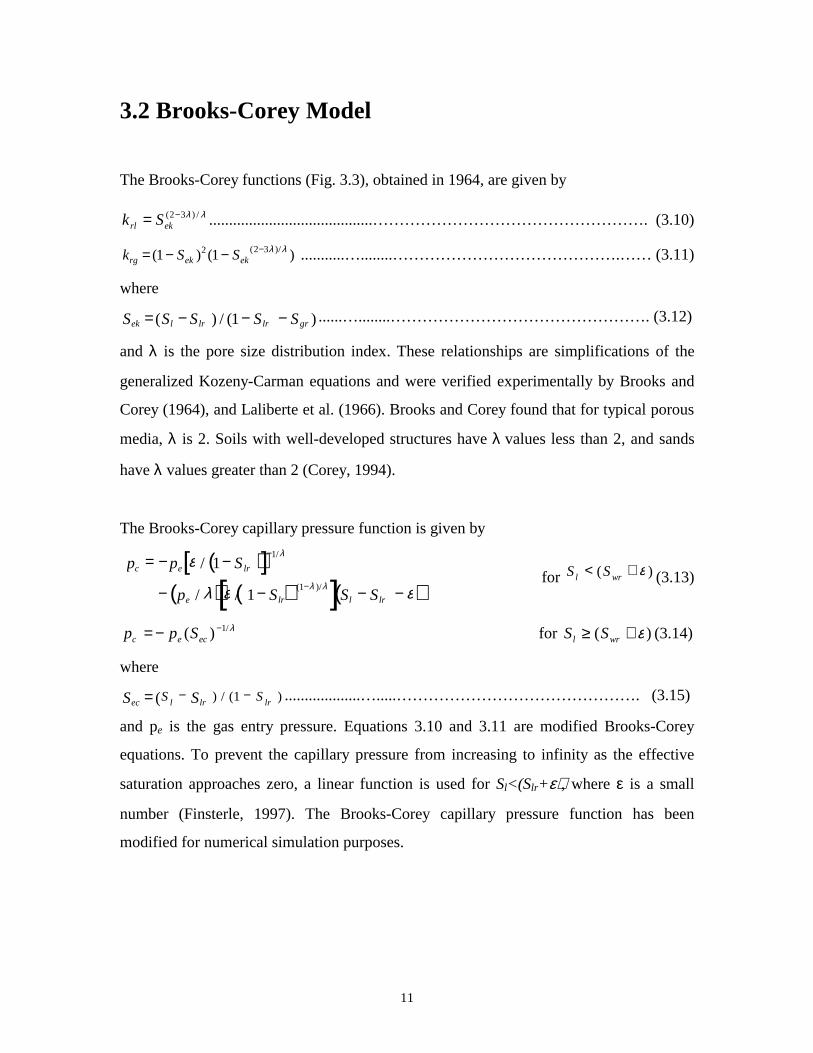
3.2 Brooks-Corey Model
The Brooks-Corey functions (Fig. 3.3), obtained in 1964, are given by
λλ /)32( −= ekrl Sk .........................................……………………………………………. (3.10)
k S Srg ek ek= − − −( ) ( )( )/1 12 2 3λ λ ...........…........…………………………………….…… (3.11)
where
S S S S Sek l lr lr gr= − − −( ) / ( )1 ......…........…………………………………………. (3.12)
and λ is the pore size distribution index. These relationships are simplifications of the
generalized Kozeny-Carman equations and were verified experimentally by Brooks and
Corey (1964), and Laliberte et al. (1966). Brooks and Corey found that for typical porous
media, λ is 2. Soils with well-developed structures have λ values less than 2, and sands
have λ values greater than 2 (Corey, 1994).
The Brooks-Corey capillary pressure function is given by
( )[ ]( ) ( )[ ]( )
p p S
p S S S
c e lr
e lr l lr
= − −
− − − −
−
−
ε
λ ε ε
λ
λ λ
/
/ /
/
( )/
1
1
1
1 for S Sl wr
< +( )ε (3.13)
p p Sc e ec= − −( ) /1 λ for S Sl wr≥ +( )ε (3.14)
where
S S S Sec l lr lr= − −( ) / ( )1 ...................….....………………………………………. (3.15)
and pe is the gas entry pressure. Equations 3.10 and 3.11 are modified Brooks-Corey
equations. To prevent the capillary pressure from increasing to infinity as the effective
saturation approaches zero, a linear function is used for Sl<(Slr+ε), where ε is a small
number (Finsterle, 1997). The Brooks-Corey capillary pressure function has been
modified for numerical simulation purposes.

12
0
0.1
0.2
0.3
0.4
0.5
0.6
0.7
0.8
0.9
1
0 0.1 0.2 0.3 0.4 0.5 0.6 0.7 0.8 0.9 1
S l
kr
k r l
k rg
Figure 3.3 Brooks-Corey relative permeability.
3.3 van Genuchten Model
The van Genuchten relative permeability (Fig. 3.4) and capillary pressure functions are
given by
[ ]k S Srl ek ekm m= − −1 2 1 2
1 1/ /( ( ) ……………………………………………………… (3.16)
[ ]k S Srg ek ekm m
= − −( ) / /1 11 3 1 2………………………………………………………. (3.17)
[ ]p Sc ecm n
= − −−111 1
α( ) / /
for S Sl wr≥ +( )ε (3.18)
pc = linear model with continuos slope at S Sl wr= + ε for S Sl wr< +( )ε (3.19)
where
m = 1 – 1/n …………………………………………………………………………..(3.20)
The parameter, n is analogous to λ, and α is analogous to pe in the Brooks-Corey
functions. Equations 3.15 and 3.16 are modified versions of the van Genuchten equations.
In order to prevent the capillary pressure from going to infinity as the liquid saturation
approaches zero, a linear function is used for Sl<(Slr+ε), where ε is a small number
(Finsterle, 1997).

13
0
0.1
0.2
0.3
0.4
0.5
0.6
0.7
0.8
0.9
1
0 0.1 0.2 0.3 0.4 0.5 0.6 0.7 0.8 0.9 1
S l
kr
k r l
k rg
Figure 3.4 van Genuchten relative permeability.

14
Chapter 4
Experimental Apparatus and Procedure
The vertical boiling experiment considered in this study was conducted by Satik (1997a).
Figure 4.1 shows a schematic diagram of the apparatus, which consists of a core holder, a
data acquisition system, and a balance. A Berea sandstone core was used in the
experiment. The core had a diameter of 5.08 cm, length of 43.2 cm, absolute permeability
of 780 md, and average porosity of 22% (Table 4.1). Before conducting the experiment,
the core was evacuated and then saturated with pre-boiled water to ensure that there was
no air trapped in the pore space. The core was confined in an epoxy core holder to prevent
fluid from leaking and insulated with a 5.08-cm thick fiber blanket to minimize heat
losses in the radial direction. The heater was attached to the bottom of the core, and was
insulated with ceramic fiberboard. During the experiment, the heating end of the core was
closed to fluid flow while the opposite end was connected to a water reservoir placed on a
balance. The balance was used to monitor the amount of water coming out of the core
during the boiling process (Fig. 4.1).
Figure 4.1. Schematic diagram of the experimental apparatus (after Satik, 1997b).

15
During the experiment, pressure was measured in the core using pressure transducers at
11 locations along the core. Temperature was measured between the epoxy and core
insulation using thermocouples that were located at the same points as the pressure
transducers. In previous experiments, Satik (1997b) found out that the maximum
difference between the temperature in the center of the core and the wall temperature was
less than 2oC. This suggested that the radial temperature gradient along the core was not
significant under these experimental conditions and therefore it would be adequate to
measure wall temperatures only. Similarly, heat flux was measured between the epoxy
and core insulation and at the inlet end of the core holder. Steam saturation was measured
at every 1-cm increment along the core using a CT scanner. The heat flow rate was
increased every time steady-state flow conditions had been reached. At each heat flow
rate increase, steady state conditions were observed when the water production rate
became zero, and the pressure, temperature, and heat flux measurements stabilized during
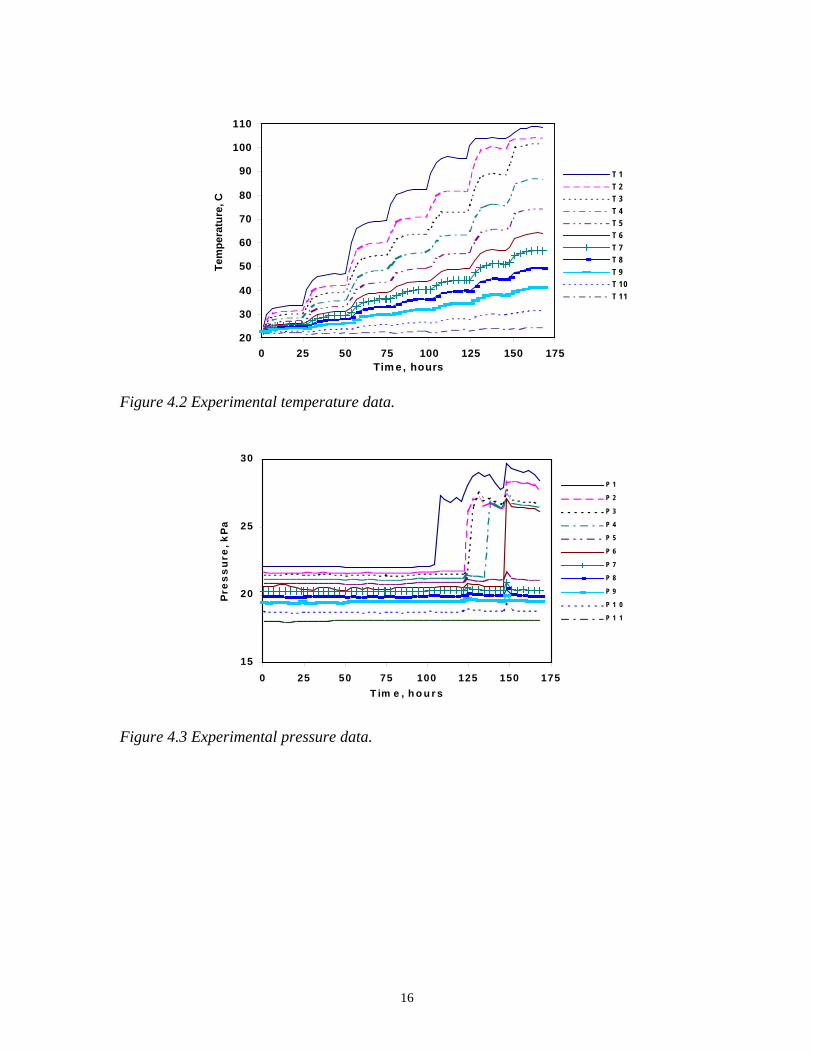
boiling. Results showed that boiling occurred 118 hours after the start of the experiment
that lasted for 169.5 hours (Figs 4.2-4.5). In the plots shown, T1, P1, Sst1, and H1 are
temperature, pressure, steam saturation, and heat flux data measured at sensor 1 (1 cm
from the heater), T2, P2, Sst2, and H2 are data observed at sensor 2 (5 cm from the
heater), etc.
Table 4.1. Physical properties of the cores, epoxy, core insulation, and heater insulation.
Material φ
%
k
10-15 m2
α
W/m-oC
C
J/kg-oC
ρ
kg/m3
Berea 22 780 4.326 858.2 2163
Epoxy 2.885 1046.6 1200
Core insulation 0.055 104.7 192
Heater insulation 0.065 1046.6 240
16
20
30
40
50
60
70
80
90
100
110
0 25 50 75 100 125 150 175Tim e , hours
Tem
per
atu
re, C
T 1
T 2
T 3
T 4
T 5
T 6
T 7
T 8
T 9
T 10
T 11
Figure 4.2 Experimental temperature data.
15
20
25
30
0 25 50 75 100 125 150 175
T im e , h o u r s
Pre
ss
ure
, k
Pa
P 1
P 2
P 3
P 4
P 5
P 6
P 7
P 8
P 9
P 1 0
P 1 1
Figure 4.3 Experimental pressure data.

17
Figure 4.4 Experimental steam saturation data.
0
50
100
150
200
250
300
350
400
450
0 25 50 75 100 125 150 175Tim e, hours
Hea
t F
lux,
W/m
^2
H F 1
H F 2
H F 3
H F 4
H F 5
H F 6
H F 7
H F 8
H F 9
H F 10
H F 11
Figure 4.5 Experimental heat flux data.
0
0.1
0.2
0.3
0.4
0.5
0.6
0.7
0.8
0.9
1
0 25 50 75 100 125 150 175
T im e , hours
Ste
am
Sa
tura
tio
n
S s t 1
S s t 2
S s t 3
S s t 4
S s t 5
S s t 6
S s t 7
S s t 8
S s t 9
S s t 1 0
S s t 1 1
18
Chapter 5
Numerical Simulation
Numerical simulation provides a method to visualize or predict the performance of a
system under certain operating conditions. For heat and fluid flow in porous media, the
number and type of equations to be solved depend on the rock properties, characteristics
of the fluids, and process to be modeled. The independent primary variables that
completely define the thermodynamic state of the flow system are pressure, temperature,
and air mass fraction in single-phase flow, and they are temperature, pressure, and gas
saturation in two-phase flow (Pruess, 1987).
In this chapter, the steps involved in modeling the vertical boiling experiment described
in the previous chapter and estimating the two-phase parameters will be discussed. These
steps include constructing a model, and carrying out forward and inverse calculations.
5.1 Model
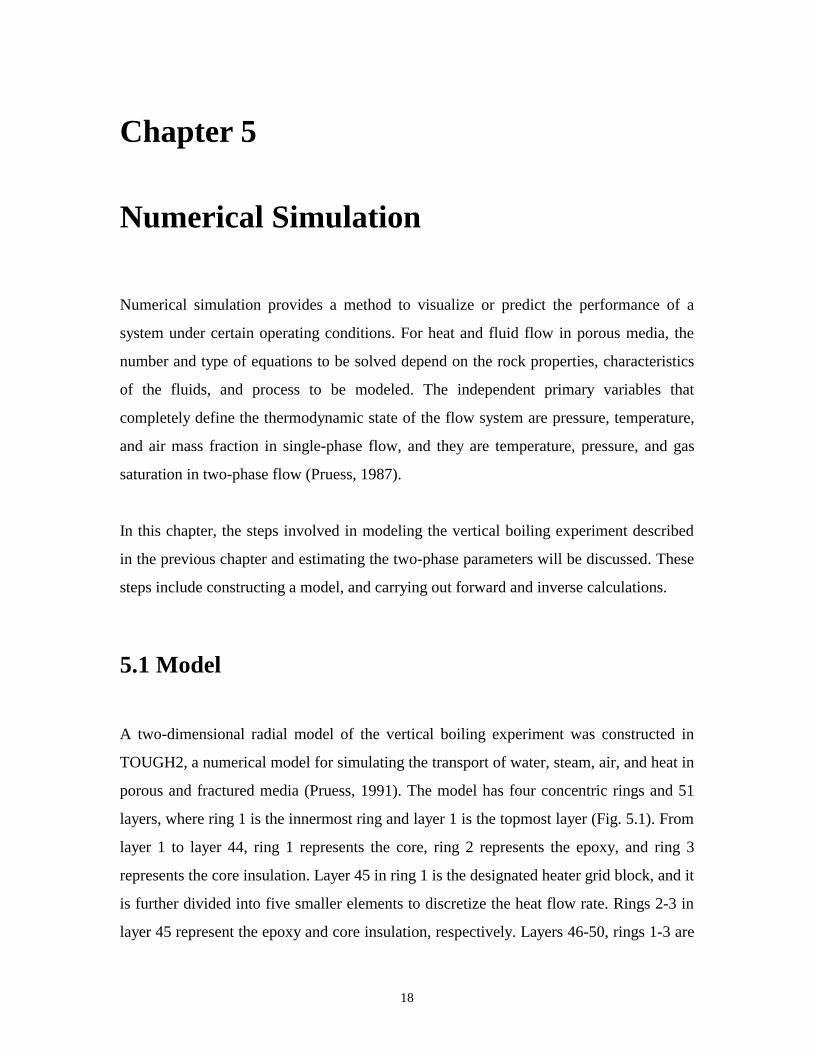
A two-dimensional radial model of the vertical boiling experiment was constructed in
TOUGH2, a numerical model for simulating the transport of water, steam, air, and heat in
porous and fractured media (Pruess, 1991). The model has four concentric rings and 51
layers, where ring 1 is the innermost ring and layer 1 is the topmost layer (Fig. 5.1). From
layer 1 to layer 44, ring 1 represents the core, ring 2 represents the epoxy, and ring 3
represents the core insulation. Layer 45 in ring 1 is the designated heater grid block, and it
is further divided into five smaller elements to discretize the heat flow rate. Rings 2-3 in
layer 45 represent the epoxy and core insulation, respectively. Layers 46-50, rings 1-3 are

19
core insulation elements. Constant pressure boundary conditions were applied to all rings
in layer 1 to maintain initial conditions at the top of the core, and to simulate water
flowing out from the top of the core during the boiling process. The pressure at the
boundary was equal to the measured pressure at the top end of the core. To model heat
loss to the surroundings, ambient conditions were applied to all elements in ring 4 and
layer 51. Grid blocks associated with constant pressure boundary and ambient conditions
had very large volumes to ensure that their thermodynamic states remained constant in a
simulation. An absolute permeability value was assigned only in the vertical direction
since fluid did not flow out in the radial direction. Initially, each grid block was at
atmospheric temperature and pressure.
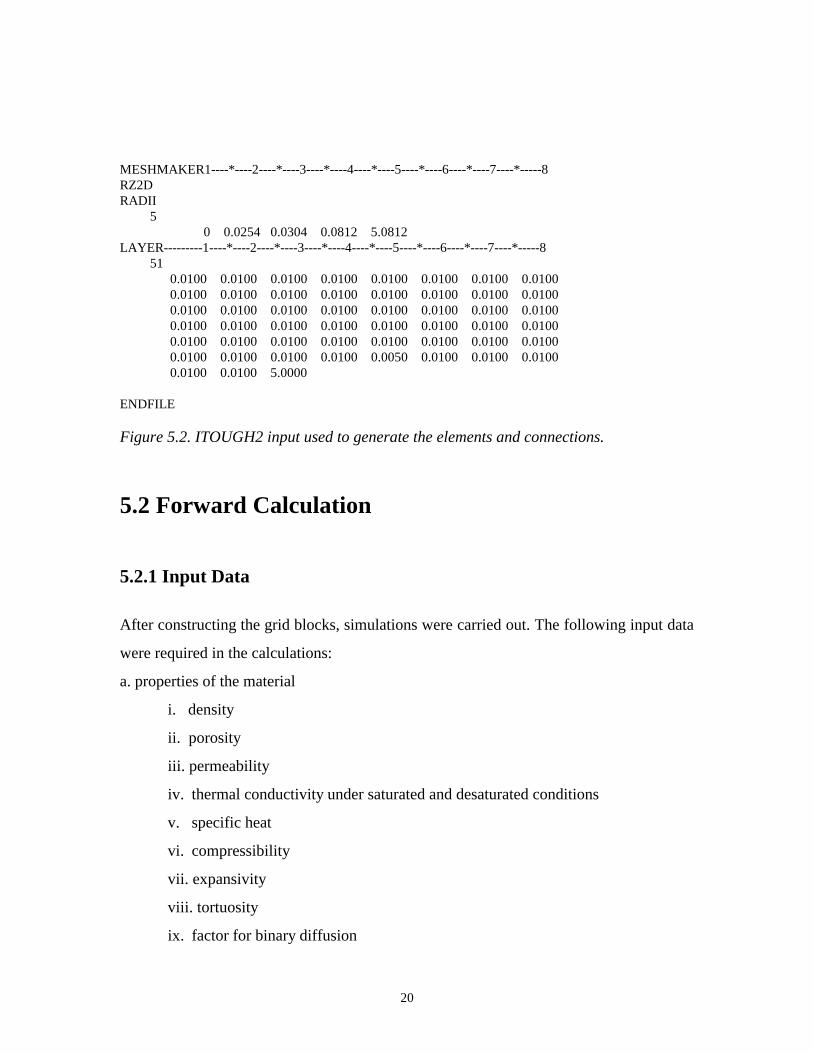
Figure 5.2 shows the input file used to generate the elements and the connection between
elements for the first experiment. RZ2D invokes generation of a radially symmetric mesh.
The RADII record gives the radius (cm) of each element (sandstone, epoxy, core
insulation, and air), while the LAYER record gives the thickness (cm) of each layer
(sandstone, heater, heater insulation, and air). The last entries in RADII and LAYER are
much larger than the previous entries because they constitute the ambient grid blocks.
Figure 5.1. Schematic diagram of the 4×51 TOUGH2 model. Ring 4 is not shown sinceit represents ambient conditions.
20
MESHMAKER1----*----2----*----3----*----4----*----5----*----6----*----7----*-----8RZ2DRADII 5 0 0.0254 0.0304 0.0812 5.0812LAYER---------1----*----2----*----3----*----4----*----5----*----6----*----7----*-----8 51 0.0100 0.0100 0.0100 0.0100 0.0100 0.0100 0.0100 0.0100 0.0100 0.0100 0.0100 0.0100 0.0100 0.0100 0.0100 0.0100 0.0100 0.0100 0.0100 0.0100 0.0100 0.0100 0.0100 0.0100 0.0100 0.0100 0.0100 0.0100 0.0100 0.0100 0.0100 0.0100 0.0100 0.0100 0.0100 0.0100 0.0100 0.0100 0.0100 0.0100 0.0100 0.0100 0.0100 0.0100 0.0050 0.0100 0.0100 0.0100 0.0100 0.0100 5.0000
ENDFILE
Figure 5.2. ITOUGH2 input used to generate the elements and connections.
5.2 Forward Calculation
5.2.1 Input Data
After constructing the grid blocks, simulations were carried out. The following input data
were required in the calculations:
a. properties of the material
i. density
ii. porosity
iii. permeability
iv. thermal conductivity under saturated and desaturated conditions
v. specific heat
vi. compressibility
vii. expansivity
viii. tortuosity
ix. factor for binary diffusion

21
b. process
i. heat injection rate
ii. duration
c. relative permeability relation
i. parameters
d. capillary pressure relation
i. parameters
e. gravity effects
f. initial conditions
i. temperature
ii. pressure
iii. air fraction
g. boundary conditions
i. pressure
ii. temperature
iii. gravity effect
h. computation parameters
5.2.2 Sensitivity Analysis
A sensitivity analysis was carried out in order to make reasonable initial guesses for the
different parameters of interest and to better understand the system behavior. It was
necessary to decouple the thermal parameters from the hydrogeologic parameters since
the production of steam from liquid water in the experiments was highly dependent on the
thermal properties of the materials and heat source. Thus, the thermal properties were
studied under single-phase liquid conditions, while the hydrogeologic properties were
studied under two-phase conditions.
Under single-phase liquid conditions, only temperature and heat flux were used to
determine the effects of the thermal conductivity of each material. Temperature and heat
flux profiles (with respect to the distance from the core) at five different times were
22
generated for a base scenario (Fig. 5.3). These were compared with results obtained from
changing the thermal conductivity of each material one at a time. At lower values of the
thermal conductivity of the sandstone, αs, the temperature and heat flux at the heating end
of the core were slightly greater than at higher values of αs (Figs. 5.3 and 5.4). However,
the temperature and heat flux profiles look almost identical at points farther away from
the heater. If the heat input were greater, the effects of variations in αs would not have
been localized in areas close to the heater only. At lower values of the thermal
conductivity of the base insulation, αb, the temperature and heat flux were greater (Figs.
5.3 and 5.5). The profiles become almost identical at points beyond 15 cm from the
heater. At higher values of the thermal conductivity of the heater insulation, αi, the
temperature was less than at lower values of αi. On other hand, heat flux through the core
wall increased with increasing αi (Figs. 5.3 and 5.6). The temperature and heat flux
profiles show that the system is highly sensitive to variations in αi since changes in
temperature and heat flux were observed in the entire length of the core. Changes in
temperature and heat were not observed as the thermal conductivity values of the epoxy
or heater was varied. Thus, the temperature and heat flux are most sensitive to changes in
αi, followed by αb, then by αs.
Under two-phase conditions, effects of variations in the parameters on temperature,
pressure, steam saturation, and heat flux were studied. However, only the first three
observation types are shown and discussed since the heat flux behaved like the
temperature. Hence, when temperature increased, heat flux at the same point also
increased. Six cases were considered for study: 1) linear relative permeability and
capillary pressure, 2) Corey relative permeability and linear capillary pressure, 3) linear
relative permeability and Leverett capillary pressure, 4) Corey relative permeability and
Leverett capillary pressure, 5) Brooks-Corey relative permeability and capillary pressure,
and 6) van Genuchten relative permeability and capillary pressure.
23
In the linear relative permeability and capillary pressure case, the parameters of interest
were Slr, Sls, Sgr, Sgs, and Pcmax. Figure 5.7 shows a base case for this analysis. Varying Slr
or Sls did not affect the temperature, pressure, and steam saturation distribution in the
two-phase region. The pressure and steam saturation decreased, but the temperature was
not significantly affected, with decreasing Sgr, or Sgs (Figs. 5.8-5.9). The effects of varying
Sgs, however, were not as significant as changing Sgr in the propagation of steam in the
core. The temperature increased considerably in the heating end of the core, but decreased
in the two-phase region with decreasing capillary pressure (Fig. 5.10). Also, the saturation
increased and the pressure decreased significantly with decreasing capillary pressure. The
sudden increase in temperature in the heating end of the core was due to the fact that
superheated steam was present, while the lower temperature in the two-phase region was
due to the lower steam pressure resulting from reduced capillary pressure.
In the Corey relative permeability and linear capillary pressure case, the parameters were
Slr, Sgr, and Pcmax. A base case is shown in Figure 5.11. Results of the sensitivity analysis
showed that the temperature, steam saturation and pressure increased in the two-phase
region with decreasing Slr (Fig. 5.12) On the other hand, the temperature, steam
saturation, and pressure decreased with decreasing Sgr (Fig. 5.13). The effects of varying
Sgr, however, were more significant than the effects of varying Slr. In the two-phase
region, the temperature, pressure, and steam saturation decreased as Pcmax was reduced
(Fig. 5.14). Also, single-phase steam was formed in the heating end of the core as Pcmax
was decreased. Not surprisingly, the two-phase isothermal region shortened with
decreasing capillary pressure since there was less steam pressure to displace the liquid
water.
There were four unknowns considered in the Corey relative permeability and Leverett
capillary pressure case. They were Slr (related to the relative permeability function), Sgr,
Po, and Slr (related to the capillary pressure function). Figure 5.15 shows a base scenario.
As in the previous case, temperature, steam saturation and pressure slightly increased in
the two-phase region with decreasing Slr (relative permeability) (Fig 5.16), and decreased

24
with decreasing Sgr (Fig. 5.17). In the two-phase region, temperature and pressure
decreased while steam saturation increased with decreasing Po (Fig. 5.18). Furthermore,
single-phase steam was formed at the heating end of the core as Po was reduced. The two-
phase region was suppressed as Po was decreased. Pressure and steam saturation slightly
decreased with decreasing Slr (capillary pressure), although temperature remained
constant (Fig. 5.19).
The six unknown parameters considered in the linear relative permeability and Leverett
capillary pressure case were Slr (relative permeability), Sgr, Sls, Sgs, Po, and Sls (capillary
pressure). A base case is shown in Figure 5.20. Results of the sensitivity analysis showed
that variations in Slr and Sls did not have any effect on the temperature, pressure, and
steam saturation. Pressure and steam saturation declined with decreasing Sgr or Sgs (Figs.
5.21 and 5.22). However, temperature remained unchanged. In the two-phase region,
temperature, pressure, and steam saturation decreased, while a superheated steam region
at the heating end of the core was formed as Po was reduced (Fig. 5.23). As in the
previous case, the propagation of steam was deterred by reduced capillary pressure.
Decreasing Slr (capillary pressure) slightly reduced the pressure and increased the
saturation, while keeping the temperature constant (Fig. 5.24).
In the Brooks-Corey model the unknowns were Slr, Sgr, λ, and pe. A base scenario is
shown in Figure 5.25. The temperature, pressure, and steam saturation rose in the two-
phase region with decreasing Slr (Fig. 5.26) but decreased with declining Sgr (Fig. 5.27).
Reducing λ increased the temperature, pressure, and steam saturation in the two-phase
region (Fig 5.28). Due to the more even distribution of pore size, the rate of increase in
steam saturation is faster. Decreasing pe increased the temperature and decreased the
pressure (Fig. 5.29). However, the steam formed at the heating end of the core was not
propagated much farther away from the heater due to reduced capillary pressure.
Finally, the four parameters considered in the van Genuchten model were Slr, Sgr, n, and
1/α. A base scenario is shown in Figure 5.30. The temperature, pressure, and steam

25
saturation decreased in the two-phase region as Slr was reduced (Fig. 5.31). Similarly, the
pressure and steam saturation decreased with declining Sgr (Fig. 5.32). However, the
temperature remained constant. The temperature and steam saturation decreased while the
pressure increased as n decreased or 1/α increased (Fig. 5.33). Reduced capillary pressure
enhanced formation of superheated steam at the heating end of the core.
To summarize, the sensitivity analysis showed that temperature and heat flux were
dependent on the heat losses from the heater, sandstone, and insulation materials under
single-phase liquid conditions. Hydrogeologic parameters affected the system only when
two-phase conditions existed. They determined the temperature, pressure, and saturation
distribution within the core, and the upward propagation of steam. The observations made
in the experiments were more sensitive to the steam relative permeability than to the
liquid relative permeability.
26
0
10
20
30
40
50
60
70
80
90
0 5 10 15 20 25 30 35 40 45
15 hrs
24 hrs
47 hrs
72 hrs
98 hrs
Dis tance from the He ater , cm
Te
mp
era
ture
, C
0
50
100
150
200
250
300
0 5 10 15 20 25 30 35 40 45
15 hrs
24 hrs
47 hrs
72 hrs
98 hrs
Dis tance from the He ate r , cm
He
at
Flu
x,
W/m
^2
Figure 5.3 Base scenario: αs=4.930 W/m2, αb=0.150 W/m2, αi=0.115 W/m2, αh=2.885W/m2 and αe=0.577 W/m2.

27
0
10
20
30
40
50
60
70
80
90
0 5 10 15 20 25 30 35 40 45
15 hrs
24 hrs
47 hrs
72 hrs
98 hrs
Dis tance from the Heater, cm
Te
mp
era
ture
, C
0
50
100
150
200
250
300
0 5 10 15 20 25 30 35 40 45
15 hrs
24 hrs
47 hrs
72 hrs
98 hrs
Dis tance from the He ate r , cm
He
at
Flu
x,
W/m
^2
Figure 5.4 αs=4.300 W/m2, αb=0.150 W/m2, αi=0.115 W/m2, αh=2.885 W/m2 andαe=0.577 W/m2.

28
0
10
20
30
40
50
60
70
80
90
0 5 10 15 20 25 30 35 40 45
15 hrs
24 hrs
47 hrs
72 hrs
98 hrs
Dis tance from the He ate r , cm
Te
mp
era
ture
, C
0
50
100
150
200
250
300
0 5 10 15 20 25 30 35 40 45
15 hrs
24 hrs
47 hrs
72 hrs
98 hrs
Dis tance from the He ate r , cm
He
at
Flu
x,
W/m
^2
Figure 5.5 αs=4.930 W/m2, αb=0.090 W/m2, αi=0.115 W/m2, αh=2.885 W/m2 andαe=0.577 W/m2.

29
0
10
20
30
40
50
60
70
80
0 5 10 15 20 25 30 35 40 45
15 hrs
24 hrs
47 hrs
72 hrs
98 hrs
Dis tance from the He ate r , cm
Te
mp
era
ture
, C
0
50
100
150
200
250
300
0 5 10 15 20 25 30 35 40 45
15 hrs
24 hrs
47 hrs
72 hrs
98 hrs
Dis tance from the He ate r , cm
He
at
Flu
x,
W/m
^2
Figure 5.6 αs=4.930 W/m2, αb=0.150 W/m2, αi=0.175 W/m2, αh=2.885 W/m2 andαe=0.577 W/m2.
30
0
20
40
60
80
100
120
0 5 10 15 20 25 30 35 40 45
127 hrs
146 hrs
168 hrs
Dis tance from the He ate r, cm
Te
mp
era
ture
, C
0
10
20
30
40
50
60
70
0 5 10 15 20 25 30 35 40 45
127 hrs
146 hrs
168 hrs
Dis tance from the He ate r , cm
Pre
ss
ure
, k
Pa
0
0.1
0.2
0.3
0.4
0.5
0.6
0.7
0.8
0.9
1
0 5 10 15 20 25 30 35 40 45
127 hrs
146 hrs
168 hrs
Dis tance from the He ate r , cm
Ste
am
Sa
tura
tio
n
Figure 5.7 Base case linear model: Slr=0.20, Sgr=0.20, Sls=0.80, Sgs=0.80, Pcmax=105 Pa

31
0
20
40
60
80
100
120
0 5 10 15 20 25 30 35 40 45
127 hrs
146 hrs
168 hrs
Dis tance from the He ate r , cm
Te
mp
era
ture
, C
0
10
20
30
40
50
60
70
0 5 10 15 20 25 30 35 40 45
127 hrs
146 hrs
168 hrs
Dis tance from the He ate r , cm
Pre
ss
ure
, k
Pa
0
0.1
0.2
0.3
0.4
0.5
0.6
0.7
0.8
0.9
1
0 5 10 15 20 25 30 35 40 45
127 hrs
146 hrs
168 hrs
Dis tance from the He ate r , cm
Ste
am
Sa
tura
tio
n
Figure 5.8 Linear model: Slr=0.02, Sgr=0.10, Sls=0.80, Sgs=0.80, Pcmax=105 Pa.
32
0
20
40
60
80
100
120
0 5 10 15 20 25 30 35 40 45
127 hrs
146 hrs
168 hrs
Dis tance from the He ate r , cm
Te
mp
era
ture
, C
0
10
20
30
40
50
60
70
0 5 10 15 20 25 30 35 40 45
127 hrs
146 hrs
168 hrs
Dis tance from the He ate r , cm
Pre
ss
ure
, k
Pa
0
0.1
0.2
0.3
0.4
0.5
0.6
0.7
0.8
0.9
1
0 5 10 15 20 25 30 35 40 45
127 hrs
146 hrs
168 hrs
Dis tance from the He ate r, cm
Ste
am
Sa
tura
tio
n
Figure 5.9 Linear model: Slr=0.02, Sgr=0.20, Sls=0.80, Sgs=0.70, Pcmax=105 Pa

33
0
20
40
60
80
100
120
140
0 5 10 15 20 25 30 35 40 45
127 hrs
146 hrs
168 hrs
Dis tance from the He ate r , cm
Te
mp
era
ture
, C
0
10
20
30
40
50
60
70
0 5 10 15 20 25 30 35 40 45
127 hrs
146 hrs
168 hrs
Dis tance from the He ate r , cm
Pre
ss
ure
, k
Pa
0
0.1
0.2
0.3
0.4
0.5
0.6
0.7
0.8
0.9
1
0 5 10 15 20 25 30 35 40 45
127 hrs
146 hrs
168 hrs
Dis tance from the He ate r , cm
Ste
am
Sa
tura
tio
n
Figure 5.10 Linear model: Slr=0.02, Sgr=0.20, Sls=0.80, Sgs=0.80, Pcmax=104 Pa.

34
0
20
40
60
80
100
120
0 5 10 15 20 25 30 35 40 45
127 hrs
146 hrs
168 hrs
Dis tance from the He ate r, cm
Te
mp
era
ture
, C
0
20
40
60
80
100
0 5 10 15 20 25 30 35 40 45
127 hrs
146 hrs
168 hrs
Dis tance from the He ate r, cm
Pre
ss
ure
, k
Pa
0
0.1
0.2
0.3
0.4
0.5
0.6
0.7
0.8
0.9
1
0 5 10 15 20 25 30 35 40 45
127 hrs
146 hrs
168 hrs
Dis tance from the He ate r , cm
Ste
am
Sa
tura
tio
n
Figure 5.11 Base case: Corey relative permeability and linear capillary model: Slr=0.20,Sgr=0.20, Pcmax=105 Pa.
35
0
20
40
60
80
100
120
0 5 10 15 20 25 30 35 40 45
127 hrs
146 hrs
168 hrs
Dis tance from the He ate r , cm
Te
mp
era
ture
, C
0
20
40
60
80
100
0 5 10 15 20 25 30 35 40 45
127 hrs
146 hrs
168 hrs
Dis tance from the He ate r , cm
Pre
ss
ure
, k
Pa
0
0.1
0.2
0.3
0.4
0.5
0.6
0.7
0.8
0.9
1
0 5 10 15 20 25 30 35 40 45
127 hrs
146 hrs
168 hrs
Dis tance from the He ate r , cm
Ste
am
Sa
tura
tio
n
Figure 5.12 Corey relative permeability and linear capillary model: Slr=0.10, Sgr=0.20, Pcmax=105 Pa.
36
0
20
40
60
80
100
120
0 5 10 15 20 25 30 35 40 45
127 hrs
146 hrs
168 hrs
Dis tance from the He ate r , cm
Te
mp
era
ture
, C
0
20
40
60
80
100
0 5 10 15 20 25 30 35 40 45
127 hrs
146 hrs
168 hrs
Dis tance from the He ate r , cm
Pre
ss
ure
, k
Pa
0
0.1
0.2
0.3
0.4
0.5
0.6
0.7
0.8
0.9
1
0 5 10 15 20 25 30 35 40 45
127 hrs
146 hrs
168 hrs
Dis tance fr om the He ate r , cm
Ste
am
Sa
tura
tio
n
Figure 5.13 Corey relative permeability and linear capillary model: Slr=0.20, Sgr=0.10,Pcmax=105 Pa.

37
0
50
100
150
200
250
300
0 5 10 15 20 25 30 35 40 45
127 hrs
146 hrs
168 hrs
Dis tance from the He ate r , cm
Te
mp
era
ture
, C
0
20
40
60
80
100
0 5 10 15 20 25 30 35 40 45
127 hrs
146 hrs
168 hrs
Dis tance from the He ate r , cm
Pre
ss
ure
, k
Pa
0
0.1
0.2
0.3
0.4
0.5
0.6
0.7
0.8
0.9
1
0 5 10 15 20 25 30 35 40 45
127 hrs
146 hrs
168 hrs
Dis tance from the He ate r , cm
Ste
am
Sa
tura
tio
n
Figure 5.14 Corey relative permeability and linear capillary model: Slr=0.20, Sgr=0.20,Pcmax=104 Pa.
38
0
20
40
60
80
100
120
0 5 10 15 20 25 30 35 40 45
127 hrs
146 hrs
168 hrs
Distance from the He ater, cm
Te
mp
era
ture
, C
0
10
20
30
0 5 10 15 20 25 30 35 40 45
127 hrs
146 hrs
168 hrs
Distance from the Heater, cm
Pre
ss
ure
, k
Pa
0
0.1
0.2
0.3
0.4
0.5
0.6
0.7
0.8
0.9
1
0 5 10 15 20 25 30 35 40 45
127 hrs
146 hrs
168 hrs
Dis tance from the He ate r , cm
Ste
am
Sa
tura
tio
n
Figure 5.15 Base case: Corey relative permeability and Leverett capillary pressure:Slr(RP)=0.20, Sgr=0.20, Po=105. Slr (CP)=0.20.

39
0
20
40
60
80
100
120
0 5 10 15 20 25 30 35 40 45
127 hrs
146 hrs
168 hrs
Dis tance from the He ater, cm
Te
mp
era
ture
, C
0
10
20
30
0 5 10 15 20 25 30 35 40 45
127 hrs
146 hrs
168 hrs
Dis tance from the Heate r, cm
Pre
ss
ure
, k
Pa
0
0.1
0.2
0.3
0.4
0.5
0.6
0.7
0.8
0.9
1
0 5 10 15 20 25 30 35 40 45
127 hrs
146 hrs
168 hrs
Dis tance from the He ate r , cm
Ste
am
Sa
tura
tio
n
Figure 5.16 Corey relative permeability and Leverett capillary pressure: Slr(RP)=0.10,Sgr=0.20, Po=105. Slr (CP)=0.20.

40
0
20
40
60
80
100
120
0 5 10 15 20 25 30 35 40 45
127 hrs
146 hrs
168 hrs
Dis tance from the He ate r , cm
Te
mp
era
ture
, C
0
10
20
30
0 5 10 15 20 25 30 35 40 45
127 hrs
146 hrs
168 hrs
Dis tance from the He ate r , cm
Pre
ss
ure
, k
Pa
0
0.1
0.2
0.3
0.4
0.5
0.6
0.7
0.8
0.9
1
0 5 10 15 20 25 30 35 40 45
127 hrs
146 hrs
168 hrs
Dis tance from the He ate r , cm
Ste
am
Sa
tura
tio
n
Figure 5.17 Corey relative permeability and Leverett capillary pressure: Slr(RP)=0.20,Sgr=0.10, Po=105. Slr (CP)=0.20.

41
0
20
40
60
80
100
120
140
0 5 10 15 20 25 30 35 40 45
127 hrs
146 hrs
168 hrs
Dis tance from the He ate r , cm
Te
mp
era
ture
, C
0
10
20
30
0 5 10 15 20 25 30 35 40 45
127 hrs
146 hrs
168 hrs
Dis tance from the He ate r, cm
Pre
ss
ure
, k
Pa
0
0.1
0.2
0.3
0.4
0.5
0.6
0.7
0.8
0.9
1
0 5 10 15 20 25 30 35 40 45
127 hrs
146 hrs
168 hrs
Dis tance from the He ate r , cm
Ste
am
Sa
tura
tio
n
Figure 5.18 Corey relative permeability and Leverett capillary pressure: Slr(RP)=0.20,Sgr=0.20, Po=104, Slr (CP)=0.20.

42
0
20
40
60
80
100
120
0 5 10 15 20 25 30 35 40 45
127 hrs
146 hrs
168 hrs
Dis tance from the He ate r , cm
Te
mp
era
ture
, C
0
10
20
30
0 5 10 15 20 25 30 35 40 45
127 hrs
146 hrs
168 hrs
Dis tance from the He ate r, cm
Pre
ss
ure
, k
Pa
0
0.1
0.2
0.3
0.4
0.5
0.6
0.7
0.8
0.9
1
0 5 10 15 20 25 30 35 40 45
127 hrs
146 hrs
168 hrs
Dis tance from the Heater, cm
Ste
am
Sa
tura
tio
n
Figure 5.19 Corey relative permeability and Leverett capillary pressure: Slr(RP)=0.20,Sgr=0.20, Po=105, Slr (CP)=0.10.

43
0
20
40
60
80
100
120
0 5 10 15 20 25 30 35 40 45
127 hrs
146 hrs
168 hrs
Dis tance from the He ate r , cm
Te
mp
era
ture
, C
0
10
20
30
0 5 10 15 20 25 30 35 40 45
127 hrs
146 hrs
168 hrs
Dis tance from the He ate r, cm
Pre
ss
ure
, k
Pa
0
0.1
0.2
0.3
0.4
0.5
0.6
0.7
0.8
0.9
1
0 5 10 15 20 25 30 35 40 45
127 hrs
146 hrs
168 hrs
Dis tance from the He ate r , cm
Ste
am
Sa
tura
tio
n
Figure 5.20 Base case: Linear relative permeability and Leverett capillary pressure:Slr(RP)=0.20, Sgr=0.20, Sls=0.80, Sgs=0.80, Po=105, Slr (CP)=0.20.
44
0
20
40
60
80
100
120
0 5 10 15 20 25 30 35 40 45
127 hrs
146 hrs
168 hrs
Dis tance from the He ate r , cm
Te
mp
era
ture
, C
0
10
20
30
0 5 10 15 20 25 30 35 40 45
127 hrs
146 hrs
168 hrs
Dis tance from the Heater, cm
Pre
ss
ure
, k
Pa
0
0.1
0.2
0.3
0.4
0.5
0.6
0.7
0.8
0.9
1
0 5 10 15 20 25 30 35 40 45
127 hrs
146 hrs
168 hrs
Dis tance from the Heate r, cm
Ste
am
Sa
tura
tio
n
Figure 5.21 Linear relative permeability and Leverett capillary pressure: Slr(RP)=0.20,Sgr=0.10, Sls=0.80, Sgs=0.80, Po=105, Slr (CP)=0.20

45
0
20
40
60
80
100
120
0 5 10 15 20 25 30 35 40 45
127 hrs
146 hrs
168 hrs
Dis tance from the He ate r , cm
Te
mp
era
ture
, C
0
10
20
30
0 5 10 15 20 25 30 35 40 45
127 hrs
146 hrs
168 hrs
Dis tance from the He ate r, cm
Pre
ss
ure
, k
Pa
0
0.1
0.2
0.3
0.4
0.5
0.6
0.7
0.8
0.9
1
0 5 10 15 20 25 30 35 40 45
127 hrs
146 hrs
168 hrs
Dis tance from the He ate r, cm
Ste
am
Sa
tura
tio
n
Figure 5.22 Linear relative permeability and Leverett capillary pressure: Slr(RP)=0.20,Sgr=0.20, Sls=0.80, Sgs=0.70, Po=105, Slr (CP)=0.2

46
0
20
40
60
80
100
120
0 5 10 15 20 25 30 35 40 45
127 hrs
146 hrs
168 hrs
Dis tance from the Heater, cm
Te
mp
era
ture
, C
0
10
20
30
0 5 10 15 20 25 30 35 40 45
127 hrs
146 hrs
168 hrs
Dis tance from the Heater, cm
Pre
ss
ure
, k
Pa
0
0.1
0.2
0.3
0.4
0.5
0.6
0.7
0.8
0.9
1
0 5 10 15 20 25 30 35 40 45
127 hrs
146 hrs
168 hrs
Dis tance from the Heate r, cm
Ste
am
Sa
tura
tio
n
Figure 5.23 Linear relative permeability and Leverett capillary pressure: Slr(RP)=0.20,Sgr=0.20, Sls=0.80, Sgs=0.80, Po=104, Slr (CP)=0.20
47
0
20
40
60
80
100
120
0 5 10 15 20 25 30 35 40 45
127 hrs
146 hrs
168 hrs
Dis tance from the He ate r , cm
Te
mp
era
ture
, C
0
10
20
30
0 5 10 15 20 25 30 35 40 45
127 hrs
146 hrs
168 hrs
Dis tance from the Heater, cm
Pre
ss
ure
, k
Pa
0
0.1
0.2
0.3
0.4
0.5
0.6
0.7
0.8
0.9
1
0 5 10 15 20 25 30 35 40 45
127 hrs
146 hrs
168 hrs
Dis tance from the He ate r , cm
Ste
am
Sa
tura
tio
n
Figure 5.24 Linear relative permeability and Leverett capillary pressure: Slr(RP)=0.20,Sgr=0.20, Sls=0.80, Sgs=0.80, Po=105, Slr (CP)=0.10
48
0
20
40
60
80
100
120
140
0 5 10 15 20 25 30 35 40 45
127 hrs
146 hrs
168 hrs
Dis tance from the He ate r , cm
Te
mp
era
ture
, C
0
10
20
30
0 5 10 15 20 25 30 35 40 45
127 hrs
146 hrs
168 hrs
Dis tance from the Heater, cm
Pre
ss
ure
, k
Pa
0
0.1
0.2
0.3
0.4
0.5
0.6
0.7
0.8
0.9
1
0 5 10 15 20 25 30 35 40 45
127 hrs
146 hrs
168 hrs
Dis tance from the Heate r , cm
Ste
am
Sa
tura
tio
n
Figure 5.25 Base case: Brooks-Corey model: Slr=0.20, Sgr=0.20, λ=2.0, pe=2000 Pa

49
0
20
40
60
80
100
120
140
0 5 10 15 20 25 30 35 40 45
127 hrs
146 hrs
168 hrs
Dis tance from the He ate r , cm
Te
mp
era
ture
, C
0
10
20
30
0 5 10 15 20 25 30 35 40 45
127 hrs
146 hrs
168 hrs
Dis tance from the Heate r, cm
Pre
ss
ure
, k
Pa
0
0.1
0.2
0.3
0.4
0.5
0.6
0.7
0.8
0.9
1
0 5 10 15 20 25 30 35 40 45
127 hrs
146 hrs
168 hrs
Dis tance from the He ate r , cm
Ste
am
Sa
tura
tio
n
Figure 5.26 Brooks-Corey model: Slr=0.10, Sgr=0.20, λ=2.0, pe=2000 Pa
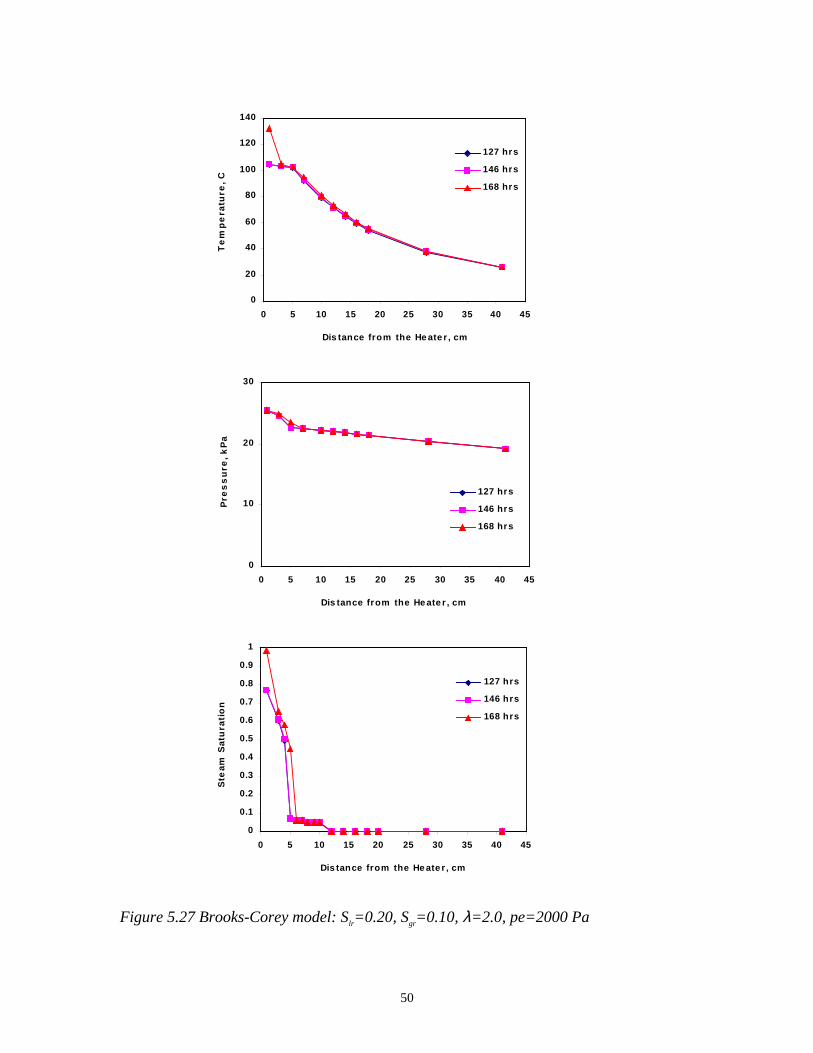
50
0
20
40
60
80
100
120
140
0 5 10 15 20 25 30 35 40 45
127 hrs
146 hrs
168 hrs
Dis tance from the He ate r , cm
Te
mp
era
ture
, C
0
10
20
30
0 5 10 15 20 25 30 35 40 45
127 hrs
146 hrs
168 hrs
Dis tance from the He ate r , cm
Pre
ss
ure
, k
Pa
0
0.1
0.2
0.3
0.4
0.5
0.6
0.7
0.8
0.9
1
0 5 10 15 20 25 30 35 40 45
127 hrs
146 hrs
168 hrs
Dis tance from the He ate r , cm
Ste
am
Sa
tura
tio
n
Figure 5.27 Brooks-Corey model: Slr=0.20, Sgr=0.10, λ=2.0, pe=2000 Pa

51
0
20
40
60
80
100
120
140
0 5 10 15 20 25 30 35 40 45
127 hrs
146 hrs
168 hrs
Dis tance from the He ate r , cm
Te
mp
era
ture
, C
0
10
20
30
0 5 10 15 20 25 30 35 40 45
127 hrs
146 hrs
168 hrs
Dis tance from the Heater, cm
Pre
ss
ure
, k
Pa
0
0.1
0.2
0.3
0.4
0.5
0.6
0.7
0.8
0.9
1
0 5 10 15 20 25 30 35 40 45
127 hrs
146 hrs
168 hrs
Dis tance from the Heate r, cm
Ste
am
Sa
tura
tio
n
Figure 5.28 Brooks-Corey model: Slr=0.20, Sgr=0.20, λ=1.5, pe=2000 Pa
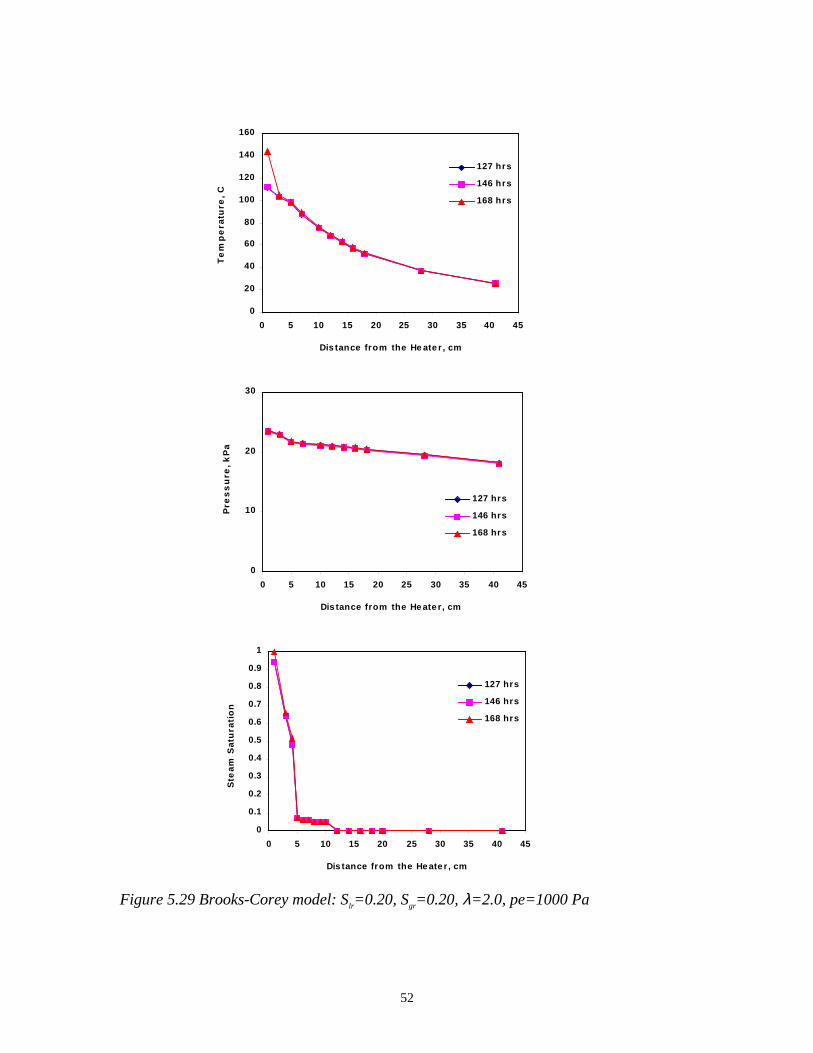
52
0
20
40
60
80
100
120
140
160
0 5 10 15 20 25 30 35 40 45
127 hrs
146 hrs
168 hrs
Dis tance from the He ate r , cm
Te
mp
era
ture
, C
0
10
20
30
0 5 10 15 20 25 30 35 40 45
127 hrs
146 hrs
168 hrs
Dis tance from the He ate r, cm
Pre
ss
ure
, k
Pa
0
0.1
0.2
0.3
0.4
0.5
0.6
0.7
0.8
0.9
1
0 5 10 15 20 25 30 35 40 45
127 hrs
146 hrs
168 hrs
Dis tance from the He ate r , cm
Ste
am
Sa
tura
tio
n
Figure 5.29 Brooks-Corey model: Slr=0.20, Sgr=0.20, λ=2.0, pe=1000 Pa
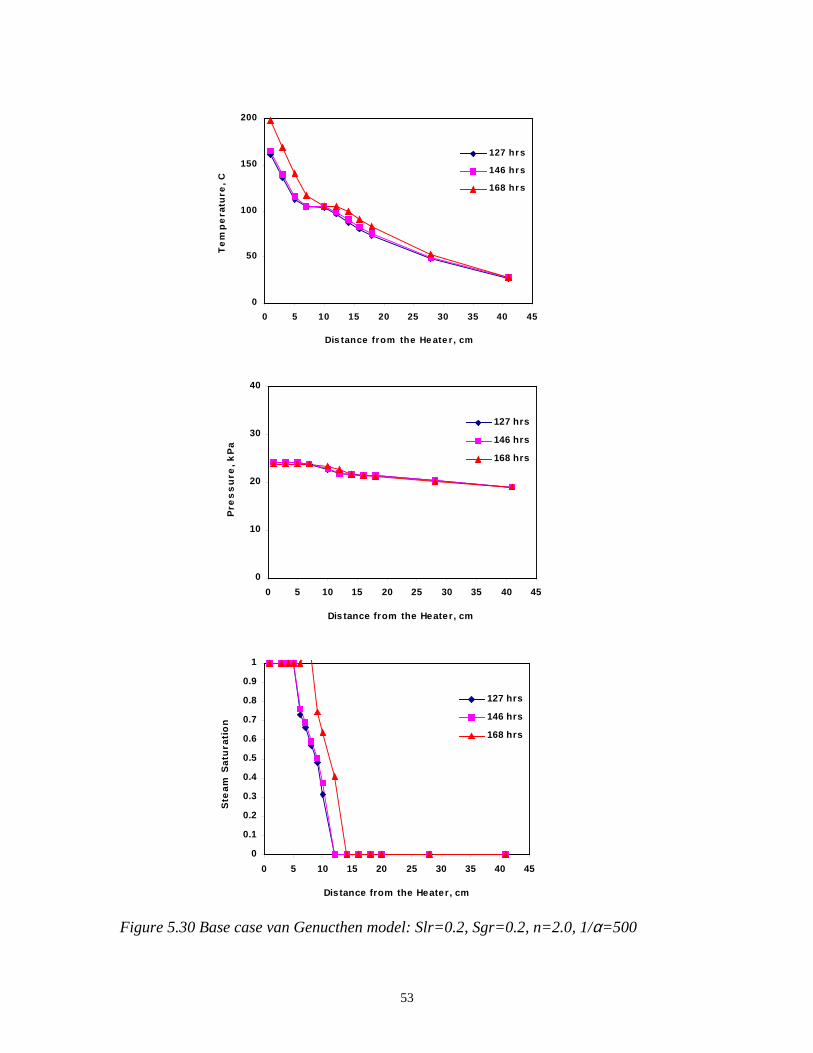
53
0
50
100
150
200
0 5 10 15 20 25 30 35 40 45
127 hrs
146 hrs
168 hrs
Dis tance from the He ate r , cm
Te
mp
era
ture
, C
0
10
20
30
40
0 5 10 15 20 25 30 35 40 45
127 hrs
146 hrs
168 hrs
Dis tance from the Heater, cm
Pre
ss
ure
, k
Pa
0
0.1
0.2
0.3
0.4
0.5
0.6
0.7
0.8
0.9
1
0 5 10 15 20 25 30 35 40 45
127 hrs
146 hrs
168 hrs
Distance from the Heater, cm
Ste
am
Sa
tura
tio
n
Figure 5.30 Base case van Genucthen model: Slr=0.2, Sgr=0.2, n=2.0, 1/α=500

54
0
50
100
150
200
0 5 10 15 20 25 30 35 40 45
127 hrs
146 hrs
168 hrs
Dis tance from the He ate r , cm
Te
mp
era
ture
, C
0
10
20
30
40
0 5 10 15 20 25 30 35 40 45
127 hrs
146 hrs
168 hrs
Dis tance from the He ate r , cm
Pre
ss
ure
, k
Pa
0
0.1
0.2
0.3
0.4
0.5
0.6
0.7
0.8
0.9
1
0 5 10 15 20 25 30 35 40 45
127 hrs
146 hrs
168 hrs
Dis tance from the He ate r , cm
Ste
am
Sa
tura
tio
n
Figure 5.31 van Genucthen: Slr=0.1, Sgr=0.2, n=2.0, 1/α=500
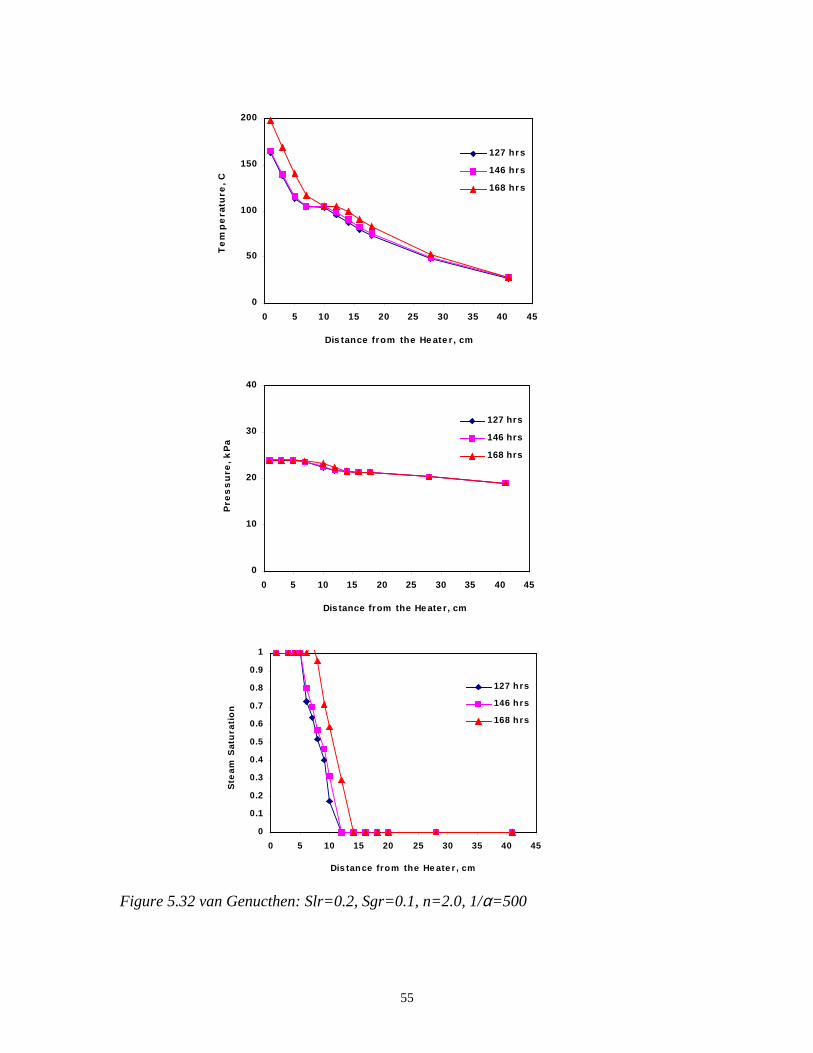
55
0
50
100
150
200
0 5 10 15 20 25 30 35 40 45
127 hrs
146 hrs
168 hrs
Dis tance from the He ate r , cm
Te
mp
era
ture
, C
0
10
20
30
40
0 5 10 15 20 25 30 35 40 45
127 hrs
146 hrs
168 hrs
Dis tance from the He ate r, cm
Pre
ss
ure
, k
Pa
0
0.1
0.2
0.3
0.4
0.5
0.6
0.7
0.8
0.9
1
0 5 10 15 20 25 30 35 40 45
127 hrs
146 hrs
168 hrs
Dis tance from the He ate r , cm
Ste
am
Sa
tura
tio
n
Figure 5.32 van Genucthen: Slr=0.2, Sgr=0.1, n=2.0, 1/α=500

56
0
50
100
150
200
250
0 5 10 15 20 25 30 35 40 45
127 hrs
146 hrs
168 hrs
Dis tance from the He ate r, cm
Te
mp
era
ture
, C
0
10
20
30
40
0 5 10 15 20 25 30 35 40 45
127 hrs
146 hrs
168 hrs
Dis tance from the He ate r , cm
Pre
ss
ure
, k
Pa
0
0.1
0.2
0.3
0.4
0.5
0.6
0.7
0.8
0.9
1
0 5 10 15 20 25 30 35 40 45
127 hr s
146 hr s
168 hr s
Dis tance from the He ate r , cm
Ste
am
Sa
tura
tio
n
Figure 5.33 van Genucthen: Slr=0.2, Sgr=0.2, n=2.5, 1/α=500

57
0
50
100
150
200
0 5 10 15 20 25 30 35 40 45
127 hrs
146 hrs
168 hrs
Dis tance from the Heater, cm
Te
mp
era
ture
, C
0
10
20
30
40
0 5 10 15 20 25 30 35 40 45
127 hrs
146 hrs
168 hrs
Dis tance from the Heater, cm
Pre
ss
ure
, k
Pa
0
0.1
0.2
0.3
0.4
0.5
0.6
0.7
0.8
0.9
1
0 5 10 15 20 25 30 35 40 45
127 hrs
146 hrs
168 hrs
Distance from the Heater, cm
Ste
am
Sa
tura
tio
n
Figure 5.34 van Genucthen: Slr=0.2, Sgr=0.2, n=2.0, 1/α=1000

58
5.2.3 Initial Guesses
To avoid time consuming inverse calculations, forward calculations were carried out and
initial guesses were made. The initial guesses for αs, αi, and αb were estimated by trial-
and error, by changing each parameter one at a time. A rough fit of the temperature and
heat flux data under single-phase conditions were obtained at αs=4.930 W/m-C, αi=0.150
W/m-C, and αb=0.115 W/m-C, indicating heat losses. The linear relative permeability
initial guesses were taken from the results obtained by Ambussso (1996). They are:
Slr=0.30, Sgr=0.10, Sls=0.80 and Sgs=0.80. On the other hand, the initial guesses for the
Brooks-Corey relative permeability parameters were obtained by trial-and-error, based on
Satik’s results (1998). Slr=0.3, Sgr=0.1, and λ=1.5. For the Corey and van Genuchten
relative permeability functions, the initial guesses for the residual saturations in the
Brooks-Corey functions were used. Finally, the initial guesses for Pcmax, pe, po, and 1/α
were at 105 Pa, 2000 Pa, and 105, and 500 Pa, respectively.
5.3 Parameter Estimation
This section will briefly discuss the inverse modeling process. Also, the various steps
involved in estimating the thermal parameters and two-phase parameters using the
different relative permeability and capillary pressure models will be outlined. Finally,
results of the inverse calculation will be discussed.
5.3.1 Inverse Modeling
ITOUGH2 (Finsterle, 1997) provides inverse modeling capabilities for the TOUGH2
codes and solves the inverse problem by automatic model calibration based on the
maximum likelihood approach. Figure 5.35 shows a flow chart of the inverse modeling
process. TOUGH2 solves the forward problem and submits the results to ITOUGH2
during the calibration phase, when simulated data are compared with real data and the
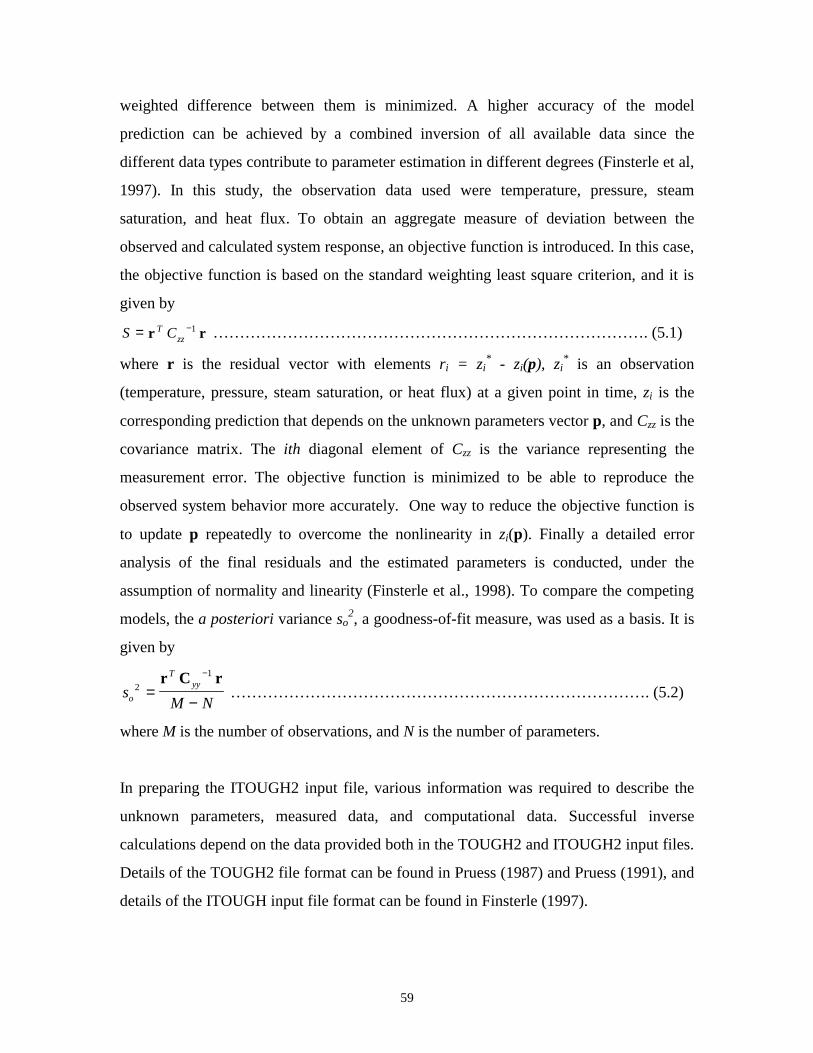
59
weighted difference between them is minimized. A higher accuracy of the model
prediction can be achieved by a combined inversion of all available data since the
different data types contribute to parameter estimation in different degrees (Finsterle et al,
1997). In this study, the observation data used were temperature, pressure, steam
saturation, and heat flux. To obtain an aggregate measure of deviation between the
observed and calculated system response, an objective function is introduced. In this case,
the objective function is based on the standard weighting least square criterion, and it is
given by
S CTzz= −r r1 ………………………………………………………………………. (5.1)
where r is the residual vector with elements ri = zi* - zi(p), zi
* is an observation
(temperature, pressure, steam saturation, or heat flux) at a given point in time, zi is the
corresponding prediction that depends on the unknown parameters vector p, and Czz is the
covariance matrix. The ith diagonal element of Czz is the variance representing the
measurement error. The objective function is minimized to be able to reproduce the
observed system behavior more accurately. One way to reduce the objective function is
to update p repeatedly to overcome the nonlinearity in zi(p). Finally a detailed error
analysis of the final residuals and the estimated parameters is conducted, under the
assumption of normality and linearity (Finsterle et al., 1998). To compare the competing
models, the a posteriori variance so2, a goodness-of-fit measure, was used as a basis. It is
given by
sM No
Tyy2
1
=−
−r C r ……………………………………………………………………. (5.2)
where M is the number of observations, and N is the number of parameters.
In preparing the ITOUGH2 input file, various information was required to describe the
unknown parameters, measured data, and computational data. Successful inverse
calculations depend on the data provided both in the TOUGH2 and ITOUGH2 input files.
Details of the TOUGH2 file format can be found in Pruess (1987) and Pruess (1991), and
details of the ITOUGH input file format can be found in Finsterle (1997).
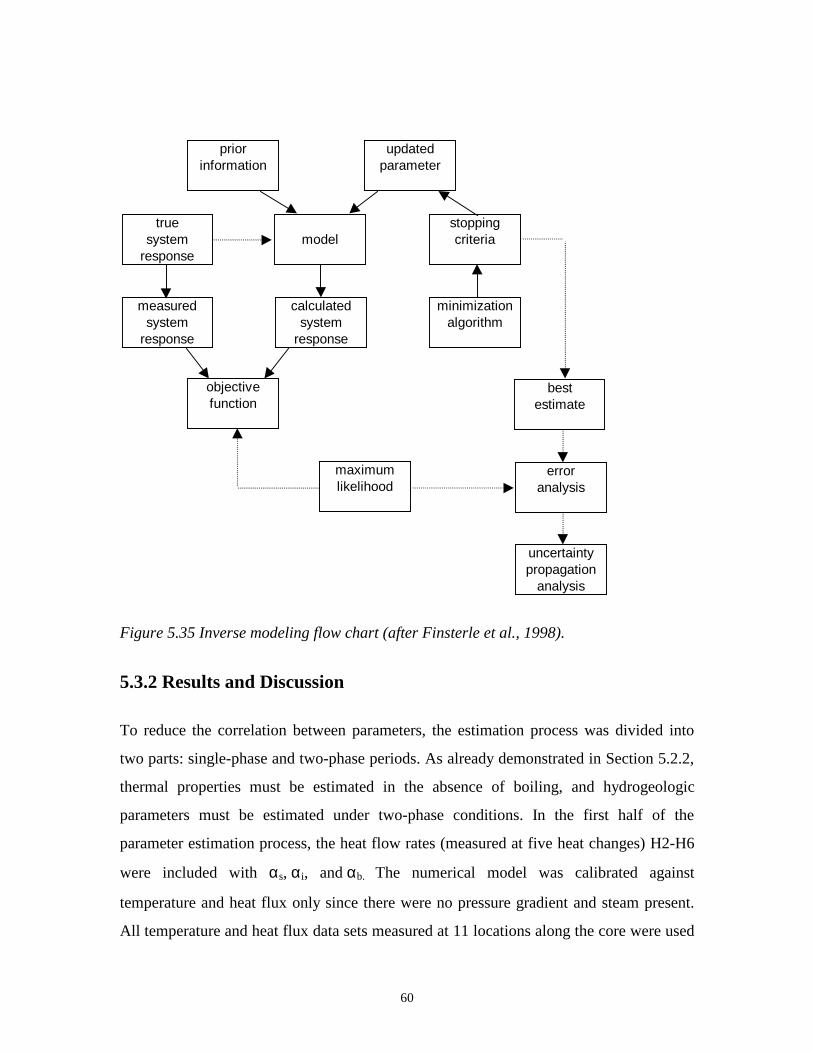
60
priorinformation
updatedparameter
modeltrue
systemresponse
stopping criteria
measured system
response
calculated system
response
minimizationalgorithm
objective function
bestestimate
maximumlikelihood
erroranalysis
uncertaintypropagation
analysis
Figure 5.35 Inverse modeling flow chart (after Finsterle et al., 1998).
5.3.2 Results and Discussion
To reduce the correlation between parameters, the estimation process was divided into
two parts: single-phase and two-phase periods. As already demonstrated in Section 5.2.2,
thermal properties must be estimated in the absence of boiling, and hydrogeologic
parameters must be estimated under two-phase conditions. In the first half of the
parameter estimation process, the heat flow rates (measured at five heat changes) H2-H6
were included with αs, αi, and αb. The numerical model was calibrated against
temperature and heat flux only since there were no pressure gradient and steam present.
All temperature and heat flux data sets measured at 11 locations along the core were used

61
in the single-phase period calibration. The TOUGH2 and ITOUGH2 input files for this
process are found in Appendix A.1.
The standard deviation values given in Table 5.1 reflect the uncertainty associated with
the measurement errors. For heat flux, it is the standard deviation of the measured data
only at Sensor 1, where the measurement uncertainty is larger than at any other
observation point. The standard deviation at all other observation points was 10 W/m2.
Table 5.2 shows a summary of the estimated parameter set. The covariance and
correlation matrices are given in Table 5.3, where the diagonal elements give the square
of the standard deviation of the parameter estimate, σp. σp takes into account the
uncertainty of the parameter itself and the influence from correlated parameters. In Table
5.4, the conditional standard deviation, σp* reflects the uncertainty of one parameter if all
the other parameters are known. Hence, σp*/σp (column 3) is a measure of how
independently a parameter can be estimated. A value close to one denotes an independent
estimate, while a small value denotes strong correlation to other uncertain parameters.
The total parameter sensitivity (column 4) is the sum of the absolute values of the
sensitivity coefficients, weighted by the inverse of individual measurement errors and
scaled by a parameter variation (Finsterle et al, 1997). As shown in Table 5.4, αi and αb
are the most sensitive parameters. Except for H2 and H3, and perhaps H4, all parameters
cannot be determined independently because they are correlated to one or more of the
other parameters.
Table 5.1. Observation used for model calibration.
Data Type Standard Deviation
Temperature 1 oC
Pressure 1000 Pa
Steam Saturation 0.01
Heat Flux 20 W/m2
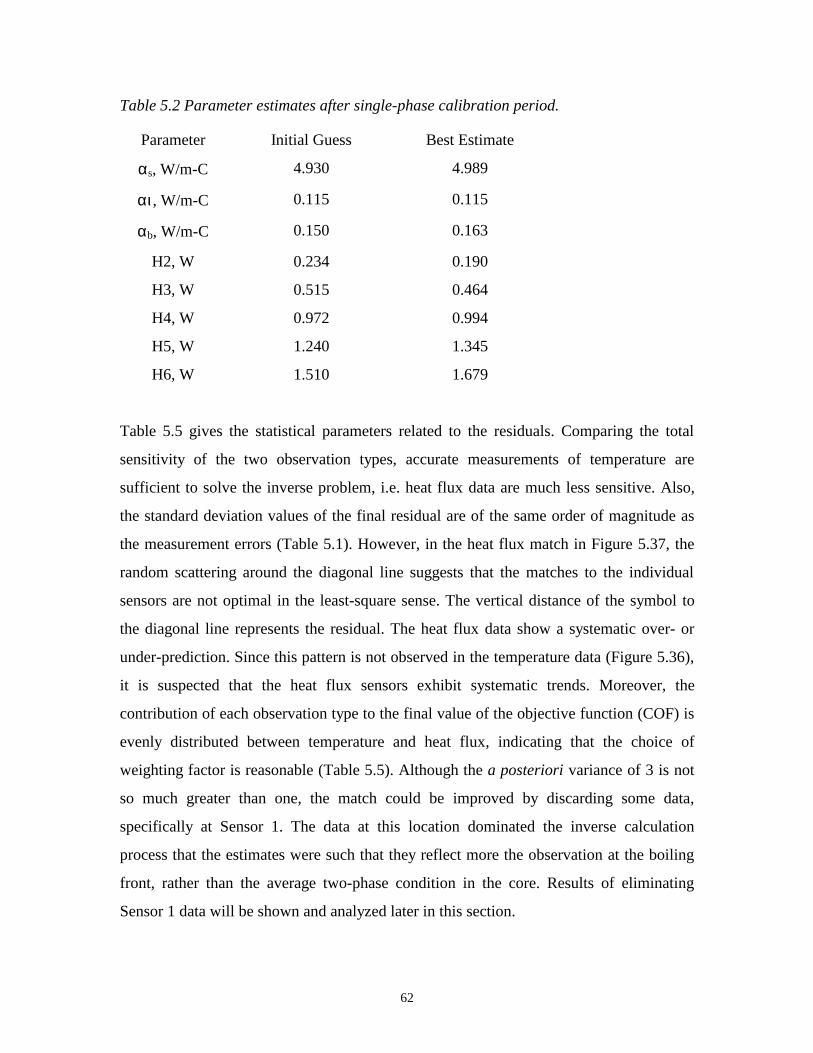
62
Table 5.2 Parameter estimates after single-phase calibration period.
Parameter Initial Guess Best Estimate
αs, W/m-C 4.930 4.989
αι, W/m-C 0.115 0.115
αb, W/m-C 0.150 0.163
H2, W 0.234 0.190
H3, W 0.515 0.464
H4, W 0.972 0.994
H5, W 1.240 1.345
H6, W 1.510 1.679
Table 5.5 gives the statistical parameters related to the residuals. Comparing the total
sensitivity of the two observation types, accurate measurements of temperature are
sufficient to solve the inverse problem, i.e. heat flux data are much less sensitive. Also,
the standard deviation values of the final residual are of the same order of magnitude as
the measurement errors (Table 5.1). However, in the heat flux match in Figure 5.37, the
random scattering around the diagonal line suggests that the matches to the individual
sensors are not optimal in the least-square sense. The vertical distance of the symbol to
the diagonal line represents the residual. The heat flux data show a systematic over- or
under-prediction. Since this pattern is not observed in the temperature data (Figure 5.36),
it is suspected that the heat flux sensors exhibit systematic trends. Moreover, the
contribution of each observation type to the final value of the objective function (COF) is
evenly distributed between temperature and heat flux, indicating that the choice of
weighting factor is reasonable (Table 5.5). Although the a posteriori variance of 3 is not
so much greater than one, the match could be improved by discarding some data,
specifically at Sensor 1. The data at this location dominated the inverse calculation
process that the estimates were such that they reflect more the observation at the boiling
front, rather than the average two-phase condition in the core. Results of eliminating
Sensor 1 data will be shown and analyzed later in this section.

63
Table 5.3 Variance-covariance matrix (diagonal and lower triangle) and correlationmatrix (upper triangle) after single-phase period calibration.
αs αb αI H2 H3 H4 H5 H6
αs 1.37E-02 -3.87E-01 5.15E-01 1.25E-01 2.83E-01 5.42E-01 6.31E-01 6.49E-01
αb -1.32E-04 8.51E-06 -7.36E-01 -2.83E-01 -2.02E-01 -2.58E-01 -3.10E-01 -3.15E-01
αi 9.00E-05 -3.20E-06 2.23E-06 1.25E-01 2.77E-01 5.27E-01 6.18E-01 6.27E-01
H2 1.43E-04 -8.05E-06 1.81E-06 9.50E-05 -1.07E-02 3.70E-02 4.12E-02 4.26E-02
H3 3.27E-04 -5.80E-06 4.07E-06 -1.03E-06 9.73E-05 1.32E-01 2.35E-01 2.37E-01
H4 7.27E-04 -8.61E-06 8.99E-06 4.12E-06 1.49E-05 1.31E-04 4.61E-01 4.95E-01
H5 1.01E-03 -1.23E-05 1.25E-05 5.46E-06 3.15E-05 7.17E-05 1.85E-04 5.58E-01
H6 1.27E-03 -1.53E-05 1.56E-05 6.90E-06 3.89E-05 9.43E-05 1.26E-04 2.77E-04
Table 5.4 Statistical measures and parameter sensitivity after single-phase periodcalibration.
Parameter σ σ*/σ Parameter Sensitivity
αs 0.1172 0.6150 340
αb 0.0029 0.5716 11872
αi 0.0015 0.4380 43367
H2 0.0097 0.9468 1726
H3 0.0099 0.9410 1787
H4 0.0114 0.7604 1971
H5 0.0136 0.6602 1770
H6 0.0166 0.6415 1198

64
Table 5.5 Total sensitivity of observation, standard deviation of residuals, andcontribution to the objective function (COF) after single-phase periodcalibration.
Sensitivity Standard
Deviation
COF
%
Temperature 2129 1.8 53.86
Heat Flux 567 16.6 45.93
0
20
40
60
80
100
0 20 40 60 80 100
T1
T2
T3
T4
T5
T6
T7
T8
T9
T10
T11
M e as ure d Te m pe rature , C
Ca
lcu
late
d T
em
pe
ratu
re,
C
Figure 5.36 Measured and calculated temperature after single-phase period calibration.
0
50
100
150
200
250
300
350
0 50 100 150 200 250 300 350
HF1
HF2
HF3
HF4
HF5
HF6
HF7
HF8
HF9
HF10
HF11
M e as ure d He at Flux, W/m ^2
Ca
lcu
late
d H
ea
t F
lux
, W
/m^
2
Figure 5.37 Measured and calculated heat flux after single-phase period calibration.
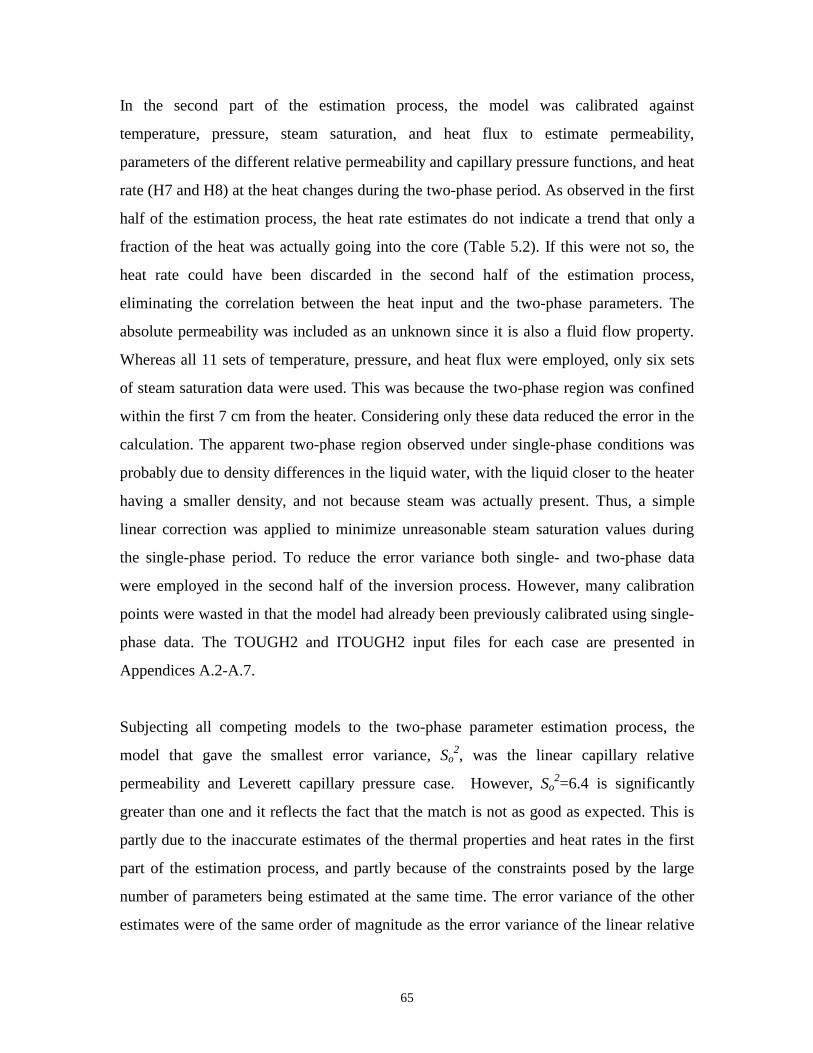
65
In the second part of the estimation process, the model was calibrated against
temperature, pressure, steam saturation, and heat flux to estimate permeability,
parameters of the different relative permeability and capillary pressure functions, and heat
rate (H7 and H8) at the heat changes during the two-phase period. As observed in the first
half of the estimation process, the heat rate estimates do not indicate a trend that only a
fraction of the heat was actually going into the core (Table 5.2). If this were not so, the
heat rate could have been discarded in the second half of the estimation process,
eliminating the correlation between the heat input and the two-phase parameters. The
absolute permeability was included as an unknown since it is also a fluid flow property.
Whereas all 11 sets of temperature, pressure, and heat flux were employed, only six sets
of steam saturation data were used. This was because the two-phase region was confined
within the first 7 cm from the heater. Considering only these data reduced the error in the
calculation. The apparent two-phase region observed under single-phase conditions was
probably due to density differences in the liquid water, with the liquid closer to the heater
having a smaller density, and not because steam was actually present. Thus, a simple
linear correction was applied to minimize unreasonable steam saturation values during
the single-phase period. To reduce the error variance both single- and two-phase data
were employed in the second half of the inversion process. However, many calibration
points were wasted in that the model had already been previously calibrated using single-
phase data. The TOUGH2 and ITOUGH2 input files for each case are presented in
Appendices A.2-A.7.
Subjecting all competing models to the two-phase parameter estimation process, the
model that gave the smallest error variance, So2, was the linear capillary relative
permeability and Leverett capillary pressure case. However, So2=6.4 is significantly
greater than one and it reflects the fact that the match is not as good as expected. This is
partly due to the inaccurate estimates of the thermal properties and heat rates in the first
part of the estimation process, and partly because of the constraints posed by the large
number of parameters being estimated at the same time. The error variance of the other
estimates were of the same order of magnitude as the error variance of the linear relative

66
permeability and Leverett capillary pressure case, although the models differ from each
other. Thus, using the error variance as a goodness-of-fit criterion, none of the cases
performs significantly better than the others. However, as suggested earlier, the function
that matches the data without over-parameterization is the most likely scenario.
Table 5.6 shows a summary of the estimated parameter set for the linear relative
permeability and Leverett capillary pressure case. Results show that Sgr and Sgs are the
most sensitive parameters. Except for k, Sls, and H7, all parameters cannot be determined
independently because they are correlated to one or more of the other parameters (Table
5.8). Of particular interest are the very low values of σ*/σ for Sgr, Sgs, and Po. This
implies that they are highly correlated with one another or with the other parameters.
Comparing the total sensitivity of all observation types (Table 5.9), accurate
measurements of temperature, pressure, and steam saturation are sufficient to solve the
inverse problem. Although the standard deviation values of the final residual are of the
same order of magnitude as the measurement errors (Table 5.1), the assumed accuracy of
the match was overestimated. The standard deviation of the steam saturation residual is
greater than the error measurement by an order of magnitude. This shows clearly that
there was a systematic deviation in the steam saturation match. This could be due to the
fact that the steam saturation was measured only three times during the two-phase period.
During the calibration phase, steam saturation data were just interpolated between the
three measured data points. Since the parameters are highly sensitive to the steam
saturation, slight errors in the steam saturation data could be translated to greater errors in
the predictions. Also, the corrections applied to the steam saturation data may have a
great bearing on the estimates. As in the first half of the estimation process, the heat flux
match in Figure 5.41 has random scattering around the diagonal line, suggesting that the
matches to the individual sensors are not optimal in the least-square sense. Since the
under- and over-prediction pattern is not observed in the temperature data (Figure 5.38),
the heat flux sensors may exhibit systematic trends. Furthermore, the pressure during the
two-phase period is under-predicted (Fig. 5.39). It may be due to the insufficient capillary
pressure predicted by the Leverett function. The contribution of each observation type to
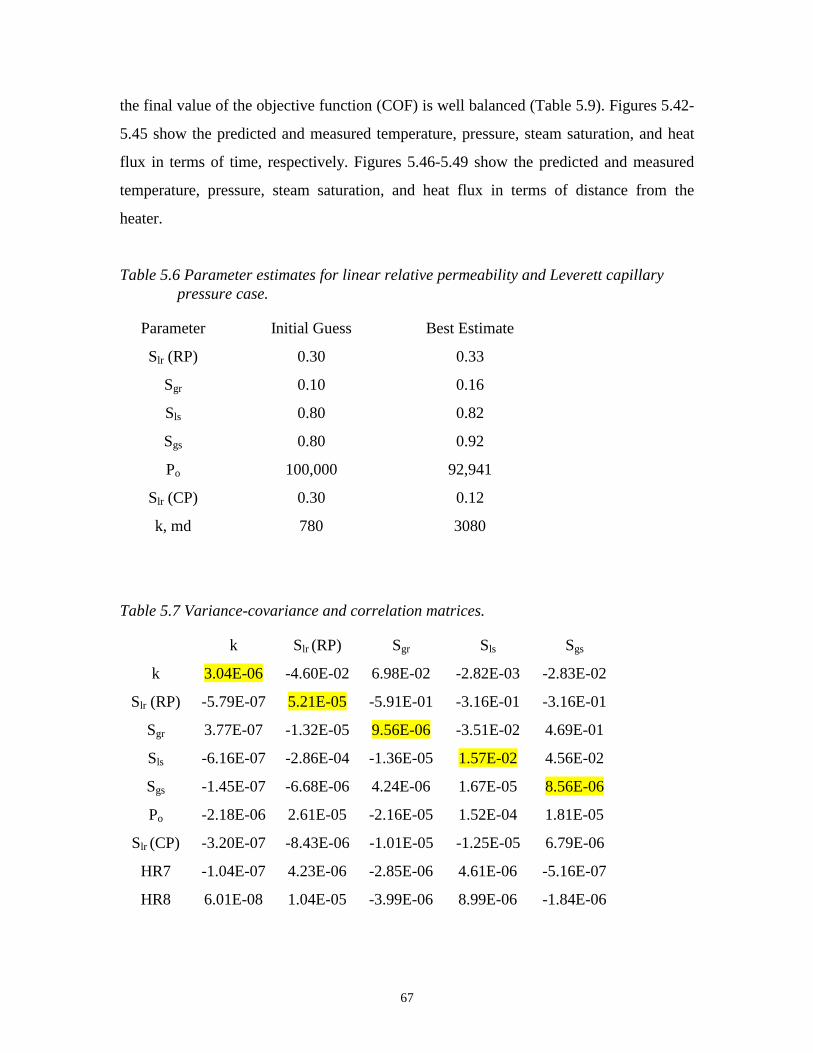
67
the final value of the objective function (COF) is well balanced (Table 5.9). Figures 5.42-
5.45 show the predicted and measured temperature, pressure, steam saturation, and heat
flux in terms of time, respectively. Figures 5.46-5.49 show the predicted and measured
temperature, pressure, steam saturation, and heat flux in terms of distance from the
heater.
Table 5.6 Parameter estimates for linear relative permeability and Leverett capillarypressure case.
Parameter Initial Guess Best Estimate
Slr (RP) 0.30 0.33
Sgr 0.10 0.16
Sls 0.80 0.82
Sgs 0.80 0.92
Po 100,000 92,941
Slr (CP) 0.30 0.12
k, md 780 3080
Table 5.7 Variance-covariance and correlation matrices.
k Slr (RP) Sgr Sls Sgs
k 3.04E-06 -4.60E-02 6.98E-02 -2.82E-03 -2.83E-02
Slr (RP) -5.79E-07 5.21E-05 -5.91E-01 -3.16E-01 -3.16E-01
Sgr 3.77E-07 -1.32E-05 9.56E-06 -3.51E-02 4.69E-01
Sls -6.16E-07 -2.86E-04 -1.36E-05 1.57E-02 4.56E-02
Sgs -1.45E-07 -6.68E-06 4.24E-06 1.67E-05 8.56E-06
Po -2.18E-06 2.61E-05 -2.16E-05 1.52E-04 1.81E-05
Slr (CP) -3.20E-07 -8.43E-06 -1.01E-05 -1.25E-05 6.79E-06
HR7 -1.04E-07 4.23E-06 -2.85E-06 4.61E-06 -5.16E-07
HR8 6.01E-08 1.04E-05 -3.99E-06 8.99E-06 -1.84E-06
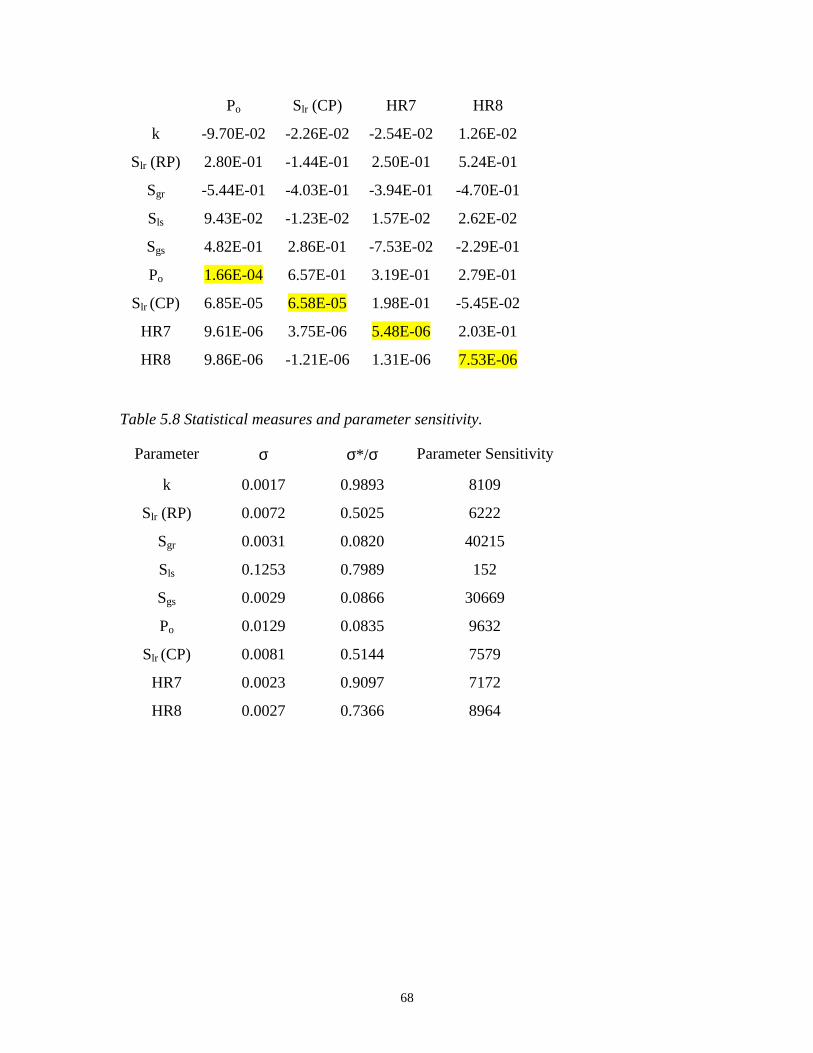
68
Po Slr (CP) HR7 HR8
k -9.70E-02 -2.26E-02 -2.54E-02 1.26E-02
Slr (RP) 2.80E-01 -1.44E-01 2.50E-01 5.24E-01
Sgr -5.44E-01 -4.03E-01 -3.94E-01 -4.70E-01
Sls 9.43E-02 -1.23E-02 1.57E-02 2.62E-02
Sgs 4.82E-01 2.86E-01 -7.53E-02 -2.29E-01
Po 1.66E-04 6.57E-01 3.19E-01 2.79E-01
Slr (CP) 6.85E-05 6.58E-05 1.98E-01 -5.45E-02
HR7 9.61E-06 3.75E-06 5.48E-06 2.03E-01
HR8 9.86E-06 -1.21E-06 1.31E-06 7.53E-06
Table 5.8 Statistical measures and parameter sensitivity.
Parameter σ σ*/σ Parameter Sensitivity
k 0.0017 0.9893 8109
Slr (RP) 0.0072 0.5025 6222
Sgr 0.0031 0.0820 40215
Sls 0.1253 0.7989 152
Sgs 0.0029 0.0866 30669
Po 0.0129 0.0835 9632
Slr (CP) 0.0081 0.5144 7579
HR7 0.0023 0.9097 7172
HR8 0.0027 0.7366 8964

69
Table 5.9 Total sensitivity of observation, standard deviation of residuals, andcontribution to the objective function (COF).
Observation Sensitivity Standard
Deviation
COF
%
Temperature 1041 1.9 C 14.54
Pressure 3383 1740 Pa 16.98
Saturation 6783 0.09 37.84
Heat Flux 311 28.1 W/m2 30.64
0
20
40
60
80
100
120
0 20 40 60 80 100 120M e as ure d Te m pe rature , C
Ca
lcu
late
d T
em
pe
ratu
re,
C
Figure 5.38 Measured and calculated temperature.

70
0
5
10
15
20
25
30
0 5 10 15 20 25 30M e as ure d Pre s s ure , k Pa
Ca
lcu
late
d P
res
su
re,
kP
a
Figure 5.39 Measured and calculated pressure.
0
0.1
0.2
0.3
0.4
0.5
0.6
0.7
0.8
0.9
1
0 0.1 0.2 0.3 0.4 0.5 0.6 0.7 0.8 0.9 1
M e as ure d Ste am Saturation
Ca
lcu
late
d S
tea
m S
atu
rati
on
Figure 5.40 Measured and calculated steam saturation.
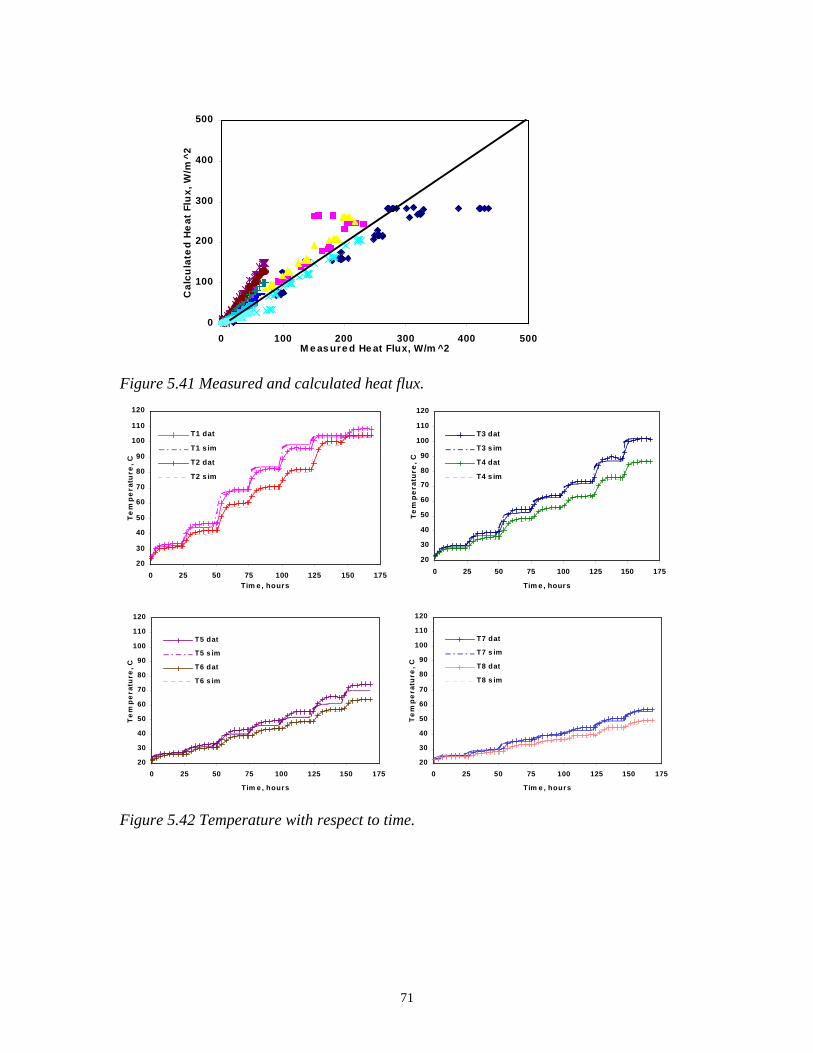
71
0
100
200
300
400
500
0 100 200 300 400 500M e as ure d He at Flux, W/m ^2
Ca
lcu
late
d H
ea
t F
lux
, W
/m^
2
Figure 5.41 Measured and calculated heat flux.
20
30
40
50
60
70
80
90
100
110
120
0 25 50 75 100 125 150 175Tim e , hours
Te
mp
era
ture
, C
T1 dat
T1 s im
T2 dat
T2 s im
20
30
40
50
60
70
80
90
100
110
120
0 25 50 75 100 125 150 175
Tim e , hours
Te
mp
era
ture
, C
T3 dat
T3 s im
T4 dat
T4 s im
20
30
40
50
60
70
80
90
100
110
120
0 25 50 75 100 125 150 175
Tim e , hours
Te
mp
era
ture
, C
T5 dat
T5 s im
T6 dat
T6 s im
20
30
40
50
60
70
80
90
100
110
120
0 25 50 75 100 125 150 175
Tim e , hours
Te
mp
era
ture
, C
T7 dat
T7 s im
T8 dat
T8 s im
Figure 5.42 Temperature with respect to time.
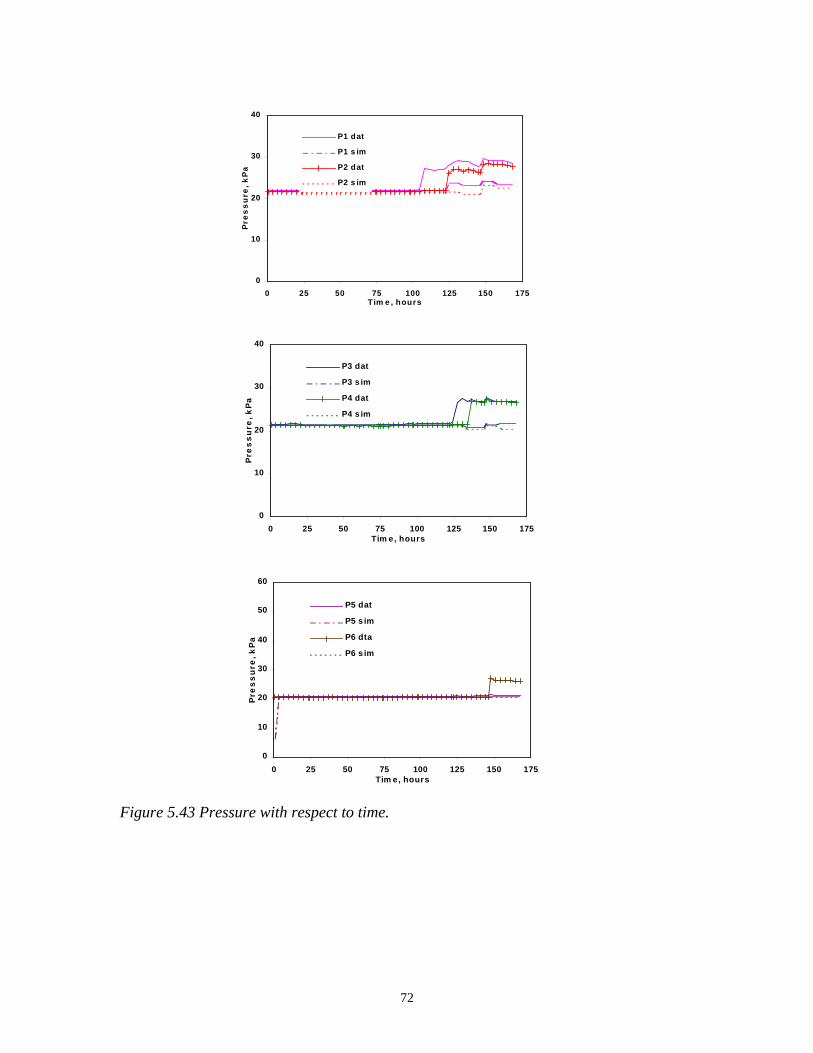
72
0
10
20
30
40
0 25 50 75 100 125 150 175Tim e , hours
Pre
ss
ure
, k
Pa
P1 dat
P1 s im
P2 dat
P2 s im
0
10
20
30
40
0 25 50 75 100 125 150 175Tim e, hours
Pre
ss
ure
, k
Pa
P3 dat
P3 s im
P4 dat
P4 s im
0
10
20
30
40
50
60
0 25 50 75 100 125 150 175Tim e, hours
Pre
ss
ure
, k
Pa
P5 dat
P5 s im
P6 dta
P6 s im
Figure 5.43 Pressure with respect to time.
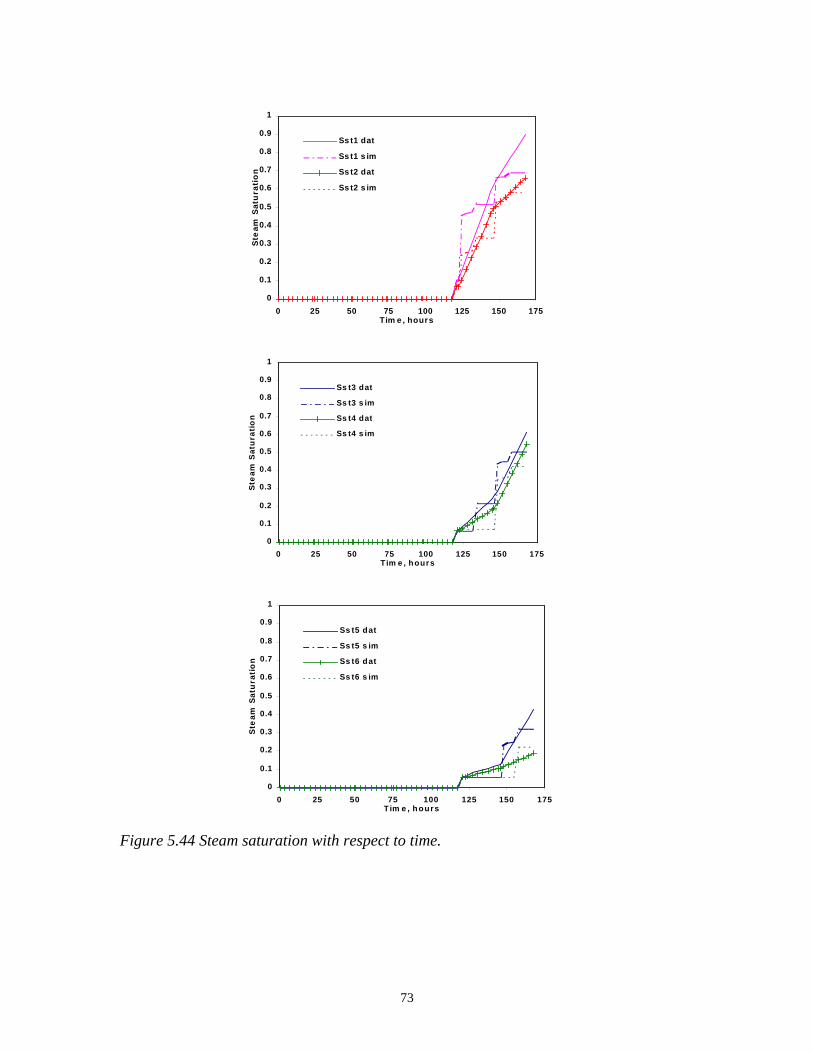
73
0
0.1
0.2
0.3
0.4
0.5
0.6
0.7
0.8
0.9
1
0 25 50 75 100 125 150 175Tim e , hours
Ste
am
Sa
tura
tio
n
Ss t1 dat
Ss t1 s im
Ss t2 dat
Ss t2 s im
0
0.1
0.2
0.3
0.4
0.5
0.6
0.7
0.8
0.9
1
0 25 50 75 100 125 150 175Tim e , hours
Ste
am
Sa
tura
tio
n
Ss t3 dat
Ss t3 s im
Ss t4 dat
Ss t4 s im
0
0.1
0.2
0.3
0.4
0.5
0.6
0.7
0.8
0.9
1
0 25 50 75 100 125 150 175Tim e , h ours
Ste
am
Sa
tura
tio
n
Ss t5 dat
Ss t5 s im
Ss t6 dat
Ss t6 s im
Figure 5.44 Steam saturation with respect to time.
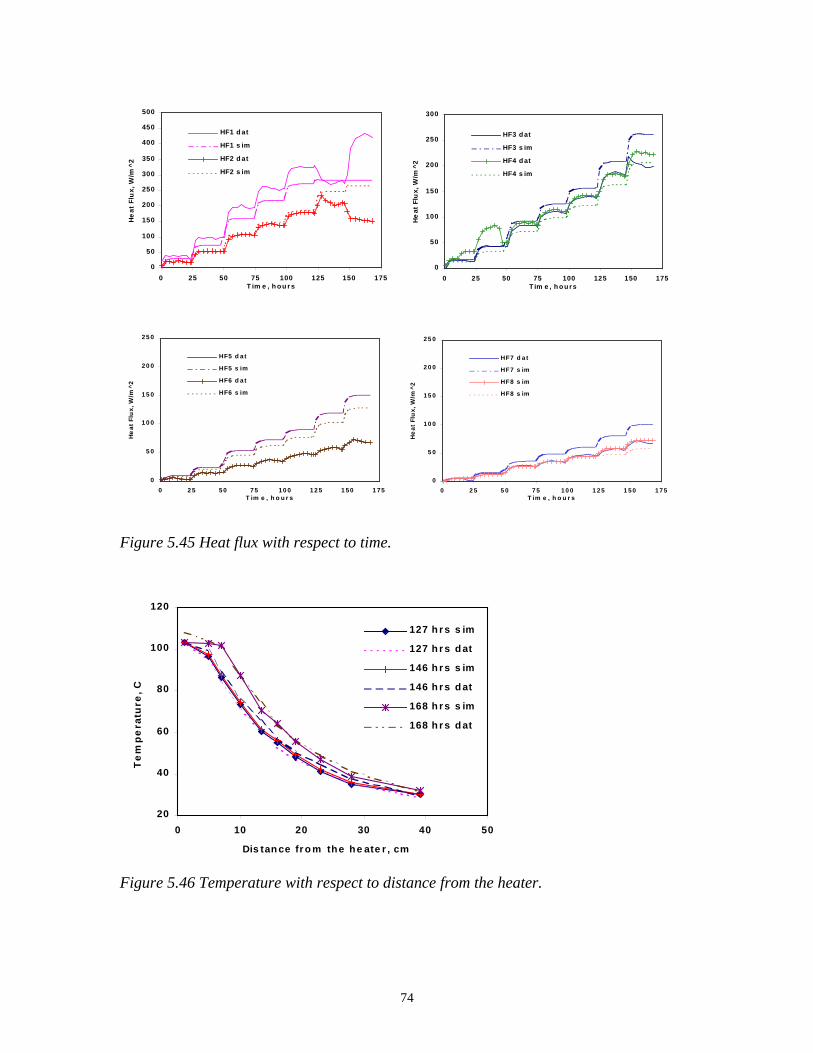
74
0
50
100
150
200
250
300
350
400
450
500
0 25 50 75 100 125 150 175T im e , h ou r s
He
at
Flu
x,
W/m
^2
HF1 d at
HF1 s im
HF2 d at
HF2 s im
0
50
100
150
200
250
300
0 25 50 75 100 125 150 175T im e , h o u rs
He
at F
lux,
W/m
^2
HF3 d at
HF3 s im
HF4 d at
HF4 s im
0
5 0
10 0
15 0
20 0
25 0
0 2 5 50 75 10 0 12 5 1 50 1 75T im e , h o u r s
He
at
Flu
x,
W/m
^2
HF5 d a t
HF5 s im
HF6 d at
HF6 s im
0
5 0
1 0 0
1 5 0
2 0 0
2 5 0
0 2 5 5 0 7 5 1 0 0 1 2 5 1 5 0 1 7 5T im e , h o u r s
He
at
Flu
x, W
/m^
2
HF7 d a t
HF7 s im
HF8 s im
HF8 s im
Figure 5.45 Heat flux with respect to time.
20
40
60
80
100
120
0 10 20 30 40 50
127 h r s s im
127 h r s d at
146 h r s s im
146 h r s d at
168 h r s s im
168 h r s d at
Te
mp
era
ture
, C
Dis tan ce fr o m the he ate r , cm
Figure 5.46 Temperature with respect to distance from the heater.

75
10
15
20
25
30
35
40
0 10 20 30 40 50
127 hrs s im
127 hrs dat
146 hrs s im
146 hrs dat
168 hrs s im
168 hrs datP
res
su
re,
kP
a
Dis tance from the he ate r , cm
Figure 5.47 Pressure with respect to distance from the heater.
0
0.1
0.2
0.3
0.4
0.5
0.6
0.7
0.8
0.9
1
0 1 2 3 4 5 6 7
127 hrs s im
127 hrs dat
146 hrs s im
146 hrs dat
168 hrs s im
168 hrs dat
Ste
am
Sa
tura
tio
n
Dis tance from the he ate r , cm
Figure 5.48 Steam saturation with respect to distance from the heater.

76
0
100
200
300
400
500
0 10 20 30 40 50
127 hrs s im
127 hrs dat
146 hrs s im
146 hrs dat
168 hrs s im
168 hrs dat
He
at
Flu
x,
W/m
^2
Dis tance from the he ate r , cm
Figure 5.49 Heat flux with respect to distance from the heater.
Figure 5.50 shows the linear relative permeability curves based on the two-phase
parameter estimates and Figure 5.51 shows the corresponding Leverett capillary pressure.
The liquid relative permeability agrees well with Ambusso’s results. On the other hand,
Sgl does not coincide with the measured Sgl, although there is a good agreement between
the estimated Sgr and Ambusso’s kgr. Figure 5.52 shows the relative permeability
estimates obtained from the estimation process. Although the relative permeability
relations of the models are different, they all seem to agree in terms of Sgr. The Sgr value
is around 0.15-0.20. Since the observations made during the boiling experiment were
more sensitive to the steam relative permeability, inverse modeling at least made Sgr
consistent. A comparison of the different relative permeability estimates with the results
obtained by Satik is also shown in Figure 5.53. Although Corey’s relative permeability
(estimates from the Corey relative permeability and linear capillary pressure case) best
mimic Satik’s curves, the fit was worse than that obtained from the linear relative
permeability and Leverett capillary pressure case.
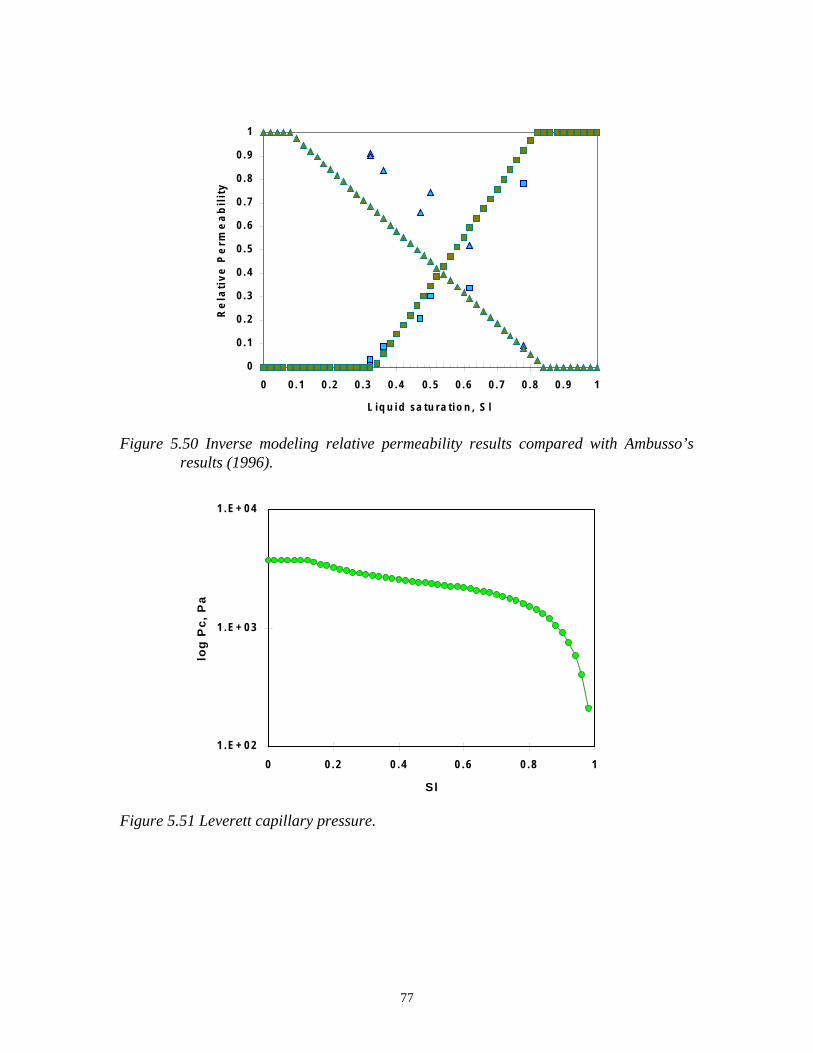
77
0
0 . 1
0 . 2
0 . 3
0 . 4
0 . 5
0 . 6
0 . 7
0 . 8
0 . 9
1
0 0 . 1 0 . 2 0 . 3 0 . 4 0 . 5 0 . 6 0 . 7 0 . 8 0 . 9 1
L i q u i d sa tu r a ti o n , S l
Re
lati
ve
Pe
rme
ab
ilit
y
Figure 5.50 Inverse modeling relative permeability results compared with Ambusso’sresults (1996).
1 . E + 0 2
1 . E + 0 3
1 . E + 0 4
0 0 . 2 0 . 4 0 . 6 0 . 8 1
Sl
log
Pc
, P
a
Figure 5.51 Leverett capillary pressure.

78
0
0.1
0.2
0.3
0.4
0.5
0.6
0.7
0.8
0.9
1
0 0.2 0.4 0.6 0.8 1
Liquid Saturation
Rel
ativ
e P
erm
eab
ility
krl (linear)
krg (linear)
krl (Ambusso)
krg (Ambusso)
krl (Corey-linear)
krg (Corey-linear)
krl (Brooks-Corey)
krg (Brooks-Corey)
krl (Corey-Leverett)
krg (Corey-Leverett)
krl (linear-Leverett)
krg (linear-Leverett)
krl (van Genuchten)
krg (van Genuchten)
Figure 5.52. Relative permeability estimates compared with Ambusso’s (1996) results.
0
0.1
0.2
0.3
0.4
0.5
0.6
0.7
0.8
0.9
1
0 0.2 0.4 0.6 0.8 1
Liquid Saturation
Rel
ativ
e P
erm
eab
ility
krl (linear)
krg (linear)
krl (Satik)
krg (Satik)
krl (Corey-linear)
krg (Corey-linear)
krl (Brooks-Corey)
krg (Brooks-Corey)
krl (Corey-Leverett)
krg (Corey-Leverett)
krl (linear-Leverett)
krg (linear-Leverett)
krl (van Genuchten)
krg (van Genuchten)
Figure 5.53. Relative permeability estimates compared with Satik’s (1996) results.
The error variance, So2, can be improved by discarding some observation data. Since data
at Sensor 1 dominated the estimation process, it is practical to eliminate them. By doing
so, the error caused by the heat input, boundary effects, and adsorption can be minimized.
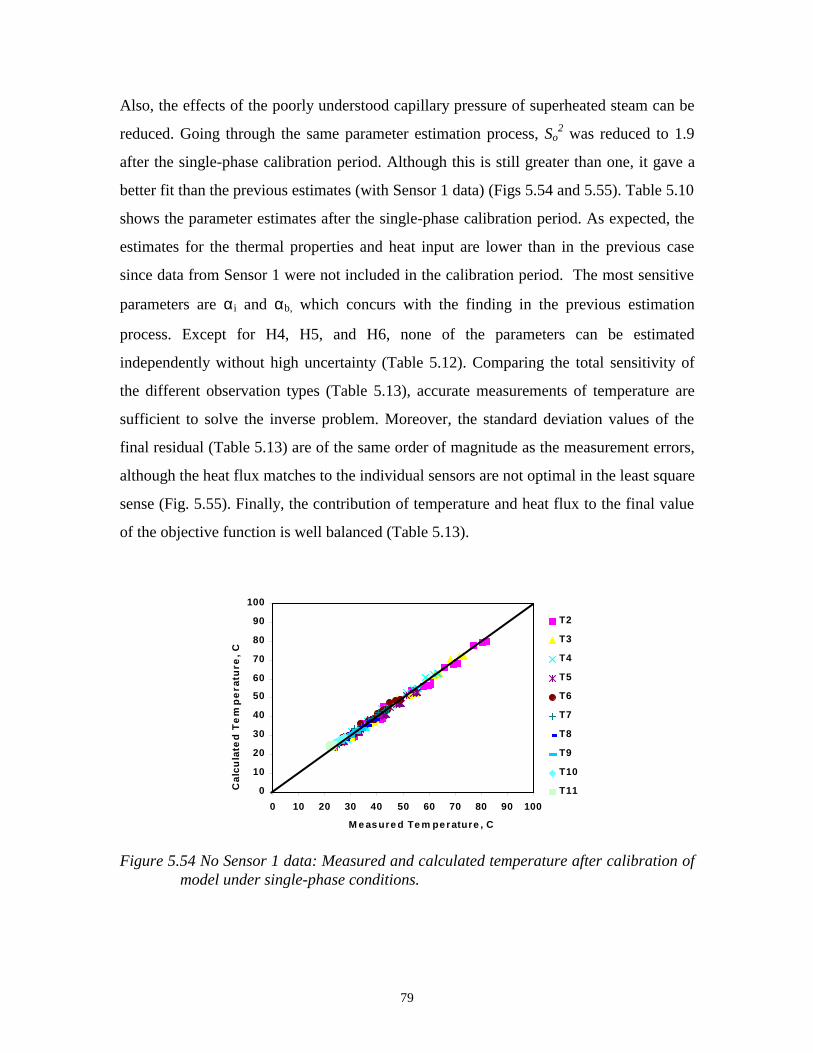
79
Also, the effects of the poorly understood capillary pressure of superheated steam can be
reduced. Going through the same parameter estimation process, So2 was reduced to 1.9
after the single-phase calibration period. Although this is still greater than one, it gave a
better fit than the previous estimates (with Sensor 1 data) (Figs 5.54 and 5.55). Table 5.10
shows the parameter estimates after the single-phase calibration period. As expected, the
estimates for the thermal properties and heat input are lower than in the previous case
since data from Sensor 1 were not included in the calibration period. The most sensitive
parameters are αi and αb, which concurs with the finding in the previous estimation
process. Except for H4, H5, and H6, none of the parameters can be estimated
independently without high uncertainty (Table 5.12). Comparing the total sensitivity of
the different observation types (Table 5.13), accurate measurements of temperature are
sufficient to solve the inverse problem. Moreover, the standard deviation values of the
final residual (Table 5.13) are of the same order of magnitude as the measurement errors,
although the heat flux matches to the individual sensors are not optimal in the least square
sense (Fig. 5.55). Finally, the contribution of temperature and heat flux to the final value
of the objective function is well balanced (Table 5.13).
0
10
20
30
40
50
60
70
80
90
100
0 10 20 30 40 50 60 70 80 90 100
T2
T3
T4
T5
T6
T7
T8
T9
T10
T11
M e as ure d Te m pe rature , C
Ca
lcu
late
d T
em
pe
ratu
re,
C
Figure 5.54 No Sensor 1 data: Measured and calculated temperature after calibration ofmodel under single-phase conditions.

80
0
50
100
150
200
0 50 100 150 200
HF2
HF3
HF4
HF5
HF6
HF7
HF8
HF9
HF10
HF11
M e as ure d He at Flux, W/m ^2
Ca
lcu
late
d H
ea
t F
lux
, W
/m^
2
Figure 5.55 No Sensor 1 data: measured and calculated heat flux after calibration ofmodel under single-phase conditions.
Table 5.10 No Sensor 1 data: Parameter estimates after the single-phase calibrationperiod.
Parameter Initial Guess Best Estimate
αs 4.930 4.826
αb 0.150 0.066
αi 0.115 0.100
HR2 0.235 0.141
HR3 0.515 0.482
HR4 0.972 0.802
HR5 1.237 1.079
HR6 1.510 1.357

81
Table 5.11 No Sensor 1 data: Variance-covariance and correlation matrices after single-phase period calibration.
αs αb αi HR2 HR3 HR4 HR5 HR6
αs 1.48E-02 -5.69E-01 4.01E-01 1.14E-01 1.54E-01 2.32E-01 2.94E-01 2.85E-01
αb -3.29E-04 2.26E-05 -5.86E-01 -7.74E-01 -2.45E-01 -3.81E-02 -5.21E-02 -5.46E-02
αi 6.95E-05 -3.98E-06 2.04E-06 1.91E-01 3.06E-01 5.03E-01 6.14E-01 5.55E-01
HR2 1.08E-04 -2.89E-05 2.14E-06 6.15E-05 -2.56E-01 -2.38E-01 -2.83E-01 -2.55E-01
HR3 1.56E-04 -9.74E-06 3.65E-06 -1.68E-05 7.00E-05 1.26E-01 1.56E-01 1.42E-01
HR4 2.61E-04 -1.68E-06 6.64E-06 -1.72E-05 9.78E-06 8.55E-05 4.44E-01 3.37E-01
HR5 4.18E-04 -2.91E-06 1.03E-05 -2.60E-05 1.53E-05 4.81E-05 1.37E-04 4.69E-01
HR6 4.44E-04 -3.33E-06 1.01E-05 -2.57E-05 1.53E-05 3.99E-05 7.04E-05 1.64E-04
Table 5.12 No Sensor 1 data: Statistical measures and parameter sensitivity after single-phase period calibration.
Parameter σ σ*/σ Parameter Sensitivity
αs 0.1215 0.0656 1129
αb 0.0048 0.0231 74231
αI 0.0014 0.1163 74700
HR2 0.0078 0.0295 34257
HR3 0.0084 0.0695 14404
HR4 0.0092 0.7539 2081
HR5 0.0117 0.6369 1758
HR6 0.0128 0.7040 1080

82
Table 5.13 No Sensor 1 data: Total sensitivity of observation, standard deviation ofresiduals, and contribution to the objective function (COF) after single-phaseperiod calibration.
Sensitivity StandardDeviation
COF%
Temperature 10350 1.4 54.42Heat Flux 2684 13.1 44.54
Subjecting all competing models to the two-phase parameter estimation process, the
model that gave the smallest error variance, So2, was the linear capillary relative
permeability and capillary pressure model. Although the error variance was reduced as a
result of not including data at Sensor 1, So2=5.2 is still significantly greater than one.
Thus, the match is not as good as expected. This is in part due to the inaccurate estimates
of the thermal properties and heat rates in the first part of the estimation process, and
partly because of the constraints posed by the large number of parameters being estimated
at the same time. The error variance values of the other estimate were of the same order
of magnitude as the error variance of the linear relative permeability and capillary
pressure case. This indicates that none of the cases performs significantly better than the
others, although each model is different from another.
Table 5.14 shows a summary of the estimated parameter set for the linear model. Results
show that k, HR8, HR7, and Sgr are the most sensitive parameters, and Slr and Sls are not
sensitive parameters at all (Table 5.16). This means that Slr and Sls can assume any value
and not affect the inversion process. Except for k, Slr, and Sls, all parameters cannot be
determined independently because they are correlated to one or more of the other
parameters. Although the standard deviation values of the final residual (Table 5.17) are
of the same order of magnitude as the measurement errors (Table 5.1), the assumed
accuracy of the match was overestimated. The large standard deviation of the steam
saturation residual shows that there was a systematic mismatch to in the steam saturation
measurements. Furthermore, the pressure during the two-phase period is under-predicted
(Fig. 5.58). It may be due to the insufficient capillary pressure predicted by the linear
function, although it is greater than the one predicted in the previous case. The heat flux

83
matches in Figure 5.59 has an under- and over-prediction pattern that is not observed in
the temperature match (Figure 5.56). This indicates that the heat flux sensors may exhibit
systematic trends. In addition, the contribution of each observation type to the objective
function is well balanced. Figures 5.60-5.63 show the predicted and measured
temperature, pressure, steam saturation, and heat flux in terms of time, respectively.
Figures 5.64-5.67 show the predicted and measured temperature, pressure, steam
saturation, and heat flux in terms of distance from the heater. Clearly, the fit is better than
in the previous case.
Figure 5.68 shows a comparison of the relative permeability obtained by Ambusso (1996)
and by inverse calculation. As in the previous case, the two relative permeability relation
agree on Sgr. Slr and Sls can be manipulated to coincide with Ambusso’s results since the
observation data are not sensitive to them. Figures 5.68 and 5.69 show a comparison of
all the models with Ambusso’s results and Satik’s measurements, respectively. Except for
the van Genuchten model, all models agree on the value of Sgr which is around 0.1.
In general, the inverse problem that was formulated here was ill-posed since too many
parameters were estimated at the same time. This could not be avoided, however, since
the thermal parameters, including the heat input, were strongly correlated with the
hydrogeologic properties. This was due to the fact that the two-phase flow was driven
only by boiling, and not by, say, fluid injection. Thus, it was necessary to divide the
estimation process into two parts: single-phase and two-phase period estimation. This
reduced the dependence between the multiphase and thermal parameters, although not
completely. If the thermal parameters and capillary pressure were known, a more accurate
estimate of the relative permeability could be achieved. However, this was not possible
under the given operating conditions. Consequently, the results of the estimation process
were ambiguous, making the determination of the appropriate relative permeability as
well as the capillary pressure function difficult.

84
0
20
40
60
80
100
120
0 20 40 60 80 100 120M e as ure d Te m pe rature , C
Ca
lcu
late
d T
em
pe
ratu
re,
C
Figure 5.56 No Sensor 1 data: Measured and calculated temperature.
0
5
10
15
20
25
30
0 5 10 15 20 25 30M e as ur e d Pr e s s u r e , k Pa
Ca
lcu
late
d P
res
su
re,
kP
a
Figure 5.57 No Sensor 1 data: Measured and calculated pressure.
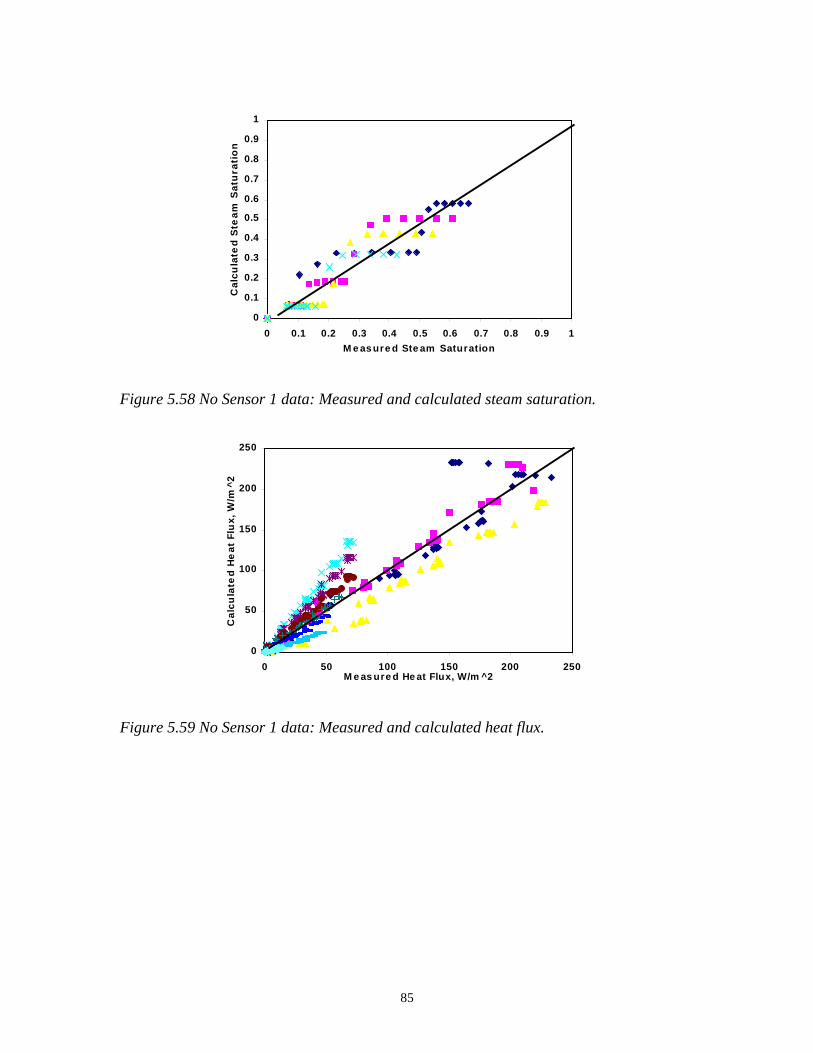
85
0
0.1
0.2
0.3
0.4
0.5
0.6
0.7
0.8
0.9
1
0 0.1 0.2 0.3 0.4 0.5 0.6 0.7 0.8 0.9 1
M e as ure d Ste am Saturation
Ca
lcu
late
d S
tea
m S
atu
rati
on
Figure 5.58 No Sensor 1 data: Measured and calculated steam saturation.
0
50
100
150
200
250
0 50 100 150 200 250M e as ure d He at Flux, W/m ^2
Ca
lcu
late
d H
ea
t F
lux
, W
/m^
2
Figure 5.59 No Sensor 1 data: Measured and calculated heat flux.
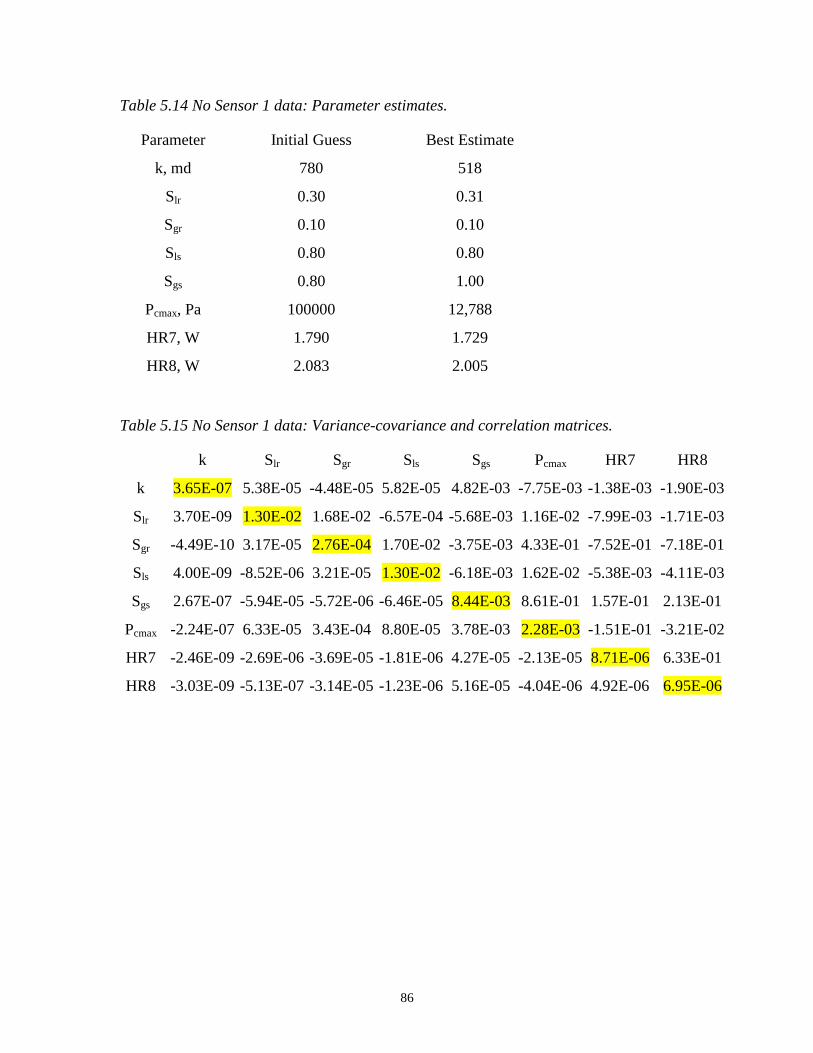
86
Table 5.14 No Sensor 1 data: Parameter estimates.
Parameter Initial Guess Best Estimate
k, md 780 518
Slr 0.30 0.31
Sgr 0.10 0.10
Sls 0.80 0.80
Sgs 0.80 1.00
Pcmax, Pa 100000 12,788
HR7, W 1.790 1.729
HR8, W 2.083 2.005
Table 5.15 No Sensor 1 data: Variance-covariance and correlation matrices.
k Slr Sgr Sls Sgs Pcmax HR7 HR8
k 3.65E-07 5.38E-05 -4.48E-05 5.82E-05 4.82E-03 -7.75E-03 -1.38E-03 -1.90E-03
Slr 3.70E-09 1.30E-02 1.68E-02 -6.57E-04 -5.68E-03 1.16E-02 -7.99E-03 -1.71E-03
Sgr -4.49E-10 3.17E-05 2.76E-04 1.70E-02 -3.75E-03 4.33E-01 -7.52E-01 -7.18E-01
Sls 4.00E-09 -8.52E-06 3.21E-05 1.30E-02 -6.18E-03 1.62E-02 -5.38E-03 -4.11E-03
Sgs 2.67E-07 -5.94E-05 -5.72E-06 -6.46E-05 8.44E-03 8.61E-01 1.57E-01 2.13E-01
Pcmax -2.24E-07 6.33E-05 3.43E-04 8.80E-05 3.78E-03 2.28E-03 -1.51E-01 -3.21E-02
HR7 -2.46E-09 -2.69E-06 -3.69E-05 -1.81E-06 4.27E-05 -2.13E-05 8.71E-06 6.33E-01
HR8 -3.03E-09 -5.13E-07 -3.14E-05 -1.23E-06 5.16E-05 -4.04E-06 4.92E-06 6.95E-06

87
Table 5.17 No Sensor 1 data: Total sensitivity of observation, standard deviation ofresiduals, and contribution to the objective function (COF).
Parameter σ σ*/σ Parameter Sensitivity
k 0.0006 0.9986 13396
Slr 0.1139 0.9992 5
Sgr 0.0166 0.2869 3598
Sls 0.1139 0.9982 6
Sgs 0.0919 0.2552 596
Pcmax 0.0478 0.2141 1536
HR7 0.0030 0.6208 7057
HR8 0.0026 0.5513 11425
Table 5.18 No Sensor 1 data: Total sensitivity of observation, standard deviation ofresiduals, and contribution to the objective function (COF).
Sensitivity Standard
Deviation
COF
%
Temperature 4.79E+02 1.67 21.11
Pressure 2.48E+03 1410 13.36
Saturation 2.41E+03 0.067 40.64
Heat flux 1.39E+02 19.8 24.67

88
20
30
40
50
60
70
80
90
100
110
0 25 50 75 100 125 150 175Tim e , hours
Te
mp
era
ture
, C
T2 dat
T2 s im
T3 dat
T3 s im
20
30
40
50
60
70
80
90
100
110
120
0 25 50 75 100 125 150 175
Tim e , hours
Te
mp
era
ture
, C
T4 dat
T4 s im
T5 dat
T5 s im
20
30
40
50
60
70
80
90
100
110
120
0 25 50 75 100 125 150 175
Tim e , hours
Te
mp
era
ture
, C
T6 dat
T6 s im
T7 dat
T7 s im
Figure 5.60 No Sensor 1 data: Temperature with respect to time.
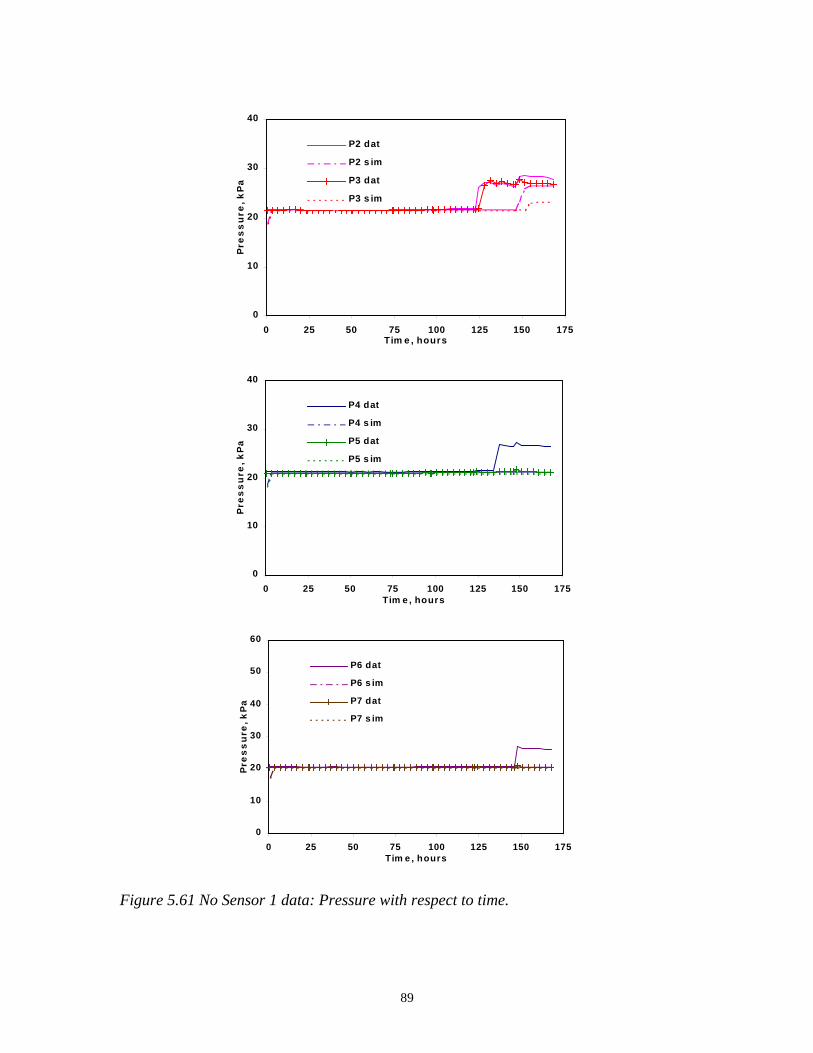
89
0
10
20
30
40
0 25 50 75 100 125 150 175Tim e , hours
Pre
ss
ure
, k
Pa
P2 dat
P2 s im
P3 dat
P3 s im
0
10
20
30
40
0 25 50 75 100 125 150 175Tim e , hours
Pre
ss
ure
, k
Pa
P4 dat
P4 s im
P5 dat
P5 s im
0
10
20
30
40
50
60
0 25 50 75 100 125 150 175Tim e , hours
Pre
ss
ure
, k
Pa
P6 dat
P6 s im
P7 dat
P7 s im
Figure 5.61 No Sensor 1 data: Pressure with respect to time.

90
0
0.1
0.2
0.3
0.4
0.5
0.6
0.7
0.8
0.9
1
0 25 50 75 100 125 150 175Tim e , hours
Ste
am
Sa
tura
tio
n
Ss t2 dat
Ss t2 s im
Ss t3 dat
Ss t3 s im
0
0.1
0.2
0.3
0.4
0.5
0.6
0.7
0.8
0.9
1
0 25 50 75 100 125 150 175T im e , h o u r s
Ste
am
Sa
tura
tio
n
Ss t4 d at
Ss t4 s im
Ss t5 d at
Ss t5 s im
0
0.1
0.2
0.3
0.4
0.5
0.6
0.7
0.8
0.9
1
0 25 50 75 100 125 150 175Tim e , hour s
Ste
am
Sa
tura
tio
n
Ss t6 dat
Ss t6 s im
Figure 5.62 No Sensor 1 data: Steam saturation with respect to time.

91
0
50
100
150
200
250
0 25 50 75 100 125 150 175T im e , hour s
He
at
Flu
x,
W/m
^2
HF2 dat
HF2 s im
HF3 dat
HF3 s im
0
50
100
150
200
250
0 25 50 75 100 125 150 175T im e , h o u r s
He
at F
lux,
W/m
^2
HF4 d at
HF4 s im
HF5 d at
HF5 s im
0
5 0
10 0
15 0
20 0
25 0
0 25 50 7 5 1 00 12 5 15 0 1 75T im e , h o u r s
He
at
Flu
x,
W/m
^2
HF6 d at
HF6 s im
HF7 d at
HF7 s im
0
50
100
150
200
250
0 25 50 75 100 125 150 175T im e , h o u r s
He
at
Flu
x,
W/m
^2
HF8 d at
HF8 s im
HF9 s im
HF9 s im
Figure 5.63 No Sensor 1 data: Heat flux with respect to time.

92
20
40
60
80
100
120
0 10 20 30 40 50
127 hrs s im
127 hrs dat
146 hrs s im
146 hrs dat
168 hrs s im
168 hrs dat
Te
mp
era
ture
, C
Dis tance from the he ate r , cm
Figure 5.64 No Sensor 1 data: Temperature with respect to distance from heater.
10
15
20
25
30
35
40
0 10 20 30 40 50
127 hrs s im
127 hrs dat
146 hrs s im
146 hrs dat
168 hrs s im
168 hrs dat
Pre
ss
ure
, k
Pa
Dis tance from the he ate r , cm
Figure 5.65 No Sensor 1 data: Pressure with respect to distance from heater.
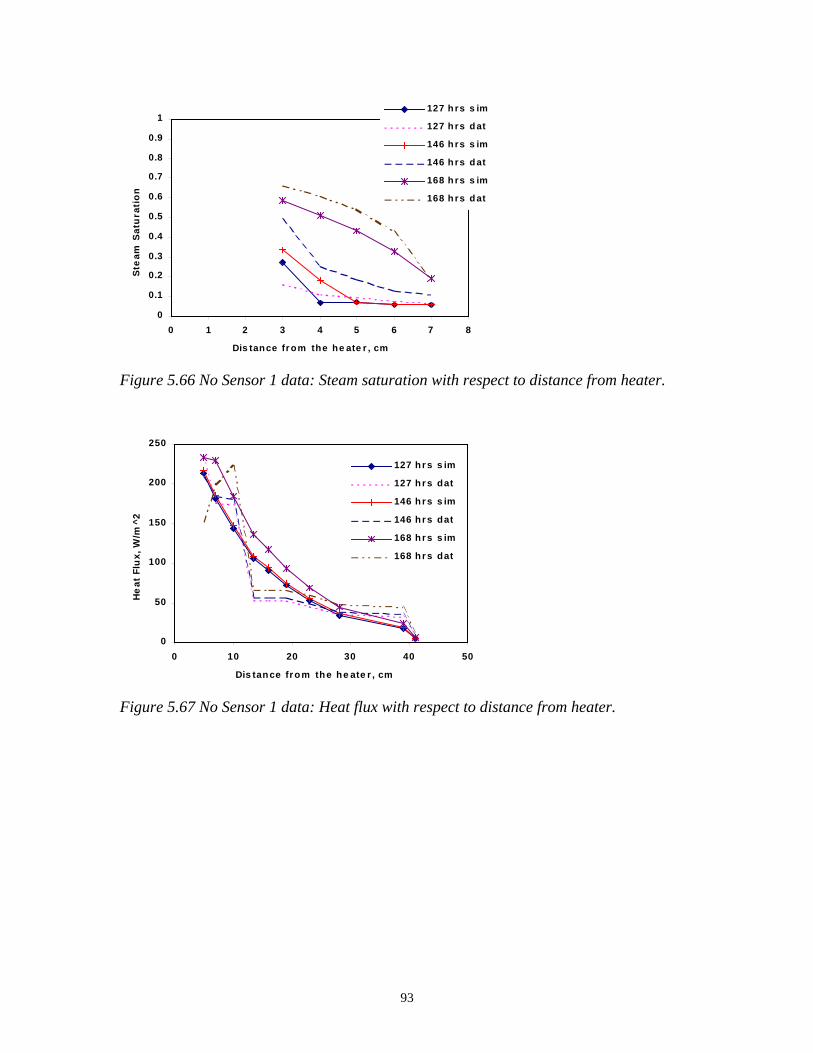
93
0
0.1
0.2
0.3
0.4
0.5
0.6
0.7
0.8
0.9
1
0 1 2 3 4 5 6 7 8
127 h rs s im
127 h rs d at
146 h rs s im
146 h rs d at
168 h rs s im
168 h rs d at
Ste
am
Sa
tura
tio
n
Dis tance fr om the he ate r , cm
Figure 5.66 No Sensor 1 data: Steam saturation with respect to distance from heater.
0
50
100
150
200
250
0 10 20 30 40 50
127 hrs s im
127 hrs dat
146 hrs s im
146 hrs dat
168 hrs s im
168 hrs dat
He
at
Flu
x,
W/m
^2
Dis tance from the he ate r , cm
Figure 5.67 No Sensor 1 data: Heat flux with respect to distance from heater.

94
0
0 . 1
0 . 2
0 . 3
0 . 4
0 . 5
0 . 6
0 . 7
0 . 8
0 . 9
1
0 0 . 1 0 . 2 0 . 3 0 . 4 0 . 5 0 . 6 0 . 7 0 . 8 0 . 9 1
L i q u i d sa tu r a ti o n , S l
Re
lati
ve
Pe
rme
ab
ilit
y
Figure 5.68 No Sensor 1 data: Relative permeability estimate compared with Ambusso’sresults (1996).
1 . E + 0 2
1 . E + 0 3
1 . E + 0 4
1 . E + 0 5
0 0 . 2 0 . 4 0 . 6 0 . 8 1
Sl
log
Pc
, P
a
Figure 5.69 No Sensor 1 data: Linear capillary pressure.

95
0
0.1
0.2
0.3
0.4
0.5
0.6
0.7
0.8
0.9
1
0 0.2 0.4 0.6 0.8 1
Liquid Saturation
Rel
ativ
e P
erm
eab
ility
krl (linear)
krg (linear)
krl (Ambusso)
krg (Ambusso)
krl (Corey-linear)
krg (Corey-linear)
krl (Brooks-Corey)
krg (Brooks-Corey)
krl (Corey-Leverett)
krg (Corey-Leverett)
krl (linear-Leverett)
krg (linear-Leverett)
krl (van Genuchten)
krg (van Genuchten)
Figure 5.70 No Sensor 1 data: Relative permeability estimates compared with Ambusso’sresults.
0
0.1
0.2
0.3
0.4
0.5
0.6
0.7
0.8
0.9
1
0 0.2 0.4 0.6 0.8 1
Liquid Saturation
Rel
ativ
e P
erm
eab
ility
krl (linear)
krg (linear)
krl (Satik)
krg (Satik)
krl (Corey-linear)
krg (Corey-linear)
krl (Brooks-Corey)
krg (Brooks-Corey)
krl (Corey-Leverett)
krg (Corey-Leverett)
krl (linear-Leverett)
krg (linear-Leverett)
krl (van Genuchten)
krg (van Genuchten)
Figure 5.71 No Sensor 1 data: Relative permeability estimates compared with Satik’sresults.
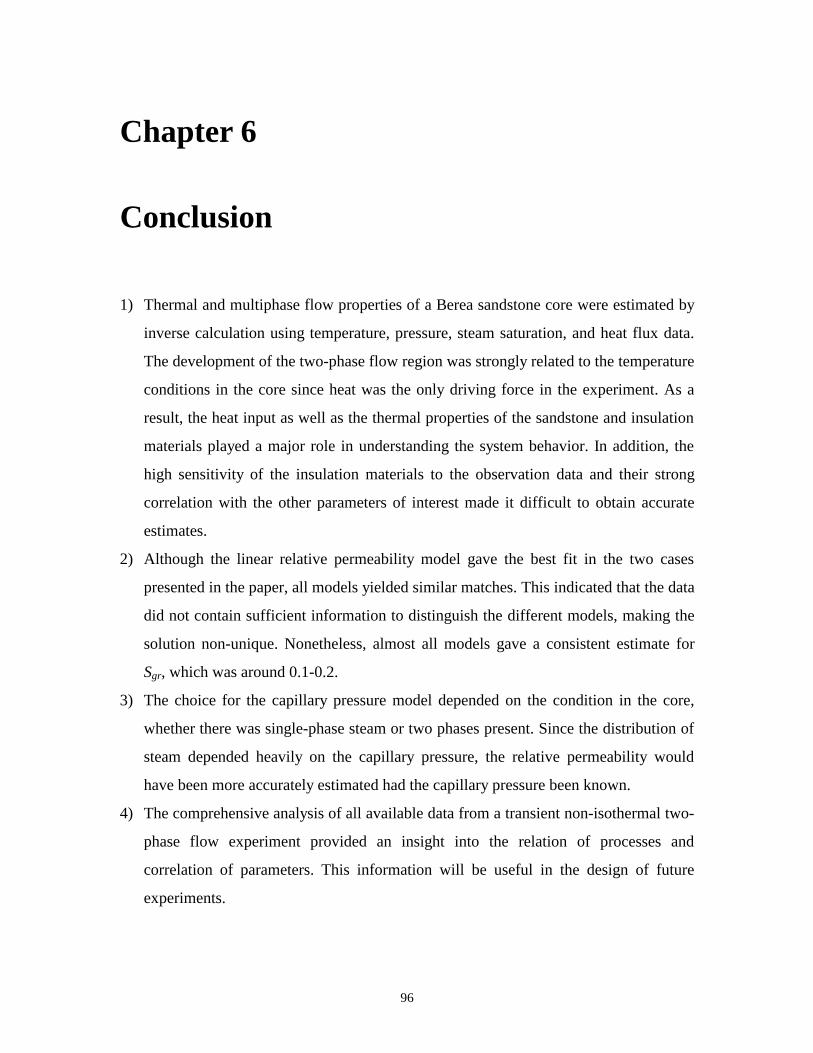
96
Chapter 6
Conclusion
1) Thermal and multiphase flow properties of a Berea sandstone core were estimated by
inverse calculation using temperature, pressure, steam saturation, and heat flux data.
The development of the two-phase flow region was strongly related to the temperature
conditions in the core since heat was the only driving force in the experiment. As a
result, the heat input as well as the thermal properties of the sandstone and insulation
materials played a major role in understanding the system behavior. In addition, the
high sensitivity of the insulation materials to the observation data and their strong
correlation with the other parameters of interest made it difficult to obtain accurate
estimates.
2) Although the linear relative permeability model gave the best fit in the two cases
presented in the paper, all models yielded similar matches. This indicated that the data
did not contain sufficient information to distinguish the different models, making the
solution non-unique. Nonetheless, almost all models gave a consistent estimate for
Sgr, which was around 0.1-0.2.
3) The choice for the capillary pressure model depended on the condition in the core,
whether there was single-phase steam or two phases present. Since the distribution of
steam depended heavily on the capillary pressure, the relative permeability would
have been more accurately estimated had the capillary pressure been known.
4) The comprehensive analysis of all available data from a transient non-isothermal two-
phase flow experiment provided an insight into the relation of processes and
correlation of parameters. This information will be useful in the design of future
experiments.

97
References
[1] W.J. Ambusso, 1996. Experimental Determination of Steam-Water Relative
Permeability Relations, MS Thesis, Stanford University, Stanford. Calif.
[2] R.H. Brooks and A.T. Corey, 1964. “Hydraulic Properties of Porous Media”,
Colorado State University, Hydro paper No.5.
[3] A. T. Corey, 1954. “The Interrelations Between Gas and Oil Relative Permeabilities”,
Producers Monthly Vol. 19 pp 38-41.
[4] A. T. Corey, 1994. Mechanics of Immiscible Fluids in Porous Media, Water
Resources Publications.
[5] L. P. Dake, 1978. Fundamentals of Petroleum Engineering, Elsivier Science B. V.
[7] F. A. Dullien, 1992. Porous Media Fluid Transport and Pore Structure, Academic
Press.
[8] S. Finsterle, 1997. ITOUGH2 Command References Version 3.1, Lawrence Berkeley
National Laboratory, Berkeley, Calif.
[9] S. Finsterle, K. Pruess, D.P. Bullivant, and M.J. O’Sullivan, 1997. “Application of
Inverse Modeling to Geothermal Reservoir Simulation”, Proc. of 22rd Workshop on
Geothermal Reservoir Engineering, Stanford, Calif.
[10] S. Finsterle, C. Satik, and M. Guerrero, 1998. “Analysis of Boiling Experiments
Using Inverse Modeling, Proc. of 1st ITOUGH2 Workshop, Berkeley, California.

98
[11] S. K. Garg and J. Pritchett, 1977. “On Pressure-Work, Viscous Dissipation and
Energy Balance Relation fro Geothermal Reservoirs, Advances in Water Resources, 1,
No. 1, 41-47.
[12] M. Grant, 1977. “Permeability Reduction Factors at Wairakei”, Proc. of
ASME/AIChe Heat Transfer Conference, Salt Lake City, Utah, 77-HT-52, 15-17.
[13] R. N. Horne and H Ramey, 1978. “Steam/Water Relative Permeabilities From
Production Data”, GRC Trans. (2), 291.
[14] N. Kaviany, 1995. Principles of Heat Transfer in Porous Media, Mechanical
Engineering Series, Springer.
[15] M. C. Leverett, 1941. “Capillary behavior in Porous Solids”, Petroleum Technology,
No. 1223, 152-169.
[16] K. Pruess and T. N. Narasimhan, 1985. “A Practical Method for Modeling Fluid and
Heat Flow in Fracture Porous Media, SPE Journal, Vol. 25, No. 1, 14-26.
[17] K. Pruess, 1987. TOUGH User’s Guide, Lawrence Berkeley National Laboratory,
Berkeley, Calif.
[18] K. Pruess, 1991. TOUGH2-A General Purpose Numerical Simulator for Multiphase
Fluid and Heat Flow, Report LBL-29400, Lawrence Berkeley National Laboratory,
Berkeley, Calif.
[19] C. Satik (1997a), Stanford Geothermal Program Quarterly Report June-September
1997, Stanford University.

99
[20] C. Satik (1997b), “A Study of Boiling in Porous Media”, Proc. 19th New Zealand
Geothermal Workshop, Auckland, NZ.
[21] C. Satik (1998), “A Measurement of Steam-Water Relative Permeability”, Proc. of
23rd Workshop on Geothermal Reservoir Engineering, Stanford, Calif.
[22] M.L. Sorey, M.A. Grant and E. Bradford, 1980. Nonlinear Effects in Two Phase
Flow to Wells in Geothermal Reservoirs. Water Resources Research, Vol. 16 No. 4, pp
767-777.
[23] M. van Genuchten, 1980. “A Closed-Form Equation for Predicting the Hydraulic
Conductivity of Unsaturated Soils”, Soil Sci. Soc. Am. J, 44(5), 892-898.

100
Appendix A
A.1 Single-phase period calibration input files.
Appendix A.1.1 TOUGH2 input file.
ROCKS----1----*----2----*----3----*----4----*----5----*----6----*----7----*----8BEREA 2 2163. 0.210 0.0E-20 0.0E-20 8.487E-13 4.930858.240.0000E+000.0000E+000.2163E+010.1000E+01 5 0.200 0.200 0.000 1 0.0000 0.000 1.000000HEATE 0 2200. 0.010 0.0E-15 0.0E-15 0.0E-15 2.885246.6HEATB 0 240. 0.010 0.0E-15 0.0E-15 0.0E-15 0.1501046.6EPOXY 0 1200. 0.010 0.0E-15 0.0E-15 0.0E-15 0.5771046.6INSUL 0 192. 0.010 0.0E-15 0.0E-15 0.0E-15 0.115104.7BOUND 0 2163. 0.990 0.0E-15 0.0E-15 0.0E-15 0.642-1611.0AMBIE 1.293 0.990 0.0E-20 0.0E-20 1.0E-10 0.055-1611.0
START----1----*----2----*----3----*----4----*----5----*----6----*----7----*----8PARAM 123456789012345678901234 -31200 1200100000100101000400001000 2.130E-05 1.0 6.1020E5 1.00E+03 9.8100 1.E-5 1.0065E5 24. 0.0MESHMAKER1----*----2----*----3----*----4----*----5----*----6----*----7----*----8RZ2DRADII 5 0 0.0254 0.0304 0.0812 5.0812LAYER----1----*----2----*----3----*----4----*----5----*----6----*----7----*----8 51 0.0100 0.0100 0.0100 0.0100 0.0100 0.0100 0.01000.0100 0.0100 0.0100 0.0100 0.0100 0.0100 0.0100 0.01000.0100 0.0100 0.0100 0.0100 0.0100 0.0100 0.0100 0.01000.0100 0.0100 0.0100 0.0100 0.0100 0.0100 0.0100 0.01000.0100

101
0.0100 0.0100 0.0100 0.0100 0.0100 0.0100 0.01000.0100 0.0100 0.0100 0.0100 0.0100 0.0050 0.0100 0.01000.0100 0.0100 0.0100 5.0000
ELEME --- 4 5 0 0 0.00000 5.132BOU 1 BOUND .2027E+540.2027E-02 0.1270E-01 -.5000E-02A2 1 BEREA .2027E-040.0000E+00 0.1270E-01 -.1500E-01A3 1 BEREA .2027E-040.0000E+00 0.1270E-01 -.2500E-01A4 1 BEREA .2027E-040.0000E+00 0.1270E-01 -.3500E-01A5 1 BEREA .2027E-040.0000E+00 0.1270E-01 -.4500E-01A6 1 BEREA .2027E-040.0000E+00 0.1270E-01 -.5500E-01A7 1 BEREA .2027E-040.0000E+00 0.1270E-01 -.6500E-01A8 1 BEREA .2027E-040.0000E+00 0.1270E-01 -.7500E-01A9 1 BEREA .2027E-040.0000E+00 0.1270E-01 -.8500E-01AA 1 BEREA .2027E-040.0000E+00 0.1270E-01 -.9500E-01AB 1 BEREA .2027E-040.0000E+00 0.1270E-01 -.1050E+00AC 1 BEREA .2027E-040.0000E+00 0.1270E-01 -.1150E+00AD 1 BEREA .2027E-040.0000E+00 0.1270E-01 -.1250E+00AE 1 BEREA .2027E-040.0000E+00 0.1270E-01 -.1350E+00AF 1 BEREA .2027E-040.0000E+00 0.1270E-01 -.1450E+00AG 1 BEREA .2027E-040.0000E+00 0.1270E-01 -.1550E+00AH 1 BEREA .2027E-040.0000E+00 0.1270E-01 -.1650E+00AI 1 BEREA .2027E-040.0000E+00 0.1270E-01 -.1750E+00AJ 1 BEREA .2027E-040.0000E+00 0.1270E-01 -.1850E+00AK 1 BEREA .2027E-040.0000E+00 0.1270E-01 -.1950E+00AL 1 BEREA .2027E-040.0000E+00 0.1270E-01 -.2050E+00AM 1 BEREA .2027E-040.0000E+00 0.1270E-01 -.2150E+00AN 1 BEREA .2027E-040.0000E+00 0.1270E-01 -.2250E+00AO 1 BEREA .2027E-040.0000E+00 0.1270E-01 -.2350E+00AP 1 BEREA .2027E-040.0000E+00 0.1270E-01 -.2450E+00AQ 1 BEREA .2027E-040.0000E+00 0.1270E-01 -.2550E+00AR 1 BEREA .2027E-040.0000E+00 0.1270E-01 -.2650E+00

102
AS 1 BEREA .2027E-040.0000E+00 0.1270E-01 -.2750E+00AT 1 BEREA .2027E-040.0000E+00 0.1270E-01 -.2850E+00AU 1 BEREA .2027E-040.0000E+00 0.1270E-01 -.2950E+00AV 1 BEREA .2027E-040.0000E+00 0.1270E-01 -.3050E+00AW 1 BEREA .2027E-040.0000E+00 0.1270E-01 -.3150E+00AX 1 BEREA .2027E-040.0000E+00 0.1270E-01 -.3250E+00AY 1 BEREA .2027E-040.0000E+00 0.1270E-01 -.3350E+00AZ 1 BEREA .2027E-040.0000E+00 0.1270E-01 -.3450E+00B1 1 BEREA .2027E-040.0000E+00 0.1270E-01 -.3550E+00B2 1 BEREA .2027E-040.0000E+00 0.1270E-01 -.3650E+00B3 1 BEREA .2027E-040.0000E+00 0.1270E-01 -.3750E+00B4 1 BEREA .2027E-040.0000E+00 0.1270E-01 -.3850E+00B5 1 BEREA .2027E-040.0000E+00 0.1270E-01 -.3950E+00B6 1 BEREA .2027E-040.0000E+00 0.1270E-01 -.4050E+00B7 1 BEREA .2027E-040.0000E+00 0.1270E-01 -.4150E+00B8 1 BEREA .2027E-040.0000E+00 0.1270E-01 -.4250E+00B9 1 BEREA .2027E-040.0000E+00 0.1270E-01 -.4350E+00BA1 1 HEATE2.0260E-060.0000E+00 0.1270E-01 -.4425E+00BA2 1 HEATE2.0260E-060.0000E+00 0.1270E-01 -.4425E+00BA3 1 HEATE2.0260E-060.0000E+00 0.1270E-01 -.4425E+00BA4 1 HEATE2.0260E-060.0000E+00 0.1270E-01 -.4425E+00BA5 1 HEATE2.0260E-060.0000E+00 0.1270E-01 -.4425E+00BB 1 HEATB .2027E-040.0000E+00 0.1270E-01 -.4500E+00BC 1 HEATB .2027E-040.0000E+00 0.1270E-01 -.4600E+00BD 1 HEATB .2027E-040.0000E+00 0.1270E-01 -.4700E+00BE 1 HEATB .2027E-040.0000E+00 0.1270E-01 -.4800E+00BF 1 HEATB .2027E-040.0000E+00 0.1270E-01 -.4900E+00AMB 1 AMBIE .1013E+540.2027E-02 0.1270E-01 -.2995E+01A2 2 EPOXY .8765E-050.0000E+00 0.2790E-01 -.1500E-01A3 2 EPOXY .8765E-050.0000E+00 0.2790E-01 -.2500E-01

103
A4 2 EPOXY .8765E-050.0000E+00 0.2790E-01 -.3500E-01A5 2 EPOXY .8765E-050.0000E+00 0.2790E-01 -.4500E-01A6 2 EPOXY .8765E-050.0000E+00 0.2790E-01 -.5500E-01A7 2 EPOXY .8765E-050.0000E+00 0.2790E-01 -.6500E-01A8 2 EPOXY .8765E-050.0000E+00 0.2790E-01 -.7500E-01A9 2 EPOXY .8765E-050.0000E+00 0.2790E-01 -.8500E-01AA 2 EPOXY .8765E-050.0000E+00 0.2790E-01 -.9500E-01AB 2 EPOXY .8765E-050.0000E+00 0.2790E-01 -.1050E+00AC 2 EPOXY .8765E-050.0000E+00 0.2790E-01 -.1150E+00AD 2 EPOXY .8765E-050.0000E+00 0.2790E-01 -.1250E+00AE 2 EPOXY .8765E-050.0000E+00 0.2790E-01 -.1350E+00AF 2 EPOXY .8765E-050.0000E+00 0.2790E-01 -.1450E+00AG 2 EPOXY .8765E-050.0000E+00 0.2790E-01 -.1550E+00AH 2 EPOXY .8765E-050.0000E+00 0.2790E-01 -.1650E+00AI 2 EPOXY .8765E-050.0000E+00 0.2790E-01 -.1750E+00AJ 2 EPOXY .8765E-050.0000E+00 0.2790E-01 -.1850E+00AK 2 EPOXY .8765E-050.0000E+00 0.2790E-01 -.1950E+00AL 2 EPOXY .8765E-050.0000E+00 0.2790E-01 -.2050E+00AM 2 EPOXY .8765E-050.0000E+00 0.2790E-01 -.2150E+00AN 2 EPOXY .8765E-050.0000E+00 0.2790E-01 -.2250E+00AO 2 EPOXY .8765E-050.0000E+00 0.2790E-01 -.2350E+00AP 2 EPOXY .8765E-050.0000E+00 0.2790E-01 -.2450E+00AQ 2 EPOXY .8765E-050.0000E+00 0.2790E-01 -.2550E+00AR 2 EPOXY .8765E-050.0000E+00 0.2790E-01 -.2650E+00AS 2 EPOXY .8765E-050.0000E+00 0.2790E-01 -.2750E+00AT 2 EPOXY .8765E-050.0000E+00 0.2790E-01 -.2850E+00AU 2 EPOXY .8765E-050.0000E+00 0.2790E-01 -.2950E+00AV 2 EPOXY .8765E-050.0000E+00 0.2790E-01 -.3050E+00AW 2 EPOXY .8765E-050.0000E+00 0.2790E-01 -.3150E+00AX 2 EPOXY .8765E-050.0000E+00 0.2790E-01 -.3250E+00

104
AY 2 EPOXY .8765E-050.0000E+00 0.2790E-01 -.3350E+00AZ 2 EPOXY .8765E-050.0000E+00 0.2790E-01 -.3450E+00B1 2 EPOXY .8765E-050.0000E+00 0.2790E-01 -.3550E+00B2 2 EPOXY .8765E-050.0000E+00 0.2790E-01 -.3650E+00B3 2 EPOXY .8765E-050.0000E+00 0.2790E-01 -.3750E+00B4 2 EPOXY .8765E-050.0000E+00 0.2790E-01 -.3850E+00B5 2 EPOXY .8765E-050.0000E+00 0.2790E-01 -.3950E+00B6 2 EPOXY .8765E-050.0000E+00 0.2790E-01 -.4050E+00B7 2 EPOXY .8765E-050.0000E+00 0.2790E-01 -.4150E+00B8 2 EPOXY .8765E-050.0000E+00 0.2790E-01 -.4250E+00B9 2 EPOXY .8765E-050.0000E+00 0.2790E-01 -.4350E+00BA 2 EPOXY .4383E-050.0000E+00 0.2790E-01 -.4425E+00BB 2 HEATB .8765E-050.0000E+00 0.2790E-01 -.4500E+00BC 2 HEATB .8765E-050.0000E+00 0.2790E-01 -.4600E+00BD 2 HEATB .8765E-050.0000E+00 0.2790E-01 -.4700E+00BE 2 HEATB .8765E-050.0000E+00 0.2790E-01 -.4800E+00BF 2 HEATB .8765E-050.0000E+00 0.2790E-01 -.4900E+00A2 3 INSUL .1781E-000.0000E+00 0.5580E-01 -.1500E-01A3 3 INSUL .1781E-030.0000E+00 0.5580E-01 -.2500E-01A4 3 INSUL .1781E-030.0000E+00 0.5580E-01 -.3500E-01A5 3 INSUL .1781E-030.0000E+00 0.5580E-01 -.4500E-01A6 3 INSUL .1781E-030.0000E+00 0.5580E-01 -.5500E-01A7 3 INSUL .1781E-030.0000E+00 0.5580E-01 -.6500E-01A8 3 INSUL .1781E-030.0000E+00 0.5580E-01 -.7500E-01A9 3 INSUL .1781E-030.0000E+00 0.5580E-01 -.8500E-01AA 3 INSUL .1781E-030.0000E+00 0.5580E-01 -.9500E-01AB 3 INSUL .1781E-030.0000E+00 0.5580E-01 -.1050E+00AC 3 INSUL .1781E-030.0000E+00 0.5580E-01 -.1150E+00AD 3 INSUL .1781E-030.0000E+00 0.5580E-01 -.1250E+00AE 3 INSUL .1781E-030.0000E+00 0.5580E-01 -.1350E+00

105
AF 3 INSUL .1781E-030.0000E+00 0.5580E-01 -.1450E+00AG 3 INSUL .1781E-030.0000E+00 0.5580E-01 -.1550E+00AH 3 INSUL .1781E-030.0000E+00 0.5580E-01 -.1650E+00AI 3 INSUL .1781E-030.0000E+00 0.5580E-01 -.1750E+00AJ 3 INSUL .1781E-030.0000E+00 0.5580E-01 -.1850E+00AK 3 INSUL .1781E-030.0000E+00 0.5580E-01 -.1950E+00AL 3 INSUL .1781E-030.0000E+00 0.5580E-01 -.2050E+00AM 3 INSUL .1781E-030.0000E+00 0.5580E-01 -.2150E+00AN 3 INSUL .1781E-030.0000E+00 0.5580E-01 -.2250E+00AO 3 INSUL .1781E-030.0000E+00 0.5580E-01 -.2350E+00AP 3 INSUL .1781E-030.0000E+00 0.5580E-01 -.2450E+00AQ 3 INSUL .1781E-030.0000E+00 0.5580E-01 -.2550E+00AR 3 INSUL .1781E-030.0000E+00 0.5580E-01 -.2650E+00AS 3 INSUL .1781E-030.0000E+00 0.5580E-01 -.2750E+00AT 3 INSUL .1781E-030.0000E+00 0.5580E-01 -.2850E+00AU 3 INSUL .1781E-030.0000E+00 0.5580E-01 -.2950E+00AV 3 INSUL .1781E-030.0000E+00 0.5580E-01 -.3050E+00AW 3 INSUL .1781E-030.0000E+00 0.5580E-01 -.3150E+00AX 3 INSUL .1781E-030.0000E+00 0.5580E-01 -.3250E+00AY 3 INSUL .1781E-030.0000E+00 0.5580E-01 -.3350E+00AZ 3 INSUL .1781E-030.0000E+00 0.5580E-01 -.3450E+00B1 3 INSUL .1781E-030.0000E+00 0.5580E-01 -.3550E+00B2 3 INSUL .1781E-030.0000E+00 0.5580E-01 -.3650E+00B3 3 INSUL .1781E-030.0000E+00 0.5580E-01 -.3750E+00B4 3 INSUL .1781E-030.0000E+00 0.5580E-01 -.3850E+00B5 3 INSUL .1781E-030.0000E+00 0.5580E-01 -.3950E+00B6 3 INSUL .1781E-030.0000E+00 0.5580E-01 -.4050E+00B7 3 INSUL .1781E-030.0000E+00 0.5580E-01 -.4150E+00B8 3 INSUL .1781E-030.0000E+00 0.5580E-01 -.4250E+00B9 3 INSUL .1781E-030.0000E+00 0.5580E-01 -.4350E+00

106
BA 3 INSUL .8905E-040.0000E+00 0.5580E-01 -.4425E+00BB 3 HEATB .1781E-030.0000E+00 0.5580E-01 -.4500E+00BC 3 HEATB .1781E-030.0000E+00 0.5580E-01 -.4600E+00BD 3 HEATB .1781E-030.0000E+00 0.5580E-01 -.4700E+00BE 3 HEATB .1781E-030.0000E+00 0.5580E-01 -.4800E+00BF 3 HEATB .1781E-030.0000E+00 0.5580E-01 -.4900E+00
CONNEA2 1A2 2 10.1270E-010.2500E-020.1596E-02A3 1A3 2 10.1270E-010.2500E-020.1596E-02A4 1A4 2 10.1270E-010.2500E-020.1596E-02A5 1A5 2 10.1270E-010.2500E-020.1596E-02A6 1A6 2 10.1270E-010.2500E-020.1596E-02A7 1A7 2 10.1270E-010.2500E-020.1596E-02A8 1A8 2 10.1270E-010.2500E-020.1596E-02A9 1A9 2 10.1270E-010.2500E-020.1596E-02AA 1AA 2 10.1270E-010.2500E-020.1596E-02AB 1AB 2 10.1270E-010.2500E-020.1596E-02AC 1AC 2 10.1270E-010.2500E-020.1596E-02AD 1AD 2 10.1270E-010.2500E-020.1596E-02AE 1AE 2 10.1270E-010.2500E-020.1596E-02AF 1AF 2 10.1270E-010.2500E-020.1596E-02AG 1AG 2 10.1270E-010.2500E-020.1596E-02AH 1AH 2 10.1270E-010.2500E-020.1596E-02AI 1AI 2 10.1270E-010.2500E-020.1596E-02AJ 1AJ 2 10.1270E-010.2500E-020.1596E-02AK 1AK 2 10.1270E-010.2500E-020.1596E-02AL 1AL 2 10.1270E-010.2500E-020.1596E-02AM 1AM 2 10.1270E-010.2500E-020.1596E-02AN 1AN 2 10.1270E-010.2500E-020.1596E-02AO 1AO 2 10.1270E-010.2500E-020.1596E-02AP 1AP 2 10.1270E-010.2500E-020.1596E-02AQ 1AQ 2 10.1270E-010.2500E-020.1596E-02AR 1AR 2 10.1270E-010.2500E-020.1596E-02AS 1AS 2 10.1270E-010.2500E-020.1596E-02AT 1AT 2 10.1270E-010.2500E-020.1596E-02AU 1AU 2 10.1270E-010.2500E-020.1596E-02AV 1AV 2 10.1270E-010.2500E-020.1596E-02AW 1AW 2 10.1270E-010.2500E-020.1596E-02AX 1AX 2 10.1270E-010.2500E-020.1596E-02AY 1AY 2 10.1270E-010.2500E-020.1596E-02AZ 1AZ 2 10.1270E-010.2500E-020.1596E-02B1 1B1 2 10.1270E-010.2500E-020.1596E-02B2 1B2 2 10.1270E-010.2500E-020.1596E-02B3 1B3 2 10.1270E-010.2500E-020.1596E-02B4 1B4 2 10.1270E-010.2500E-020.1596E-02B5 1B5 2 10.1270E-010.2500E-020.1596E-02B6 1B6 2 10.1270E-010.2500E-020.1596E-02B7 1B7 2 10.1270E-010.2500E-020.1596E-02B8 1B8 2 10.1270E-010.2500E-020.1596E-02B9 1B9 2 10.1270E-010.2500E-020.1596E-02BA1 1BA 2 10.1270E-010.2500E-021.5960E-04BA2 1BA 2 10.1270E-010.2500E-021.5960E-04BA3 1BA 2 10.1270E-010.2500E-021.5960E-04BA4 1BA 2 10.1270E-010.2500E-021.5960E-04

107
BA5 1BA 2 10.1270E-010.2500E-021.5960E-04BB 1BB 2 10.1270E-010.2500E-020.1596E-02BC 1BC 2 10.1270E-010.2500E-020.1596E-02BD 1BD 2 10.1270E-010.2500E-020.1596E-02BE 1BE 2 10.1270E-010.2500E-020.1596E-02BF 1BF 2 10.1270E-010.2500E-020.1596E-02A2 2A2 3 10.2500E-020.2540E-010.1910E-02A3 2A3 3 10.2500E-020.2540E-010.1910E-02A4 2A4 3 10.2500E-020.2540E-010.1910E-02A5 2A5 3 10.2500E-020.2540E-010.1910E-02A6 2A6 3 10.2500E-020.2540E-010.1910E-02A7 2A7 3 10.2500E-020.2540E-010.1910E-02A8 2A8 3 10.2500E-020.2540E-010.1910E-02A9 2A9 3 10.2500E-020.2540E-010.1910E-02AA 2AA 3 10.2500E-020.2540E-010.1910E-02AB 2AB 3 10.2500E-020.2540E-010.1910E-02AC 2AC 3 10.2500E-020.2540E-010.1910E-02AD 2AD 3 10.2500E-020.2540E-010.1910E-02AE 2AE 3 10.2500E-020.2540E-010.1910E-02AF 2AF 3 10.2500E-020.2540E-010.1910E-02AG 2AG 3 10.2500E-020.2540E-010.1910E-02AH 2AH 3 10.2500E-020.2540E-010.1910E-02AI 2AI 3 10.2500E-020.2540E-010.1910E-02AJ 2AJ 3 10.2500E-020.2540E-010.1910E-02AK 2AK 3 10.2500E-020.2540E-010.1910E-02AL 2AL 3 10.2500E-020.2540E-010.1910E-02AM 2AM 3 10.2500E-020.2540E-010.1910E-02AN 2AN 3 10.2500E-020.2540E-010.1910E-02AO 2AO 3 10.2500E-020.2540E-010.1910E-02AP 2AP 3 10.2500E-020.2540E-010.1910E-02AQ 2AQ 3 10.2500E-020.2540E-010.1910E-02AR 2AR 3 10.2500E-020.2540E-010.1910E-02AS 2AS 3 10.2500E-020.2540E-010.1910E-02AT 2AT 3 10.2500E-020.2540E-010.1910E-02AU 2AU 3 10.2500E-020.2540E-010.1910E-02AV 2AV 3 10.2500E-020.2540E-010.1910E-02AW 2AW 3 10.2500E-020.2540E-010.1910E-02AX 2AX 3 10.2500E-020.2540E-010.1910E-02AY 2AY 3 10.2500E-020.2540E-010.1910E-02AZ 2AZ 3 10.2500E-020.2540E-010.1910E-02B1 2B1 3 10.2500E-020.2540E-010.1910E-02B2 2B2 3 10.2500E-020.2540E-010.1910E-02B3 2B3 3 10.2500E-020.2540E-010.1910E-02B4 2B4 3 10.2500E-020.2540E-010.1910E-02B5 2B5 3 10.2500E-020.2540E-010.1910E-02B6 2B6 3 10.2500E-020.2540E-010.1910E-02B7 2B7 3 10.2500E-020.2540E-010.1910E-02B8 2B8 3 10.2500E-020.2540E-010.1910E-02B9 2B9 3 10.2500E-020.2540E-010.1910E-02BA 2BA 3 10.2500E-020.2540E-010.9550E-03BB 2BB 3 10.2500E-020.2540E-010.1910E-02BC 2BC 3 10.2500E-020.2540E-010.1910E-02BD 2BD 3 10.2500E-020.2540E-010.1910E-02BE 2BE 3 10.2500E-020.2540E-010.1910E-02BF 2BF 3 10.2500E-020.2540E-010.1910E-02A2 3AMB 1 10.2540E-011.0000E-110.5102E-02A3 3AMB 1 10.2540E-011.0000E-110.5102E-02A4 3AMB 1 10.2540E-011.0000E-110.5102E-02A5 3AMB 1 10.2540E-011.0000E-110.5102E-02A6 3AMB 1 10.2540E-011.0000E-110.5102E-02A7 3AMB 1 10.2540E-011.0000E-110.5102E-02

108
A8 3AMB 1 10.2540E-011.0000E-110.5102E-02A9 3AMB 1 10.2540E-011.0000E-110.5102E-02AA 3AMB 1 10.2540E-011.0000E-110.5102E-02AB 3AMB 1 10.2540E-011.0000E-110.5102E-02AC 3AMB 1 10.2540E-011.0000E-110.5102E-02AD 3AMB 1 10.2540E-011.0000E-110.5102E-02AE 3AMB 1 10.2540E-011.0000E-110.5102E-02AF 3AMB 1 10.2540E-011.0000E-110.5102E-02AG 3AMB 1 10.2540E-011.0000E-110.5102E-02AH 3AMB 1 10.2540E-011.0000E-110.5102E-02AI 3AMB 1 10.2540E-011.0000E-110.5102E-02AJ 3AMB 1 10.2540E-011.0000E-110.5102E-02AK 3AMB 1 10.2540E-011.0000E-110.5102E-02AL 3AMB 1 10.2540E-011.0000E-110.5102E-02AM 3AMB 1 10.2540E-011.0000E-110.5102E-02AN 3AMB 1 10.2540E-011.0000E-110.5102E-02AO 3AMB 1 10.2540E-011.0000E-110.5102E-02AP 3AMB 1 10.2540E-011.0000E-110.5102E-02AQ 3AMB 1 10.2540E-011.0000E-110.5102E-02AR 3AMB 1 10.2540E-011.0000E-110.5102E-02AS 3AMB 1 10.2540E-011.0000E-110.5102E-02AT 3AMB 1 10.2540E-011.0000E-110.5102E-02AU 3AMB 1 10.2540E-011.0000E-110.5102E-02AV 3AMB 1 10.2540E-011.0000E-110.5102E-02AW 3AMB 1 10.2540E-011.0000E-110.5102E-02AX 3AMB 1 10.2540E-011.0000E-110.5102E-02AY 3AMB 1 10.2540E-011.0000E-110.5102E-02AZ 3AMB 1 10.2540E-011.0000E-110.5102E-02B1 3AMB 1 10.2540E-011.0000E-110.5102E-02B2 3AMB 1 10.2540E-011.0000E-110.5102E-02B3 3AMB 1 10.2540E-011.0000E-110.5102E-02B4 3AMB 1 10.2540E-011.0000E-110.5102E-02B5 3AMB 1 10.2540E-011.0000E-110.5102E-02B6 3AMB 1 10.2540E-011.0000E-110.5102E-02B7 3AMB 1 10.2540E-011.0000E-110.5102E-02B8 3AMB 1 10.2540E-011.0000E-110.5102E-02B9 3AMB 1 10.2540E-011.0000E-110.5102E-02BA 3AMB 1 10.2540E-011.0000E-110.2551E-02BB 3AMB 1 10.2540E-011.0000E-110.5102E-02BC 3AMB 1 10.2540E-011.0000E-110.5102E-02BD 3AMB 1 10.2540E-011.0000E-110.5102E-02BE 3AMB 1 10.2540E-011.0000E-110.5102E-02BF 3AMB 1 10.2540E-011.0000E-110.5102E-02BOU 1A2 1 31.0000E-100.5000E-020.2027E-021.A2 1A3 1 30.5000E-020.5000E-020.2027E-021.A3 1A4 1 30.5000E-020.5000E-020.2027E-021.A4 1A5 1 30.5000E-020.5000E-020.2027E-021.A5 1A6 1 30.5000E-020.5000E-020.2027E-021.A6 1A7 1 30.5000E-020.5000E-020.2027E-021.A7 1A8 1 30.5000E-020.5000E-020.2027E-021.A8 1A9 1 30.5000E-020.5000E-020.2027E-021.A9 1AA 1 30.5000E-020.5000E-020.2027E-021.AA 1AB 1 30.5000E-020.5000E-020.2027E-021.AB 1AC 1 30.5000E-020.5000E-020.2027E-021.AC 1AD 1 30.5000E-020.5000E-020.2027E-021.AD 1AE 1 30.5000E-020.5000E-020.2027E-021.AE 1AF 1 30.5000E-020.5000E-020.2027E-021.AF 1AG 1 30.5000E-020.5000E-020.2027E-021.AG 1AH 1 30.5000E-020.5000E-020.2027E-021.AH 1AI 1 30.5000E-020.5000E-020.2027E-021.AI 1AJ 1 30.5000E-020.5000E-020.2027E-021.

109
AJ 1AK 1 30.5000E-020.5000E-020.2027E-021.AK 1AL 1 30.5000E-020.5000E-020.2027E-021.AL 1AM 1 30.5000E-020.5000E-020.2027E-021.AM 1AN 1 30.5000E-020.5000E-020.2027E-021.AN 1AO 1 30.5000E-020.5000E-020.2027E-021.AO 1AP 1 30.5000E-020.5000E-020.2027E-021.AP 1AQ 1 30.5000E-020.5000E-020.2027E-021.AQ 1AR 1 30.5000E-020.5000E-020.2027E-021.AR 1AS 1 30.5000E-020.5000E-020.2027E-021.AS 1AT 1 30.5000E-020.5000E-020.2027E-021.AT 1AU 1 30.5000E-020.5000E-020.2027E-021.AU 1AV 1 30.5000E-020.5000E-020.2027E-021.AV 1AW 1 30.5000E-020.5000E-020.2027E-021.AW 1AX 1 30.5000E-020.5000E-020.2027E-021.AX 1AY 1 30.5000E-020.5000E-020.2027E-021.AY 1AZ 1 30.5000E-020.5000E-020.2027E-021.AZ 1B1 1 30.5000E-020.5000E-020.2027E-021.B1 1B2 1 30.5000E-020.5000E-020.2027E-021.B2 1B3 1 30.5000E-020.5000E-020.2027E-021.B3 1B4 1 30.5000E-020.5000E-020.2027E-021.B4 1B5 1 30.5000E-020.5000E-020.2027E-021.B5 1B6 1 30.5000E-020.5000E-020.2027E-021.B6 1B7 1 30.5000E-020.5000E-020.2027E-021.B7 1B8 1 30.5000E-020.5000E-020.2027E-021.B8 1B9 1 30.5000E-020.5000E-020.2027E-021.B9 1BA1 1 30.5000E-020.5000E-030.2027E-021.BA1 1BA2 1 30.5000E-030.5000E-030.2027E-021.BA2 1BA3 1 30.5000E-030.5000E-030.2027E-021.BA3 1BA4 1 30.5000E-030.5000E-030.2027E-021.BA4 1BA5 1 30.5000E-030.5000E-030.2027E-021.BA5 1BB 1 30.5000E-030.5000E-020.2027E-021.BB 1BC 1 30.5000E-020.5000E-020.2027E-021.BC 1BD 1 30.5000E-020.5000E-020.2027E-021.BD 1BE 1 30.5000E-020.5000E-020.2027E-021.BE 1BF 1 30.5000E-020.5000E-020.2027E-021.BF 1AMB 1 30.5000E-021.0000E-110.2027E-021.BOU 1A2 2 31.0000E-100.5000E-020.8765E-031.A2 2A3 2 30.5000E-020.5000E-020.8765E-031.A3 2A4 2 30.5000E-020.5000E-020.8765E-031.A4 2A5 2 30.5000E-020.5000E-020.8765E-031.A5 2A6 2 30.5000E-020.5000E-020.8765E-031.A6 2A7 2 30.5000E-020.5000E-020.8765E-031.A7 2A8 2 30.5000E-020.5000E-020.8765E-031.A8 2A9 2 30.5000E-020.5000E-020.8765E-031.A9 2AA 2 30.5000E-020.5000E-020.8765E-031.AA 2AB 2 30.5000E-020.5000E-020.8765E-031.AB 2AC 2 30.5000E-020.5000E-020.8765E-031.AC 2AD 2 30.5000E-020.5000E-020.8765E-031.AD 2AE 2 30.5000E-020.5000E-020.8765E-031.AE 2AF 2 30.5000E-020.5000E-020.8765E-031.AF 2AG 2 30.5000E-020.5000E-020.8765E-031.AG 2AH 2 30.5000E-020.5000E-020.8765E-031.AH 2AI 2 30.5000E-020.5000E-020.8765E-031.AI 2AJ 2 30.5000E-020.5000E-020.8765E-031.AJ 2AK 2 30.5000E-020.5000E-020.8765E-031.AK 2AL 2 30.5000E-020.5000E-020.8765E-031.AL 2AM 2 30.5000E-020.5000E-020.8765E-031.AM 2AN 2 30.5000E-020.5000E-020.8765E-031.AN 2AO 2 30.5000E-020.5000E-020.8765E-031.AO 2AP 2 30.5000E-020.5000E-020.8765E-031.AP 2AQ 2 30.5000E-020.5000E-020.8765E-031.
110
AQ 2AR 2 30.5000E-020.5000E-020.8765E-031.AR 2AS 2 30.5000E-020.5000E-020.8765E-031.AS 2AT 2 30.5000E-020.5000E-020.8765E-031.AT 2AU 2 30.5000E-020.5000E-020.8765E-031.AU 2AV 2 30.5000E-020.5000E-020.8765E-031.AV 2AW 2 30.5000E-020.5000E-020.8765E-031.AW 2AX 2 30.5000E-020.5000E-020.8765E-031.AX 2AY 2 30.5000E-020.5000E-020.8765E-031.AY 2AZ 2 30.5000E-020.5000E-020.8765E-031.AZ 2B1 2 30.5000E-020.5000E-020.8765E-031.B1 2B2 2 30.5000E-020.5000E-020.8765E-031.B2 2B3 2 30.5000E-020.5000E-020.8765E-031.B3 2B4 2 30.5000E-020.5000E-020.8765E-031.B4 2B5 2 30.5000E-020.5000E-020.8765E-031.B5 2B6 2 30.5000E-020.5000E-020.8765E-031.B6 2B7 2 30.5000E-020.5000E-020.8765E-031.B7 2B8 2 30.5000E-020.5000E-020.8765E-031.B8 2B9 2 30.5000E-020.5000E-020.8765E-031.B9 2BA 2 30.5000E-020.2500E-020.8765E-031.BA 2BB 2 30.2500E-020.5000E-020.8765E-031.BB 2BC 2 30.5000E-020.5000E-020.8765E-031.BC 2BD 2 30.5000E-020.5000E-020.8765E-031.BD 2BE 2 30.5000E-020.5000E-020.8765E-031.BE 2BF 2 30.5000E-020.5000E-020.8765E-031.BF 2AMB 1 30.5000E-021.0000E-110.8765E-031.BOU 1A2 3 31.0000E-100.5000E-020.1781E-011.A2 3A3 3 30.5000E-020.5000E-020.1781E-011.A3 3A4 3 30.5000E-020.5000E-020.1781E-011.A4 3A5 3 30.5000E-020.5000E-020.1781E-011.A5 3A6 3 30.5000E-020.5000E-020.1781E-011.A6 3A7 3 30.5000E-020.5000E-020.1781E-011.A7 3A8 3 30.5000E-020.5000E-020.1781E-011.A8 3A9 3 30.5000E-020.5000E-020.1781E-011.A9 3AA 3 30.5000E-020.5000E-020.1781E-011.AA 3AB 3 30.5000E-020.5000E-020.1781E-011.AB 3AC 3 30.5000E-020.5000E-020.1781E-011.AC 3AD 3 30.5000E-020.5000E-020.1781E-011.AD 3AE 3 30.5000E-020.5000E-020.1781E-011.AE 3AF 3 30.5000E-020.5000E-020.1781E-011.AF 3AG 3 30.5000E-020.5000E-020.1781E-011.AG 3AH 3 30.5000E-020.5000E-020.1781E-011.AH 3AI 3 30.5000E-020.5000E-020.1781E-011.AI 3AJ 3 30.5000E-020.5000E-020.1781E-011.AJ 3AK 3 30.5000E-020.5000E-020.1781E-011.AK 3AL 3 30.5000E-020.5000E-020.1781E-011.AL 3AM 3 30.5000E-020.5000E-020.1781E-011.AM 3AN 3 30.5000E-020.5000E-020.1781E-011.AN 3AO 3 30.5000E-020.5000E-020.1781E-011.AO 3AP 3 30.5000E-020.5000E-020.1781E-011.AP 3AQ 3 30.5000E-020.5000E-020.1781E-011.AQ 3AR 3 30.5000E-020.5000E-020.1781E-011.AR 3AS 3 30.5000E-020.5000E-020.1781E-011.AS 3AT 3 30.5000E-020.5000E-020.1781E-011.AT 3AU 3 30.5000E-020.5000E-020.1781E-011.AU 3AV 3 30.5000E-020.5000E-020.1781E-011.AV 3AW 3 30.5000E-020.5000E-020.1781E-011.AW 3AX 3 30.5000E-020.5000E-020.1781E-011.AX 3AY 3 30.5000E-020.5000E-020.1781E-011.AY 3AZ 3 30.5000E-020.5000E-020.1781E-011.AZ 3B1 3 30.5000E-020.5000E-020.1781E-011.B1 3B2 3 30.5000E-020.5000E-020.1781E-011.

111
B2 3B3 3 30.5000E-020.5000E-020.1781E-011.B3 3B4 3 30.5000E-020.5000E-020.1781E-011.B4 3B5 3 30.5000E-020.5000E-020.1781E-011.B5 3B6 3 30.5000E-020.5000E-020.1781E-011.B6 3B7 3 30.5000E-020.5000E-020.1781E-011.B7 3B8 3 30.5000E-020.5000E-020.1781E-011.B8 3B9 3 30.5000E-020.5000E-020.1781E-011.B9 3BA 3 30.5000E-020.2500E-020.1781E-011.BA 3BB 3 30.2500E-020.5000E-020.1781E-011.BB 3BC 3 30.5000E-020.5000E-020.1781E-011.BC 3BD 3 30.5000E-020.5000E-020.1781E-011.BD 3BE 3 30.5000E-020.5000E-020.1781E-011.BE 3BF 3 30.5000E-020.5000E-020.1781E-011.BF 3AMB 1 30.5000E-021.0000E-110.1781E-011.
TIMES----1----*----2----*----3----*----4----*----5----*----6----*----7----*----8 2 4.320E+05 6.048E+05INDOM----1----*----2----*----3----*----4----*----5----*----6----*----7----*----8BOUND 1.1861E5 24.AMBIE 1.0065E5 24.
GENER----1----*----2----*----3----*----4----*----5----*----6----*----7----*----8BA1 1HTR 1 9 HEAT 0.0000000E+00 0.2988000E+04 0.8701200E+05 0.1800000E+06 0.2688120E+06 0.3528000E+06 0.4403880E+06 0.5256600E+06 0.6134400E+06 0.1728000E-03 0.2354920E+00 0.5151800E+00 0.9724400E+00 0.1237280E+01 0.1509900E+01 0.1789780E+01 0.2083600E+01 0.2083600E+01BA2 1HTR 2 9 HEAT 0.0000000E+00 0.2988000E+04 0.8701200E+05 0.1800000E+06 0.2688120E+06 0.3528000E+06 0.4403880E+06 0.5256600E+06 0.6134400E+06 0.1728000E-03 0.2354920E+00 0.5151800E+00 0.9724400E+00 0.1237280E+01 0.1509900E+01 0.1789780E+01 0.2083600E+01 0.2083600E+01BA3 1HTR 3 9 HEAT 0.0000000E+00 0.2988000E+04 0.8701200E+05 0.1800000E+06 0.2688120E+06 0.3528000E+06 0.4403880E+06 0.5256600E+06 0.6134400E+06 0.1728000E-03 0.2354920E+00 0.5151800E+00 0.9724400E+00 0.1237280E+01 0.1509900E+01 0.1789780E+01 0.2083600E+01 0.2083600E+01BA4 1HTR 4 9 HEAT 0.0000000E+00 0.2988000E+04 0.8701200E+05 0.1800000E+06 0.2688120E+06 0.3528000E+06 0.4403880E+06 0.5256600E+06 0.6134400E+06 0.1728000E-03 0.2354920E+00 0.5151800E+00 0.9724400E+00 0.1237280E+01 0.1509900E+01 0.1789780E+01 0.2083600E+01 0.2083600E+01BA5 1HTR 5 9 HEAT 0.0000000E+00 0.2988000E+04 0.8701200E+05 0.1800000E+06 0.2688120E+06 0.3528000E+06 0.4403880E+06 0.5256600E+06 0.6134400E+06 0.1728000E-03 0.2354920E+00 0.5151800E+00 0.9724400E+00

112
0.1237280E+01 0.1509900E+01 0.1789780E+01 0.2083600E+01 0.2083600E+01
ENDCY----1----*----2----*----3----*----4----*----5----*----6----*----7----*----8

113
A.1.2 ITOUGH2 input file.
> PARAMETERS >> heat CONDUCTIVITY >>> MATERIAL: BEREA >>>> VALUE >>>> RANGE: 3.0 6.0 >>>> DEVIATION: 0.2 >>>> STEP :0.05 <<<< >>> MATERIAL: HEATB >>>> VALUE >>>> RANGE: 0.001 2.0 >>>> DEVIATION: 0.05 <<<< >>> MATERIAL: INSUL >>>> VALUE >>>> RANGE: 0.01 2.0 >>>> DEVIATION: 0.05 <<<< <<< >> RATE >>> SOURCE: HTR_1 +4 >>>> ANNOTATION : H2 >>>> PARAMETER No.: 2 >>>> DEVIATION : 0.1 >>>> VALUE >>>> STEP : 0.1 <<<< >>> SOURCE: HTR_1 +4 >>>> ANNOTATION : H3 >>>> PARAMETER No.: 3 >>>> DEVIATION : 0.1 >>>> VALUE >>>> STEP : 0.1 <<<< >>> SOURCE: HTR_1 +4 >>>> ANNOTATION : H4 >>>> PARAMETER No.: 4 >>>> DEVIATION : 0.1 >>>> VALUE >>>> STEP : 0.1 <<<< >>> SOURCE: HTR_1 +4 >>>> ANNOTATION : H5 >>>> PARAMETER No.: 5 >>>> DEVIATION : 0.1 >>>> VALUE >>>> STEP : 0.1 <<<< >>> SOURCE: HTR_1 +4 >>>> ANNOTATION : H6 >>>> PARAMETER No.: 6 >>>> DEVIATION : 0.1 >>>> VALUE >>>> STEP : 0.1 <<<< <<< <<> OBSERVATIONS

114
>> TIMES: 30 EQUALLY spaced in [DAYS] between 0.140 4.900 >> TIMES: 5 in SECONDS at heat changes .298800E+04 .870120E+05 .180000E+06 .268812E+06 .352800E+06
>> TEMPERATURE >>> ELEMENT: B9__2 >>>> ANNOTATION: T1 >>>> COLUMNS: 1 3 >>>> PICK : 10 >>>> DATA in DAYS on FILE: temp.dat >>>> DEVIATION: 1.0 degree C <<<< >>> ELEMENT: B5__2 >>>> ANNOTATION: T2 >>>> COLUMNS: 1 4 >>>> PICK : 10 >>>> DATA in DAYS on FILE: temp.dat >>>> DEVIATION: 1.0 deg C <<<< >>> ELEMENT: B3__2 >>>> ANNOTATION: T3 >>>> COLUMNS: 1 5 >>>> PICK : 10 >>>> DATA in DAYS on FILE: temp.dat >>>> DEVIATION: 1.0 deg C <<<< >>> ELEMENT: AZ__2 >>>> ANNOTATION: T4 >>>> COLUMNS: 1 6 >>>> PICK : 10 >>>> DATA in DAYS on FILE: temp.dat >>>> DEVIATION: 1.0 deg C <<<< >>> ELEMENT: AV__2 >>>> ANNOTATION: T5 >>>> COLUMNS: 1 7 >>>> PICK : 10 >>>> DATA in DAYS on FILE: temp.dat >>>> DEVIATION: 1.0 deg C <<<< >>> ELEMENT: AT__2 >>>> ANNOTATION: T6 >>>> COLUMNS: 1 8 >>>> PICK : 10 >>>> DATA in DAYS on FILE: temp.dat >>>> DEVIATION: 1.0 deg C <<<< >>> ELEMENT: AQ__2 >>>> ANNOTATION: T7 >>>> COLUMNS: 1 9 >>>> PICK : 10 >>>> DATA in DAYS on FILE: temp.dat >>>> DEVIATION: 1.0 deg C <<<<
>>> ELEMENT: AM__2

115
>>>> ANNOTATION: T8 >>>> COLUMNS: 1 10 >>>> PICK : 10 >>>> DATA in DAYS on FILE: temp.dat >>>> DEVIATION: 1.0 deg C <<<< >>> ELEMENT: AH__2 >>>> ANNOTATION: T9 >>>> COLUMNS: 1 11 >>>> PICK : 10 >>>> DATA in DAYS on FILE: temp.dat >>>> DEVIATION: 1.0 deg C <<<< >>> ELEMENT: AB__2 >>>> ANNOTATION: T10 >>>> COLUMNS: 1 12 >>>> PICK : 10 >>>> DATA in DAYS on FILE: temp.dat >>>> DEVIATION: 1.0 deg C <<<< >>> ELEMENT: A4__2 >>>> ANNOTATION: T11 >>>> COLUMNS: 1 13 >>>> PICK : 10 >>>> DATA in DAYS on FILE: temp.dat >>>> DEVIATION: 1.0 deg C <<<< <<<
>> HEAT FLOW >>> CONNECTION: B3__2 B3__3 >>>> ANNOTATION: HF1 >>>> FACTOR: -1.910E-3 [W/m^2 - W] >>>> COLUMNS: 1 3 >>>> PICK : 10 >>>> DATA in HOURS on FILE: hflux.dat >>>> DEVIATION: 10.0 W/m^2 <<<< >>> CONNECTION: B5__2 B5__3 >>>> ANNOTATION: HF2 >>>> FACTOR: -1.910E-3 [W/m^2 - W] >>>> COLUMNS: 1 4 >>>> PICK : 10 >>>> DATA in HOURS on FILE: hflux.dat >>>> DEVIATION: 10.0 W/m^2 <<<< >>> CONNECTION: B3__2 B3__3 >>>> ANNOTATION: HF3 >>>> FACTOR: -1.910E-3 [W/m^2 - W] >>>> COLUMNS: 1 5 >>>> PICK : 10 >>>> DATA in HOURS on FILE: hflux.dat >>>> DEVIATION: 10.0 W/m^2 <<<< >>> CONNECTION: AZ__2 AZ__3 >>>> ANNOTATION: HF4 >>>> FACTOR: -1.910E-3 [W/m^2 - W] >>>> COLUMNS: 1 6 >>>> PICK : 10 >>>> DATA in HOURS on FILE: hflux.dat >>>> DEVIATION: 10.0 W/m^2
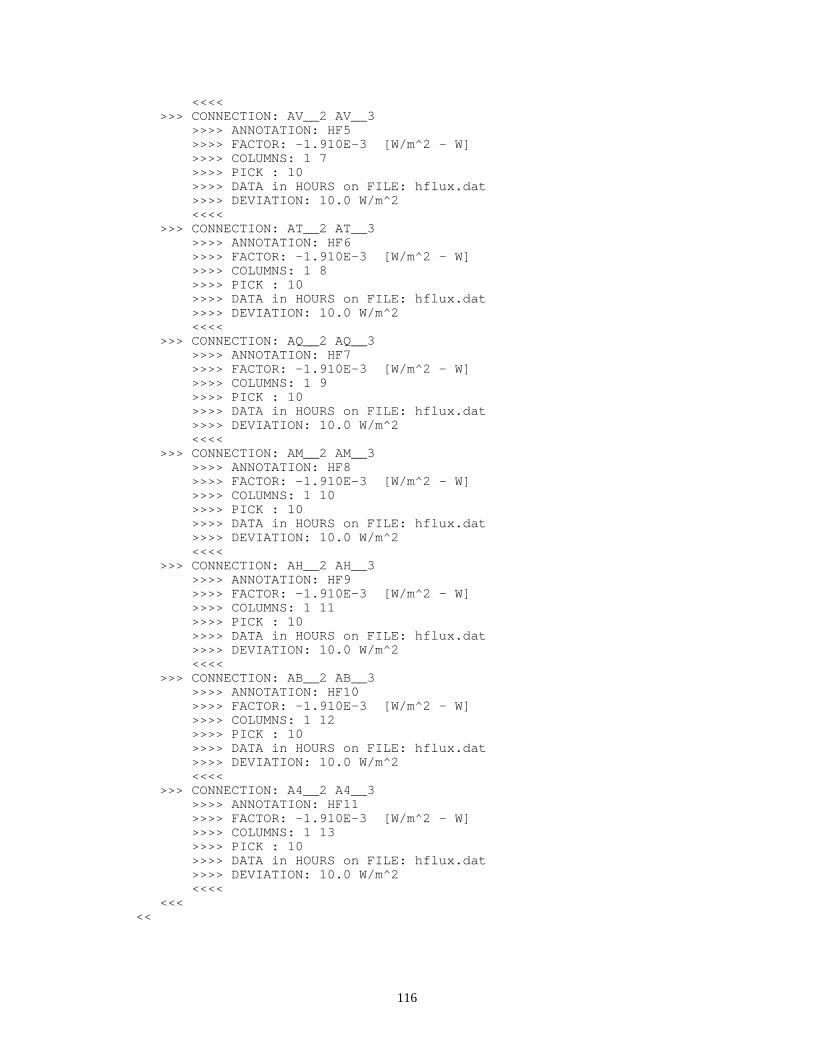
116
<<<< >>> CONNECTION: AV__2 AV__3 >>>> ANNOTATION: HF5 >>>> FACTOR: -1.910E-3 [W/m^2 - W] >>>> COLUMNS: 1 7 >>>> PICK : 10 >>>> DATA in HOURS on FILE: hflux.dat >>>> DEVIATION: 10.0 W/m^2 <<<< >>> CONNECTION: AT__2 AT__3 >>>> ANNOTATION: HF6 >>>> FACTOR: -1.910E-3 [W/m^2 - W] >>>> COLUMNS: 1 8 >>>> PICK : 10 >>>> DATA in HOURS on FILE: hflux.dat >>>> DEVIATION: 10.0 W/m^2 <<<< >>> CONNECTION: AQ__2 AQ__3 >>>> ANNOTATION: HF7 >>>> FACTOR: -1.910E-3 [W/m^2 - W] >>>> COLUMNS: 1 9 >>>> PICK : 10 >>>> DATA in HOURS on FILE: hflux.dat >>>> DEVIATION: 10.0 W/m^2 <<<< >>> CONNECTION: AM__2 AM__3 >>>> ANNOTATION: HF8 >>>> FACTOR: -1.910E-3 [W/m^2 - W] >>>> COLUMNS: 1 10 >>>> PICK : 10 >>>> DATA in HOURS on FILE: hflux.dat >>>> DEVIATION: 10.0 W/m^2 <<<< >>> CONNECTION: AH__2 AH__3 >>>> ANNOTATION: HF9 >>>> FACTOR: -1.910E-3 [W/m^2 - W] >>>> COLUMNS: 1 11 >>>> PICK : 10 >>>> DATA in HOURS on FILE: hflux.dat >>>> DEVIATION: 10.0 W/m^2 <<<< >>> CONNECTION: AB__2 AB__3 >>>> ANNOTATION: HF10 >>>> FACTOR: -1.910E-3 [W/m^2 - W] >>>> COLUMNS: 1 12 >>>> PICK : 10 >>>> DATA in HOURS on FILE: hflux.dat >>>> DEVIATION: 10.0 W/m^2 <<<< >>> CONNECTION: A4__2 A4__3 >>>> ANNOTATION: HF11 >>>> FACTOR: -1.910E-3 [W/m^2 - W] >>>> COLUMNS: 1 13 >>>> PICK : 10 >>>> DATA in HOURS on FILE: hflux.dat >>>> DEVIATION: 10.0 W/m^2 <<<< <<< <<

117
> COMPUTATION >> STOPPING criteria >>> IGNORE WARNINGS >>> max. no. of ITERATIONS: 50 >>> IQIT=3: 50 >>> CONSECUTIVE: 100 >>> LEVENBERG: 0.01 >>> STEP : 0.5 <<< >> JACOBIAN >>> FORWARD: 9 >>> PERTURB: 0.01 <<< >> OUTPUT >>> PLOTFILE: COLUMNS >>> DAYS >>> generate file with CHARACTERISTIC curves <<< <<<
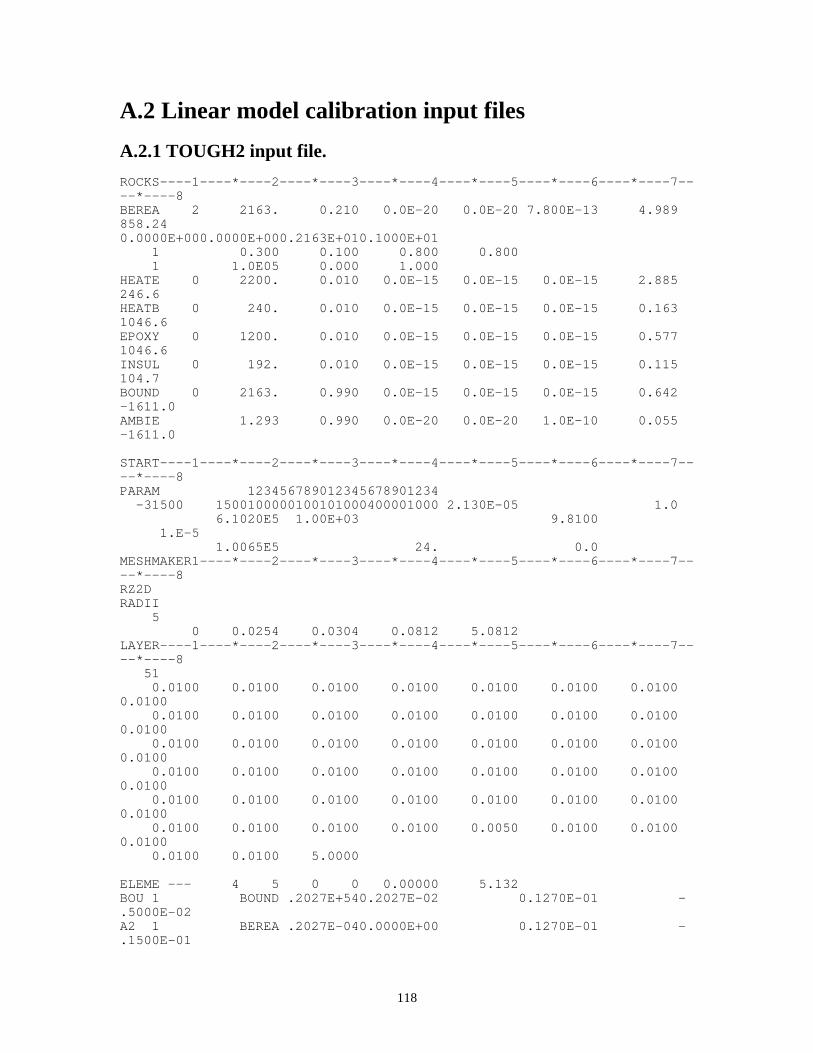
118
A.2 Linear model calibration input files
A.2.1 TOUGH2 input file.
ROCKS----1----*----2----*----3----*----4----*----5----*----6----*----7----*----8BEREA 2 2163. 0.210 0.0E-20 0.0E-20 7.800E-13 4.989858.240.0000E+000.0000E+000.2163E+010.1000E+01 1 0.300 0.100 0.800 0.800 1 1.0E05 0.000 1.000HEATE 0 2200. 0.010 0.0E-15 0.0E-15 0.0E-15 2.885246.6HEATB 0 240. 0.010 0.0E-15 0.0E-15 0.0E-15 0.1631046.6EPOXY 0 1200. 0.010 0.0E-15 0.0E-15 0.0E-15 0.5771046.6INSUL 0 192. 0.010 0.0E-15 0.0E-15 0.0E-15 0.115104.7BOUND 0 2163. 0.990 0.0E-15 0.0E-15 0.0E-15 0.642-1611.0AMBIE 1.293 0.990 0.0E-20 0.0E-20 1.0E-10 0.055-1611.0
START----1----*----2----*----3----*----4----*----5----*----6----*----7----*----8PARAM 123456789012345678901234 -31500 1500100000100101000400001000 2.130E-05 1.0 6.1020E5 1.00E+03 9.8100 1.E-5 1.0065E5 24. 0.0MESHMAKER1----*----2----*----3----*----4----*----5----*----6----*----7----*----8RZ2DRADII 5 0 0.0254 0.0304 0.0812 5.0812LAYER----1----*----2----*----3----*----4----*----5----*----6----*----7----*----8 51 0.0100 0.0100 0.0100 0.0100 0.0100 0.0100 0.01000.0100 0.0100 0.0100 0.0100 0.0100 0.0100 0.0100 0.01000.0100 0.0100 0.0100 0.0100 0.0100 0.0100 0.0100 0.01000.0100 0.0100 0.0100 0.0100 0.0100 0.0100 0.0100 0.01000.0100 0.0100 0.0100 0.0100 0.0100 0.0100 0.0100 0.01000.0100 0.0100 0.0100 0.0100 0.0100 0.0050 0.0100 0.01000.0100 0.0100 0.0100 5.0000
ELEME --- 4 5 0 0 0.00000 5.132BOU 1 BOUND .2027E+540.2027E-02 0.1270E-01 -.5000E-02A2 1 BEREA .2027E-040.0000E+00 0.1270E-01 -.1500E-01
119
A3 1 BEREA .2027E-040.0000E+00 0.1270E-01 -.2500E-01A4 1 BEREA .2027E-040.0000E+00 0.1270E-01 -.3500E-01A5 1 BEREA .2027E-040.0000E+00 0.1270E-01 -.4500E-01A6 1 BEREA .2027E-040.0000E+00 0.1270E-01 -.5500E-01A7 1 BEREA .2027E-040.0000E+00 0.1270E-01 -.6500E-01A8 1 BEREA .2027E-040.0000E+00 0.1270E-01 -.7500E-01A9 1 BEREA .2027E-040.0000E+00 0.1270E-01 -.8500E-01AA 1 BEREA .2027E-040.0000E+00 0.1270E-01 -.9500E-01AB 1 BEREA .2027E-040.0000E+00 0.1270E-01 -.1050E+00AC 1 BEREA .2027E-040.0000E+00 0.1270E-01 -.1150E+00AD 1 BEREA .2027E-040.0000E+00 0.1270E-01 -.1250E+00AE 1 BEREA .2027E-040.0000E+00 0.1270E-01 -.1350E+00AF 1 BEREA .2027E-040.0000E+00 0.1270E-01 -.1450E+00AG 1 BEREA .2027E-040.0000E+00 0.1270E-01 -.1550E+00AH 1 BEREA .2027E-040.0000E+00 0.1270E-01 -.1650E+00AI 1 BEREA .2027E-040.0000E+00 0.1270E-01 -.1750E+00AJ 1 BEREA .2027E-040.0000E+00 0.1270E-01 -.1850E+00AK 1 BEREA .2027E-040.0000E+00 0.1270E-01 -.1950E+00AL 1 BEREA .2027E-040.0000E+00 0.1270E-01 -.2050E+00AM 1 BEREA .2027E-040.0000E+00 0.1270E-01 -.2150E+00AN 1 BEREA .2027E-040.0000E+00 0.1270E-01 -.2250E+00AO 1 BEREA .2027E-040.0000E+00 0.1270E-01 -.2350E+00AP 1 BEREA .2027E-040.0000E+00 0.1270E-01 -.2450E+00AQ 1 BEREA .2027E-040.0000E+00 0.1270E-01 -.2550E+00AR 1 BEREA .2027E-040.0000E+00 0.1270E-01 -.2650E+00AS 1 BEREA .2027E-040.0000E+00 0.1270E-01 -.2750E+00AT 1 BEREA .2027E-040.0000E+00 0.1270E-01 -.2850E+00AU 1 BEREA .2027E-040.0000E+00 0.1270E-01 -.2950E+00AV 1 BEREA .2027E-040.0000E+00 0.1270E-01 -.3050E+00AW 1 BEREA .2027E-040.0000E+00 0.1270E-01 -.3150E+00

120
AX 1 BEREA .2027E-040.0000E+00 0.1270E-01 -.3250E+00AY 1 BEREA .2027E-040.0000E+00 0.1270E-01 -.3350E+00AZ 1 BEREA .2027E-040.0000E+00 0.1270E-01 -.3450E+00B1 1 BEREA .2027E-040.0000E+00 0.1270E-01 -.3550E+00B2 1 BEREA .2027E-040.0000E+00 0.1270E-01 -.3650E+00B3 1 BEREA .2027E-040.0000E+00 0.1270E-01 -.3750E+00B4 1 BEREA .2027E-040.0000E+00 0.1270E-01 -.3850E+00B5 1 BEREA .2027E-040.0000E+00 0.1270E-01 -.3950E+00B6 1 BEREA .2027E-040.0000E+00 0.1270E-01 -.4050E+00B7 1 BEREA .2027E-040.0000E+00 0.1270E-01 -.4150E+00B8 1 BEREA .2027E-040.0000E+00 0.1270E-01 -.4250E+00B9 1 BEREA .2027E-040.0000E+00 0.1270E-01 -.4350E+00BA1 1 HEATE2.0260E-060.0000E+00 0.1270E-01 -.4425E+00BA2 1 HEATE2.0260E-060.0000E+00 0.1270E-01 -.4425E+00BA3 1 HEATE2.0260E-060.0000E+00 0.1270E-01 -.4425E+00BA4 1 HEATE2.0260E-060.0000E+00 0.1270E-01 -.4425E+00BA5 1 HEATE2.0260E-060.0000E+00 0.1270E-01 -.4425E+00BB 1 HEATB .2027E-040.0000E+00 0.1270E-01 -.4500E+00BC 1 HEATB .2027E-040.0000E+00 0.1270E-01 -.4600E+00BD 1 HEATB .2027E-040.0000E+00 0.1270E-01 -.4700E+00BE 1 HEATB .2027E-040.0000E+00 0.1270E-01 -.4800E+00BF 1 HEATB .2027E-040.0000E+00 0.1270E-01 -.4900E+00AMB 1 AMBIE .1013E+540.2027E-02 0.1270E-01 -.2995E+01A2 2 EPOXY .8765E-050.0000E+00 0.2790E-01 -.1500E-01A3 2 EPOXY .8765E-050.0000E+00 0.2790E-01 -.2500E-01A4 2 EPOXY .8765E-050.0000E+00 0.2790E-01 -.3500E-01A5 2 EPOXY .8765E-050.0000E+00 0.2790E-01 -.4500E-01A6 2 EPOXY .8765E-050.0000E+00 0.2790E-01 -.5500E-01A7 2 EPOXY .8765E-050.0000E+00 0.2790E-01 -.6500E-01A8 2 EPOXY .8765E-050.0000E+00 0.2790E-01 -.7500E-01

121
A9 2 EPOXY .8765E-050.0000E+00 0.2790E-01 -.8500E-01AA 2 EPOXY .8765E-050.0000E+00 0.2790E-01 -.9500E-01AB 2 EPOXY .8765E-050.0000E+00 0.2790E-01 -.1050E+00AC 2 EPOXY .8765E-050.0000E+00 0.2790E-01 -.1150E+00AD 2 EPOXY .8765E-050.0000E+00 0.2790E-01 -.1250E+00AE 2 EPOXY .8765E-050.0000E+00 0.2790E-01 -.1350E+00AF 2 EPOXY .8765E-050.0000E+00 0.2790E-01 -.1450E+00AG 2 EPOXY .8765E-050.0000E+00 0.2790E-01 -.1550E+00AH 2 EPOXY .8765E-050.0000E+00 0.2790E-01 -.1650E+00AI 2 EPOXY .8765E-050.0000E+00 0.2790E-01 -.1750E+00AJ 2 EPOXY .8765E-050.0000E+00 0.2790E-01 -.1850E+00AK 2 EPOXY .8765E-050.0000E+00 0.2790E-01 -.1950E+00AL 2 EPOXY .8765E-050.0000E+00 0.2790E-01 -.2050E+00AM 2 EPOXY .8765E-050.0000E+00 0.2790E-01 -.2150E+00AN 2 EPOXY .8765E-050.0000E+00 0.2790E-01 -.2250E+00AO 2 EPOXY .8765E-050.0000E+00 0.2790E-01 -.2350E+00AP 2 EPOXY .8765E-050.0000E+00 0.2790E-01 -.2450E+00AQ 2 EPOXY .8765E-050.0000E+00 0.2790E-01 -.2550E+00AR 2 EPOXY .8765E-050.0000E+00 0.2790E-01 -.2650E+00AS 2 EPOXY .8765E-050.0000E+00 0.2790E-01 -.2750E+00AT 2 EPOXY .8765E-050.0000E+00 0.2790E-01 -.2850E+00AU 2 EPOXY .8765E-050.0000E+00 0.2790E-01 -.2950E+00AV 2 EPOXY .8765E-050.0000E+00 0.2790E-01 -.3050E+00AW 2 EPOXY .8765E-050.0000E+00 0.2790E-01 -.3150E+00AX 2 EPOXY .8765E-050.0000E+00 0.2790E-01 -.3250E+00AY 2 EPOXY .8765E-050.0000E+00 0.2790E-01 -.3350E+00AZ 2 EPOXY .8765E-050.0000E+00 0.2790E-01 -.3450E+00B1 2 EPOXY .8765E-050.0000E+00 0.2790E-01 -.3550E+00B2 2 EPOXY .8765E-050.0000E+00 0.2790E-01 -.3650E+00B3 2 EPOXY .8765E-050.0000E+00 0.2790E-01 -.3750E+00

122
B4 2 EPOXY .8765E-050.0000E+00 0.2790E-01 -.3850E+00B5 2 EPOXY .8765E-050.0000E+00 0.2790E-01 -.3950E+00B6 2 EPOXY .8765E-050.0000E+00 0.2790E-01 -.4050E+00B7 2 EPOXY .8765E-050.0000E+00 0.2790E-01 -.4150E+00B8 2 EPOXY .8765E-050.0000E+00 0.2790E-01 -.4250E+00B9 2 EPOXY .8765E-050.0000E+00 0.2790E-01 -.4350E+00BA 2 EPOXY .4383E-050.0000E+00 0.2790E-01 -.4425E+00BB 2 HEATB .8765E-050.0000E+00 0.2790E-01 -.4500E+00BC 2 HEATB .8765E-050.0000E+00 0.2790E-01 -.4600E+00BD 2 HEATB .8765E-050.0000E+00 0.2790E-01 -.4700E+00BE 2 HEATB .8765E-050.0000E+00 0.2790E-01 -.4800E+00BF 2 HEATB .8765E-050.0000E+00 0.2790E-01 -.4900E+00A2 3 INSUL .1781E-000.0000E+00 0.5580E-01 -.1500E-01A3 3 INSUL .1781E-030.0000E+00 0.5580E-01 -.2500E-01A4 3 INSUL .1781E-030.0000E+00 0.5580E-01 -.3500E-01A5 3 INSUL .1781E-030.0000E+00 0.5580E-01 -.4500E-01A6 3 INSUL .1781E-030.0000E+00 0.5580E-01 -.5500E-01A7 3 INSUL .1781E-030.0000E+00 0.5580E-01 -.6500E-01A8 3 INSUL .1781E-030.0000E+00 0.5580E-01 -.7500E-01A9 3 INSUL .1781E-030.0000E+00 0.5580E-01 -.8500E-01AA 3 INSUL .1781E-030.0000E+00 0.5580E-01 -.9500E-01AB 3 INSUL .1781E-030.0000E+00 0.5580E-01 -.1050E+00AC 3 INSUL .1781E-030.0000E+00 0.5580E-01 -.1150E+00AD 3 INSUL .1781E-030.0000E+00 0.5580E-01 -.1250E+00AE 3 INSUL .1781E-030.0000E+00 0.5580E-01 -.1350E+00AF 3 INSUL .1781E-030.0000E+00 0.5580E-01 -.1450E+00AG 3 INSUL .1781E-030.0000E+00 0.5580E-01 -.1550E+00AH 3 INSUL .1781E-030.0000E+00 0.5580E-01 -.1650E+00AI 3 INSUL .1781E-030.0000E+00 0.5580E-01 -.1750E+00AJ 3 INSUL .1781E-030.0000E+00 0.5580E-01 -.1850E+00

123
AK 3 INSUL .1781E-030.0000E+00 0.5580E-01 -.1950E+00AL 3 INSUL .1781E-030.0000E+00 0.5580E-01 -.2050E+00AM 3 INSUL .1781E-030.0000E+00 0.5580E-01 -.2150E+00AN 3 INSUL .1781E-030.0000E+00 0.5580E-01 -.2250E+00AO 3 INSUL .1781E-030.0000E+00 0.5580E-01 -.2350E+00AP 3 INSUL .1781E-030.0000E+00 0.5580E-01 -.2450E+00AQ 3 INSUL .1781E-030.0000E+00 0.5580E-01 -.2550E+00AR 3 INSUL .1781E-030.0000E+00 0.5580E-01 -.2650E+00AS 3 INSUL .1781E-030.0000E+00 0.5580E-01 -.2750E+00AT 3 INSUL .1781E-030.0000E+00 0.5580E-01 -.2850E+00AU 3 INSUL .1781E-030.0000E+00 0.5580E-01 -.2950E+00AV 3 INSUL .1781E-030.0000E+00 0.5580E-01 -.3050E+00AW 3 INSUL .1781E-030.0000E+00 0.5580E-01 -.3150E+00AX 3 INSUL .1781E-030.0000E+00 0.5580E-01 -.3250E+00AY 3 INSUL .1781E-030.0000E+00 0.5580E-01 -.3350E+00AZ 3 INSUL .1781E-030.0000E+00 0.5580E-01 -.3450E+00B1 3 INSUL .1781E-030.0000E+00 0.5580E-01 -.3550E+00B2 3 INSUL .1781E-030.0000E+00 0.5580E-01 -.3650E+00B3 3 INSUL .1781E-030.0000E+00 0.5580E-01 -.3750E+00B4 3 INSUL .1781E-030.0000E+00 0.5580E-01 -.3850E+00B5 3 INSUL .1781E-030.0000E+00 0.5580E-01 -.3950E+00B6 3 INSUL .1781E-030.0000E+00 0.5580E-01 -.4050E+00B7 3 INSUL .1781E-030.0000E+00 0.5580E-01 -.4150E+00B8 3 INSUL .1781E-030.0000E+00 0.5580E-01 -.4250E+00B9 3 INSUL .1781E-030.0000E+00 0.5580E-01 -.4350E+00BA 3 INSUL .8905E-040.0000E+00 0.5580E-01 -.4425E+00BB 3 HEATB .1781E-030.0000E+00 0.5580E-01 -.4500E+00BC 3 HEATB .1781E-030.0000E+00 0.5580E-01 -.4600E+00BD 3 HEATB .1781E-030.0000E+00 0.5580E-01 -.4700E+00BE 3 HEATB .1781E-030.0000E+00 0.5580E-01 -.4800E+00
124
BF 3 HEATB .1781E-030.0000E+00 0.5580E-01 -.4900E+00
CONNEA2 1A2 2 10.1270E-010.2500E-020.1596E-02A3 1A3 2 10.1270E-010.2500E-020.1596E-02A4 1A4 2 10.1270E-010.2500E-020.1596E-02A5 1A5 2 10.1270E-010.2500E-020.1596E-02A6 1A6 2 10.1270E-010.2500E-020.1596E-02A7 1A7 2 10.1270E-010.2500E-020.1596E-02A8 1A8 2 10.1270E-010.2500E-020.1596E-02A9 1A9 2 10.1270E-010.2500E-020.1596E-02AA 1AA 2 10.1270E-010.2500E-020.1596E-02AB 1AB 2 10.1270E-010.2500E-020.1596E-02AC 1AC 2 10.1270E-010.2500E-020.1596E-02AD 1AD 2 10.1270E-010.2500E-020.1596E-02AE 1AE 2 10.1270E-010.2500E-020.1596E-02AF 1AF 2 10.1270E-010.2500E-020.1596E-02AG 1AG 2 10.1270E-010.2500E-020.1596E-02AH 1AH 2 10.1270E-010.2500E-020.1596E-02AI 1AI 2 10.1270E-010.2500E-020.1596E-02AJ 1AJ 2 10.1270E-010.2500E-020.1596E-02AK 1AK 2 10.1270E-010.2500E-020.1596E-02AL 1AL 2 10.1270E-010.2500E-020.1596E-02AM 1AM 2 10.1270E-010.2500E-020.1596E-02AN 1AN 2 10.1270E-010.2500E-020.1596E-02AO 1AO 2 10.1270E-010.2500E-020.1596E-02AP 1AP 2 10.1270E-010.2500E-020.1596E-02AQ 1AQ 2 10.1270E-010.2500E-020.1596E-02AR 1AR 2 10.1270E-010.2500E-020.1596E-02AS 1AS 2 10.1270E-010.2500E-020.1596E-02AT 1AT 2 10.1270E-010.2500E-020.1596E-02AU 1AU 2 10.1270E-010.2500E-020.1596E-02AV 1AV 2 10.1270E-010.2500E-020.1596E-02AW 1AW 2 10.1270E-010.2500E-020.1596E-02AX 1AX 2 10.1270E-010.2500E-020.1596E-02AY 1AY 2 10.1270E-010.2500E-020.1596E-02AZ 1AZ 2 10.1270E-010.2500E-020.1596E-02B1 1B1 2 10.1270E-010.2500E-020.1596E-02B2 1B2 2 10.1270E-010.2500E-020.1596E-02B3 1B3 2 10.1270E-010.2500E-020.1596E-02B4 1B4 2 10.1270E-010.2500E-020.1596E-02B5 1B5 2 10.1270E-010.2500E-020.1596E-02B6 1B6 2 10.1270E-010.2500E-020.1596E-02B7 1B7 2 10.1270E-010.2500E-020.1596E-02B8 1B8 2 10.1270E-010.2500E-020.1596E-02B9 1B9 2 10.1270E-010.2500E-020.1596E-02BA1 1BA 2 10.1270E-010.2500E-021.5960E-04BA2 1BA 2 10.1270E-010.2500E-021.5960E-04BA3 1BA 2 10.1270E-010.2500E-021.5960E-04BA4 1BA 2 10.1270E-010.2500E-021.5960E-04BA5 1BA 2 10.1270E-010.2500E-021.5960E-04BB 1BB 2 10.1270E-010.2500E-020.1596E-02BC 1BC 2 10.1270E-010.2500E-020.1596E-02BD 1BD 2 10.1270E-010.2500E-020.1596E-02BE 1BE 2 10.1270E-010.2500E-020.1596E-02BF 1BF 2 10.1270E-010.2500E-020.1596E-02A2 2A2 3 10.2500E-020.2540E-010.1910E-02A3 2A3 3 10.2500E-020.2540E-010.1910E-02A4 2A4 3 10.2500E-020.2540E-010.1910E-02A5 2A5 3 10.2500E-020.2540E-010.1910E-02

125
A6 2A6 3 10.2500E-020.2540E-010.1910E-02A7 2A7 3 10.2500E-020.2540E-010.1910E-02A8 2A8 3 10.2500E-020.2540E-010.1910E-02A9 2A9 3 10.2500E-020.2540E-010.1910E-02AA 2AA 3 10.2500E-020.2540E-010.1910E-02AB 2AB 3 10.2500E-020.2540E-010.1910E-02AC 2AC 3 10.2500E-020.2540E-010.1910E-02AD 2AD 3 10.2500E-020.2540E-010.1910E-02AE 2AE 3 10.2500E-020.2540E-010.1910E-02AF 2AF 3 10.2500E-020.2540E-010.1910E-02AG 2AG 3 10.2500E-020.2540E-010.1910E-02AH 2AH 3 10.2500E-020.2540E-010.1910E-02AI 2AI 3 10.2500E-020.2540E-010.1910E-02AJ 2AJ 3 10.2500E-020.2540E-010.1910E-02AK 2AK 3 10.2500E-020.2540E-010.1910E-02AL 2AL 3 10.2500E-020.2540E-010.1910E-02AM 2AM 3 10.2500E-020.2540E-010.1910E-02AN 2AN 3 10.2500E-020.2540E-010.1910E-02AO 2AO 3 10.2500E-020.2540E-010.1910E-02AP 2AP 3 10.2500E-020.2540E-010.1910E-02AQ 2AQ 3 10.2500E-020.2540E-010.1910E-02AR 2AR 3 10.2500E-020.2540E-010.1910E-02AS 2AS 3 10.2500E-020.2540E-010.1910E-02AT 2AT 3 10.2500E-020.2540E-010.1910E-02AU 2AU 3 10.2500E-020.2540E-010.1910E-02AV 2AV 3 10.2500E-020.2540E-010.1910E-02AW 2AW 3 10.2500E-020.2540E-010.1910E-02AX 2AX 3 10.2500E-020.2540E-010.1910E-02AY 2AY 3 10.2500E-020.2540E-010.1910E-02AZ 2AZ 3 10.2500E-020.2540E-010.1910E-02B1 2B1 3 10.2500E-020.2540E-010.1910E-02B2 2B2 3 10.2500E-020.2540E-010.1910E-02B3 2B3 3 10.2500E-020.2540E-010.1910E-02B4 2B4 3 10.2500E-020.2540E-010.1910E-02B5 2B5 3 10.2500E-020.2540E-010.1910E-02B6 2B6 3 10.2500E-020.2540E-010.1910E-02B7 2B7 3 10.2500E-020.2540E-010.1910E-02B8 2B8 3 10.2500E-020.2540E-010.1910E-02B9 2B9 3 10.2500E-020.2540E-010.1910E-02BA 2BA 3 10.2500E-020.2540E-010.9550E-03BB 2BB 3 10.2500E-020.2540E-010.1910E-02BC 2BC 3 10.2500E-020.2540E-010.1910E-02BD 2BD 3 10.2500E-020.2540E-010.1910E-02BE 2BE 3 10.2500E-020.2540E-010.1910E-02BF 2BF 3 10.2500E-020.2540E-010.1910E-02A2 3AMB 1 10.2540E-011.0000E-110.5102E-02A3 3AMB 1 10.2540E-011.0000E-110.5102E-02A4 3AMB 1 10.2540E-011.0000E-110.5102E-02A5 3AMB 1 10.2540E-011.0000E-110.5102E-02A6 3AMB 1 10.2540E-011.0000E-110.5102E-02A7 3AMB 1 10.2540E-011.0000E-110.5102E-02A8 3AMB 1 10.2540E-011.0000E-110.5102E-02A9 3AMB 1 10.2540E-011.0000E-110.5102E-02AA 3AMB 1 10.2540E-011.0000E-110.5102E-02AB 3AMB 1 10.2540E-011.0000E-110.5102E-02AC 3AMB 1 10.2540E-011.0000E-110.5102E-02AD 3AMB 1 10.2540E-011.0000E-110.5102E-02AE 3AMB 1 10.2540E-011.0000E-110.5102E-02AF 3AMB 1 10.2540E-011.0000E-110.5102E-02AG 3AMB 1 10.2540E-011.0000E-110.5102E-02AH 3AMB 1 10.2540E-011.0000E-110.5102E-02

126
AI 3AMB 1 10.2540E-011.0000E-110.5102E-02AJ 3AMB 1 10.2540E-011.0000E-110.5102E-02AK 3AMB 1 10.2540E-011.0000E-110.5102E-02AL 3AMB 1 10.2540E-011.0000E-110.5102E-02AM 3AMB 1 10.2540E-011.0000E-110.5102E-02AN 3AMB 1 10.2540E-011.0000E-110.5102E-02AO 3AMB 1 10.2540E-011.0000E-110.5102E-02AP 3AMB 1 10.2540E-011.0000E-110.5102E-02AQ 3AMB 1 10.2540E-011.0000E-110.5102E-02AR 3AMB 1 10.2540E-011.0000E-110.5102E-02AS 3AMB 1 10.2540E-011.0000E-110.5102E-02AT 3AMB 1 10.2540E-011.0000E-110.5102E-02AU 3AMB 1 10.2540E-011.0000E-110.5102E-02AV 3AMB 1 10.2540E-011.0000E-110.5102E-02AW 3AMB 1 10.2540E-011.0000E-110.5102E-02AX 3AMB 1 10.2540E-011.0000E-110.5102E-02AY 3AMB 1 10.2540E-011.0000E-110.5102E-02AZ 3AMB 1 10.2540E-011.0000E-110.5102E-02B1 3AMB 1 10.2540E-011.0000E-110.5102E-02B2 3AMB 1 10.2540E-011.0000E-110.5102E-02B3 3AMB 1 10.2540E-011.0000E-110.5102E-02B4 3AMB 1 10.2540E-011.0000E-110.5102E-02B5 3AMB 1 10.2540E-011.0000E-110.5102E-02B6 3AMB 1 10.2540E-011.0000E-110.5102E-02B7 3AMB 1 10.2540E-011.0000E-110.5102E-02B8 3AMB 1 10.2540E-011.0000E-110.5102E-02B9 3AMB 1 10.2540E-011.0000E-110.5102E-02BA 3AMB 1 10.2540E-011.0000E-110.2551E-02BB 3AMB 1 10.2540E-011.0000E-110.5102E-02BC 3AMB 1 10.2540E-011.0000E-110.5102E-02BD 3AMB 1 10.2540E-011.0000E-110.5102E-02BE 3AMB 1 10.2540E-011.0000E-110.5102E-02BF 3AMB 1 10.2540E-011.0000E-110.5102E-02BOU 1A2 1 31.0000E-100.5000E-020.2027E-021.A2 1A3 1 30.5000E-020.5000E-020.2027E-021.A3 1A4 1 30.5000E-020.5000E-020.2027E-021.A4 1A5 1 30.5000E-020.5000E-020.2027E-021.A5 1A6 1 30.5000E-020.5000E-020.2027E-021.A6 1A7 1 30.5000E-020.5000E-020.2027E-021.A7 1A8 1 30.5000E-020.5000E-020.2027E-021.A8 1A9 1 30.5000E-020.5000E-020.2027E-021.A9 1AA 1 30.5000E-020.5000E-020.2027E-021.AA 1AB 1 30.5000E-020.5000E-020.2027E-021.AB 1AC 1 30.5000E-020.5000E-020.2027E-021.AC 1AD 1 30.5000E-020.5000E-020.2027E-021.AD 1AE 1 30.5000E-020.5000E-020.2027E-021.AE 1AF 1 30.5000E-020.5000E-020.2027E-021.AF 1AG 1 30.5000E-020.5000E-020.2027E-021.AG 1AH 1 30.5000E-020.5000E-020.2027E-021.AH 1AI 1 30.5000E-020.5000E-020.2027E-021.AI 1AJ 1 30.5000E-020.5000E-020.2027E-021.AJ 1AK 1 30.5000E-020.5000E-020.2027E-021.AK 1AL 1 30.5000E-020.5000E-020.2027E-021.AL 1AM 1 30.5000E-020.5000E-020.2027E-021.AM 1AN 1 30.5000E-020.5000E-020.2027E-021.AN 1AO 1 30.5000E-020.5000E-020.2027E-021.AO 1AP 1 30.5000E-020.5000E-020.2027E-021.AP 1AQ 1 30.5000E-020.5000E-020.2027E-021.AQ 1AR 1 30.5000E-020.5000E-020.2027E-021.AR 1AS 1 30.5000E-020.5000E-020.2027E-021.AS 1AT 1 30.5000E-020.5000E-020.2027E-021.

127
AT 1AU 1 30.5000E-020.5000E-020.2027E-021.AU 1AV 1 30.5000E-020.5000E-020.2027E-021.AV 1AW 1 30.5000E-020.5000E-020.2027E-021.AW 1AX 1 30.5000E-020.5000E-020.2027E-021.AX 1AY 1 30.5000E-020.5000E-020.2027E-021.AY 1AZ 1 30.5000E-020.5000E-020.2027E-021.AZ 1B1 1 30.5000E-020.5000E-020.2027E-021.B1 1B2 1 30.5000E-020.5000E-020.2027E-021.B2 1B3 1 30.5000E-020.5000E-020.2027E-021.B3 1B4 1 30.5000E-020.5000E-020.2027E-021.B4 1B5 1 30.5000E-020.5000E-020.2027E-021.B5 1B6 1 30.5000E-020.5000E-020.2027E-021.B6 1B7 1 30.5000E-020.5000E-020.2027E-021.B7 1B8 1 30.5000E-020.5000E-020.2027E-021.B8 1B9 1 30.5000E-020.5000E-020.2027E-021.B9 1BA1 1 30.5000E-020.5000E-030.2027E-021.BA1 1BA2 1 30.5000E-030.5000E-030.2027E-021.BA2 1BA3 1 30.5000E-030.5000E-030.2027E-021.BA3 1BA4 1 30.5000E-030.5000E-030.2027E-021.BA4 1BA5 1 30.5000E-030.5000E-030.2027E-021.BA5 1BB 1 30.5000E-030.5000E-020.2027E-021.BB 1BC 1 30.5000E-020.5000E-020.2027E-021.BC 1BD 1 30.5000E-020.5000E-020.2027E-021.BD 1BE 1 30.5000E-020.5000E-020.2027E-021.BE 1BF 1 30.5000E-020.5000E-020.2027E-021.BF 1AMB 1 30.5000E-021.0000E-110.2027E-021.BOU 1A2 2 31.0000E-100.5000E-020.8765E-031.A2 2A3 2 30.5000E-020.5000E-020.8765E-031.A3 2A4 2 30.5000E-020.5000E-020.8765E-031.A4 2A5 2 30.5000E-020.5000E-020.8765E-031.A5 2A6 2 30.5000E-020.5000E-020.8765E-031.A6 2A7 2 30.5000E-020.5000E-020.8765E-031.A7 2A8 2 30.5000E-020.5000E-020.8765E-031.A8 2A9 2 30.5000E-020.5000E-020.8765E-031.A9 2AA 2 30.5000E-020.5000E-020.8765E-031.AA 2AB 2 30.5000E-020.5000E-020.8765E-031.AB 2AC 2 30.5000E-020.5000E-020.8765E-031.AC 2AD 2 30.5000E-020.5000E-020.8765E-031.AD 2AE 2 30.5000E-020.5000E-020.8765E-031.AE 2AF 2 30.5000E-020.5000E-020.8765E-031.AF 2AG 2 30.5000E-020.5000E-020.8765E-031.AG 2AH 2 30.5000E-020.5000E-020.8765E-031.AH 2AI 2 30.5000E-020.5000E-020.8765E-031.AI 2AJ 2 30.5000E-020.5000E-020.8765E-031.AJ 2AK 2 30.5000E-020.5000E-020.8765E-031.AK 2AL 2 30.5000E-020.5000E-020.8765E-031.AL 2AM 2 30.5000E-020.5000E-020.8765E-031.AM 2AN 2 30.5000E-020.5000E-020.8765E-031.AN 2AO 2 30.5000E-020.5000E-020.8765E-031.AO 2AP 2 30.5000E-020.5000E-020.8765E-031.AP 2AQ 2 30.5000E-020.5000E-020.8765E-031.AQ 2AR 2 30.5000E-020.5000E-020.8765E-031.AR 2AS 2 30.5000E-020.5000E-020.8765E-031.AS 2AT 2 30.5000E-020.5000E-020.8765E-031.AT 2AU 2 30.5000E-020.5000E-020.8765E-031.AU 2AV 2 30.5000E-020.5000E-020.8765E-031.AV 2AW 2 30.5000E-020.5000E-020.8765E-031.AW 2AX 2 30.5000E-020.5000E-020.8765E-031.AX 2AY 2 30.5000E-020.5000E-020.8765E-031.AY 2AZ 2 30.5000E-020.5000E-020.8765E-031.AZ 2B1 2 30.5000E-020.5000E-020.8765E-031.
128
B1 2B2 2 30.5000E-020.5000E-020.8765E-031.B2 2B3 2 30.5000E-020.5000E-020.8765E-031.B3 2B4 2 30.5000E-020.5000E-020.8765E-031.B4 2B5 2 30.5000E-020.5000E-020.8765E-031.B5 2B6 2 30.5000E-020.5000E-020.8765E-031.B6 2B7 2 30.5000E-020.5000E-020.8765E-031.B7 2B8 2 30.5000E-020.5000E-020.8765E-031.B8 2B9 2 30.5000E-020.5000E-020.8765E-031.B9 2BA 2 30.5000E-020.2500E-020.8765E-031.BA 2BB 2 30.2500E-020.5000E-020.8765E-031.BB 2BC 2 30.5000E-020.5000E-020.8765E-031.BC 2BD 2 30.5000E-020.5000E-020.8765E-031.BD 2BE 2 30.5000E-020.5000E-020.8765E-031.BE 2BF 2 30.5000E-020.5000E-020.8765E-031.BF 2AMB 1 30.5000E-021.0000E-110.8765E-031.BOU 1A2 3 31.0000E-100.5000E-020.1781E-011.A2 3A3 3 30.5000E-020.5000E-020.1781E-011.A3 3A4 3 30.5000E-020.5000E-020.1781E-011.A4 3A5 3 30.5000E-020.5000E-020.1781E-011.A5 3A6 3 30.5000E-020.5000E-020.1781E-011.A6 3A7 3 30.5000E-020.5000E-020.1781E-011.A7 3A8 3 30.5000E-020.5000E-020.1781E-011.A8 3A9 3 30.5000E-020.5000E-020.1781E-011.A9 3AA 3 30.5000E-020.5000E-020.1781E-011.AA 3AB 3 30.5000E-020.5000E-020.1781E-011.AB 3AC 3 30.5000E-020.5000E-020.1781E-011.AC 3AD 3 30.5000E-020.5000E-020.1781E-011.AD 3AE 3 30.5000E-020.5000E-020.1781E-011.AE 3AF 3 30.5000E-020.5000E-020.1781E-011.AF 3AG 3 30.5000E-020.5000E-020.1781E-011.AG 3AH 3 30.5000E-020.5000E-020.1781E-011.AH 3AI 3 30.5000E-020.5000E-020.1781E-011.AI 3AJ 3 30.5000E-020.5000E-020.1781E-011.AJ 3AK 3 30.5000E-020.5000E-020.1781E-011.AK 3AL 3 30.5000E-020.5000E-020.1781E-011.AL 3AM 3 30.5000E-020.5000E-020.1781E-011.AM 3AN 3 30.5000E-020.5000E-020.1781E-011.AN 3AO 3 30.5000E-020.5000E-020.1781E-011.AO 3AP 3 30.5000E-020.5000E-020.1781E-011.AP 3AQ 3 30.5000E-020.5000E-020.1781E-011.AQ 3AR 3 30.5000E-020.5000E-020.1781E-011.AR 3AS 3 30.5000E-020.5000E-020.1781E-011.AS 3AT 3 30.5000E-020.5000E-020.1781E-011.AT 3AU 3 30.5000E-020.5000E-020.1781E-011.AU 3AV 3 30.5000E-020.5000E-020.1781E-011.AV 3AW 3 30.5000E-020.5000E-020.1781E-011.AW 3AX 3 30.5000E-020.5000E-020.1781E-011.AX 3AY 3 30.5000E-020.5000E-020.1781E-011.AY 3AZ 3 30.5000E-020.5000E-020.1781E-011.AZ 3B1 3 30.5000E-020.5000E-020.1781E-011.B1 3B2 3 30.5000E-020.5000E-020.1781E-011.B2 3B3 3 30.5000E-020.5000E-020.1781E-011.B3 3B4 3 30.5000E-020.5000E-020.1781E-011.B4 3B5 3 30.5000E-020.5000E-020.1781E-011.B5 3B6 3 30.5000E-020.5000E-020.1781E-011.B6 3B7 3 30.5000E-020.5000E-020.1781E-011.B7 3B8 3 30.5000E-020.5000E-020.1781E-011.B8 3B9 3 30.5000E-020.5000E-020.1781E-011.B9 3BA 3 30.5000E-020.2500E-020.1781E-011.BA 3BB 3 30.2500E-020.5000E-020.1781E-011.BB 3BC 3 30.5000E-020.5000E-020.1781E-011.
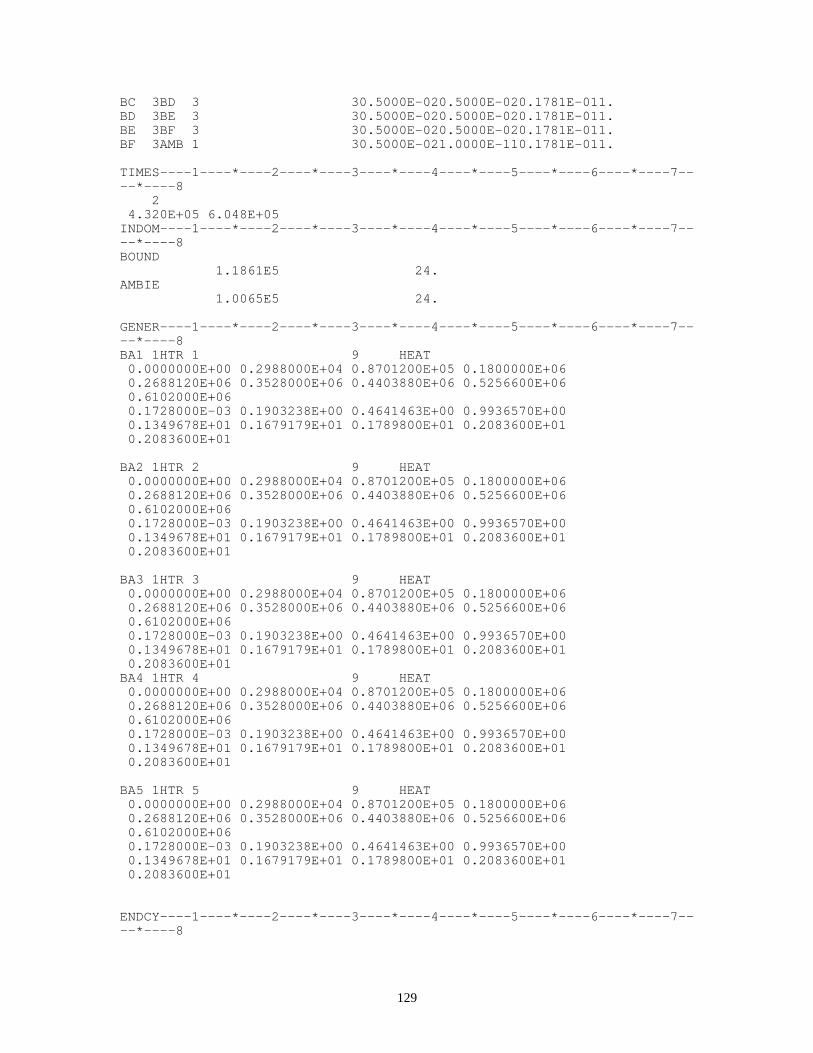
129
BC 3BD 3 30.5000E-020.5000E-020.1781E-011.BD 3BE 3 30.5000E-020.5000E-020.1781E-011.BE 3BF 3 30.5000E-020.5000E-020.1781E-011.BF 3AMB 1 30.5000E-021.0000E-110.1781E-011.
TIMES----1----*----2----*----3----*----4----*----5----*----6----*----7----*----8 2 4.320E+05 6.048E+05INDOM----1----*----2----*----3----*----4----*----5----*----6----*----7----*----8BOUND 1.1861E5 24.AMBIE 1.0065E5 24.
GENER----1----*----2----*----3----*----4----*----5----*----6----*----7----*----8BA1 1HTR 1 9 HEAT 0.0000000E+00 0.2988000E+04 0.8701200E+05 0.1800000E+06 0.2688120E+06 0.3528000E+06 0.4403880E+06 0.5256600E+06 0.6102000E+06 0.1728000E-03 0.1903238E+00 0.4641463E+00 0.9936570E+00 0.1349678E+01 0.1679179E+01 0.1789800E+01 0.2083600E+01 0.2083600E+01
BA2 1HTR 2 9 HEAT 0.0000000E+00 0.2988000E+04 0.8701200E+05 0.1800000E+06 0.2688120E+06 0.3528000E+06 0.4403880E+06 0.5256600E+06 0.6102000E+06 0.1728000E-03 0.1903238E+00 0.4641463E+00 0.9936570E+00 0.1349678E+01 0.1679179E+01 0.1789800E+01 0.2083600E+01 0.2083600E+01
BA3 1HTR 3 9 HEAT 0.0000000E+00 0.2988000E+04 0.8701200E+05 0.1800000E+06 0.2688120E+06 0.3528000E+06 0.4403880E+06 0.5256600E+06 0.6102000E+06 0.1728000E-03 0.1903238E+00 0.4641463E+00 0.9936570E+00 0.1349678E+01 0.1679179E+01 0.1789800E+01 0.2083600E+01 0.2083600E+01BA4 1HTR 4 9 HEAT 0.0000000E+00 0.2988000E+04 0.8701200E+05 0.1800000E+06 0.2688120E+06 0.3528000E+06 0.4403880E+06 0.5256600E+06 0.6102000E+06 0.1728000E-03 0.1903238E+00 0.4641463E+00 0.9936570E+00 0.1349678E+01 0.1679179E+01 0.1789800E+01 0.2083600E+01 0.2083600E+01
BA5 1HTR 5 9 HEAT 0.0000000E+00 0.2988000E+04 0.8701200E+05 0.1800000E+06 0.2688120E+06 0.3528000E+06 0.4403880E+06 0.5256600E+06 0.6102000E+06 0.1728000E-03 0.1903238E+00 0.4641463E+00 0.9936570E+00 0.1349678E+01 0.1679179E+01 0.1789800E+01 0.2083600E+01 0.2083600E+01
ENDCY----1----*----2----*----3----*----4----*----5----*----6----*----7----*----8
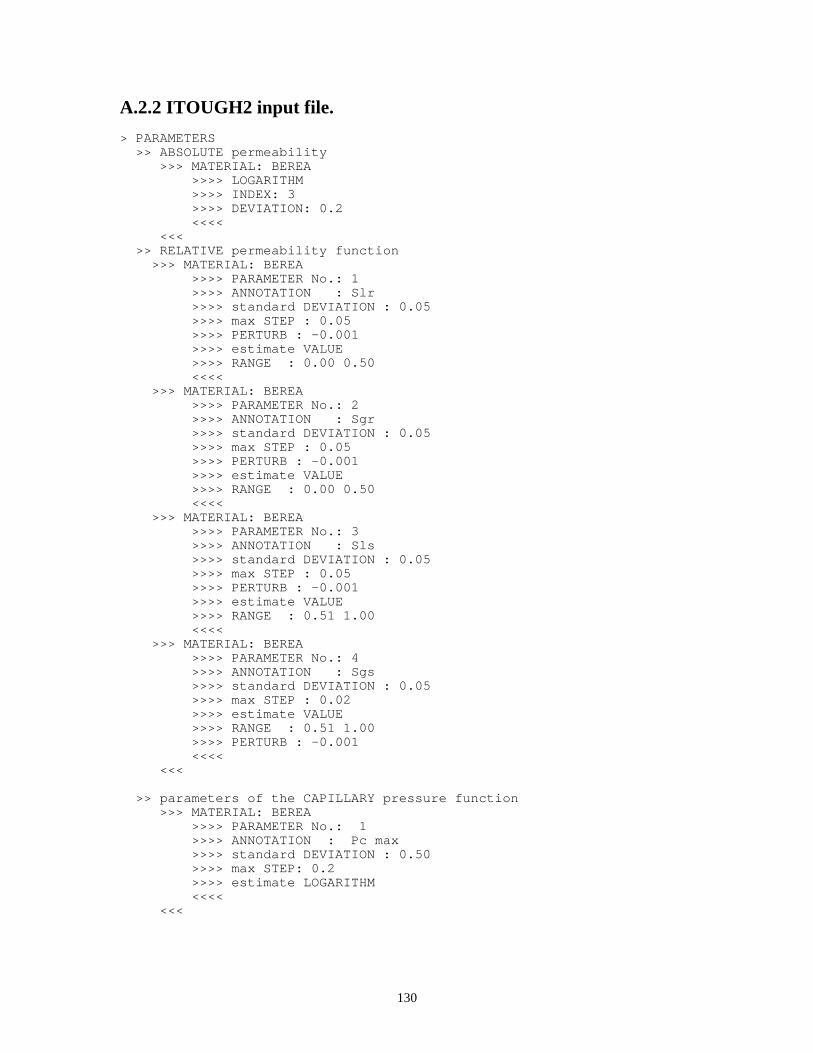
130
A.2.2 ITOUGH2 input file.
> PARAMETERS >> ABSOLUTE permeability >>> MATERIAL: BEREA >>>> LOGARITHM >>>> INDEX: 3 >>>> DEVIATION: 0.2 <<<< <<< >> RELATIVE permeability function >>> MATERIAL: BEREA >>>> PARAMETER No.: 1 >>>> ANNOTATION : Slr >>>> standard DEVIATION : 0.05 >>>> max STEP : 0.05 >>>> PERTURB : -0.001 >>>> estimate VALUE >>>> RANGE : 0.00 0.50 <<<< >>> MATERIAL: BEREA >>>> PARAMETER No.: 2 >>>> ANNOTATION : Sgr >>>> standard DEVIATION : 0.05 >>>> max STEP : 0.05 >>>> PERTURB : -0.001 >>>> estimate VALUE >>>> RANGE : 0.00 0.50 <<<< >>> MATERIAL: BEREA >>>> PARAMETER No.: 3 >>>> ANNOTATION : Sls >>>> standard DEVIATION : 0.05 >>>> max STEP : 0.05 >>>> PERTURB : -0.001 >>>> estimate VALUE >>>> RANGE : 0.51 1.00 <<<< >>> MATERIAL: BEREA >>>> PARAMETER No.: 4 >>>> ANNOTATION : Sgs >>>> standard DEVIATION : 0.05 >>>> max STEP : 0.02 >>>> estimate VALUE >>>> RANGE : 0.51 1.00 >>>> PERTURB : -0.001 <<<< <<<
>> parameters of the CAPILLARY pressure function >>> MATERIAL: BEREA >>>> PARAMETER No.: 1 >>>> ANNOTATION : Pc max >>>> standard DEVIATION : 0.50 >>>> max STEP: 0.2 >>>> estimate LOGARITHM <<<< <<<

131
>> RATE >>> SOURCE: HTR1_ +4 >>>> ANNOTATION : H7 >>>> PARAMETER No.: 7 >>>> DEVIATION : 0.1 >>>> VALUE >>>> STEP : 0.1 <<<< >>> SOURCE: HTR1_ +4 >>>> ANNOTATION : H8 >>>> PARAMETER No.: 8 >>>> DEVIATION : 0.1 >>>> VALUE >>>> STEP : 0.1 <<<< <<< <<
> OBSERVATIONS >> TIMES: 50 EQUALLY spaced in [DAYS] between 0.140 7.000 >> TIMES: 8 in SECONDS at heat changes .298800E+04 .870120E+05 .180000E+06 .268812E+06 .352800E+06 .440388E+06 .525600E+06 .610200E+06
>> TEMPERATURE >>> ELEMENT: B3__2 >>>> ANNOTATION: T1 >>>> COLUMNS: 1 2 >>>> PICK : 10 >>>> DATA in DAYS on FILE: temp.dat >>>> DEVIATION: 1.0 deg C <<<< >>> ELEMENT: B5__2 >>>> ANNOTATION: T2 >>>> COLUMNS: 1 4 >>>> PICK : 10 >>>> DATA in DAYS on FILE: temp.dat >>>> DEVIATION: 1.0 deg C <<<< >>> ELEMENT: B3__2 >>>> ANNOTATION: T3 >>>> COLUMNS: 1 5 >>>> PICK : 10 >>>> DATA in DAYS on FILE: temp.dat >>>> DEVIATION: 1.0 deg C <<<< >>> ELEMENT: AZ__2 >>>> ANNOTATION: T4 >>>> COLUMNS: 1 6 >>>> PICK : 10 >>>> DATA in DAYS on FILE: temp.dat >>>> DEVIATION: 1.0 deg C <<<<
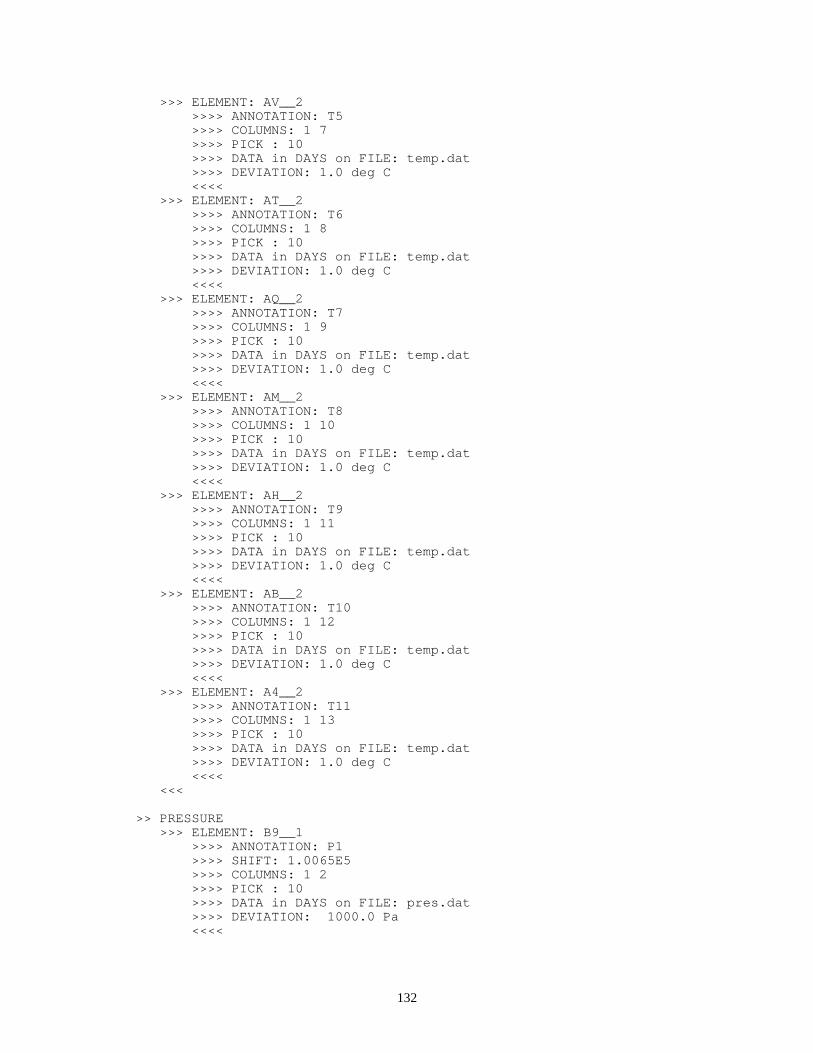
132
>>> ELEMENT: AV__2 >>>> ANNOTATION: T5 >>>> COLUMNS: 1 7 >>>> PICK : 10 >>>> DATA in DAYS on FILE: temp.dat >>>> DEVIATION: 1.0 deg C <<<< >>> ELEMENT: AT__2 >>>> ANNOTATION: T6 >>>> COLUMNS: 1 8 >>>> PICK : 10 >>>> DATA in DAYS on FILE: temp.dat >>>> DEVIATION: 1.0 deg C <<<< >>> ELEMENT: AQ__2 >>>> ANNOTATION: T7 >>>> COLUMNS: 1 9 >>>> PICK : 10 >>>> DATA in DAYS on FILE: temp.dat >>>> DEVIATION: 1.0 deg C <<<< >>> ELEMENT: AM__2 >>>> ANNOTATION: T8 >>>> COLUMNS: 1 10 >>>> PICK : 10 >>>> DATA in DAYS on FILE: temp.dat >>>> DEVIATION: 1.0 deg C <<<< >>> ELEMENT: AH__2 >>>> ANNOTATION: T9 >>>> COLUMNS: 1 11 >>>> PICK : 10 >>>> DATA in DAYS on FILE: temp.dat >>>> DEVIATION: 1.0 deg C <<<< >>> ELEMENT: AB__2 >>>> ANNOTATION: T10 >>>> COLUMNS: 1 12 >>>> PICK : 10 >>>> DATA in DAYS on FILE: temp.dat >>>> DEVIATION: 1.0 deg C <<<< >>> ELEMENT: A4__2 >>>> ANNOTATION: T11 >>>> COLUMNS: 1 13 >>>> PICK : 10 >>>> DATA in DAYS on FILE: temp.dat >>>> DEVIATION: 1.0 deg C <<<< <<<
>> PRESSURE >>> ELEMENT: B9__1 >>>> ANNOTATION: P1 >>>> SHIFT: 1.0065E5 >>>> COLUMNS: 1 2 >>>> PICK : 10 >>>> DATA in DAYS on FILE: pres.dat >>>> DEVIATION: 1000.0 Pa <<<<

133
>>> ELEMENT: B5__1 >>>> ANNOTATION: P2 >>>> SHIFT: 1.0065E5 >>>> COLUMNS: 1 3 >>>> PICK : 10 >>>> DATA in DAYS on FILE: pres.dat >>>> DEVIATION: 1000.0 Pa <<<< >>> ELEMENT: B3__1 >>>> ANNOTATION: P3 >>>> SHIFT: 1.0065E5 >>>> COLUMNS: 1 4 >>>> PICK : 10 >>>> DATA in DAYS on FILE: pres.dat >>>> DEVIATION: 1000.0 Pa <<<< >>> ELEMENT: AZ__1 >>>> ANNOTATION: P4 >>>> SHIFT: 1.0065E5 >>>> COLUMNS: 1 5 >>>> PICK : 10 >>>> DATA in DAYS on FILE: pres.dat >>>> DEVIATION: 1000.0 Pa <<<< >>> ELEMENT: AV__1 >>>> ANNOTATION: P5 >>>> SHIFT: 1.0065E5 >>>> COLUMNS: 1 6 >>>> PICK : 10 >>>> DATA in DAYS on FILE: pres.dat >>>> DEVIATION: 1000.0 Pa <<<< >>> ELEMENT: AT__1 >>>> ANNOTATION: P6 >>>> SHIFT: 1.0065E5 >>>> COLUMNS: 1 7 >>>> PICK : 10 >>>> DATA in DAYS on FILE: pres.dat >>>> DEVIATION: 1000.0 Pa <<<< >>> ELEMENT: AQ__1 >>>> ANNOTATION: P7 >>>> SHIFT: 1.0065E5 >>>> COLUMNS: 1 8 >>>> PICK : 10 >>>> DATA in DAYS on FILE: pres.dat >>>> DEVIATION: 1000.0 Pa <<<< >>> ELEMENT: AM__1 >>>> ANNOTATION: P8 >>>> SHIFT: 1.0065E5 >>>> COLUMNS: 1 9 >>>> PICK : 10 >>>> DATA in DAYS on FILE: pres.dat >>>> DEVIATION: 1000.0 Pa <<<< >>> ELEMENT: AH__1 >>>> ANNOTATION: P9 >>>> SHIFT: 1.0065E5 >>>> COLUMNS: 1 10 >>>> PICK : 10

134
>>>> DATA in DAYS on FILE: pres.dat >>>> DEVIATION: 1000.0 Pa <<<< >>> ELEMENT: AB__1 >>>> ANNOTATION: P10 >>>> SHIFT: 1.0065E5 >>>> COLUMNS: 1 11 >>>> PICK : 10 >>>> DATA in DAYS on FILE: pres.dat >>>> DEVIATION: 1000.0 Pa <<<< >>> ELEMENT: A4__1 >>>> ANNOTATION: P11 >>>> SHIFT: 1.0065E5 >>>> COLUMNS: 1 12 >>>> PICK : 10 >>>> DATA in DAYS on FILE: pres.dat >>>> DEVIATION: 1000.0 Pa <<<< <<<
>> VAPOR SATURATION >>> ELEMENT: B9__1 >>>> ANNOTATION: Sst1 >>>> SHIFT: -0.10 >>>> FACTOR: 1.1111 >>>> COLUMNS: 1 2 >>>> DATA in DAYS on FILE: sat.dat >>>> DEVIATION: 0.02 >>>> WINDOW: 5.00 8.00 [DAYS} <<<<
>>> ELEMENT: B7__1 >>>> ANNOTATION: Sst2 >>>> COLUMNS: 1 4 >>>> SHIFT: -0.075 >>>> FACTOR: 1.0811 >>>> DATA in DAYS on FILE: sat.dat >>>> DEVIATION: 0.01 >>>> WINDOW: 5.0 8.0 [DAYS} <<<< >>> ELEMENT: B6__1 >>>> ANNOTATION: Sst3 >>>> COLUMNS: 1 5 >>>> SHIFT: -0.065 >>>> FACTOR: 1.0695 >>>> DATA in DAYS on FILE: sat.dat >>>> DEVIATION: 0.01 >>>> WINDOW: 5.0 8.0 [DAYS} <<<< >>> ELEMENT: B5__1 >>>> ANNOTATION: Sst4 >>>> COLUMNS: 1 6 >>>> SHIFT: -0.07 >>>> FACTOR: 1.0753 >>>> DATA in DAYS on FILE: sat.dat >>>> DEVIATION: 0.01 >>>> WINDOW: 5.0 8.0 [DAYS} <<<< >>> ELEMENT: B4__1 >>>> ANNOTATION: Sst5
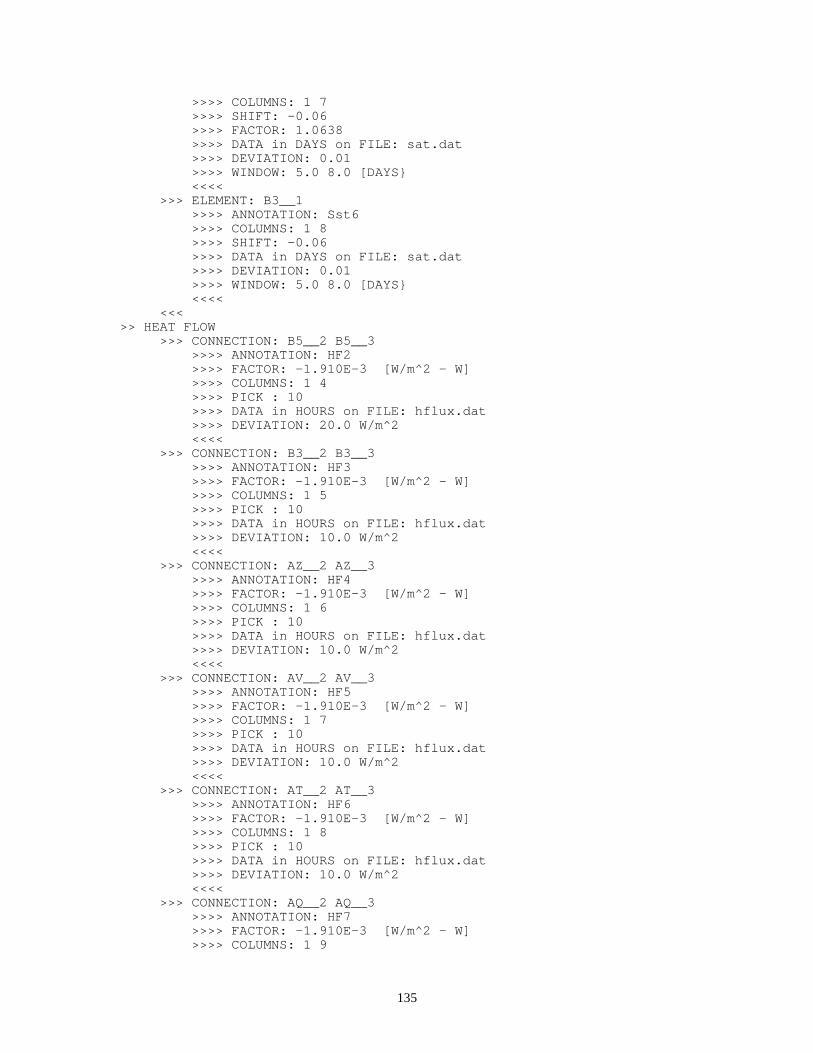
135
>>>> COLUMNS: 1 7 >>>> SHIFT: -0.06 >>>> FACTOR: 1.0638 >>>> DATA in DAYS on FILE: sat.dat >>>> DEVIATION: 0.01 >>>> WINDOW: 5.0 8.0 [DAYS} <<<< >>> ELEMENT: B3__1 >>>> ANNOTATION: Sst6 >>>> COLUMNS: 1 8 >>>> SHIFT: -0.06 >>>> DATA in DAYS on FILE: sat.dat >>>> DEVIATION: 0.01 >>>> WINDOW: 5.0 8.0 [DAYS} <<<< <<<>> HEAT FLOW >>> CONNECTION: B5__2 B5__3 >>>> ANNOTATION: HF2 >>>> FACTOR: -1.910E-3 [W/m^2 - W] >>>> COLUMNS: 1 4 >>>> PICK : 10 >>>> DATA in HOURS on FILE: hflux.dat >>>> DEVIATION: 20.0 W/m^2 <<<< >>> CONNECTION: B3__2 B3__3 >>>> ANNOTATION: HF3 >>>> FACTOR: -1.910E-3 [W/m^2 - W] >>>> COLUMNS: 1 5 >>>> PICK : 10 >>>> DATA in HOURS on FILE: hflux.dat >>>> DEVIATION: 10.0 W/m^2 <<<< >>> CONNECTION: AZ__2 AZ__3 >>>> ANNOTATION: HF4 >>>> FACTOR: -1.910E-3 [W/m^2 - W] >>>> COLUMNS: 1 6 >>>> PICK : 10 >>>> DATA in HOURS on FILE: hflux.dat >>>> DEVIATION: 10.0 W/m^2 <<<< >>> CONNECTION: AV__2 AV__3 >>>> ANNOTATION: HF5 >>>> FACTOR: -1.910E-3 [W/m^2 - W] >>>> COLUMNS: 1 7 >>>> PICK : 10 >>>> DATA in HOURS on FILE: hflux.dat >>>> DEVIATION: 10.0 W/m^2 <<<< >>> CONNECTION: AT__2 AT__3 >>>> ANNOTATION: HF6 >>>> FACTOR: -1.910E-3 [W/m^2 - W] >>>> COLUMNS: 1 8 >>>> PICK : 10 >>>> DATA in HOURS on FILE: hflux.dat >>>> DEVIATION: 10.0 W/m^2 <<<< >>> CONNECTION: AQ__2 AQ__3 >>>> ANNOTATION: HF7 >>>> FACTOR: -1.910E-3 [W/m^2 - W] >>>> COLUMNS: 1 9

136
>>>> PICK : 10 >>>> DATA in HOURS on FILE: hflux.dat >>>> DEVIATION: 10.0 W/m^2 <<<< >>> CONNECTION: AM__2 AM__3 >>>> ANNOTATION: HF8 >>>> FACTOR: -1.910E-3 [W/m^2 - W] >>>> COLUMNS: 1 10 >>>> PICK : 10 >>>> DATA in HOURS on FILE: hflux.dat >>>> DEVIATION: 10.0 W/m^2 <<<< >>> CONNECTION: AH__2 AH__3 >>>> ANNOTATION: HF9 >>>> FACTOR: -1.910E-3 [W/m^2 - W] >>>> COLUMNS: 1 11 >>>> PICK : 10 >>>> DATA in HOURS on FILE: hflux.dat >>>> DEVIATION: 10.0 W/m^2 <<<< >>> CONNECTION: AB__2 AB__3 >>>> ANNOTATION: HF10 >>>> FACTOR: -1.910E-3 [W/m^2 - W] >>>> COLUMNS: 1 12 >>>> PICK : 10 >>>> DATA in HOURS on FILE: hflux.dat >>>> DEVIATION: 10.0 W/m^2 <<<< >>> CONNECTION: A4__2 A4__3 >>>> ANNOTATION: HF11 >>>> FACTOR: -1.910E-3 [W/m^2 - W] >>>> COLUMNS: 1 13 >>>> PICK : 10 >>>> DATA in HOURS on FILE: hflux.dat >>>> DEVIATION: 10.0 W/m^2 <<<< <<< <<
> COMPUTATION >> STOPPING criteria >>> IGNORE WARNINGS >>> max. no. of ITERATIONS: 20 >>> IQIT=3: 50 >>> CONSECUTIVE: 100 >>> INCOMPLETE: 20 >>> LEVENBERG: 0.1 >>> STEP : 1.0 <<< >> JACOBIAN >>> FORWARD: 8 >>> PERTURB: 0.01 <<< >> OUTPUT >>> PLOTFILE: COLUMNS >>> DAYS >>> generate file with CHARACTERISTIC curves <<< <<<


