www.caymanchem.comCustomer Service 800.364.9897Technical Support 888.526.53511180 E. Ellsworth Rd · Ann Arbor, MI · USA
Estradiol ELISA Kit
Item No. 501890
3GENERAL INFORMATION
TABLE OF CONTENTS GENERAL INFORMATION 3 Materials Supplied
4 Safety Data
4 Precautions
5 If You Have Problems
5 Storage and Stability
5 Materials Needed but Not Supplied
INTRODUCTION 6 Background
6 About This Assay
7 Principle of the Assay
8 Definition of Key Terms
PRE-ASSAY PREPARATION 9 Buffer Preparation
10 Sample Preparation
11 Sample Matrix Properties
ASSAY PROTOCOL 13 Preparation of Assay-Specific Reagents
16 Plate Set Up
18 Performing the Assay
ANALYSIS 20 Calculations
22 Performance Characteristics
27 Plate Template
RESOURCES 28 Troubleshooting
29 References
30 Notes
31 Warranty and Limitation of Remedy
GENERAL INFORMATION
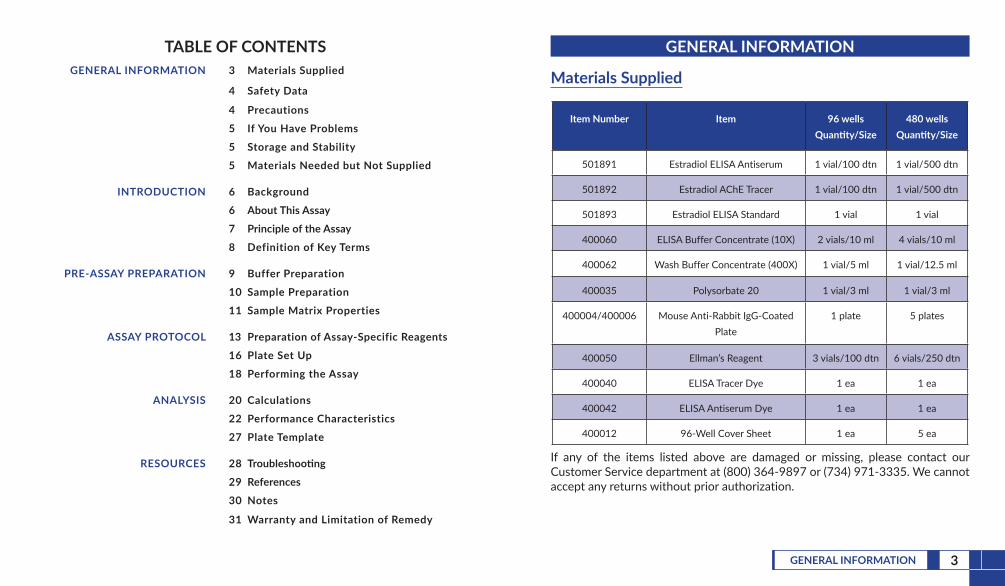
Materials Supplied
Item Number Item 96 wells Quantity/Size
480 wells Quantity/Size
501891 Estradiol ELISA Antiserum 1 vial/100 dtn 1 vial/500 dtn
501892 Estradiol AChE Tracer 1 vial/100 dtn 1 vial/500 dtn
501893 Estradiol ELISA Standard 1 vial 1 vial
400060 ELISA Buffer Concentrate (10X) 2 vials/10 ml 4 vials/10 ml
400062 Wash Buffer Concentrate (400X) 1 vial/5 ml 1 vial/12.5 ml
400035 Polysorbate 20 1 vial/3 ml 1 vial/3 ml
400004/400006 Mouse Anti-Rabbit IgG-Coated Plate
1 plate 5 plates
400050 Ellman’s Reagent 3 vials/100 dtn 6 vials/250 dtn
400040 ELISA Tracer Dye 1 ea 1 ea
400042 ELISA Antiserum Dye 1 ea 1 ea
400012 96-Well Cover Sheet 1 ea 5 ea
If any of the items listed above are damaged or missing, please contact our Customer Service department at (800) 364-9897 or (734) 971-3335. We cannot accept any returns without prior authorization.
4 GENERAL INFORMATION 5GENERAL INFORMATION
! WARNING: THIS PRODUCT IS FOR RESEARCH ONLY - NOT FORHUMAN OR VETERINARY DIAGNOSTIC OR THERAPEUTIC USE.
Safety DataThis material should be considered hazardous until further information becomes available. Do not ingest, inhale, get in eyes, on skin, or on clothing. Wash thoroughly after handling. Before use, the user must review the complete Safety Data Sheet, which has been sent via email to your institution.
PrecautionsPleasereadtheseinstructionscarefullybeforebeginningthisassay.This kit may not perform as described if any reagent or procedure is replaced or modified.When compared to quantification by LC/MS or GC/MS, it is not uncommon for immunoassays to report higher analyte concentrations. While LC/MS or GC/MS analyses typically measure only a single compound, antibodies used in immunoassays sometimes recognize not only the target molecule, but also structurally related molecules, including biologically relevant metabolites. In many cases, measurement of both the parent molecule and metabolites is more representative of the overall biological response than is the measurement of a short-lived parent molecule. It is the responsibility of the researcher to understand the limits of both assay systems and to interpret their data accordingly.
If You Have ProblemsTechnicalServiceContactInformation
Phone: 888-526-5351 (USA and Canada only) or 734-975-3888Fax: 734-971-3640Email: [email protected]
In order for our staff to assist you quickly and efficiently, please be ready to supply the lot number of the kit (found on the outside of the box).
Storage and StabilityThis kit will perform as specified if stored as directed at -20°C and used before the expiration date indicated on the outside of the box.
Materials Needed But Not Supplied1. A plate reader capable of measuring absorbance at 414 nm2. Adjustable pipettes and a repeating pipettor3. A source of pure water; glass-distilled water or deionized water is acceptable.
NOTE: UltraPure water is available for purchase from Cayman (Item No. 400000)
4. Materials used for Sample Preparation (see page 10)
6 INTRODUCTION 7INTRODUCTION
INTRODUCTION
BackgroundEstradiol is a steroid hormone produced from testosterone via the aromatase system in the granulosa cells of ovarian follicles.1,2 It is instrumental in the development of secondary sex characteristics at puberty and in the menstrual cycle.3-5 Plasma levels of estradiol peak during the follicular phase of the menstrual cycle to approximately 300 pg/ml.1,4,5 During this time, it stimulates proliferation of granulosa cells, increases the size of uterine glands, and exerts positive feedback on the hypothalamus, leading to an increase in luteinizing hormone.5,6 Blood levels of estradiol drop as luteinizing hormone levels increase and trigger ovulation, then rise again during the luteal phase to approximately 100 pg/ml.4
Estradiol is metabolized into estrone by 17β-hydroxysteroid dehydrogenase 2 and hydroxylated metabolites such as estriol, as well as glucuronidated and sulfonated metabolites, which are excreted in the urine and feces.7
About This AssayCayman’s Estradiol ELISA Kit is a competitive assay that can be used for quantification of estradiol in plasma and serum. The assay has a range of 0.61-10,000 pg/ml and a sensitivity (80% B/B0) of approximately 20 pg/ml.
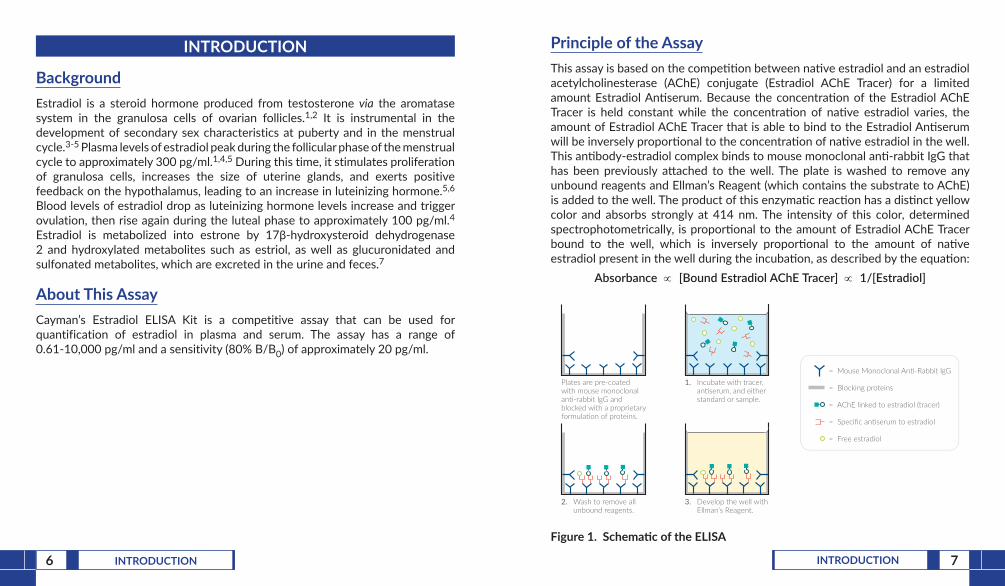
Principle of the AssayThis assay is based on the competition between native estradiol and an estradiol acetylcholinesterase (AChE) conjugate (Estradiol AChE Tracer) for a limited amount Estradiol Antiserum. Because the concentration of the Estradiol AChE Tracer is held constant while the concentration of native estradiol varies, the amount of Estradiol AChE Tracer that is able to bind to the Estradiol Antiserum will be inversely proportional to the concentration of native estradiol in the well. This antibody-estradiol complex binds to mouse monoclonal anti-rabbit IgG that has been previously attached to the well. The plate is washed to remove any unbound reagents and Ellman’s Reagent (which contains the substrate to AChE) is added to the well. The product of this enzymatic reaction has a distinct yellow color and absorbs strongly at 414 nm. The intensity of this color, determined spectrophotometrically, is proportional to the amount of Estradiol AChE Tracer bound to the well, which is inversely proportional to the amount of native estradiol present in the well during the incubation, as described by the equation:
Absorbance ∝ [Bound Estradiol AChE Tracer] ∝ 1/[Estradiol]
Figure1.SchematicoftheELISA
1. Incubate with tracer, an�serum, and either standard or sample.
2. Wash to remove all unbound reagents.
3. Develop the well with Ellman’s Reagent.
Plates are pre-coated with mouse monoclonal an�-rabbit IgG and blocked with a proprietary formula�on of proteins.
= Mouse Monoclonal An�-Rabbit IgG
= Blocking proteins
= AChE linked to estradiol (tracer)
= Specific an�serum to estradiol
= Free estradiol
9PRE-ASSAY PREPARATION8 INTRODUCTION
PRE-ASSAY PREPARATION
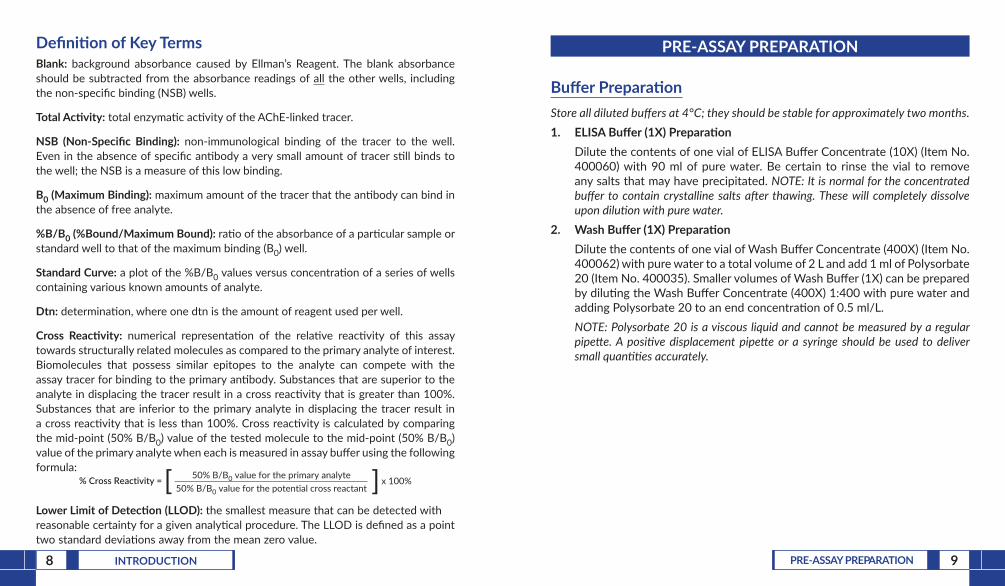
BufferPreparationStore all diluted buffers at 4°C; they should be stable for approximately two months.1. ELISABuffer(1X)Preparation
Dilute the contents of one vial of ELISA Buffer Concentrate (10X) (Item No. 400060) with 90 ml of pure water. Be certain to rinse the vial to remove any salts that may have precipitated. NOTE: It is normal for the concentrated buffer to contain crystalline salts after thawing. These will completely dissolve upon dilution with pure water.
2. WashBuffer(1X)PreparationDilute the contents of one vial of Wash Buffer Concentrate (400X) (Item No. 400062) with pure water to a total volume of 2 L and add 1 ml of Polysorbate 20 (Item No. 400035). Smaller volumes of Wash Buffer (1X) can be prepared by diluting the Wash Buffer Concentrate (400X) 1:400 with pure water and adding Polysorbate 20 to an end concentration of 0.5 ml/L.NOTE: Polysorbate 20 is a viscous liquid and cannot be measured by a regular pipette. A positive displacement pipette or a syringe should be used to deliver small quantities accurately.
DefinitionofKeyTermsBlank: background absorbance caused by Ellman’s Reagent. The blank absorbance should be subtracted from the absorbance readings of all the other wells, including the non-specific binding (NSB) wells.
TotalActivity: total enzymatic activity of the AChE-linked tracer.
NSB (Non-Specific Binding): non-immunological binding of the tracer to the well. Even in the absence of specific antibody a very small amount of tracer still binds to the well; the NSB is a measure of this low binding.
B0(MaximumBinding): maximum amount of the tracer that the antibody can bind in the absence of free analyte.
%B/B0(%Bound/MaximumBound): ratio of the absorbance of a particular sample or standard well to that of the maximum binding (B0) well.
Standard Curve: a plot of the %B/B0 values versus concentration of a series of wells containing various known amounts of analyte.
Dtn: determination, where one dtn is the amount of reagent used per well.
Cross Reactivity: numerical representation of the relative reactivity of this assay towards structurally related molecules as compared to the primary analyte of interest. Biomolecules that possess similar epitopes to the analyte can compete with the assay tracer for binding to the primary antibody. Substances that are superior to the analyte in displacing the tracer result in a cross reactivity that is greater than 100%. Substances that are inferior to the primary analyte in displacing the tracer result in a cross reactivity that is less than 100%. Cross reactivity is calculated by comparing the mid-point (50% B/B0) value of the tested molecule to the mid-point (50% B/B0) value of the primary analyte when each is measured in assay buffer using the following formula:
% Cross Reactivity = 50% B/B0 value for the primary analyte50% B/B0 value for the potential cross reactant
x 100%[ ]LowerLimitofDetection(LLOD):the smallest measure that can be detected with reasonable certainty for a given analytical procedure. The LLOD is defined as a point two standard deviations away from the mean zero value.
10 PRE-ASSAY PREPARATION 11PRE-ASSAY PREPARATION
SamplePreparationTestingforInterferenceThis assay has been tested using human plasma and serum. Other samples types should be checked for interference to evaluate the need for sample purification before embarking on a large number of sample measurements. To test for interference, dilute one or two test samples to obtain at least two different dilutions of each sample between approximately 900 and 20 pg/ml (i.e., between 30-80% B/B0, which is the linear portion of the standard curve). The two different dilutions of the sample should show good correlation (differ by 20% or less) in the final calculated concentration.Plasma and SerumPlasma and serum samples may require extraction prior to quantification in the assay. Sample extraction should be performed using a method similar to the following protocol.1. To a 300 µl sample add 1,200 µl of methanol. Mix and incubate at room
temperature for 10 minutes.2. Centrifuge at 2,000 x g for 10 minutes.3. Carefully transfer supernatant to a clean tube and evaporate to dryness
under inert gas.4. Reconstitute with 300 µl of the assay buffer and measure immediately.
NOTE: If samples cannot be measured immediately, store at -80°C. GeneralPrecautions
• All samples must be free of organic solvents prior to assay.• Samples should be assayed immediately after collection; samples that
cannot be assayed immediately should be stored at -80°C.• Samples of rabbit origin may contain antibodies that interfere with the
assay by binding to the mouse anti-rabbit plate. We recommend that all rabbit samples be purified prior to use in the assay.
SampleMatrixProperties
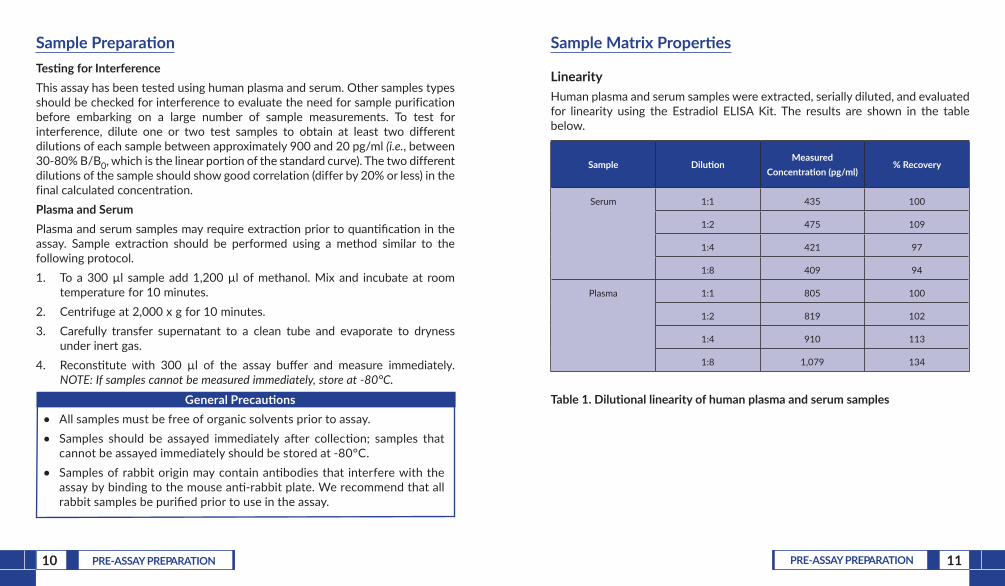
LinearityHuman plasma and serum samples were extracted, serially diluted, and evaluated for linearity using the Estradiol ELISA Kit. The results are shown in the table below.
Sample DilutionMeasured
Concentration(pg/ml)% Recovery
Serum 1:1 435 100
1:2 475 109
1:4 421 97
1:8 409 94
Plasma 1:1 805 100
1:2 819 102
1:4 910 113
1:8 1,079 134
Table1.Dilutionallinearityofhumanplasmaandserumsamples
13ASSAY PROTOCOL12 PRE-ASSAY PREPARATION
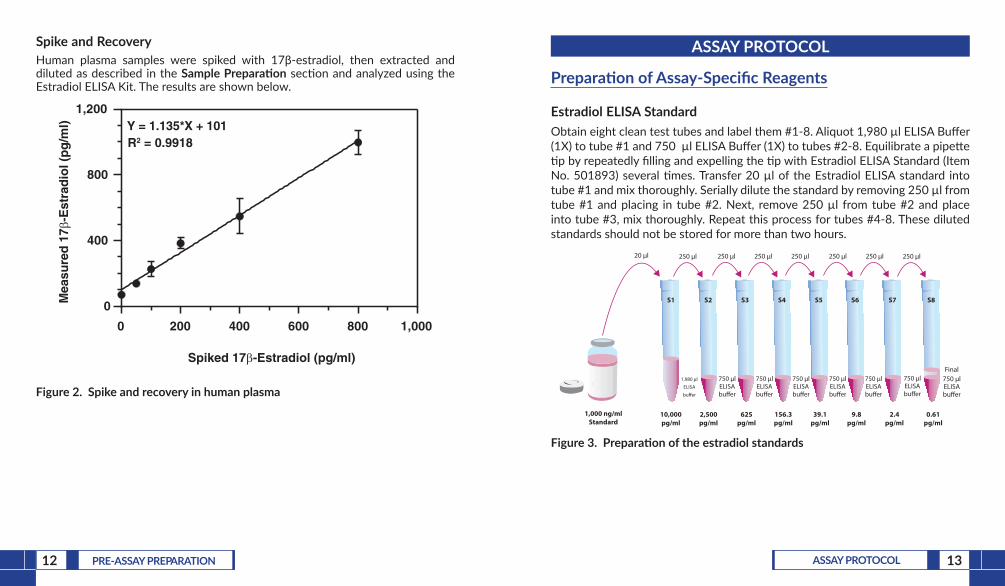
Spike and RecoveryHuman plasma samples were spiked with 17β-estradiol, then extracted and diluted as described in the SamplePreparation section and analyzed using the Estradiol ELISA Kit. The results are shown below.
0 200 400 600 800 1,000
0
400
800
1,200Y = 1.135*X + 101 R2 = 0.9918
Mea
sure
d 1
7�-E
stra
dio
l (p
g/m
l)
Spiked 17�-Estradiol (pg/ml)
Figure2.Spikeandrecoveryinhumanplasma
ASSAY PROTOCOL
PreparationofAssay-SpecificReagents
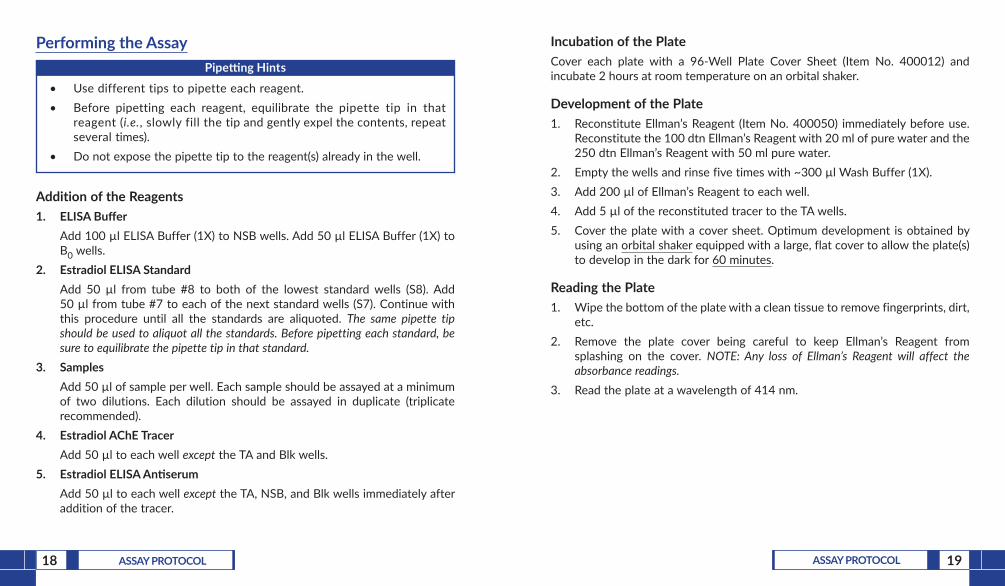
Estradiol ELISA StandardObtain eight clean test tubes and label them #1-8. Aliquot 1,980 µl ELISA Buffer (1X) to tube #1 and 750 µl ELISA Buffer (1X) to tubes #2-8. Equilibrate a pipette tip by repeatedly filling and expelling the tip with Estradiol ELISA Standard (Item No. 501893) several times. Transfer 20 µl of the Estradiol ELISA standard into tube #1 and mix thoroughly. Serially dilute the standard by removing 250 µl from tube #1 and placing in tube #2. Next, remove 250 µl from tube #2 and place into tube #3, mix thoroughly. Repeat this process for tubes #4-8. These diluted standards should not be stored for more than two hours.
1,000 ng/mlStandard
20 µl 250 µl 250 µl 250 µl 250 µl 250 µl
1,980 µl
ELISA
bu�er
750 µlELISAbu�er
Final
10,000pg/ml
S1 S2 S3 S4 S5 S6 S7 S8
2,500pg/ml
625pg/ml
156.3pg/ml
39.1pg/ml
9.8pg/ml
2.4pg/ml
0.61pg/ml
750 µlELISAbu�er
750 µlELISAbu�er
750 µlELISAbu�er
750 µlELISAbu�er
750 µlELISAbu�er
750 µlELISAbu�er
250 µl250 µl
Figure3.Preparationoftheestradiolstandards

14 ASSAY PROTOCOL 15ASSAY PROTOCOL
Estradiol AChE TracerReconstitute the 100 dtn Estradiol AChE Tracer (Item No. 501892) with 6 ml of ELISA Buffer (1X) and the 500 dtn Estradiol AChE Tracer with 30 ml ELISA Buffer.Store the reconstituted Estradiol AChE Tracer at 4°C (do not freeze!) and use within four weeks. A 20% surplus of tracer has been included to account for any incidental losses.
TracerDyeInstructions(optional)
This dye may be added to the tracer, if desired, to aid in visualization of tracer-containing wells. Add the dye to the reconstituted tracer at a final dilution of 1:100 (add 60 µl of dye to 6 ml tracer or add 300 µl of dye to 30 ml of tracer). Reconstituted tracer with added dye can be stored at 4°C for up to two weeks.
Estradiol AntiserumReconstitute the 100 dtn Estradiol Antiserum (Item No. 501891) with 6 ml of ELISA Buffer (1X) and the 500 dtn Estradiol Antiserum with 30 ml ELISA Buffer.Store the reconstituted Estradiol Antiserum at 4°C (do not freeze!) and use within four weeks. A 20% surplus of tracer has been included to account for any incidental losses. AntiserumDyeInstructions(optional)
This dye may be added to the antiserum, if desired, to aid in visualization of antiserum-containing wells. Add the dye to the reconstituted antiserum at a final dilution of 1:100 (add 60 µl of dye to 6 ml antiserum or add 300 µl of dye to 30 ml of antiserum). Reconstituted tracer with added dye can be stored at 4°C for up to two weeks.

16 ASSAY PROTOCOL 17ASSAY PROTOCOL
Plate Set UpThe 96-well plate(s) included with this kit is supplied ready to use. It is not necessary to rinse the plate(s) prior to adding the reagents. NOTE: If you do not need to use all the strips at once, place the unused strips back in the plate packet and store at 4°C. Be sure the packet is sealed with the desiccant inside. Each plate or set of strips must contain a minimum of two Blk, two NSB, and two B0 wells, and an eight-point standard curve run in duplicate. NOTE: Each assay must contain this minimum configuration in order to ensure accurate and reproducible results. Each sample should be assayed at two dilutions and each dilution should be assayed in duplicate. For statistical purposes, we recommend assaying samples in triplicate.A suggested plate format is shown in Figure 4. The user may vary the location and type of wells present as necessary for each particular experiment. The plate format provided on page 17 has been designed to allow for easy data analysis using a convenient spreadsheet offered by Cayman (see page 20 for more details). We suggest you record the contents of each well on the template sheet provided (see page 27).
Blk - BlankTA - Total ActivityNSB - Non-Specific BindingB0 - Maximum BindingS1-S8 - Standards 1-81-24 - Samples
A
B
C
D
E
F
G
H
1 2 3 4 5 6 7 8 9 10 11 12S1
S2
S3
S4
S5
S6
S7
S8 S8
S7
S6
S5
S4
S3
S2
S1
8
7
6
5
4
3
2
1
8
7
6
5
4
3
2
1
8
7
6
5
4
3
2
1
16
15
14
13
12
11
10
9
16
15
14
13
12
11
10
9
16
15
14
13
12
11
10
9
24
23
22
21
20
19
18
17
24
23
22
21
20
19
18
17 17
24
23
22
21
20
19
18
Blk
Blk
NSB
NSB
B0
B0
B0
TA
Figure4.Sampleplateformat
18 ASSAY PROTOCOL 19ASSAY PROTOCOL
Performing the Assay PipettingHints
• Use different tips to pipette each reagent.• Before pipetting each reagent, equilibrate the pipette tip in that
reagent (i.e., slowly fill the tip and gently expel the contents, repeat several times).
• Do not expose the pipette tip to the reagent(s) already in the well.
Addition of the Reagents1. ELISABuffer
Add 100 µl ELISA Buffer (1X) to NSB wells. Add 50 µl ELISA Buffer (1X) to B0 wells.
2. EstradiolELISAStandardAdd 50 µl from tube #8 to both of the lowest standard wells (S8). Add 50 µl from tube #7 to each of the next standard wells (S7). Continue with this procedure until all the standards are aliquoted. The same pipette tip should be used to aliquot all the standards. Before pipetting each standard, be sure to equilibrate the pipette tip in that standard.
3. SamplesAdd 50 µl of sample per well. Each sample should be assayed at a minimum of two dilutions. Each dilution should be assayed in duplicate (triplicate recommended).
4. EstradiolAChETracerAdd 50 µl to each well except the TA and Blk wells.
5. EstradiolELISAAntiserumAdd 50 µl to each well except the TA, NSB, and Blk wells immediately after addition of the tracer.
Incubation of the PlateCover each plate with a 96-Well Plate Cover Sheet (Item No. 400012) and incubate 2 hours at room temperature on an orbital shaker.
Development of the Plate1. Reconstitute Ellman’s Reagent (Item No. 400050) immediately before use.
Reconstitute the 100 dtn Ellman’s Reagent with 20 ml of pure water and the 250 dtn Ellman’s Reagent with 50 ml pure water.
2. Empty the wells and rinse five times with ~300 µl Wash Buffer (1X). 3. Add 200 µl of Ellman’s Reagent to each well.4. Add 5 µl of the reconstituted tracer to the TA wells.5. Cover the plate with a cover sheet. Optimum development is obtained by
using an orbital shaker equipped with a large, flat cover to allow the plate(s) to develop in the dark for 60 minutes.
Reading the Plate1. Wipe the bottom of the plate with a clean tissue to remove fingerprints, dirt,
etc. 2. Remove the plate cover being careful to keep Ellman’s Reagent from
splashing on the cover. NOTE: Any loss of Ellman’s Reagent will affect the absorbance readings.
3. Read the plate at a wavelength of 414 nm.
20 ANALYSIS 21ANALYSIS
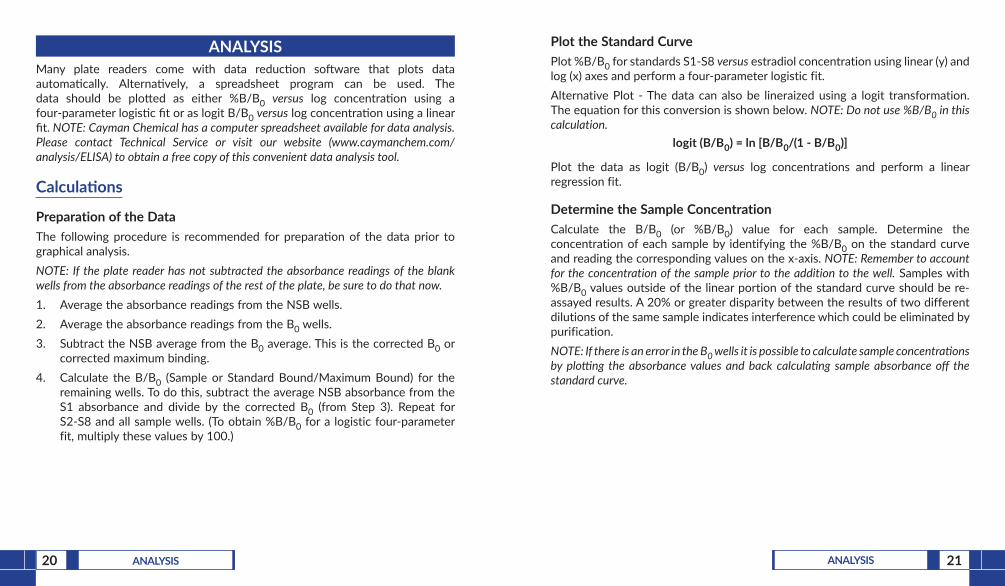
ANALYSISMany plate readers come with data reduction software that plots data automatically. Alternatively, a spreadsheet program can be used. The data should be plotted as either %B/B0 versus log concentration using a four-parameter logistic fit or as logit B/B0 versus log concentration using a linear fit. NOTE: Cayman Chemical has a computer spreadsheet available for data analysis. Please contact Technical Service or visit our website (www.caymanchem.com/analysis/ELISA) to obtain a free copy of this convenient data analysis tool.
Calculations
Preparation of the DataThe following procedure is recommended for preparation of the data prior to graphical analysis.NOTE: If the plate reader has not subtracted the absorbance readings of the blank wells from the absorbance readings of the rest of the plate, be sure to do that now.1. Average the absorbance readings from the NSB wells.2. Average the absorbance readings from the B0 wells.3. Subtract the NSB average from the B0 average. This is the corrected B0 or
corrected maximum binding.4. Calculate the B/B0 (Sample or Standard Bound/Maximum Bound) for the
remaining wells. To do this, subtract the average NSB absorbance from the S1 absorbance and divide by the corrected B0 (from Step 3). Repeat for S2-S8 and all sample wells. (To obtain %B/B0 for a logistic four-parameter fit, multiply these values by 100.)
Plot the Standard CurvePlot %B/B0 for standards S1-S8 versus estradiol concentration using linear (y) and log (x) axes and perform a four-parameter logistic fit.Alternative Plot - The data can also be lineraized using a logit transformation. The equation for this conversion is shown below. NOTE: Do not use %B/B0 in this calculation.
logit(B/B0)=ln[B/B0/(1-B/B0)]
Plot the data as logit (B/B0) versus log concentrations and perform a linear regression fit.
Determine the Sample ConcentrationCalculate the B/B0 (or %B/B0) value for each sample. Determine the concentration of each sample by identifying the %B/B0 on the standard curve and reading the corresponding values on the x-axis. NOTE: Remember to account for the concentration of the sample prior to the addition to the well. Samples with %B/B0 values outside of the linear portion of the standard curve should be re-assayed results. A 20% or greater disparity between the results of two different dilutions of the same sample indicates interference which could be eliminated by purification.NOTE: If there is an error in the B0 wells it is possible to calculate sample concentrations by plotting the absorbance values and back calculating sample absorbance off the standard curve.

22 ANALYSIS 23ANALYSIS
PerformanceCharacteristicsThe standard curve presented here is an example of the data typically produced with this kit; however, your results will not be identical to these. You must run a new standard curve. Do not use the data below to determine the values of your samples. Absorbanceat414nm(60minutes)
Table3.Typicalresults*%CV represents the variation in concentration (not absorbance) as determined using a reference standard curve†Evaluate data in this range with caution
Figure5.Typicalstandardcurveforestradiol
Estradiol Concentration (pg/ml)
%B
/B0
Assay Range = 0.61-10,000 pg/mlSensitivity (defined as 80% B/B0) = 20 pg/mlMid-point (defined as 50% B/B0) = 188 pg/ml Lower Limit of Detection (LLOD) = 6 pg/ml
The sensitivity and mid-point were derived from the standard curve shown above. The standard was diluted with ELISA Buffer (1X).
0
50
100
0.1 10 100 1,000 10,000 100,0001
Estradiol Standards (pg/ml)
Blank-Subtracted Absorbance
NSB-Corrected
Absorbance%B/B0
%CV Intra-Assay
Precision*
%CV Inter-Assay
Precision*
NSB 0.002 -- -- -- --
B0 0.923 0.921 -- -- --
10,000.000 0.087 0.085 9.4 6.6 8.1
2,500.000 0.172 0.170 19.0 6.8 4.4
625.000 0.303 0.301 33.7 7.2 4.7
156.250 0.471 0.469 52.6 12.1 7.1
39.063 0.638 0.636 71.2 12.5 10.9
9.766 0.779 0.776 87.0 23.0† 17.5
2.441 0.840 0.838 94.0 33.8† 27.8†
0.610 0.899 0.897 100.6 60.0† 39.3†
TA 1.562 -- -- -- --
24 ANALYSIS 25ANALYSIS
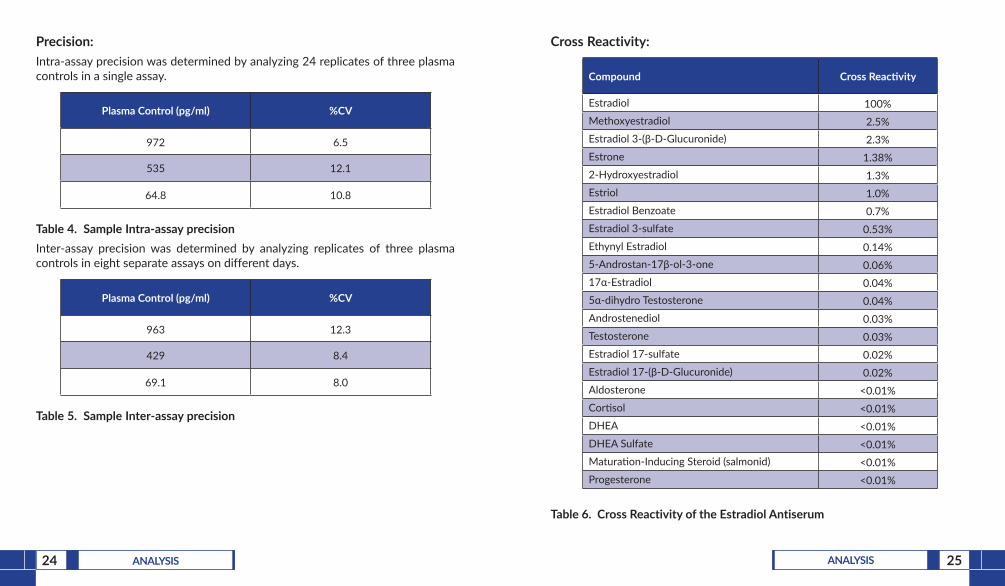
Precision:Intra-assay precision was determined by analyzing 24 replicates of three plasma controls in a single assay.
PlasmaControl(pg/ml) %CV
972 6.5
535 12.1
64.8 10.8
Table4.SampleIntra-assayprecisionInter-assay precision was determined by analyzing replicates of three plasma controls in eight separate assays on different days.
PlasmaControl(pg/ml) %CV
963 12.3
429 8.4
69.1 8.0
Table5.SampleInter-assayprecision
Cross Reactivity:
Compound CrossReactivity
Estradiol 100%Methoxyestradiol 2.5%Estradiol 3-(β-D-Glucuronide) 2.3%Estrone 1.38%2-Hydroxyestradiol 1.3%Estriol 1.0%Estradiol Benzoate 0.7%Estradiol 3-sulfate 0.53%Ethynyl Estradiol 0.14%5-Androstan-17β-ol-3-one 0.06%17α-Estradiol 0.04%5α-dihydro Testosterone 0.04%Androstenediol 0.03%Testosterone 0.03%Estradiol 17-sulfate 0.02%Estradiol 17-(β-D-Glucuronide) 0.02%Aldosterone <0.01%Cortisol <0.01%DHEA <0.01%DHEA Sulfate <0.01%Maturation-Inducing Steroid (salmonid) <0.01%Progesterone <0.01%
Table6.CrossReactivityoftheEstradiolAntiserum
26 ANALYSIS 27ANALYSIS
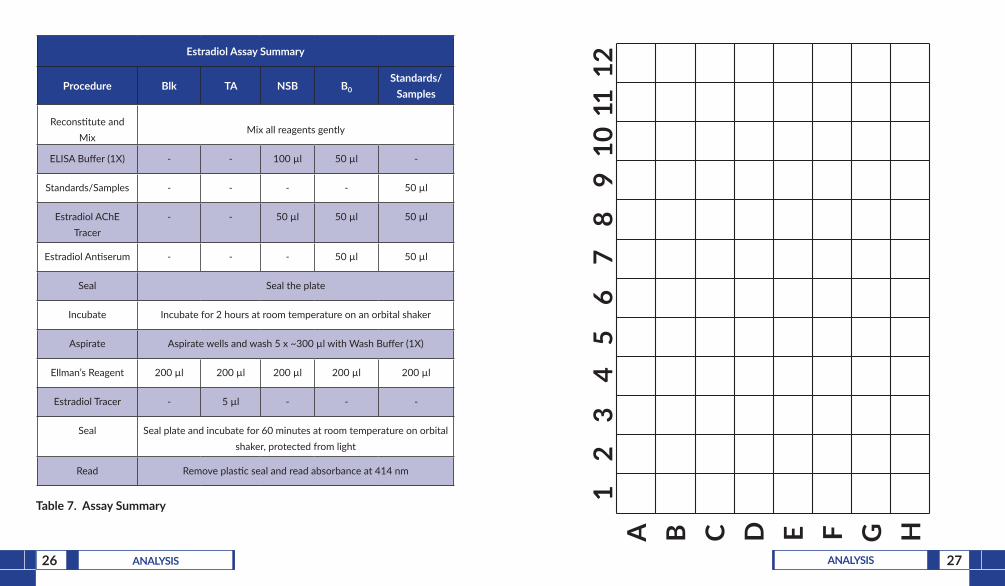
Estradiol Assay Summary
Procedure Blk TA NSB B0Standards/
Samples
Reconstitute and Mix
Mix all reagents gently
ELISA Buffer (1X) - - 100 µl 50 µl -
Standards/Samples - - - - 50 µl
Estradiol AChE Tracer
- - 50 µl 50 µl 50 µl
Estradiol Antiserum - - - 50 µl 50 µl
Seal Seal the plate
Incubate Incubate for 2 hours at room temperature on an orbital shaker
Aspirate Aspirate wells and wash 5 x ~300 µl with Wash Buffer (1X)
Ellman’s Reagent 200 µl 200 µl 200 µl 200 µl 200 µl
Estradiol Tracer - 5 µl - - -
Seal Seal plate and incubate for 60 minutes at room temperature on orbital shaker, protected from light
Read Remove plastic seal and read absorbance at 414 nm
Table7.AssaySummary
A B C D E F G H
12
34
56
78
910
1112
28 RESOURCES 29RESOURCES
RESOURCES
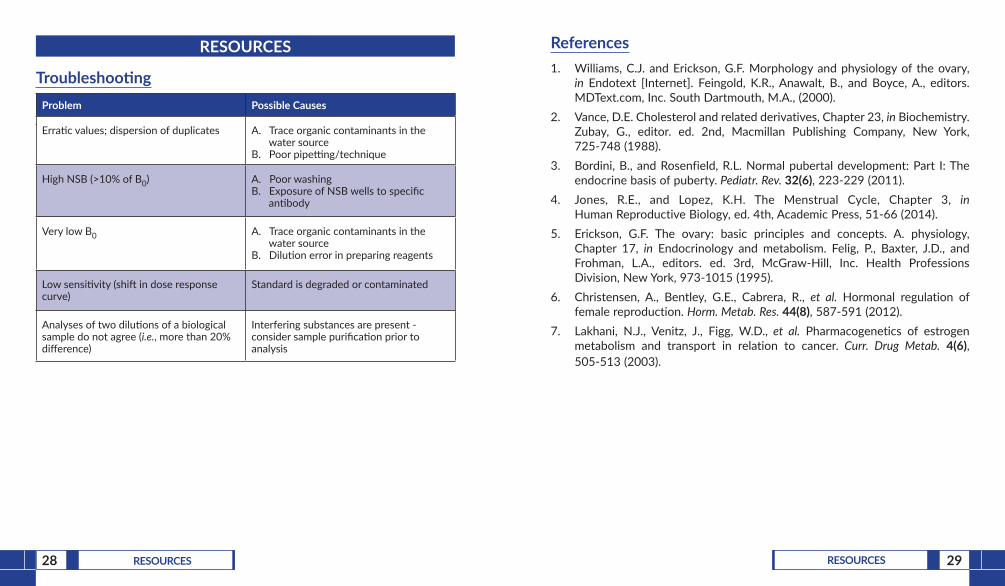
TroubleshootingProblem Possible Causes
Erratic values; dispersion of duplicates A. Trace organic contaminants in the water source
B. Poor pipetting/technique
High NSB (>10% of B0) A. Poor washing B. Exposure of NSB wells to specific
antibody
Very low B0 A. Trace organic contaminants in the water source
B. Dilution error in preparing reagents
Low sensitivity (shift in dose response curve)
Standard is degraded or contaminated
Analyses of two dilutions of a biological sample do not agree (i.e., more than 20% difference)
Interfering substances are present - consider sample purification prior to analysis
References1. Williams, C.J. and Erickson, G.F. Morphology and physiology of the ovary,
in Endotext [Internet]. Feingold, K.R., Anawalt, B., and Boyce, A., editors. MDText.com, Inc. South Dartmouth, M.A., (2000).
2. Vance, D.E. Cholesterol and related derivatives, Chapter 23, in Biochemistry. Zubay, G., editor. ed. 2nd, Macmillan Publishing Company, New York, 725-748 (1988).
3. Bordini, B., and Rosenfield, R.L. Normal pubertal development: Part I: The endocrine basis of puberty. Pediatr. Rev. 32(6), 223-229 (2011).
4. Jones, R.E., and Lopez, K.H. The Menstrual Cycle, Chapter 3, in Human Reproductive Biology, ed. 4th, Academic Press, 51-66 (2014).
5. Erickson, G.F. The ovary: basic principles and concepts. A. physiology, Chapter 17, in Endocrinology and metabolism. Felig, P., Baxter, J.D., and Frohman, L.A., editors. ed. 3rd, McGraw-Hill, Inc. Health Professions Division, New York, 973-1015 (1995).
6. Christensen, A., Bentley, G.E., Cabrera, R., et al. Hormonal regulation of female reproduction. Horm. Metab. Res. 44(8), 587-591 (2012).
7. Lakhani, N.J., Venitz, J., Figg, W.D., et al. Pharmacogenetics of estrogen metabolism and transport in relation to cancer. Curr. Drug Metab. 4(6), 505-513 (2003).
30 RESOURCES 31RESOURCES
NOTES
WarrantyandLimitationofRemedyBuyer agrees to purchase the material subject to Cayman’s Terms and Conditions.Complete Terms and Conditions including Warranty and Limitation of Liability information can be found on our website.This document is copyrighted. All rights are reserved. This document may not, in whole or part, be copied, photocopied, reproduced, translated, or reduced to any electronic medium or machine-readable form without prior consent, in writing, from Cayman Chemical Company.©08/02/2019, Cayman Chemical Company, Ann Arbor, MI, All rights reserved. Printed in U.S.A.