
, , ,
Introduction General principles Measures Conclusion and Outlook
Evaluation and criticism of multivariateprobabilistic forecasts
Julia Braun Leonhard Held
University of Zurich
Luzern, November 2007
Julia Braun, Leonhard Held University of Zurich
Evaluation and criticism of multivariate probabilistic forecasts

, , ,
Introduction General principles Measures Conclusion and Outlook
Outline
1 Introduction
2 General principles
3 Measures
4 Conclusion and Outlook
Julia Braun, Leonhard Held University of Zurich
Evaluation and criticism of multivariate probabilistic forecasts

, , ,
Introduction General principles Measures Conclusion and Outlook
Predictions
Major purpose of statistical modelling:Forecasts for future observations
Examples: weather and climate forecasts, inflation report, financialrisk, prediction of cancer rates or mortality,...
Forecasts try to reduce uncertainty about the future, but they willnever be perfect.
=⇒ Need for suitable measures of the uncertainty.
Julia Braun, Leonhard Held University of Zurich
Evaluation and criticism of multivariate probabilistic forecasts

, , ,
Introduction General principles Measures Conclusion and Outlook
Predictive distribution
One possibility: Comparison of the point prediction and the valuethat later materializes
Problem: Does not take into account uncertainty. Use wholepredictive distribution.
Key quantity in a Bayesian context:
Posterior predictive distribution
f (y |x) =
∫f (y |θ, x)f (θ|x)dθ
Julia Braun, Leonhard Held University of Zurich
Evaluation and criticism of multivariate probabilistic forecasts

, , ,
Introduction General principles Measures Conclusion and Outlook
Predictive distribution
Two main tasks:
Sharpness
Property of the predictions
Refers to the concentration of the predictive distribution
Calibration
Joint property of the predictive distribution and the real data
Agreement of the true values and the chosen predictivedistribution
Julia Braun, Leonhard Held University of Zurich
Evaluation and criticism of multivariate probabilistic forecasts

, , ,
Introduction General principles Measures Conclusion and Outlook
ExampleWeight of 48 pigs over 9 weeks (Diggle, 2002)
●
●
●
●
●
●
●
●
●
2 4 6 8
2030
4050
6070
8090
Week
weigh
t
●
●
●
●
●
●
●
●
●
●
●
●
●
●
●
●
●
●
●
●
●
●
●
●
●
●
●
●
●
●
●
●
●
●
●
●
●
●
●
●
●
●
●
●
●
●
●
●
●
●
●
●
●
●
●
●
●
●
●
●
●
●
●
●
●
●
●
●
●
●
●
●
●
●
●
●
●
●
●
●
●
●
●
●
●
●
●
●
●
●
●
●
●
●
●
●
●
●
●
●
●
●
●
●
●
●
●
●
●
●
●
●
●
●
●
●
●
●
●
●
●
●
●
●
●
●
●
●
●
●
●
●
●
●
●
●
●
●
●
●●
●
●
●
●
●
●
●
●
●
●
●
●
●
●
●
●
●
●
●
●
●
●
●
●
●
●
●
●
●
●
●
●
●
●
●
●
●
●
●
●
●
●
●
●
●
●
●
●
●
●
●
●
●
●
●
●
●
●
●
●
●
●
●
●
●
●
●
●
●
●
●
●
●
●
●
●
●
●
●
●
●
●
●
●
●
●
●
●
●
●
●
●
●
●
●
●
●
●
●
●
●
●
●
●
●
●
●
●
●
●
●
●
●
●
●●
●
●
●
●
●
●
●
●
●
●
●
●
●
●
●
●
●
●
●
●
●
●
●
●
●
●
●
●
●
●
●
●
●
●
●
●
●
●
●
●
●
●
●
●
●
●
●
●
●
●
●
●
●
●
●
●
●
●
●
●
●
●
●
●
●
●
●
●
●
●
●
●
●
●
●
●
●
●
●
●
●
●
●
●
●
●
●
●
●
●
●
●
●
●
●
●
●
●
●
●
●
●
●
●
●
●
●
●
●
●
●
●
●
●
●
●
●
●
●
●
●
●
●
●
●
●
●
●
●
●
●
●
●
●
●
●
●
●
●
●
●
●
●
●
●
●
●
●
●
●
●
●
●
●
●
●
●
●
●
●
●
●
●
●
●
●
Julia Braun, Leonhard Held University of Zurich
Evaluation and criticism of multivariate probabilistic forecasts

, , ,
Introduction General principles Measures Conclusion and Outlook
Models for pigs’ weight
Model 1: Linear model
Model 2: Linear model with random intercept
Model 3: Linear model with random intercept and random slope
In all models: time as explanatory variableBayesian inference using MCMC
Julia Braun, Leonhard Held University of Zurich
Evaluation and criticism of multivariate probabilistic forecasts

, , ,
Introduction General principles Measures Conclusion and Outlook
Quantitative assessment of probabilistic forecasts
Model evaluation
Comparing alternative models based on the predictive distributionand the true value
Model criticism
Assessing the agreement of one model with external data
Julia Braun, Leonhard Held University of Zurich
Evaluation and criticism of multivariate probabilistic forecasts

, , ,
Introduction General principles Measures Conclusion and Outlook
Model evaluation
Scoring rules
Sometimes also called scoring functions
Measure for the quality of forecasts
Numerical value based on the predictive distribution and thetrue value that arised later
Normally positively oriented
Cover both sharpness and calibration
Julia Braun, Leonhard Held University of Zurich
Evaluation and criticism of multivariate probabilistic forecasts

, , ,
Introduction General principles Measures Conclusion and Outlook
Model evaluation
Propriety
Proper scores: Expected value of the score is maximal if theobservation is derived from the predicitive distribution F .
Strictly proper scores: Expected value has only one maximum.
Interpretation: Proper scores do not lead the forecaster toturn away from his true belief.
Strictly proper scores penalize such an alteration.
The mean of proper scores is also proper.
Julia Braun, Leonhard Held University of Zurich
Evaluation and criticism of multivariate probabilistic forecasts

, , ,
Introduction General principles Measures Conclusion and Outlook
Model criticism
No alternative model assumptions necessary
Helps to detect and maybe correct inappropriate models
Prequential principle (Dawid, 1984):
A measure of agreement between a predictive distribution and thereal values should depend on the distribution only through thesequence of predictions.
Julia Braun, Leonhard Held University of Zurich
Evaluation and criticism of multivariate probabilistic forecasts

, , ,
Introduction General principles Measures Conclusion and Outlook
Calculation with MCMC methods
Calculation of many scores requires the predictive densityf (y |x).
In most cases: predictive density unknown.
Solution: MCMC methods
Gibbs sampling algorithm: Sample iteratively from fullconditional distributions
Samples θ(1), ..., θ(N) are available from posterior distribution
For each set of model parameters θ(n) we aditionally draw avalue for y (n).
Monte-Carlo estimation
f̂ (y |x) =1
N
N∑n=1
f (y |θ(n), x)
Julia Braun, Leonhard Held University of Zurich
Evaluation and criticism of multivariate probabilistic forecasts

, , ,
Introduction General principles Measures Conclusion and Outlook
Logarithmic score
Logarithmic score
LogS(Y , yobs) = log f (yobs |x)
Properties
Simple idea: Logarithmic density at the in fact observed value
Problem: Very sensitive to outliers and extreme events
Results for very small densities sometimes not computable
At the same time: Not sensitive to distance! Predictivedensity f (y |x) is only evaluated at yobs . All other values nottaken into account.
Julia Braun, Leonhard Held University of Zurich
Evaluation and criticism of multivariate probabilistic forecasts
, , ,
Introduction General principles Measures Conclusion and Outlook
Calculation of the logarithmic score
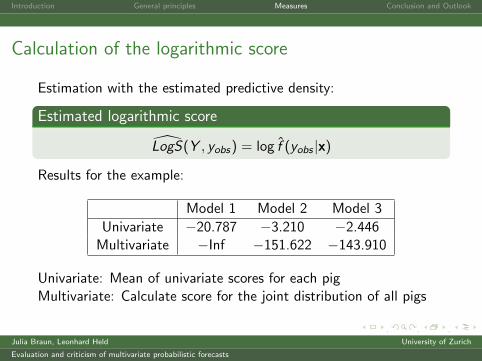
Estimation with the estimated predictive density:
Estimated logarithmic score
L̂ogS(Y , yobs) = log f̂ (yobs |x)
Results for the example:
Model 1 Model 2 Model 3
Univariate −20.787 −3.210 −2.446Multivariate −Inf −151.622 −143.910
Univariate: Mean of univariate scores for each pigMultivariate: Calculate score for the joint distribution of all pigs
Julia Braun, Leonhard Held University of Zurich
Evaluation and criticism of multivariate probabilistic forecasts

, , ,
Introduction General principles Measures Conclusion and Outlook
Spherical score
Spherical score
SphS(Y , yobs) =f (yobs |x)√∫∞−∞ f (y |x)2dy
Properties
Measure of distance between the forecast and the truth.
Problem: Computation can be difficult and time-consuming,often unfeasible in the multivariate case.
Julia Braun, Leonhard Held University of Zurich
Evaluation and criticism of multivariate probabilistic forecasts

, , ,
Introduction General principles Measures Conclusion and Outlook
Calculation of the spherical score
Estimated spherical score
Problem: Integral of f̂ (y |x)2 in the denominator
Numerical solution: Newton-Cotes formulas
Samples y (n) serve as supporting points
Approximation of the value of the integral between twoconsecutive supporting points (three different versions)
Sum of these approximations
Results indistinguishable for different versions ofNewton-Cotes
Results for the example:
Model 1 Model 2 Model 3
Univariate 0.322 0.722 0.817
Julia Braun, Leonhard Held University of Zurich
Evaluation and criticism of multivariate probabilistic forecasts

, , ,
Introduction General principles Measures Conclusion and Outlook
Continuous ranked probability score (CRPS)
Continuous ranked probability score
CRPS(Y , yobs) = −∫ ∞−∞
(P(Y ≤ t)− 1(yobs ≤ t))2dt
=1
2E |Y − Y ′| − E |Y − yobs |.
where Y and Y ′ are independent realisations from f (y |x).
Integral over the Brier score for binary predictions at all possiblethresholds t.
Julia Braun, Leonhard Held University of Zurich
Evaluation and criticism of multivariate probabilistic forecasts

, , ,
Introduction General principles Measures Conclusion and Outlook
Generalizations of the CRPS
Energy Score
ES(Y , yobs) =1
2E |Y − Y ′|α − E |Y − yobs |α
with α ∈ (0, 2).
Multivariate energy score
ES(Y , yobs) =1
2E‖Y − Y ′‖α − E‖Y − yobs‖α
where ‖.‖ denotes the Euclidean norm.
Julia Braun, Leonhard Held University of Zurich
Evaluation and criticism of multivariate probabilistic forecasts

, , ,
Introduction General principles Measures Conclusion and Outlook
Calculation and properties
Estimation of the energy score
ES(Y , yobs) = 12E |Y − Y ′|α − E |Y − yobs |α.
Split samples for y (n) in two parts y (n) and y ′(n).
As they are far enough apart, they can be seen as independent.
Comments:
Quick calculation because f (y |x) not needed directly
Alternative calculations possible, for example all possibledifferences,...
No recommendations concerning the choice of α
Julia Braun, Leonhard Held University of Zurich
Evaluation and criticism of multivariate probabilistic forecasts

, , ,
Introduction General principles Measures Conclusion and Outlook
Example
Results for the example:
Model 1 Model 2 Model 3
Univariate CRPS −3.753 −2.093 −1.099Univariate ES (α =0.5) −1.284 −0.954 −0.677
Multivariate CRPS −31.749 −18.57 −9.807Multivariate ES (α =0.5) −4.03 −3.115 −2.216
Julia Braun, Leonhard Held University of Zurich
Evaluation and criticism of multivariate probabilistic forecasts

, , ,
Introduction General principles Measures Conclusion and Outlook
Tools for model criticism
Probability integral transform (PIT)
pPIT = F (yobs |x)
F is the distribution function of the posterior predictivedensity.
If F is continuous and the observation comes from F , the PITvalue is uniformly distributed on (0, 1).
Estimation by evaluating 1N
∑Nn=1 1(y (n) ≤ yobs).
Check: Plotting the histogram for several PIT values ortesting for uniform distribution.
Disadvantage: Only possible for univariate distributions.
Julia Braun, Leonhard Held University of Zurich
Evaluation and criticism of multivariate probabilistic forecasts

, , ,
Introduction General principles Measures Conclusion and Outlook
Tools for model criticism
Box’s predictive p-value (Box, 1980)
pBox = P{f (Y |x) ≤ f (yobs |x)|x}
f (Y |x) is a function of the random variable Y ∼ f (y |x).
Also uniformly distributed on (0, 1).
Estimation using the estimated predictive density:
p̂Box =1
N
N∑n=1
1(f̂ (y (n)|x) ≤ f̂ (yobs |x)).
Julia Braun, Leonhard Held University of Zurich
Evaluation and criticism of multivariate probabilistic forecasts

, , ,
Introduction General principles Measures Conclusion and Outlook
Relation
For symmetric and unimodal distributions:
pBox = 1− 2|pPIT − 0.5|
PIT: 0
Box: 0
1
01
Julia Braun, Leonhard Held University of Zurich
Evaluation and criticism of multivariate probabilistic forecasts

, , ,
Introduction General principles Measures Conclusion and Outlook
Histograms
PIT PIT
Box Box
Julia Braun, Leonhard Held University of Zurich
Evaluation and criticism of multivariate probabilistic forecasts

, , ,
Introduction General principles Measures Conclusion and Outlook
Histograms of the pigs’ PIT values
PIT model 1
Freq
uenc
y
0.0 0.2 0.4 0.6 0.8 1.0
02
46
810
PIT model 2
Freq
uenc
y
0.0 0.2 0.4 0.6 0.8 1.0
02
46
810
PIT model 3
Freq
uenc
y
0.0 0.2 0.4 0.6 0.8 1.0
02
46
810
Julia Braun, Leonhard Held University of Zurich
Evaluation and criticism of multivariate probabilistic forecasts

, , ,
Introduction General principles Measures Conclusion and Outlook
Histograms of the pigs’ Box’s p-values
Box model 1
Freq
uenc
y
0.0 0.2 0.4 0.6 0.8 1.0
02
46
810
Box model 2
Freq
uenc
y
0.0 0.2 0.4 0.6 0.8 1.0
05
1015
Box model 3
Freq
uenc
y
0.0 0.2 0.4 0.6 0.8 1.0
02
46
810
Julia Braun, Leonhard Held University of Zurich
Evaluation and criticism of multivariate probabilistic forecasts

, , ,
Introduction General principles Measures Conclusion and Outlook
Multivariate Box’s p-values
Applicable for multivariate data.
Calculation time-consuming
Results for the example:
Model 1 Model 2 Model 3
0 0 0.087
Numerical problems?
Julia Braun, Leonhard Held University of Zurich
Evaluation and criticism of multivariate probabilistic forecasts

, , ,
Introduction General principles Measures Conclusion and Outlook
Conclusion and Outlook
Useful methods for model comparison and criticism, but:
no general recommendation which score to use,
computation can be time consuming,
probably numerically instable for multivariate data,
comparison with analytical results from lme-predictions,
multivariate application needs more exploration,
assessment of Monte Carlo error necessary,
performance of the different scores has to be studied further.
Julia Braun, Leonhard Held University of Zurich
Evaluation and criticism of multivariate probabilistic forecasts

, , ,
Introduction General principles Measures Conclusion and Outlook
References
Box, G.E.P. (1980). Sampling and Bayes’ inference in scientific modellingand robustness, Journal of the Royal Statistical Society, Series A 143,383-430.
Dawid, A.P. (1984). Statistical theory: The prequential approach,Journal of the Royal Statistical Society, Series A 147, 278-292.
Gneiting, T., Balabdaoui, F., Raftery, A.F. (2007). Probabilisticforecasts, calibration and sharpness, Journal of the Royal StatisticalSociety Series B 69, 243-268.
Diggle, J.P., Heagerty, P., Liang, K.Y., Zeger, S.L. (2002).Analysis of Longitudinal Data (second edition). Oxford University Press.
Gneiting, T., Raftery, A.F. (2007). Strictly proper scoring rules,prediction and estimation, Journal of the American StatisticalAssociation 102, 359-378.
Julia Braun, Leonhard Held University of Zurich
Evaluation and criticism of multivariate probabilistic forecasts


