Download - Evaluation Metrics (Classifiers)
Evaluation MetricsCS229
Nandita Bhaskhar(Adapted from past CS229 teams)
Oct 29th, 2021
Topics
● Why are metrics important?
● Binary classifiers○ Rank view, Thresholding
● Metrics○ Confusion Matrix
○ Point metrics: Accuracy, Precision, Recall / Sensitivity, Specificity, F-score
○ Summary metrics: AU-ROC, AU-PRC, Log-loss.
● Choosing Metrics
● Class Imbalance○ Failure scenarios for each metric
● Multi-class
Why are metrics important?
- Training objective (cost function) is only a proxy for real world objectives.
- Metrics help capture a business goal into a quantitative target (not all errors
are equal).
- Helps organize ML team effort towards that target.- Generally in the form of improving that metric on the dev set.
- Useful to quantify the “gap” between:- Desired performance and baseline (estimate effort initially).
- Desired performance and current performance.
- Measure progress over time.
- Useful for lower level tasks and debugging (e.g. diagnosing bias vs variance).
- Ideally training objective should be the metric, but not always possible. Still,
metrics are useful and important for evaluation.
Binary Classification
● x is input
● y is binary output (0/1)
● Model is ŷ = h(x)
● Two types of models○ Models that output a categorical class directly (K-nearest neighbor, Decision tree)
○ Models that output a real valued score (SVM, Logistic Regression)
■ Score could be margin (SVM), probability (LR, NN)
■ Need to pick a threshold
■ We focus on this type (the other type can be interpreted as an instance)
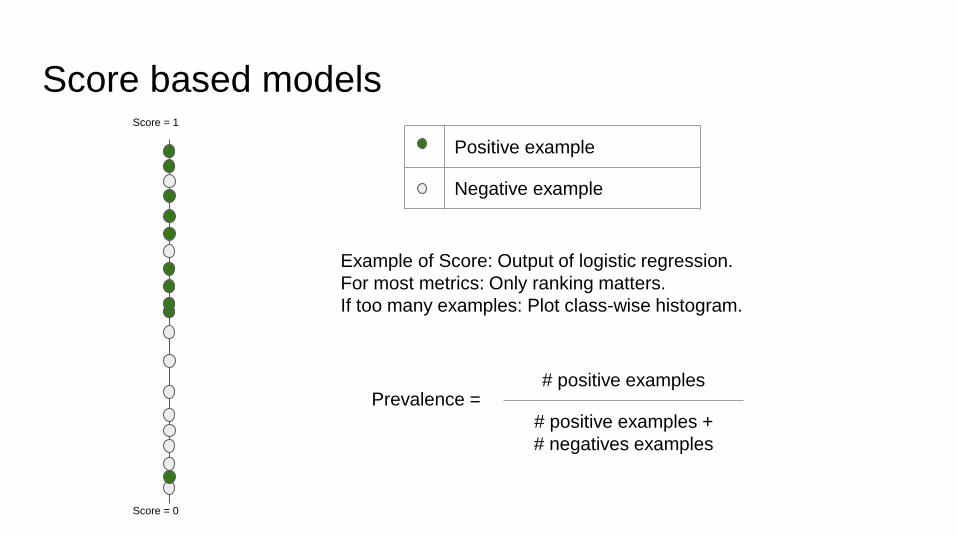
Score based modelsScore = 1
Score = 0
Positive example
Negative example
Prevalence = # positive examples
# positive examples +
# negatives examples
Example of Score: Output of logistic regression.
For most metrics: Only ranking matters.
If too many examples: Plot class-wise histogram.
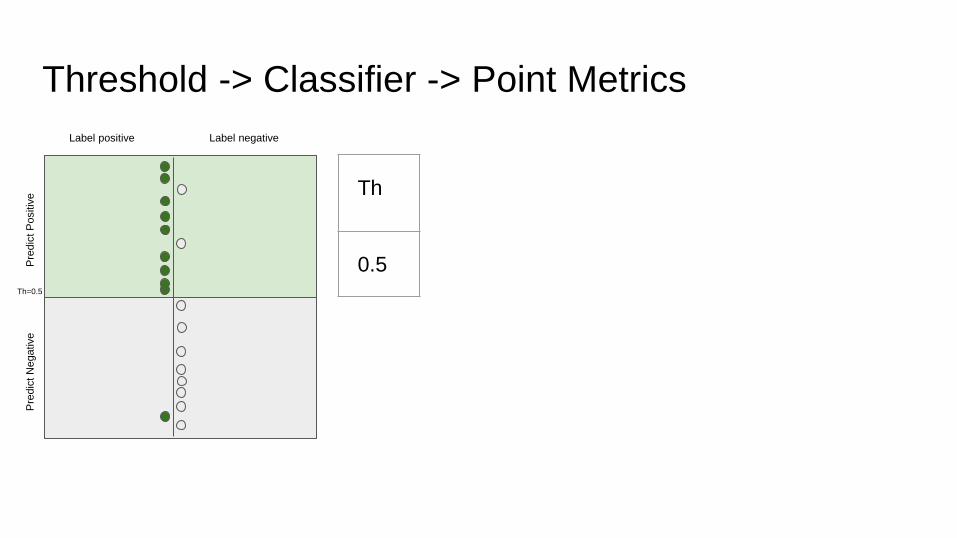
Threshold -> Classifier -> Point Metrics
Th=0.5
Th
0.5
Label positive Label negative
Pre
dic
t N
egative
P
redic
t P
ositiv
e
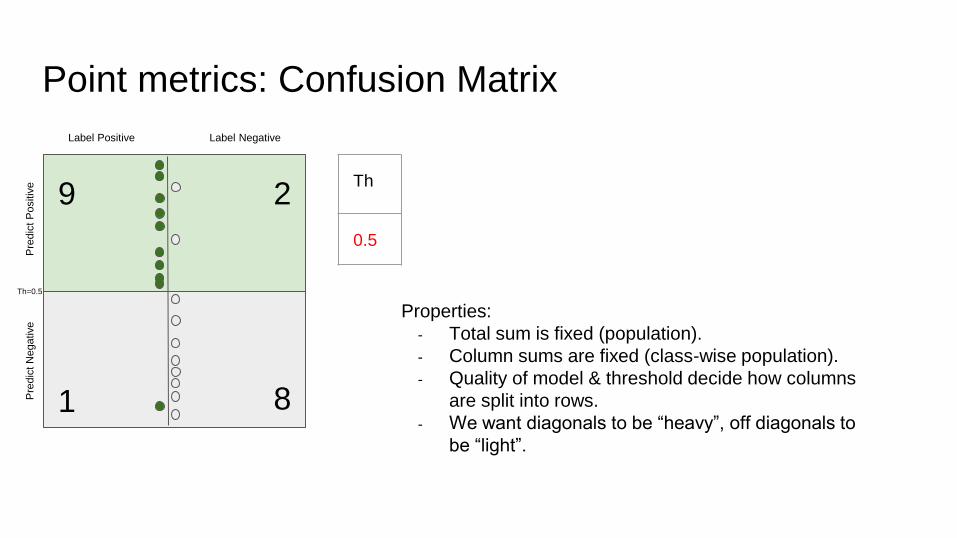
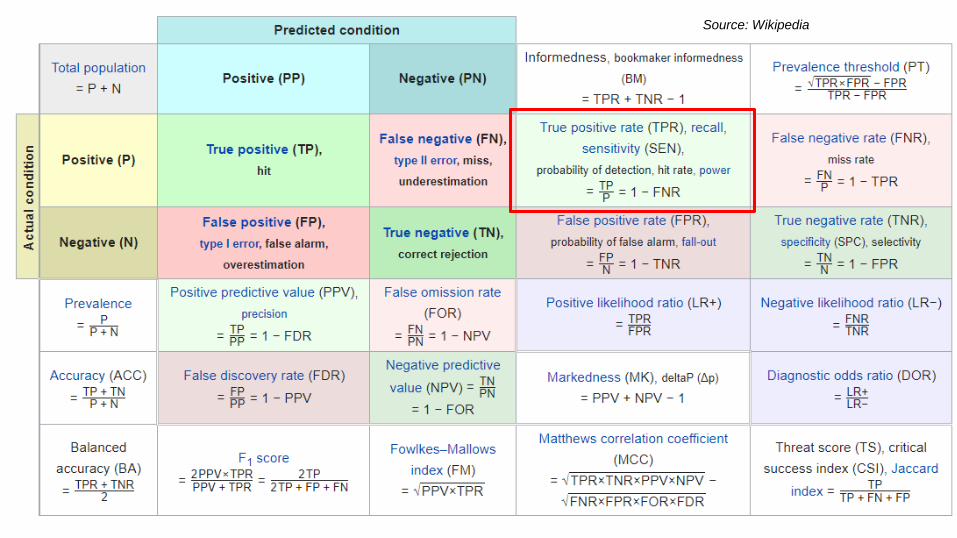
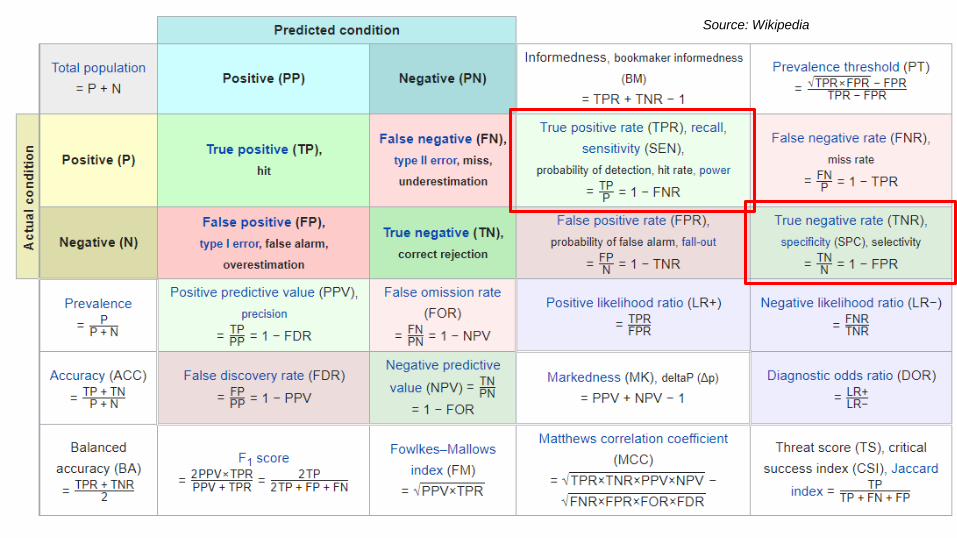
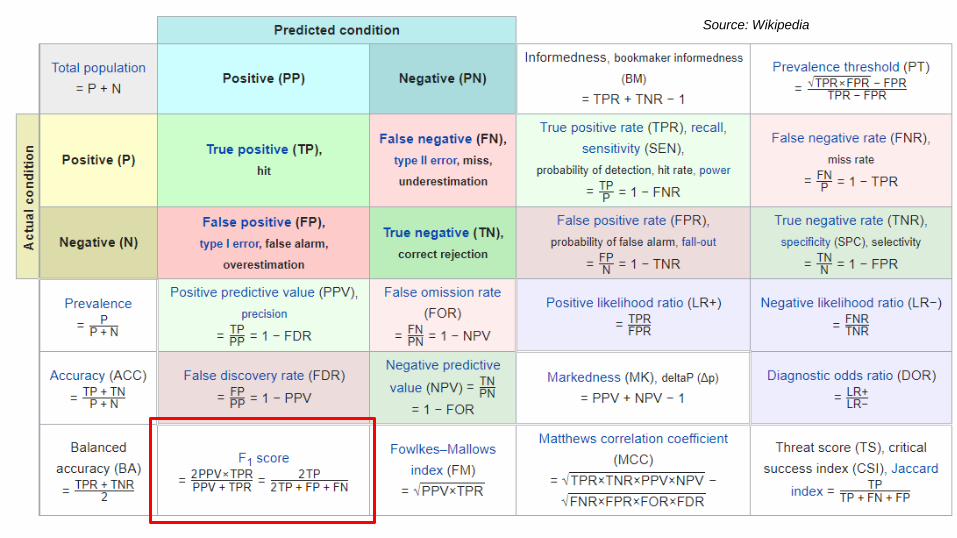
Point metrics: Confusion Matrix
Label Positive Label Negative
Pre
dic
t N
egative
P
redic
t P
ositiv
e
9
8
2
1
Th=0.5
Th
0.5
Properties:
- Total sum is fixed (population).
- Column sums are fixed (class-wise population).
- Quality of model & threshold decide how columns
are split into rows.
- We want diagonals to be “heavy”, off diagonals to
be “light”.
Source: Wikipedia
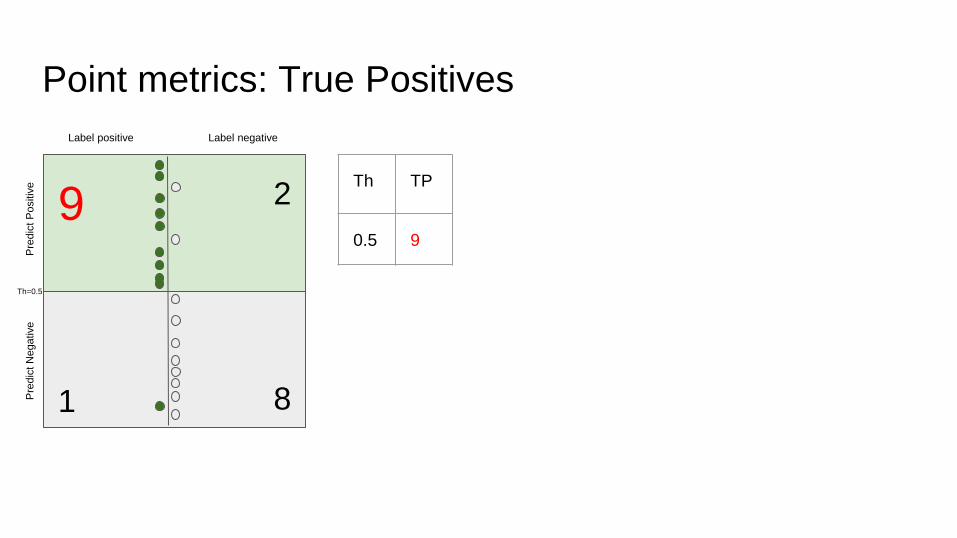
Point metrics: True Positives
Label positive Label negative
9
8
2
1
Th=0.5
Pre
dic
t N
egative
P
redic
t P
ositiv
e Th
0.5
TP
9
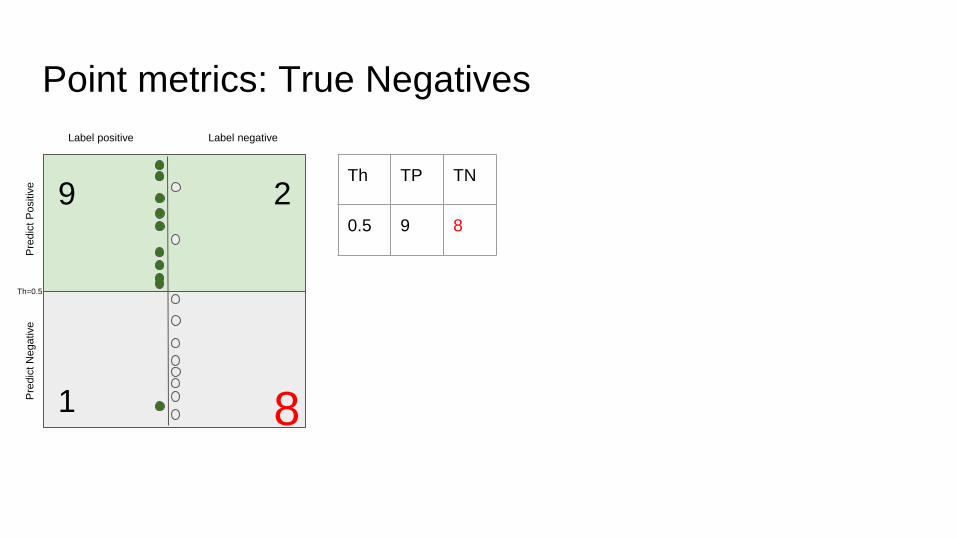
Point metrics: True Negatives
Label positive Label negative
9
8
2
1
Th=0.5
Th
0.5
TP
9
TN
8
Pre
dic
t N
egative
P
redic
t P
ositiv
e
Point metrics: False Positives
Label positive Label negative
9
8
2
1
Th=0.5
Pre
dic
t N
egative
P
redic
t P
ositiv
e
FP
2
Th
0.5
TP
9
TN
8
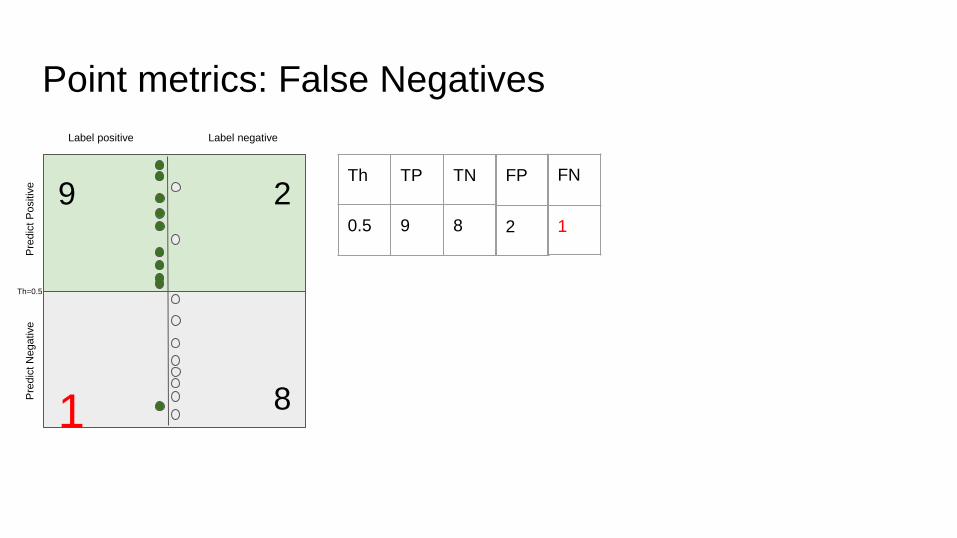
Point metrics: False Negatives
Label positive Label negative
9
8
2
1
Th=0.5
Pre
dic
t N
egative
P
redic
t P
ositiv
e
FP
2
Th
0.5
TP
9
TN
8
FN
1
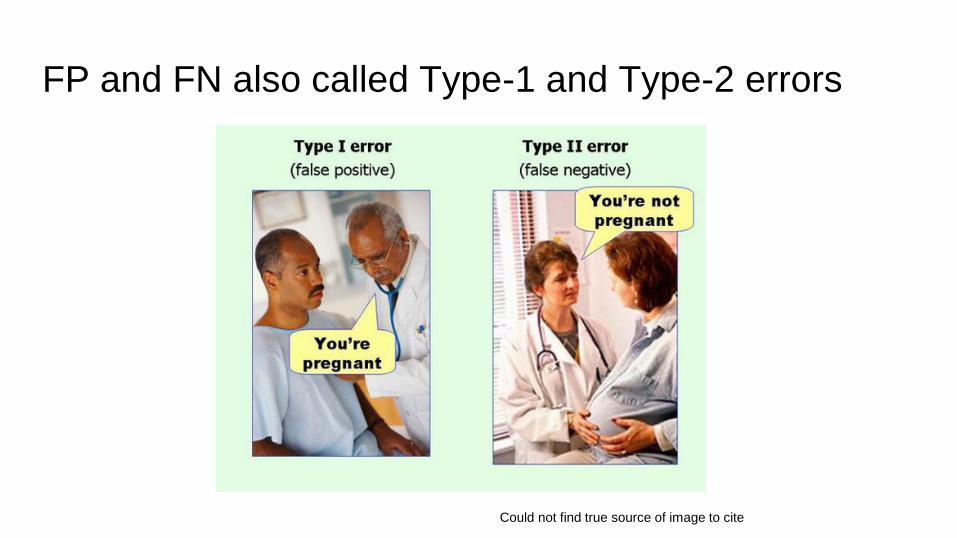
FP and FN also called Type-1 and Type-2 errors
Could not find true source of image to cite
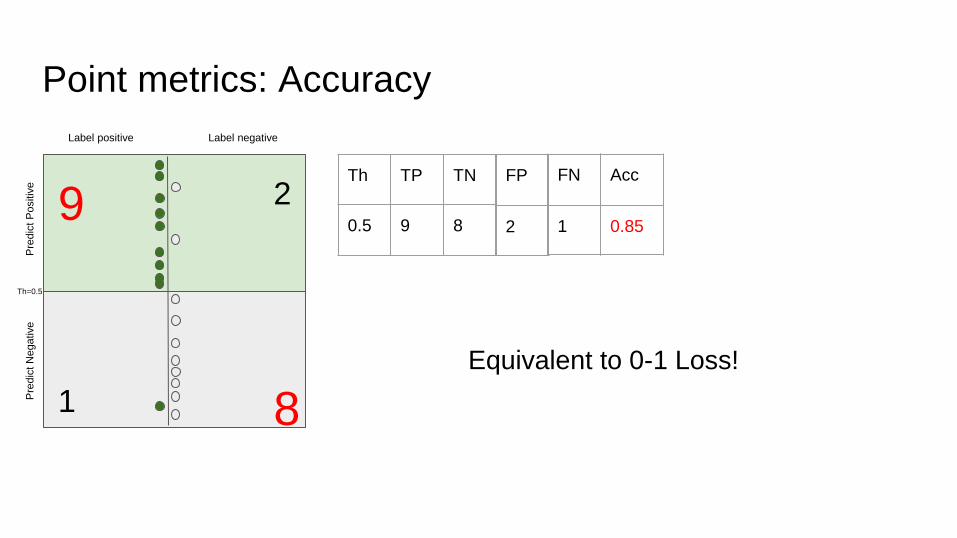
Point metrics: Accuracy
Label positive Label negative
9
8
2
1
Th=0.5
Pre
dic
t N
egative
P
redic
t P
ositiv
e
Equivalent to 0-1 Loss!
FP
2
Th
0.5
TP
9
TN
8
FN
1
Acc
0.85
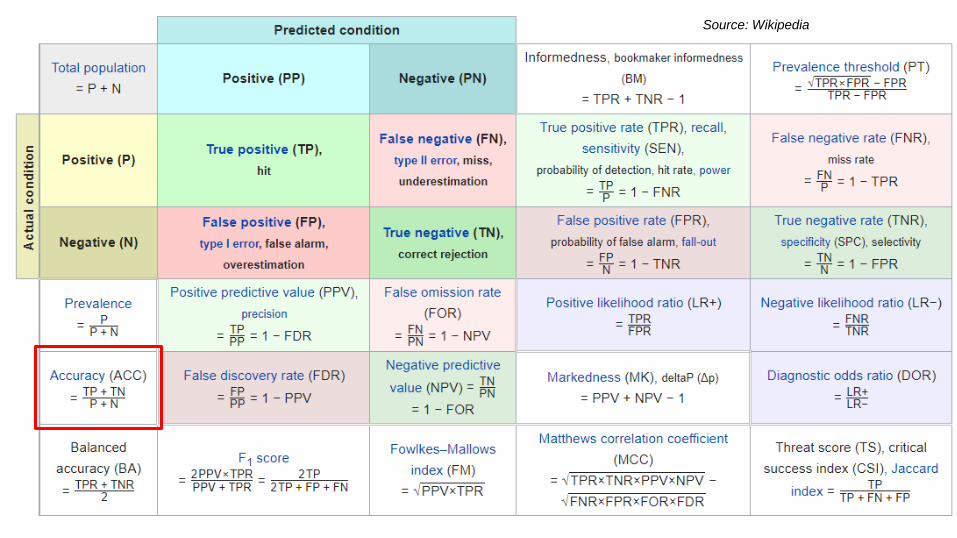
Source: Wikipedia

Point metrics: Precision
Label positive Label negative
9
8
2
1
Th=0.5
Pre
dic
t N
egative
P
redic
t P
ositiv
e
FP
2
Th
0.5
TP
9
TN
8
FN
1
Acc
0.85
Prec
0.81
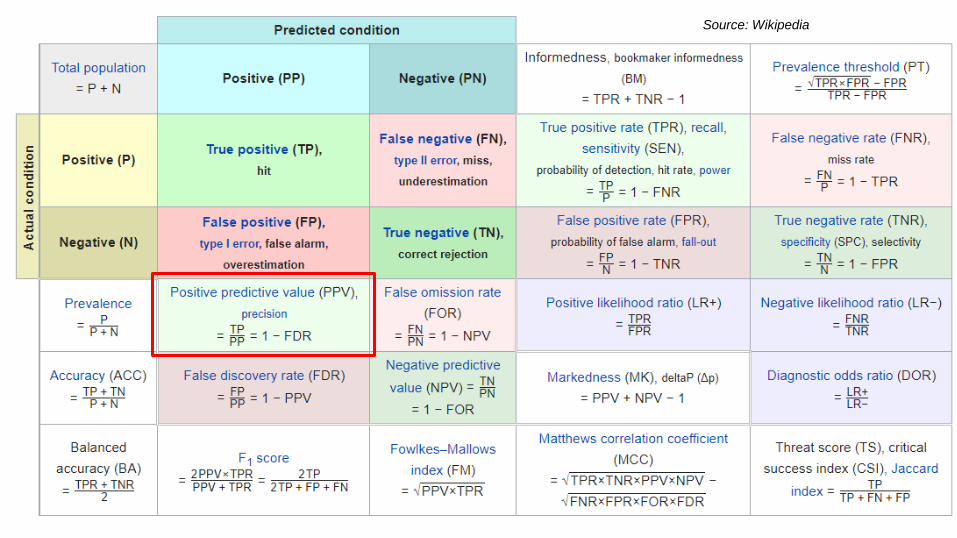
Source: Wikipedia
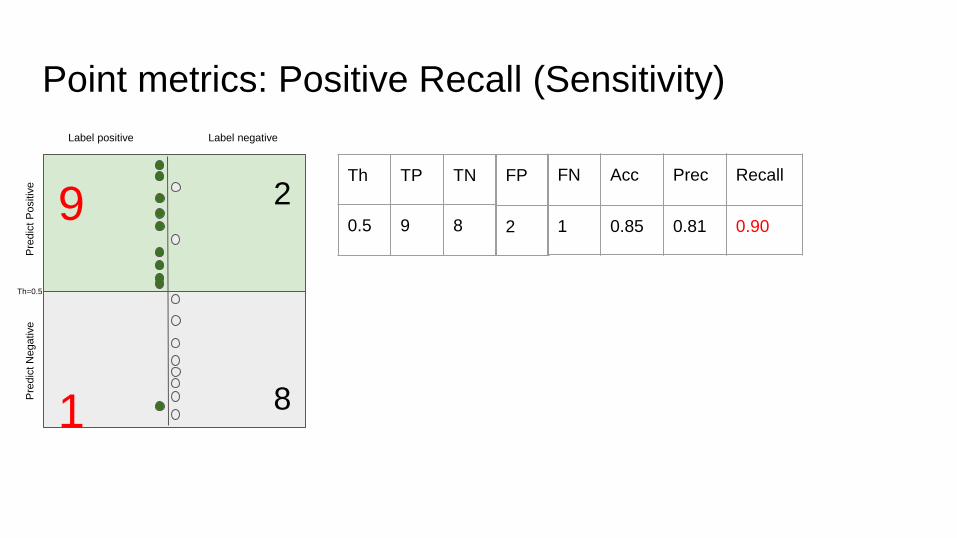
Point metrics: Positive Recall (Sensitivity)
Label positive Label negative
9
8
2
1
Th=0.5
Pre
dic
t N
egative
P
redic
t P
ositiv
e
FP
2
Th
0.5
TP
9
TN
8
FN
1
Acc
0.85
Prec
0.81
Recall
0.90
Source: Wikipedia
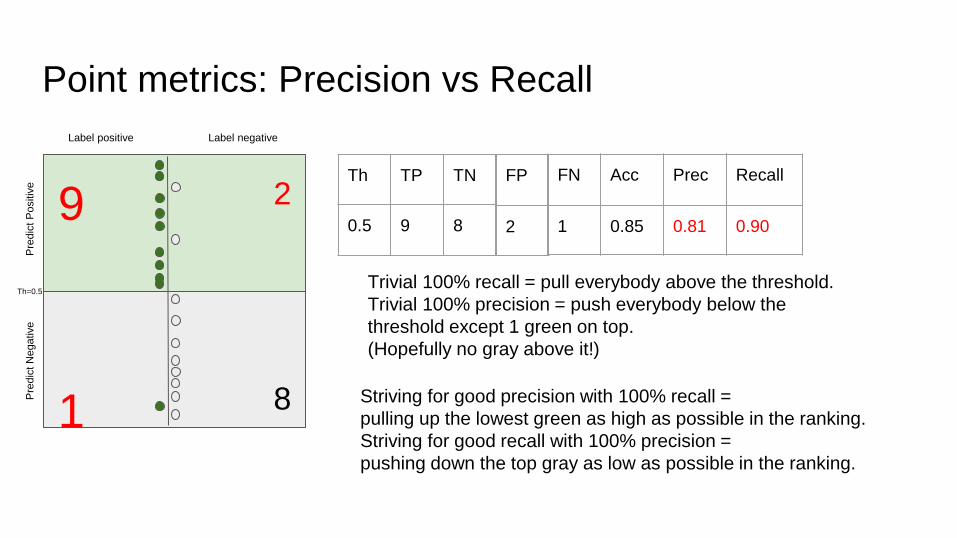
Point metrics: Precision vs Recall
Label positive Label negative
9
8
2
1
Th=0.5
Pre
dic
t N
egative
P
redic
t P
ositiv
e
Trivial 100% recall = pull everybody above the threshold.
Trivial 100% precision = push everybody below the
threshold except 1 green on top.
(Hopefully no gray above it!)
Striving for good precision with 100% recall =
pulling up the lowest green as high as possible in the ranking.
Striving for good recall with 100% precision =
pushing down the top gray as low as possible in the ranking.
FP
2
Th
0.5
TP
9
TN
8
FN
1
Acc
0.85
Prec
0.81
Recall
0.90
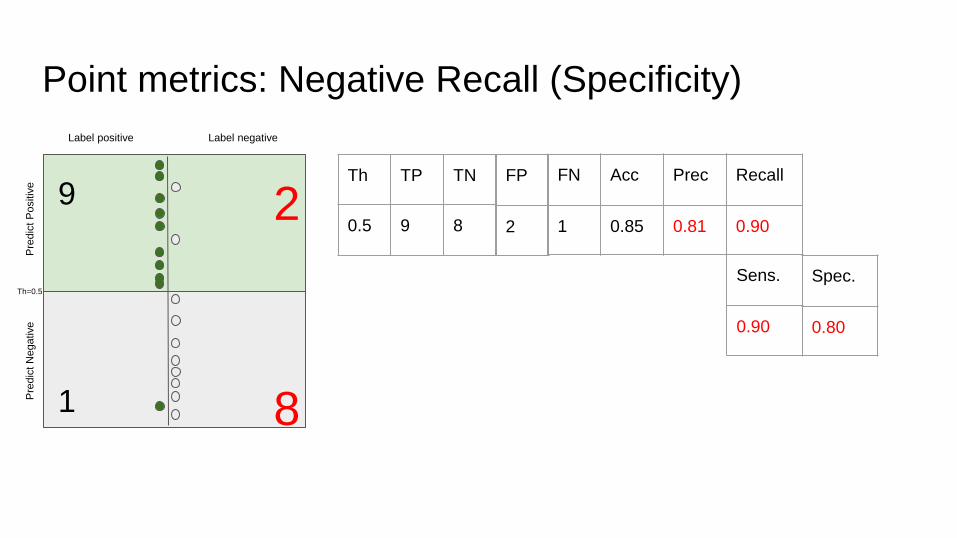
Point metrics: Negative Recall (Specificity)
Label positive Label negative
9
8
2
1
Th=0.5
Pre
dic
t N
egative
P
redic
t P
ositiv
e
FP
2
Th
0.5
TP
9
TN
8
FN
1
Acc
0.85
Prec
0.81
Recall
0.90
Sens.
0.90
Spec.
0.80
Source: Wikipedia
Point metrics: F1-score
Label positive Label negative
9
8
2
1
Th=0.5
Pre
dic
t N
egative
P
redic
t P
ositiv
e
FP
2
Th
0.5
TP
9
TN
8
FN
1
Acc
0.85
Prec
0.81
Recall
0.90
Sens.
0.90
Spec.
0.80
F1
0.857
Source: Wikipedia
Point metrics: Changing threshold
Label positive Label negative
7
8
2
3
Th=0.6
Pre
dic
t N
egative
P
redic
t P
ositiv
e
# effective thresholds = # examples + 1
FP
2
Th
0.6
TP
7
TN
8
FN
3
Acc
0.75
Prec
0.77
Recall
0.70
Sens.
0.70
Spec.
0.80
F1
0.733
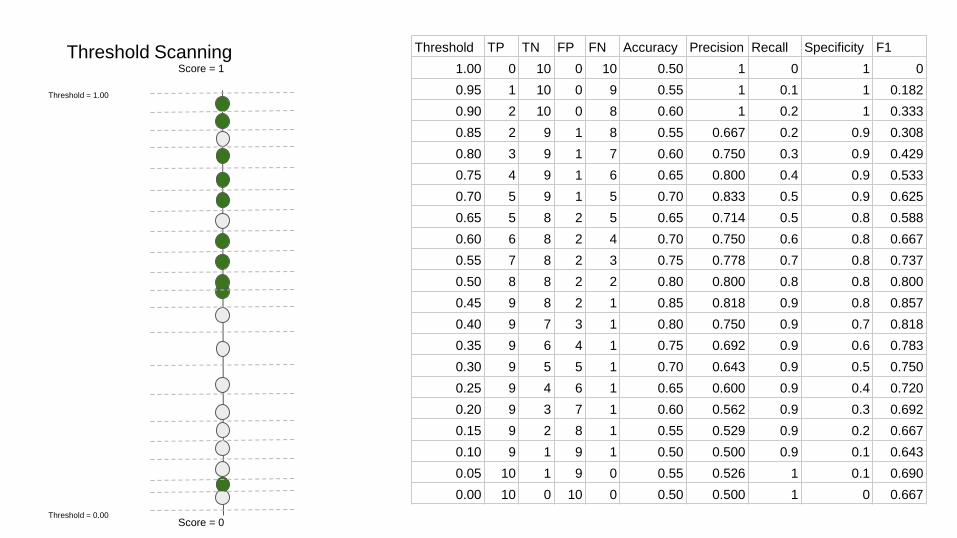
Threshold TP TN FP FN Accuracy Precision Recall Specificity F1
1.00 0 10 0 10 0.50 1 0 1 0
0.95 1 10 0 9 0.55 1 0.1 1 0.182
0.90 2 10 0 8 0.60 1 0.2 1 0.333
0.85 2 9 1 8 0.55 0.667 0.2 0.9 0.308
0.80 3 9 1 7 0.60 0.750 0.3 0.9 0.429
0.75 4 9 1 6 0.65 0.800 0.4 0.9 0.533
0.70 5 9 1 5 0.70 0.833 0.5 0.9 0.625
0.65 5 8 2 5 0.65 0.714 0.5 0.8 0.588
0.60 6 8 2 4 0.70 0.750 0.6 0.8 0.667
0.55 7 8 2 3 0.75 0.778 0.7 0.8 0.737
0.50 8 8 2 2 0.80 0.800 0.8 0.8 0.800
0.45 9 8 2 1 0.85 0.818 0.9 0.8 0.857
0.40 9 7 3 1 0.80 0.750 0.9 0.7 0.818
0.35 9 6 4 1 0.75 0.692 0.9 0.6 0.783
0.30 9 5 5 1 0.70 0.643 0.9 0.5 0.750
0.25 9 4 6 1 0.65 0.600 0.9 0.4 0.720
0.20 9 3 7 1 0.60 0.562 0.9 0.3 0.692
0.15 9 2 8 1 0.55 0.529 0.9 0.2 0.667
0.10 9 1 9 1 0.50 0.500 0.9 0.1 0.643
0.05 10 1 9 0 0.55 0.526 1 0.1 0.690
0.00 10 0 10 0 0.50 0.500 1 0 0.667
Score = 1
Score = 0Threshold = 0.00
Threshold = 1.00
Threshold Scanning
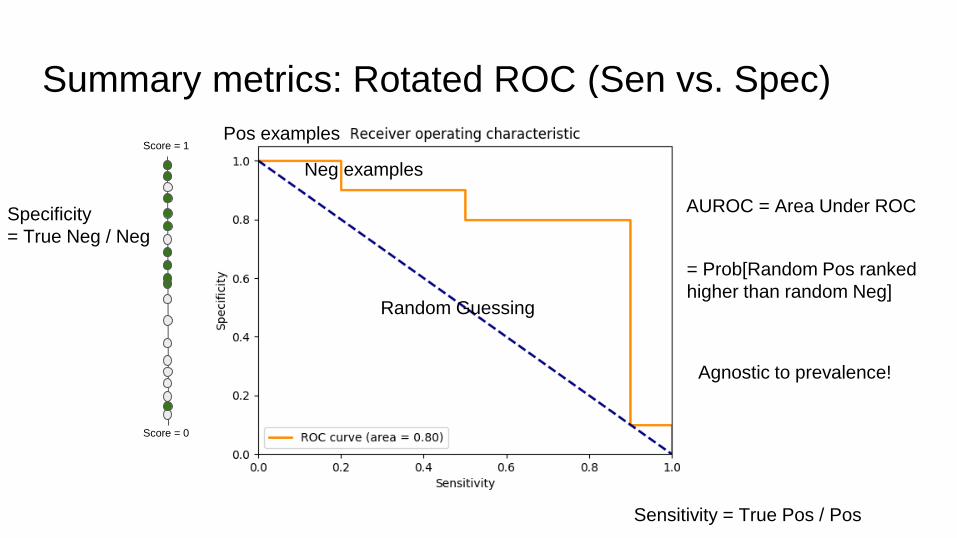
Summary metrics: Rotated ROC (Sen vs. Spec)
Score = 1
Score = 0
Sensitivity = True Pos / Pos
Specificity
= True Neg / Neg
Pos examples
Neg examples
Random Guessing
AUROC = Area Under ROC
= Prob[Random Pos ranked
higher than random Neg]
Agnostic to prevalence!
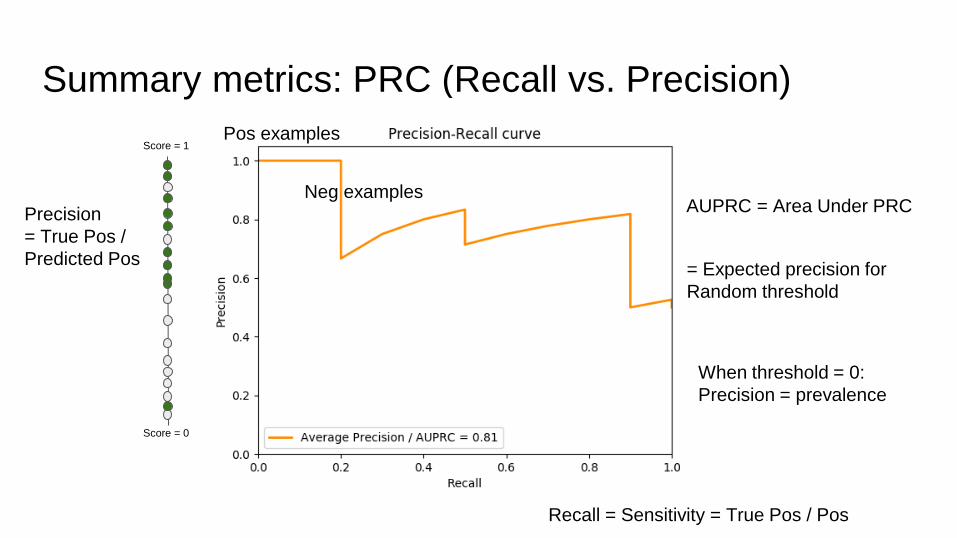
Summary metrics: PRC (Recall vs. Precision)
Score = 1
Score = 0
Recall = Sensitivity = True Pos / Pos
Precision
= True Pos /
Predicted Pos
Pos examples
Neg examplesAUPRC = Area Under PRC
= Expected precision for
Random threshold
When threshold = 0:
Precision = prevalence
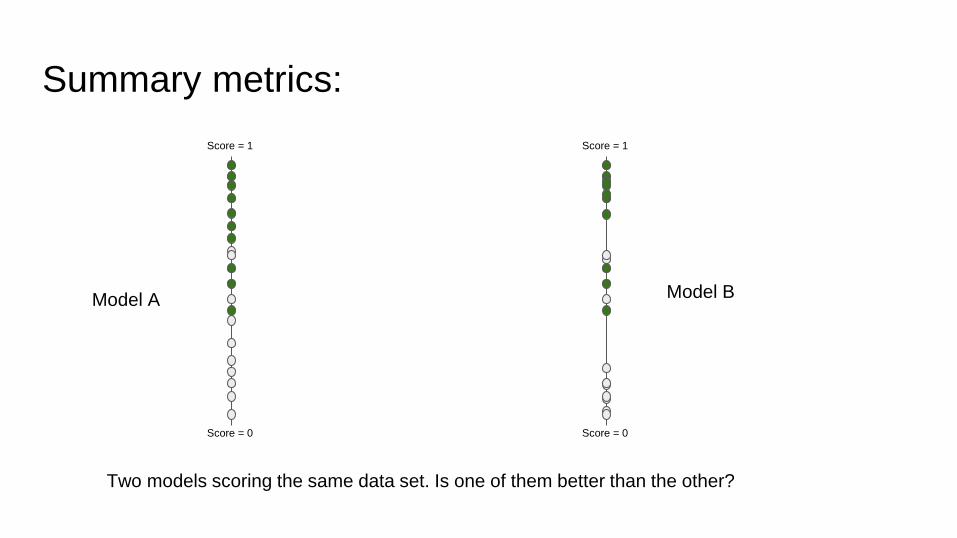
Summary metrics:
Score = 1
Score = 0
Score = 1
Score = 0
Two models scoring the same data set. Is one of them better than the other?
Model A Model B
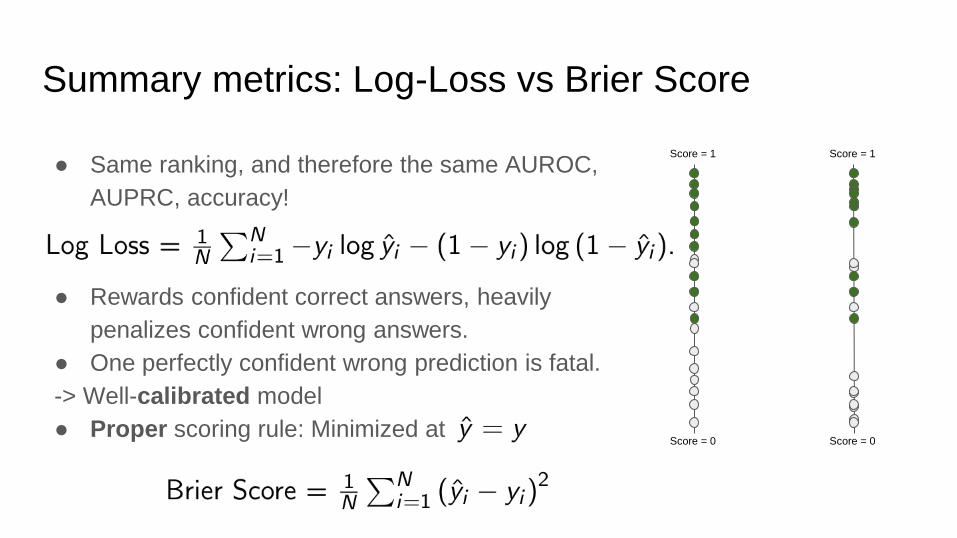
Summary metrics: Log-Loss vs Brier Score
● Same ranking, and therefore the same AUROC,
AUPRC, accuracy!
● Rewards confident correct answers, heavily
penalizes confident wrong answers.
● One perfectly confident wrong prediction is fatal.
-> Well-calibrated model
● Proper scoring rule: Minimized at
Score = 1
Score = 0
Score = 1
Score = 0
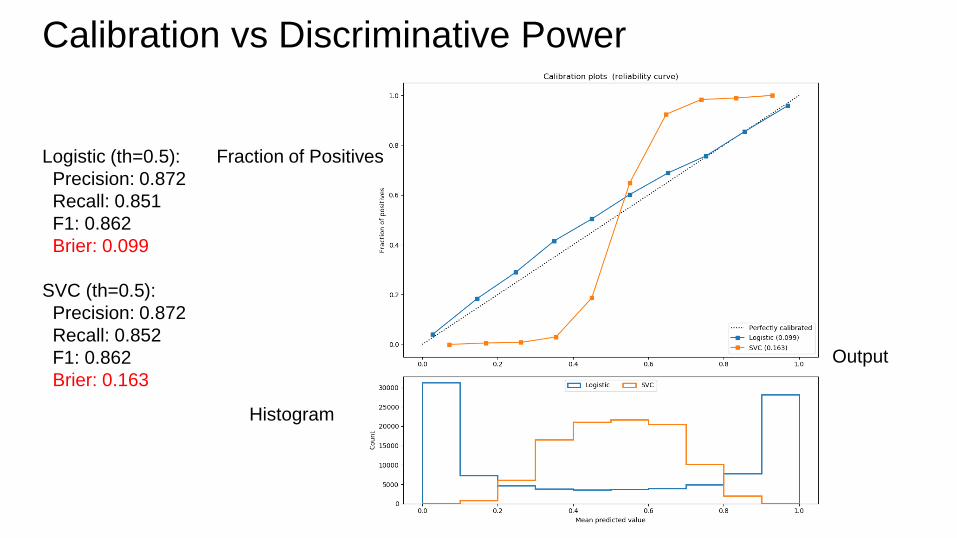
Calibration vs Discriminative Power
Logistic (th=0.5):
Precision: 0.872
Recall: 0.851
F1: 0.862
Brier: 0.099
SVC (th=0.5):
Precision: 0.872
Recall: 0.852
F1: 0.862
Brier: 0.163
Output
Fraction of Positives
Histogram
Unsupervised Learning
● Log P(x) is a measure of fit in Probabilistic models (GMM, Factor Analysis)
○ High log P(x) on training set, but low log P(x) on test set is a measure of overfitting
○ Raw value of log P(x) hard to interpret in isolation
● K-means is trickier (because of fixed covariance assumption)
Class Imbalance
Symptom: Prevalence < 5% (no strict definition)
Metrics: May not be meaningful.
Learning: May not focus on minority class examples at all
(majority class can overwhelm logistic regression, to a lesser extent SVM)
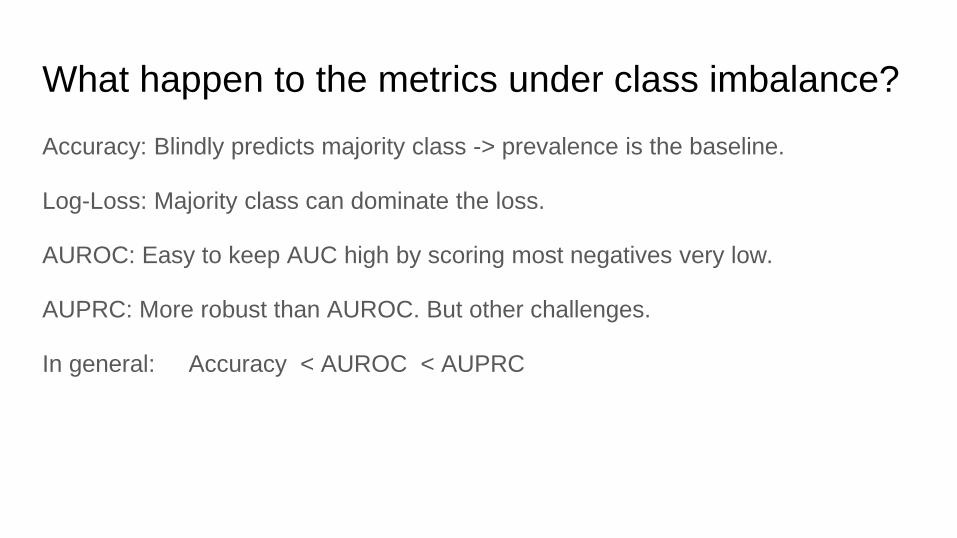
What happen to the metrics under class imbalance?
Accuracy: Blindly predicts majority class -> prevalence is the baseline.
Log-Loss: Majority class can dominate the loss.
AUROC: Easy to keep AUC high by scoring most negatives very low.
AUPRC: More robust than AUROC. But other challenges.
In general: Accuracy < AUROC < AUPRC
Score = 1
Score = 0
1%
1%
98%
Rotated ROC
Specificity
= True Neg / Neg
Sensitivity = True Pos / Pos
“Fraudulent”
AUC = 98/99
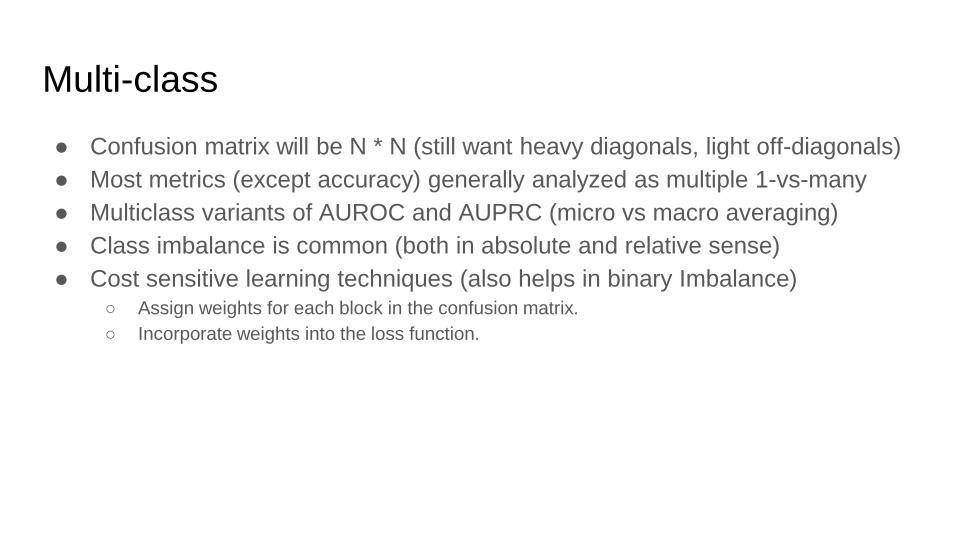
Multi-class
● Confusion matrix will be N * N (still want heavy diagonals, light off-diagonals)
● Most metrics (except accuracy) generally analyzed as multiple 1-vs-many
● Multiclass variants of AUROC and AUPRC (micro vs macro averaging)
● Class imbalance is common (both in absolute and relative sense)
● Cost sensitive learning techniques (also helps in binary Imbalance)○ Assign weights for each block in the confusion matrix.
○ Incorporate weights into the loss function.
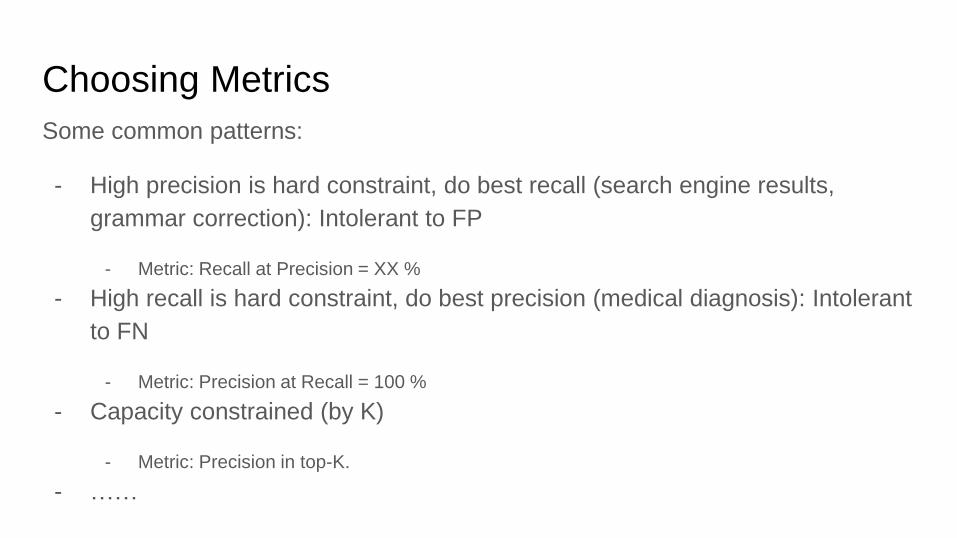
Choosing Metrics
Some common patterns:
- High precision is hard constraint, do best recall (search engine results,
grammar correction): Intolerant to FP
- Metric: Recall at Precision = XX %
- High recall is hard constraint, do best precision (medical diagnosis): Intolerant
to FN
- Metric: Precision at Recall = 100 %
- Capacity constrained (by K)
- Metric: Precision in top-K.
- ……

Thank You!


