
American Institute of Aeronautics and Astronautics
1
Evaluation of Alternative Altitude Scaling Methods for
Thermal Ice Protection System in NASA Icing Research
Tunnel
Sam Lee*
Vantage Partners, LLC, Cleveland, OH, 44135
Harold E. Addy, Jr.,† and Andy P. Broeren,‡
NASA Glenn Research Center, Cleveland, OH, 44135
and
David M. Orchard§
National Research Council, Ottawa, Canada
A test was conducted at NASA Icing Research Tunnel to evaluate altitude scaling methods
for thermal ice protection system. Two new scaling methods based on Weber number were
compared against a method based on Reynolds number. The results generally agreed with
the previous set of tests conducted in NRCC Altitude Icing Wind Tunnel where the three
methods of scaling were also tested and compared along with reference (altitude) icing
conditions. In those tests, the Weber number-based scaling methods yielded results much
closer to those observed at the reference icing conditions than the Reynolds number-based
icing conditions. The test in the NASA IRT used a much larger, asymmetric airfoil with an
ice protection system that more closely resembled designs used in commercial aircraft.
Following the trends observed during the AIWT tests, the Weber number based scaling
methods resulted in smaller runback ice than the Reynolds number based scaling, and the ice
formed farther upstream. The results show that the new Weber number based scaling
methods, particularly the Weber number with water loading scaling, continue to show
promise for ice protection system development and evaluation in atmospheric icing tunnels.
Nomenclature
AIWT = Altitude Icing Wind Tunnel
hG = Gas-phase convective mass transfer coefficient
K = Inertia parameter
K0 = Modified inertia parameter
IPS = Ice Protection System
IRT = Icing Research Tunnel
LWC = Liquid water content
M = Mach number
MVD = Median volumetric diameter
me = Evaporation rate
mw = Water loading
P = Static pressure
* Engineer IV, Icing Branch, 21000 Brookpark Rd., MS 11-2, AIAA Senior Member. † Aerospace Engineer, Icing Branch, 21000 Brookpark Rd., MS 11-2, AIAA Associate Fellow. ‡ Aerospace Engineer, Icing Branch, 21000 Brookpark Rd., MS 11-2, AIAA Associate Fellow. § Senior Research Officer, Aerospace, 1200 Montreal Road, M-17, AIAA Senior Member.
https://ntrs.nasa.gov/search.jsp?R=20170007898 2018-07-28T11:23:15+00:00Z

American Institute of Aeronautics and Astronautics
2
Pw = Partial pressure of vapor at free stream static conditions
Pww = Partial pressure of vapor at the surface
Pr = Prandtl number
qc = Convective heat transfer
qHA = IPS heat input
r = Aifoil model leading edge radius
Re = Reynolds number
Re2r = Reynolds number based on 2x leading edge radius
Re = Reynolds number based on water droplet median volumetric diameter
Tr = Recovery temperature
Ts = Static temperature
Tsurf = Surface temperature
Tt = Total temperature
We = Weber number
WeDA = Air density based Weber number
WeDW = Water density based Weber number
V = Airspeed
= Angle of attack
= Water droplet median volumetric diameter
a = Air viscosity
= Dimensionless scaling parameter (mw/me)
a = Air density
w = Water density
I. Introduction
ne of the most commonly used methods of ice protection on the leading edge aircraft wing is the thermal Ice
Protection System (IPS). However, because this method is energy intensive, it is often operated as a “running
wet” system where impinging water is not fully evaporated but allowed to runback and refreeze at non-critical
locations. In order to evaluate a “running wet” system, accurate modelling of the entire icing process is required.
Currently most of the research and development of thermal ice protection systems is done in atmospheric icing
wind tunnels that cannot simulate the effects of higher altitude at which these systems operate at. Therefore, the effects
of higher altitude must be approximated using scaling techniques. Various methods of scaling for altitude effects have
been proposed and used.1,2,3,4 However, a better understanding of the processes involved in thermal IPS operation at
altitude is needed to develop a validated and more widely accepted altitude scaling method.
National Aeronautics and Space Administration (NASA) and the National Research Council Canada (NRCC)
conducted a joint research program to study the issues related to altitude scaling of thermal ice protection systems. NRCC
provided test time in the Altitude Icing Wind Tunnel (AIWT) in Ottawa, Canada for three test campaigns in 2012,
2014, and 2015. The AIWT produces aircraft inflight icing conditions over a range of air speeds, temperatures, and
pressure altitudes as well as inflight icing cloud densities and droplet sizes. NASA provided an 18-inch chord NACA
0018 model equipped with a simple piccolo tube heated-air IPS. The model was instrumented such that heated-air flow
rates and temperatures as well as the surface temperatures of the leading edge could be monitored.
A. 2012 AIWT Campaign
The method used for the first AIWT campaign to scale test conditions so as to achieve similarity between altitude
and ground level was based largely on a method that has some acceptance in the aviation industry.1 Briefly, the
method identifies four key scaling parameters, and then other test conditions were varied so as to keep the four key
parameters constant between altitude and ground level. The four key parameters were: Reynolds number, water
loading, inertia parameter, and recovery temperature.
This scaling method was investigated during the first AIWT campaign by using the tunnel’s altitude capability to
provide reference conditions to which the scaled conditions could be compared. The AIWT was run without its
vacuum system operating to obtain the scaled conditions. Three sets of aircraft icing scenarios were selected for the
tests. They were designated: Warm Hold, Cold Hold, and Descent.
O

American Institute of Aeronautics and Astronautics
3
Details of the first AIWT campaign are presented in Addy, et al.5 A summary of the results is as follows:
1) Airfoil surface temperatures and thermal IPS heat energy use were well matched between altitude and
corresponding ground-level conditions. This comparison was particularly good for dry-air conditions
where the icing cloud was not activated but Reynolds-number matching dictated differing air speeds and
air temperatures. The comparison was also very good for the wet-air conditions where the icing cloud was
activated, but not as close as the dry-air conditions.
2) For two of the three scenarios, Warm Hold and Descent, the amount of ice accreted as well as its location
on the airfoil was not well matched. For these scenarios, more ice was accreted at the ground-level cases
and it froze farther aft on the airfoil surface. The Cold Hold results were somewhat inconclusive because
difficulties during the test complicated execution of the reference and scaled cases for this scenario and
other test priorities and limitations precluded repeating the test cases. Other complications arose in setting
icing conditions in the tunnel for the Warm Hold and Descent scenarios which resulted in more uncertainty
than was expected. The differences in the ice accretions for these scenarios were, however, more than
could be explained by the increased uncertainty. The differences in ice mass and location were so
pronounced that it was clear that the thermal IPS scaling method used was inadequate and unable to be
effectively employed to accurately predict runback ice accretion when testing at ground-level conditions
for at least a considerable range of flight scenarios.
3) During running-wet thermal IPS operation, water flowed aft in the form of drops and rivulets to areas
where conditions permitted freezing. In these areas, both ice and liquid water were observed with the
liquid water in the form of drops on top of the ice. Periodically, the drops would disappear. Instead of
entirely evaporating or freezing in place, water may have been being re-entrained in the air flow. Such
water transport had not been considered in the scaling method.
B. 2014 AIWT Campaign
The results of the initial test campaign indicated that matching Weber numbers between reference and scale was
worthy of investigation. Several variations of the Weber number were considered during post-test analysis of the data.
Because the Weber number based on air speed, density of water, and leading edge diameter showed best correlation
with ice mass lost, it was used as a scaling parameter for the second test campaign.
Matching this form of the Weber number between altitude and ground-level conditions yielded scaled airspeeds
that were close to the reference condition airspeeds. The resulting Reynolds numbers were much higher at ground-
level than at altitude conditions and, therefore, the heat transfer from the airfoil surface to the exterior airflow was
expected to be much higher than at the altitude condition. With higher heat transfer rates, lower airfoil surface
temperatures and more freezing of runback ice was to be expected.
To counter the elevated convective heat transfer that was expected to occur, the heat energy provided by the
thermal IPS was increased. This was done by increasing the thermal IPS air temperature and/or flowrate so as to
match the airfoil leading edge surface temperatures when operating at the reference conditions. Since initial campaign
results showed that Reynolds number scaling produced surface temperatures that are closely matched between altitude
and ground level, surface temperatures obtained when operating at ground-level, Reynolds number-scaled conditions
could also be used.
This scaling process, then, required two steps: 1) a test run with Reynolds number scaling to achieve heat transfer
similarity and, therefore, surface temperatures for use in the second step and 2) a test run with Weber number scaling
to get ice accretion similarity with a reset thermal IPS to obtain the surface temperatures of the first step. The Weber
scaling step assumed water re-entrainment is a major contributor to the difference in accreted ice between reference
and Reynolds number scaled conditions as was seen in the initial tests. For each step, scaling of water loading, inertia
parameter, and recovery temperature were done to ensure similarity of these parameters to the reference conditions.
They have no significant effect on either Reynolds or Weber numbers.
The second AIWT campaign, then, consisted of tests run at altitude, Reynolds number-scaled, and Weber number-
scaled with surface temperature matched conditions. Like the first campaign, Warm Hold, Cold Hold, and Descent
icing scenarios were used to set reference conditions. Details of the second campaign and discussion of the test are
given in Addy, et al.6 In summary, the results of the second campaign were:
1) As was the case in the initial test campaign, Reynolds number scaling produced close matching of airfoil
surface temperatures, heated air inlet and outlet temperatures, and energy use rates between the reference and
scaled conditions. This showed again that the Reynolds number scaling method works well in matching the
heat transfer between altitude and ground level conditions.

American Institute of Aeronautics and Astronautics
4
2) Use of Weber number scaling produced ice accretions that were much closer, in terms of amount, location,
and shape of ice, to those formed at the reference or altitude conditions. The Weber number based on the
density of water was used in this test campaign. Airfoil surface temperatures were also matched between
reference and scale conditions through the increase of heat energy supplied by the IPS.
3) This Weber number scaling method requires two steps when using an atmospheric icing wind tunnel: the first
step is running at Reynolds number scaled conditions to determine the correct (altitude) surface temperatures.
The second step is to run at Weber number scaled condition while adjusting the IPS to match the surface
temperatures obtained in step one.
4) The increased heat transfer occurring at Weber number scaling conditions does, however, have an effect on
the runback ice formation, particularly at low air temperatures such as those of the cold hold icing scenario.
The ice freezes further forward on the model, but is not well adhered to the model surface that is being warmed
underneath by the IPS.
5) The new, two-step altitude scaling method evaluated as part of the second campaign provided a way of
evaluating both the heat transfer and mass transfer performance of a thermal ice protection system that does
not rely on the application of empirical correction factors, but instead relies on the straightforward application
of the primary physics involved.
C. 2015 AIWT Campaign
Results from the second AIWT campaign showed that Weber number was an important parameter for scaling
aircraft icing conditions between altitude and atmospheric icing wind tunnel pressures. The test data were then further
examined with the intent of finding other similarity parameters that may be of significance. In addition to water
droplet re-entrainment, water evaporation from a heated aircraft surface at altitude is a mode of mass transport to
consider further. Like water re-entrainment, there is no method available to experimentally measure the amount or
rate of water evaporation during IPS operation in aircraft icing conditions. A physical relationship that has been used
for quite some time in performing mass balance calculations for unprotected surfaces in icing condition is:
me = hG ( Pww-Pw
P)
where me is the mass of water evaporated, hG is the gas-phase convective mass transfer coefficient, Pww is the partial
pressure of water vapor at the surface, Pw is the partial pressure of water vapor at free stream static conditions, and P
is the static pressure. Although it has been noted that this equation may not be valid for heated surfaces, there is no
reason to believe that it may not be a reasonable approximation.
To form a non-dimensional similarity parameter, the ratio of water loading to mass evaporation was used. Full
details of the analysis of the data from the second campaign are given in Orchard, et al.7 In the post-test analysis of
the second AIWT campaign, a relationship between the ratio of water loading to water evaporation and the rate of ice
accretion was found. Further analysis of the data considered convective heat transfer from the surface and Weber
number based on air density. Ice accretion rate was found to be proportional to a factor composed of the ratio of
water loading to water evaporation, convective heat transfer, and Weber number based on air density.
In a separate, parallel investigation,7 dimensional analysis was used to find other parameters that may be of
importance in scaling icing conditions for thermal IPS testing in atmospheric wind tunnels. The investigation started
by assuming that ice accretion rate was a function of thirteen variables: airspeed, water loading, leading edge diameter,
total temperature, surface temperature, air density, convective heat transfer, heat energy from IPS, air viscosity, surface
tension of water, water evaporation, and dynamic pressure. A conventional dimensional analysis technique was used
in conjunction with prior test results to produce the following dimensionless parameters of significance:
1) π1 = WeDA
2) π2 = Re
3) π3 = mw/me
4) π4 = qc/qHA
5) π5 = Tsurf/Tt

American Institute of Aeronautics and Astronautics
5
Of these parameters, π1, π2, π4, and π5 were taken into account in the first two campaigns. In those campaigns, however,
water loading, mw, was used by itself as a scaling parameter and held constant between altitude and ground level
conditions. For many years in situations where scaling of icing conditions is necessary, it has been recognized that
water loading must be constant between the reference and scaled condition in order to achieve icing similarity. The
idea of scaling it so as to keep the ratio of mw/ me is new. It provides a means by which the increased water evaporation
occurring at altitude conditions may be compensated for in an atmospheric icing tunnel.
This new scaling method (WePi3), then, matches inertia parameter, recovery temperature of the air stream, model
surface temperatures, Weber number based on air density, and the ratio of water loading to water evaporation. A two-
step sequence of first matching Reynolds numbers to obtain target surface temperatures on the model would need to
be used in an atmospheric tunnel. This scaling method was tested in the third AIWT test campaign. Again, a set of
reference icing flight scenarios, designated Warm Hold, Cold Hold, and Descent, were used. Details of this test
campaign are given in Orchard, et al.7 A summary of the results is presented below:
1) Results showed that the new scaling method, using matched WeDA and π3, yielded ice accretions similar
to those accreted at altitude conditions; much better than those accreted using the Re scaling method.
The ice accretions formed using the WeDA and π3 showed about the same agreement with those formed
at altitude conditions as did the ones formed using the WeDW method used during the second AIWT
campaign. There was, however, less of an effect on the ice of enhanced cooling in the Cold Hold scenario
due to the lower Reynolds numbers generated using WeDA matching instead of WeDW.
2) The agreement in ice accretions between scaled and altitude conditions indicated that scaling water
loading is a valid technique.
3) Photographs of ice accretions showing strong evidence that water droplet re-entrainment does occur was
documented.
D. 2016 IRT Campaign
The tests conducted at AIWT were very valuable in developing and evaluating various altitude scaling methods
for thermal ice protection systems, as well as developing a better understanding of the processes involved in runback
icing and their relative importance. A follow-on test was conducted in NASA Icing Research Tunnel using a much
larger business jet-class airfoil model and an ice protection system more similar to those found in commercial aircraft.
This paper presents the results of the test conducted in the IRT.
The IRT is an atmospheric tunnel that cannot simulate altitude (reference) conditions. Therefore, ice accretions
obtained using the various scaling methods cannot directly be compared to those obtained at the reference conditions.
However, the ice shapes from the various scaling methods are compared to one another, and the trends were compared
to the results observed in AIWT tests where the altitude reference conditions were run.
II. Experimental Setup
The test was conducted in the Icing Research Tunnel (IRT) at NASA Glenn Research Center in Cleveland, Ohio.
The test section has width of 9 ft., height of 6 ft., and length of 20 ft. It is capable of speeds of up to 390 mph and the
test section total temperature can be controlled between of -20° to 33° F. It is capable of generating a significant
portion of FAA Appendix C icing envelope. More details on the facility can be found in Soeder, et al.8
A. Model
The model used for this study was a 60-inch chord, 72-inch span 2D airfoil representative of a modern business
jet, as shown in Fig. 1. It was built and used in 2006 in the IRT as part of an IPS analysis and modelling study
performed by the Wichita State University under grants from the FAA and NASA.4 The model was constructed out
of aluminum with the outside surface polished to a mirror finish. It was fabricated with two removable leading edges:
an unheated leading edge and a heated leading edge. The unheated leading edge was instrumented with surface
pressure taps for aerodynamic measurements. The heated leading edge contained a piccolo tube ice protection system
as well as instrumentation for thermal studies. The holes on the piccolo tube were arranged in a diamond pattern, and
the diffuser section was backed by an inner-liner skin, as shown in Fig. 2. The hole pattern extended 5.5 ft. of the
length of the piccolo tube. The skin was constructed out of a single sheet of aluminum and had a thickness of 0.10 in.

American Institute of Aeronautics and Astronautics
6
Figure 1. Business jet model coordinates.
Figure 2. IRT model ice protection system cross section. (from Papadakis, et al.4)
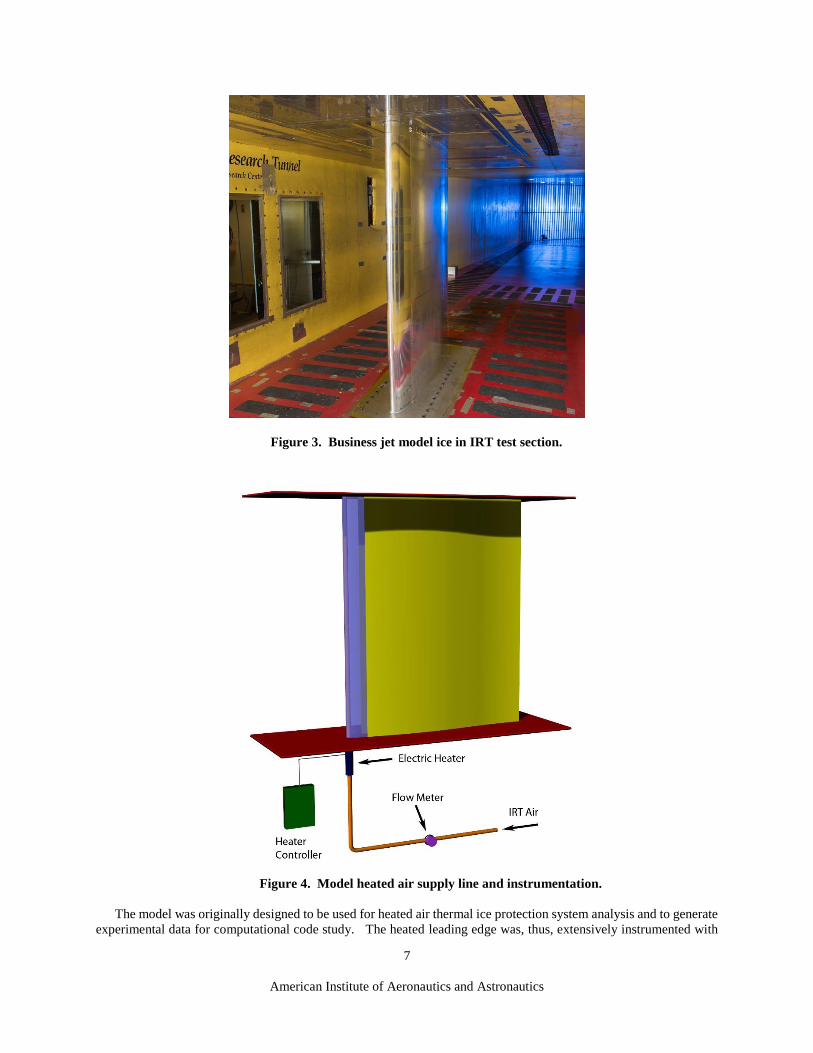
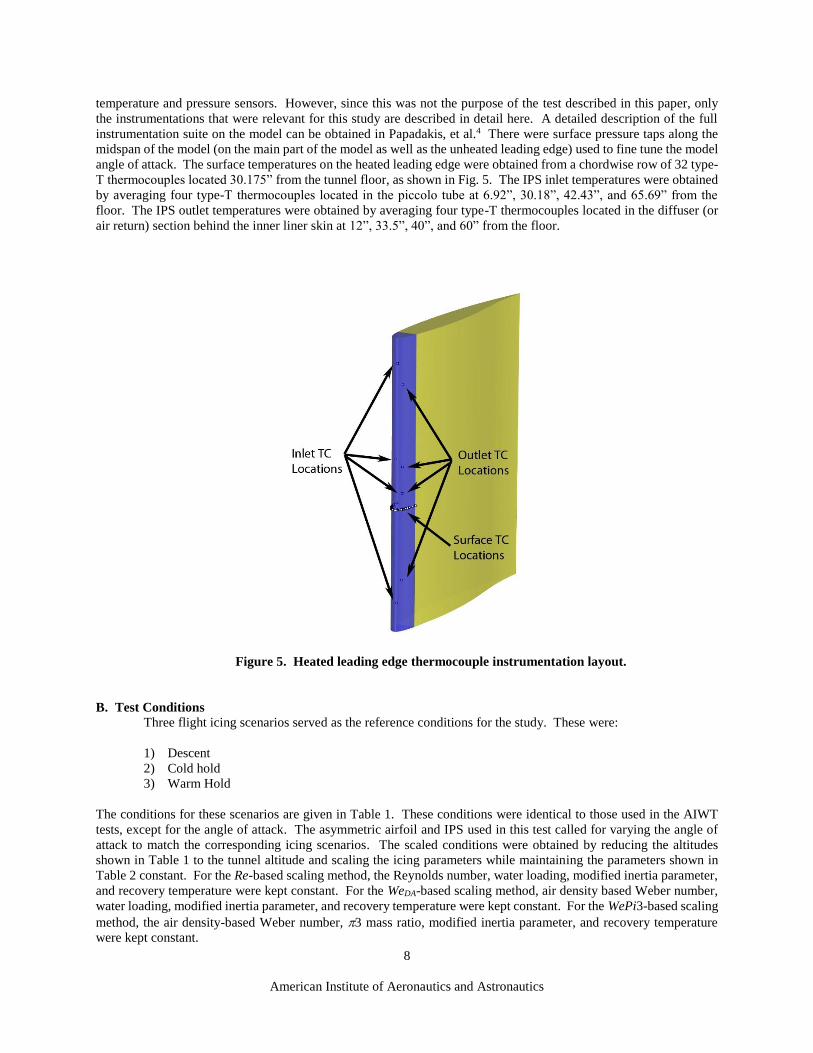
The model was mounted vertically in the test section on the turntable that was used to set the angle of attack, as
shown in Fig. 3. The IRT hot air system provided the preheated pressurized air for the piccolo tube as shown in Fig.
4. A Micromotion CMF200M coriolis mass flow meter was used to measure the heated air flow rate. An electric
heater located just below the tunnel floor was used to accurately control the inlet temperature of the piccolo tube.
x (in)
0 10 20 30 40 50 60
American Institute of Aeronautics and Astronautics
7
Figure 3. Business jet model ice in IRT test section.
Figure 4. Model heated air supply line and instrumentation.
The model was originally designed to be used for heated air thermal ice protection system analysis and to generate
experimental data for computational code study. The heated leading edge was, thus, extensively instrumented with
American Institute of Aeronautics and Astronautics
8
temperature and pressure sensors. However, since this was not the purpose of the test described in this paper, only
the instrumentations that were relevant for this study are described in detail here. A detailed description of the full
instrumentation suite on the model can be obtained in Papadakis, et al.4 There were surface pressure taps along the
midspan of the model (on the main part of the model as well as the unheated leading edge) used to fine tune the model
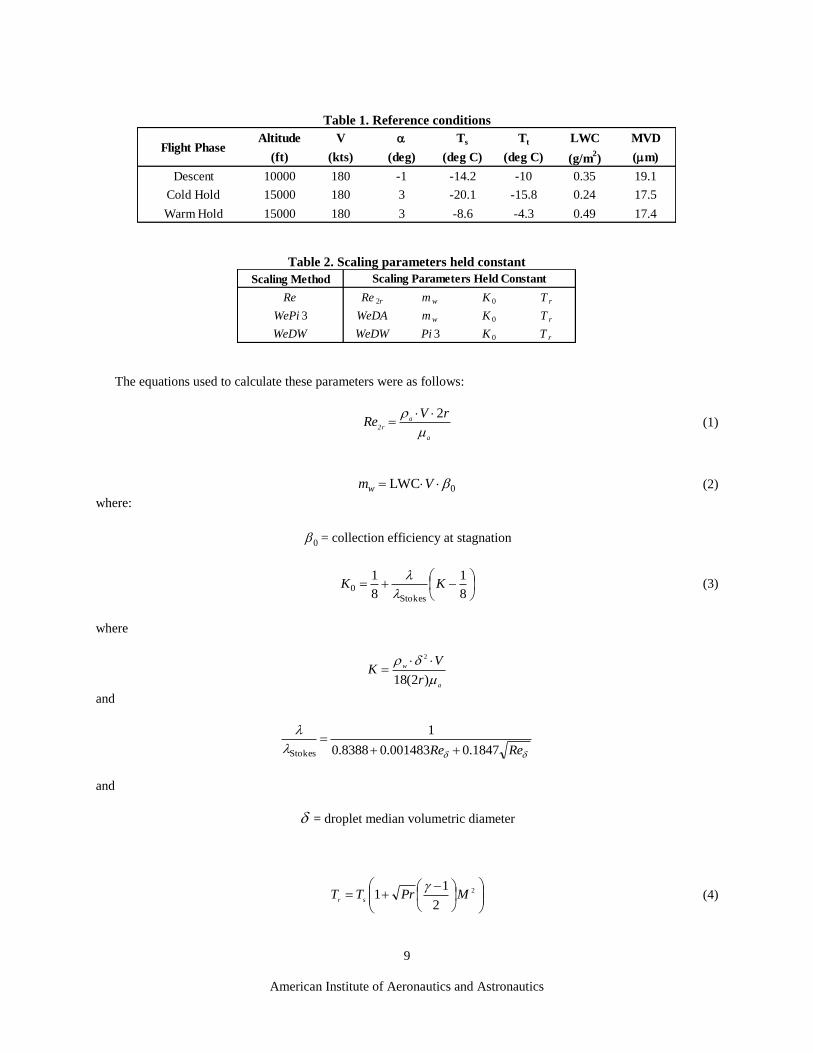
angle of attack. The surface temperatures on the heated leading edge were obtained from a chordwise row of 32 type-
T thermocouples located 30.175” from the tunnel floor, as shown in Fig. 5. The IPS inlet temperatures were obtained
by averaging four type-T thermocouples located in the piccolo tube at 6.92”, 30.18”, 42.43”, and 65.69” from the
floor. The IPS outlet temperatures were obtained by averaging four type-T thermocouples located in the diffuser (or
air return) section behind the inner liner skin at 12”, 33.5”, 40”, and 60” from the floor.
Figure 5. Heated leading edge thermocouple instrumentation layout.
B. Test Conditions
Three flight icing scenarios served as the reference conditions for the study. These were:
1) Descent
2) Cold hold
3) Warm Hold
The conditions for these scenarios are given in Table 1. These conditions were identical to those used in the AIWT
tests, except for the angle of attack. The asymmetric airfoil and IPS used in this test called for varying the angle of
attack to match the corresponding icing scenarios. The scaled conditions were obtained by reducing the altitudes
shown in Table 1 to the tunnel altitude and scaling the icing parameters while maintaining the parameters shown in
Table 2 constant. For the Re-based scaling method, the Reynolds number, water loading, modified inertia parameter,
and recovery temperature were kept constant. For the WeDA-based scaling method, air density based Weber number,
water loading, modified inertia parameter, and recovery temperature were kept constant. For the WePi3-based scaling
method, the air density-based Weber number, 3 mass ratio, modified inertia parameter, and recovery temperature
were kept constant.
American Institute of Aeronautics and Astronautics
9
Table 1. Reference conditions
Table 2. Scaling parameters held constant
The equations used to calculate these parameters were as follows:
a
a
2r
rVRe
2 (1)
0LWC Vmw (2)
where:
0 = collection efficiency at stagnation
8
1
8
1
Stokes0 KK
(3)
where
a
w
r
VK
)2(18
2
and
ReRe 1847.0001483.08388.0
1
Stokes
and
= droplet median volumetric diameter
2
2
11 MPrTT
sr
(4)
Altitude V Ts Tt LWC MVD
(ft) (kts) (deg) (deg C) (deg C) (g/m2) (m)
Descent 10000 180 -1 -14.2 -10 0.35 19.1
Cold Hold 15000 180 3 -20.1 -15.8 0.24 17.5
Warm Hold 15000 180 3 -8.6 -4.3 0.49 17.4
Flight Phase
Scaling Method
Re Re 2r m w K 0 T r
WePi 3 WeDA m w K 0 T r
WeDW WeDW Pi 3 K 0 T r
Scaling Parameters Held Constant

American Institute of Aeronautics and Astronautics
10
w
w
DW
rVWe
)2(2 (5)
where:
w = surface tension of water
w
a
DA
rVWe
)2(2 (6)
mw/me (7)
where:
me = hG (Pww-Pw
P)
More detailed description of these scaling methods can be found in Addy, et al.5,6 and Orchard, et al.7
C. Experimental Uncertainties
The IRT was calibrated to generate LWC and MVD within 10% of the stated values. The thermocouples used
for the surface temperature measurements and the IPS inlet/outlet temperatures had an accuracy of 1° C. The flow
meter used to measure the heated air mass going into the IPS had a manufacturer-stated accuracy of 0.35%.
D. Test Procedure
For runback water to freeze in a manner similar to that at altitude, one of the conditions that needs to be met is that
model surface temperatures need to be similar to those occurring at altitude. With the IPS operating at the same heated
air mass flowrate and temperature, Reynolds number scaled conditions result in model surface temperatures nearly
identical to those during operation at altitude conditions. This is generally true for both dry air and icing conditions,
but more so for dry air. Because of this, the surface temperatures obtained at Re-scaled conditions could also be used
as reference values.
When operating at Weber number scaled conditions, however, convective cooling by the tunnel airstream is
elevated, resulting in a different model surface temperature profile. To compensate for the enhanced convective
cooling, IPS system output is increased in temperature, mass flow rate, or both, to obtain the correct model surface
temperature. Therefore, Weber number scaling methods require two steps: first run at Reynolds number scaled
conditions to obtain the reference model surface temperatures, then run at Weber number scaled conditions adjusting
the IPS system to get the model surface temperatures obtained in step one. These two steps are performed with dry
air in the tunnel. The icing run may then commence at the Weber number scaled conditions to obtain runback icing
results similar to those that would be expected at altitude.
Once the IPS parameters for the test were obtained, tests were done using the various scaling methods described
in the introduction. The following describes the typical test procedure:
1) Set IPS air mass flow rate and temperature to obtain “reference” (Re-scaled) model leading edge
temperature.
2) Activate icing spray for a predetermined icing exposure time.
3) Shut tunnel down and document the ice accretion using photographs. Perform 2D ice tracings, ice
thickness measurements, and ice mass measurements. Record frozen rivulets using BIO-FOAM
impression block.

American Institute of Aeronautics and Astronautics
11
The ice tracings were obtained by tracing the outline of the ice shape on a cardboard with the leading edge of the
airfoil cut out. The tracings were then digitized using a 2D scanner. Ice mass measurements were obtained by scraping
the ice off the model (over a fixed amount of model span) onto a tray and weighing it. The rivulet impression was
obtained by pressing a block of BIO-FOAM (with the airfoil contour cut out) on the model surface. BIO-FOAM a
closed-cell compressible foam typically used in the medical industry to obtain orthotic and podiatric impressions.
However, because of its low thermal mass and high compressibility, it has been shown to be useful in obtaining
impressions of runback ice shapes.6 The impression could then be digitized using a 3D laser scanner. The laser scan
data of the BIO-FOAM were not available in time for this paper, but will be included in a follow-on report.
III. Results and Discussion
The ice accretion and IPS thermal data from Descent, Cold Hold, and Warm Hold flight scenarios with Re and We
based scaling methods are presented in this section. The results from the different scaling methods are compared to
each other and also with the trends observed in the AIWT tests.
A. Descent Scenario
Table 3 shows the reference conditions, scaled test conditions, scaling parameters, and the accreted ice mass for
the Descent scenario. The differences in altitude for the scaled conditions were due to a variation in the static pressure
at different airspeeds (since the pressure cannot be directly controlled in an atmospheric wind tunnel). The Re-based
scaling method resulted in ice mass that was approximately twice as large as the two We-based scaling methods. This
was similar to results from the AIWT tests6,7 where ice accretions for the Reynolds number scaled conditions were
always much larger than those produced at the Weber number scaled conditions, as well as those produced at the
reference, or altitude, conditions.
Table 3. Descent scaled test conditions and ice mass.
Figure 6 shows the cross section cuts of the ice shapes for the Descent scenario, and Figure 7 shows the photos of
the accreted ice on the upper surface. Although photos of the lower surface ice accretion were taken during the test,
only the upper surface photos are presented in this paper for brevity since ice contamination on the upper surface is
much more significant aerodynamically than on the lower surface. Figures 6 and 7 both show that runback ice for the
Re-scaling condition started and extended farthest downstream. During the AIWT tests, both We-based scaling
methods produced ice very similar to that of the reference conditions in terms of the location on the airfoil, extent, and
height, while the Re-scaled ice accretion started farther downstream, had greater height and much greater chordwise
extent than either the We-based scaled ice shapes or the reference ice shape. Of note here is that, in the IRT test, the
WeDW scaled ice started slightly upstream of the WePi3 scaled ice. The two We-scaled ice accretions in the AIWT
tests were recorded in separate test entries and were not directly comparable. However, both ice accretions started on
the airfoil at very nearly the same locations on the airfoil as the reference ice.6,7
Ts mw
(deg C) (g/m2s)
Reference 10000 180 -14.2 0.35 19.1 360 17.6 0.224 5814 1.62 6.21 N/A
Re 1066 133 -12.7 0.48 22.8 360 17.6 0.224 4315 2.24 3.38 20
WePi3 1439 159 -13.5 0.35 19.4 360 14.4 0.265 5814 1.62 4.84 8.5
WeDW 1782 180 -14.2 0.34 21.6 360 17.6 0.297 7769 1.88 6.21 12.7
MVD
(m)
Spray Time
(s)
Ice Mass
(g)
Scale
MethodAlt (ft)
Re2r
(x106)
V (kts)LWC
(g/m3)
WeDA Pi3WeDW
(x106)

American Institute of Aeronautics and Astronautics
12
Figure 6. Descent scenario ice accretion tracing.
a) Re scaling b) WePi3 scaling c) WeDW scaling
Figure 7. Descent scenario upper surface ice accretion.
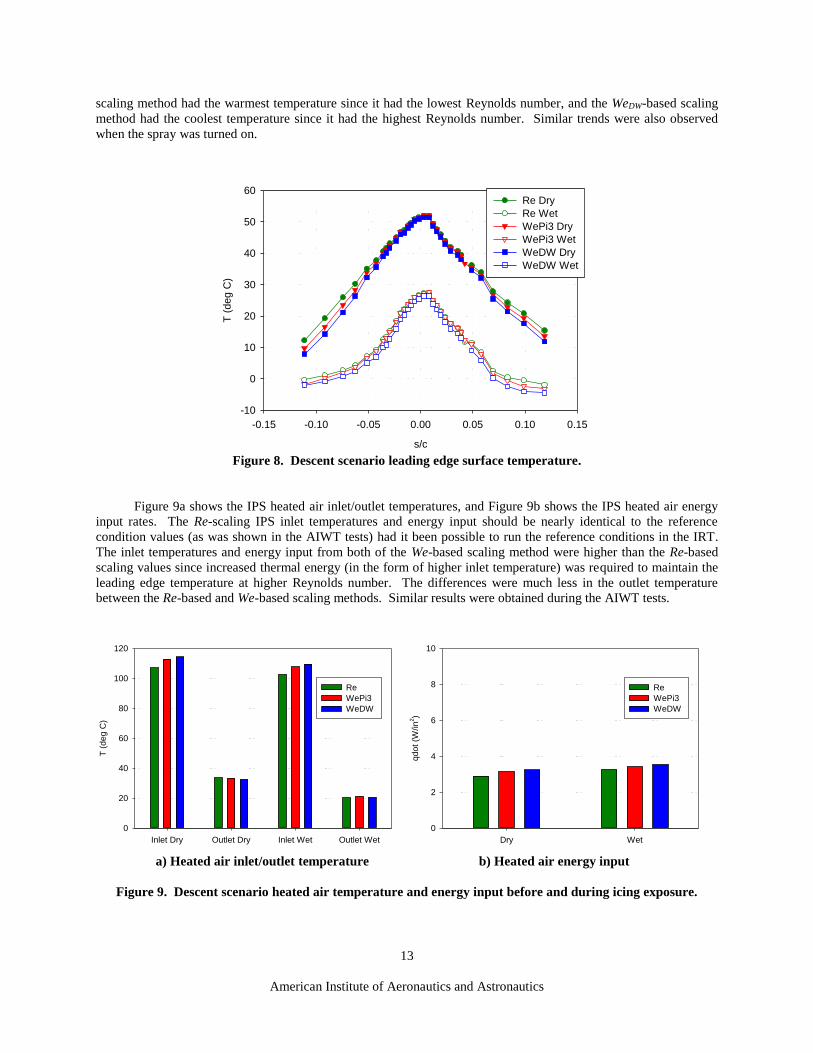
The chordwise surface temperature distribution for the Descent scenario is shown in Fig. 8 for both spray off (dry)
and spray on (wet) conditions. There was an approximately 25° C temperature drop when the spray was turned on.
When the spray was off, the leading edge temperature for all three scaling methods were matched nearly identically
(since the IPS settings were set so that the leading edge temperatures were matched). Away from the leading edge,
there were some small differences in the temperature due to differences in convective cooling rates. The Re-based
x (in)
0 2 4 6 8 10 12 14
y (
in)
-4
-2
0
2
4
6
Model
Re
WePi3
WeDW
American Institute of Aeronautics and Astronautics
13
scaling method had the warmest temperature since it had the lowest Reynolds number, and the WeDW-based scaling
method had the coolest temperature since it had the highest Reynolds number. Similar trends were also observed
when the spray was turned on.
Figure 8. Descent scenario leading edge surface temperature.
Figure 9a shows the IPS heated air inlet/outlet temperatures, and Figure 9b shows the IPS heated air energy
input rates. The Re-scaling IPS inlet temperatures and energy input should be nearly identical to the reference
condition values (as was shown in the AIWT tests) had it been possible to run the reference conditions in the IRT.
The inlet temperatures and energy input from both of the We-based scaling method were higher than the Re-based
scaling values since increased thermal energy (in the form of higher inlet temperature) was required to maintain the
leading edge temperature at higher Reynolds number. The differences were much less in the outlet temperature
between the Re-based and We-based scaling methods. Similar results were obtained during the AIWT tests.
a) Heated air inlet/outlet temperature b) Heated air energy input
Figure 9. Descent scenario heated air temperature and energy input before and during icing exposure.
s/c
-0.15 -0.10 -0.05 0.00 0.05 0.10 0.15
T (
de
g C
)
-10
0
10
20
30
40
50
60Re Dry
Re Wet
WePi3 Dry
WePi3 Wet
WeDW Dry
WeDW Wet
Inlet Dry Outlet Dry Inlet Wet Outlet Wet
T (
de
g C
)
0
20
40
60
80
100
120
Re
WePi3
WeDW
Dry Wet
qdot
(W/in
2)
0
2
4
6
8
10
Re
WePi3
WeDW

American Institute of Aeronautics and Astronautics
14
B. Cold Hold Scenario
The test conditions and the accreted ice mass for the Cold Hold scenario are shown in Table 4. The reference
condition was slightly modified from that shown in Table 1 in order to run the Re scaled condition at calibrated IRT
LWC and MVD point for more precise values (since these values are interpolated with uncertainties of up to ±10%
away from the calibrated points). The accreted ice mass for the Re-based scaling method was almost 11 times higher
than the WePi3-based scaling method. The accreted ice for the WeDW-based scaling method shed during the icing run,
so only a partial mass was obtained. It was notable that the ice accretion also shed for the WeDW-based condition
during the AIWT test.5
Table 4. Cold Hold scenario scaled test conditions and ice mass. (*Ice shed during test)
Figure 10 shows the cross section cuts of the ice shapes for the Cold Hold scenario. Figure 11 shows the photos
of the accreted ice on the upper surface. They show that again the runback ice for the Re-based scaling started and
extended farthest downstream. The ice shape for the WeDW scaled condition again started farthest upstream.
Ts mw
(deg C) (g/m2s)
Reference 15000 185 -20.1 0.31 14.6 600 13.4 0.193 5147 1.06 6.54 N/A
Re 976 109 -16.4 0.52 20.1 600 13.4 0.193 3065 1.87 2.27 54.2
WePi3 1495 149 -16 0.28 16.9 600 9.5 0.253 5147 1.06 4.22 5.0
WeDW 2087 185 -15.7 0.27 18.9 600 13.3 0.31 8346 1.37 6.54 16.4*
Pi3WeDW
(x106)
Ice Mass
(g)
Spray Time
(s)
Re2r
(x106)
WeDAMVD
(m)
Scale
MethodAlt (ft) V (kts)
LWC
(g/m3)

American Institute of Aeronautics and Astronautics
15
Figure 10. Cold Hold scenario ice accretion tracing.
a) Re scaling b) WePi3 Scaling c) WeDW Scaling
Figure 11. Cold Hold scenario upper surface ice accretion.
The chordwise surface temperature distribution for the Cold Hold scenario is shown in Fig. 12. When the spray
is off, the leading edge temperature for all three scaling methods were matched nearly identically. When the spray
was turned on there was a slightly larger variation in the temperature profile between the three scaling methods, with
the WePi3 method being the warmest and WeDW method being the coldest.
x (in)
0 2 4 6 8 10 12 14
y (
in)
-4
-2
0
2
4
6
Model
Re
WePi3
WeDW

American Institute of Aeronautics and Astronautics
16
Figure 12. Cold Hold scenario leading edge surface temperature.
Figure 13 shows the IPS heated air inlet/outlet temperatures and the IPS heated air energy input rates. The Re-
scaling IPS inlet temperatures and energy input were the lowest, followed by the WePi3 method and the WeDW method.
Similar results were obtained with the Cold Hold scenario during the AIWT tests.
a) Heated air inlet/outlet temperature b) Heated air energy input
Figure 13. Cold Hold scenario heated air temperature and energy input before and during icing exposure.
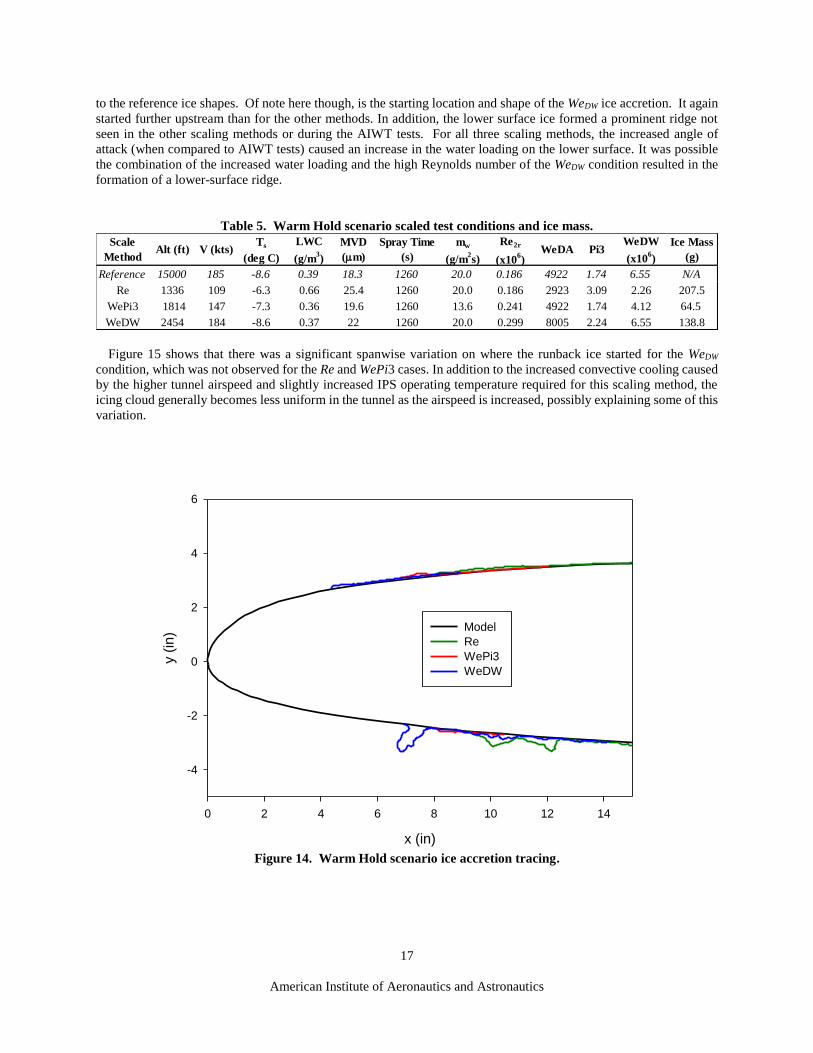
C. Warm Hold Scenario Table 5 shows the reference and scaled test conditions as well as accreted ice mass for the Warm Hold scenario.
As with the Cold Hold scenario, the reference condition was slightly modified from what is shown in Table 1 in order
to obtain a more accurate Re-based test condition. Figure 14 shows the cross section cuts of the ice shapes taken from
tracings at the centerline of the model, and Fig. 15 shows the photos of the accreted ice on the upper surface. Again,
a much greater amount of ice was formed at the Re-based scaled conditions. As the ice tracings in Fig. 14 show, the
ice again started much farther downstream and had a much greater chordwise extent. As has been noted, this is the
same trends as observed in the AIWT tests where the We-based scaling methods resulted in ice accretions much closer
s/c
-0.15 -0.10 -0.05 0.00 0.05 0.10 0.15
T (
deg C
)
0
20
40
60Re Dry
Re Wet
WePi3 Dry
WePi3 Wet
WeDW Dry
WeDW Wet
Inlet Dry Outlet Dry Inlet Wet Outlet Wet
T (
de
g C
)
0
20
40
60
80
100
120
Re
WePi3
WeDW
Dry Wet
qd
ot
(W/in
2)
0
2
4
6
8
10
Re
WePi3
WeDW
American Institute of Aeronautics and Astronautics
17
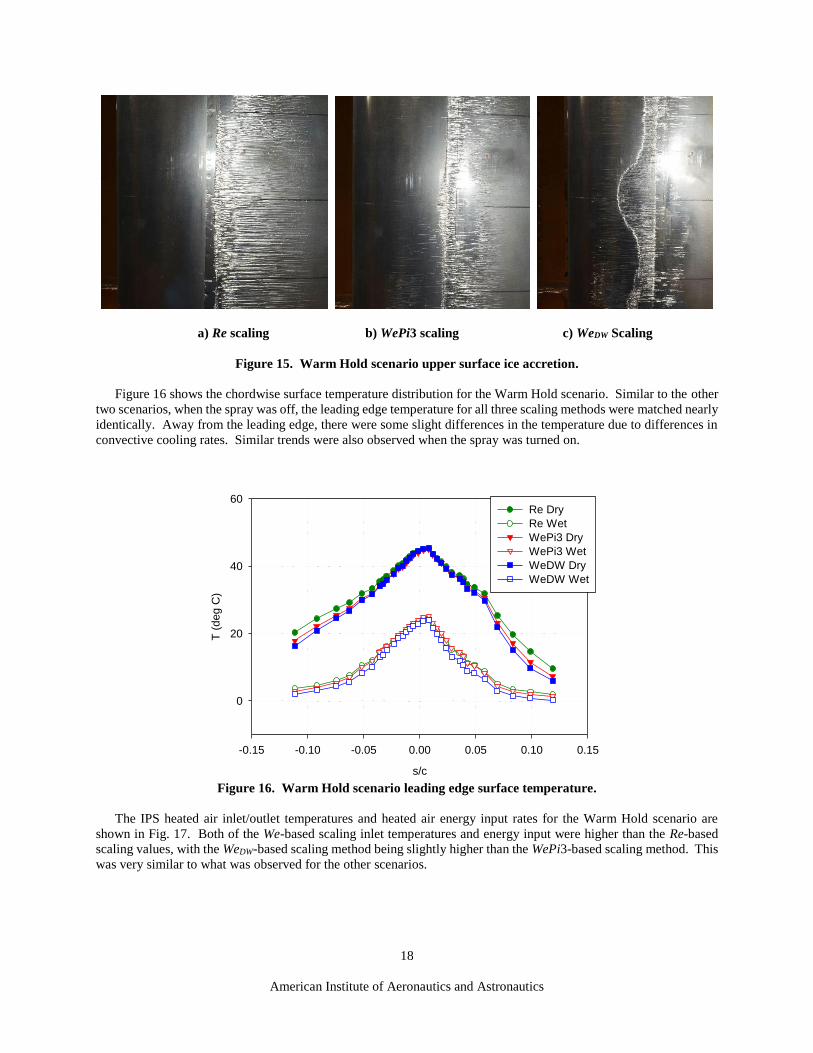
to the reference ice shapes. Of note here though, is the starting location and shape of the WeDW ice accretion. It again
started further upstream than for the other methods. In addition, the lower surface ice formed a prominent ridge not
seen in the other scaling methods or during the AIWT tests. For all three scaling methods, the increased angle of
attack (when compared to AIWT tests) caused an increase in the water loading on the lower surface. It was possible
the combination of the increased water loading and the high Reynolds number of the WeDW condition resulted in the
formation of a lower-surface ridge.
Table 5. Warm Hold scenario scaled test conditions and ice mass.
Figure 15 shows that there was a significant spanwise variation on where the runback ice started for the WeDW
condition, which was not observed for the Re and WePi3 cases. In addition to the increased convective cooling caused
by the higher tunnel airspeed and slightly increased IPS operating temperature required for this scaling method, the
icing cloud generally becomes less uniform in the tunnel as the airspeed is increased, possibly explaining some of this
variation.
Figure 14. Warm Hold scenario ice accretion tracing.
Ts mw
(deg C) (g/m2s)
Reference 15000 185 -8.6 0.39 18.3 1260 20.0 0.186 4922 1.74 6.55 N/A
Re 1336 109 -6.3 0.66 25.4 1260 20.0 0.186 2923 3.09 2.26 207.5
WePi3 1814 147 -7.3 0.36 19.6 1260 13.6 0.241 4922 1.74 4.12 64.5
WeDW 2454 184 -8.6 0.37 22 1260 20.0 0.299 8005 2.24 6.55 138.8
Pi3WeDW
(x106)
Ice Mass
(g)
Re2r
(x106)
WeDAV (kts)Scale
MethodAlt (ft)
LWC
(g/m3)
MVD
(m)
Spray Time
(s)
x (in)
0 2 4 6 8 10 12 14
y (
in)
-4
-2
0
2
4
6
Model
Re
WePi3
WeDW
American Institute of Aeronautics and Astronautics
18
a) Re scaling b) WePi3 scaling c) WeDW Scaling
Figure 15. Warm Hold scenario upper surface ice accretion.
Figure 16 shows the chordwise surface temperature distribution for the Warm Hold scenario. Similar to the other
two scenarios, when the spray was off, the leading edge temperature for all three scaling methods were matched nearly
identically. Away from the leading edge, there were some slight differences in the temperature due to differences in
convective cooling rates. Similar trends were also observed when the spray was turned on.
Figure 16. Warm Hold scenario leading edge surface temperature.
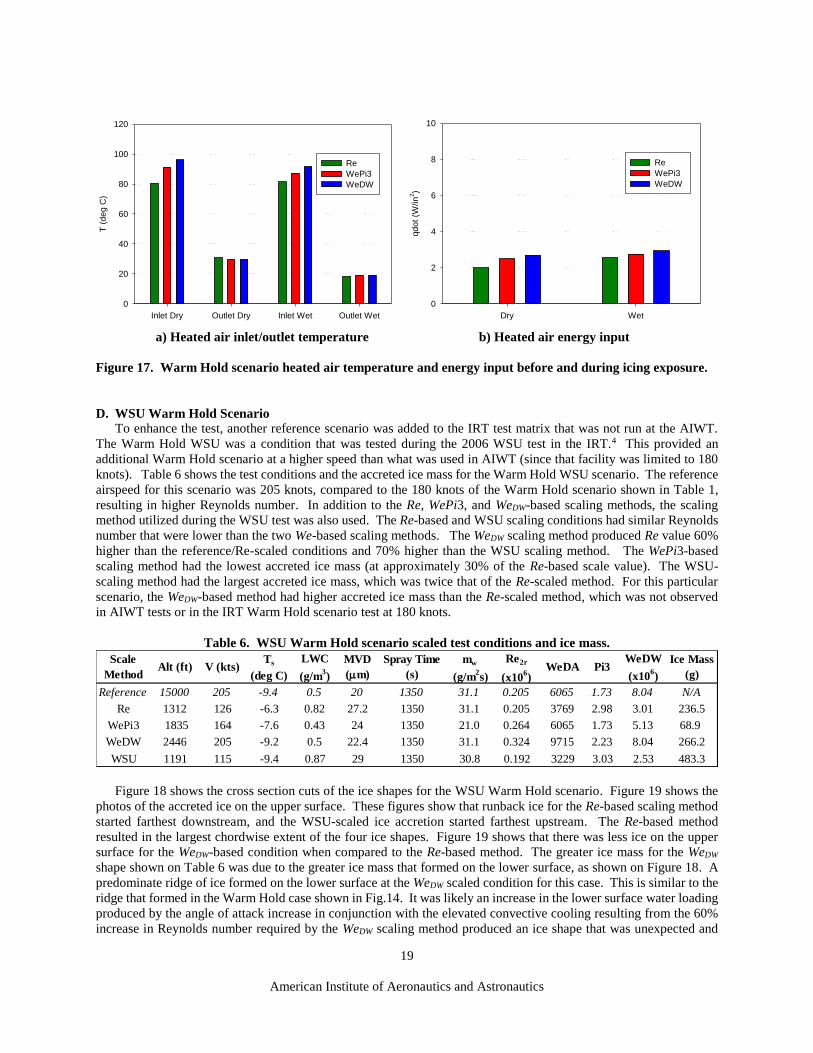
The IPS heated air inlet/outlet temperatures and heated air energy input rates for the Warm Hold scenario are
shown in Fig. 17. Both of the We-based scaling inlet temperatures and energy input were higher than the Re-based
scaling values, with the WeDW-based scaling method being slightly higher than the WePi3-based scaling method. This
was very similar to what was observed for the other scenarios.
s/c
-0.15 -0.10 -0.05 0.00 0.05 0.10 0.15
T (
de
g C
)
0
20
40
60Re Dry
Re Wet
WePi3 Dry
WePi3 Wet
WeDW Dry
WeDW Wet
American Institute of Aeronautics and Astronautics
19
a) Heated air inlet/outlet temperature b) Heated air energy input
Figure 17. Warm Hold scenario heated air temperature and energy input before and during icing exposure.
D. WSU Warm Hold Scenario
To enhance the test, another reference scenario was added to the IRT test matrix that was not run at the AIWT.
The Warm Hold WSU was a condition that was tested during the 2006 WSU test in the IRT.4 This provided an
additional Warm Hold scenario at a higher speed than what was used in AIWT (since that facility was limited to 180
knots). Table 6 shows the test conditions and the accreted ice mass for the Warm Hold WSU scenario. The reference
airspeed for this scenario was 205 knots, compared to the 180 knots of the Warm Hold scenario shown in Table 1,
resulting in higher Reynolds number. In addition to the Re, WePi3, and WeDW-based scaling methods, the scaling
method utilized during the WSU test was also used. The Re-based and WSU scaling conditions had similar Reynolds
number that were lower than the two We-based scaling methods. The WeDW scaling method produced Re value 60%
higher than the reference/Re-scaled conditions and 70% higher than the WSU scaling method. The WePi3-based
scaling method had the lowest accreted ice mass (at approximately 30% of the Re-based scale value). The WSU-
scaling method had the largest accreted ice mass, which was twice that of the Re-scaled method. For this particular
scenario, the WeDW-based method had higher accreted ice mass than the Re-scaled method, which was not observed
in AIWT tests or in the IRT Warm Hold scenario test at 180 knots.
Table 6. WSU Warm Hold scenario scaled test conditions and ice mass.
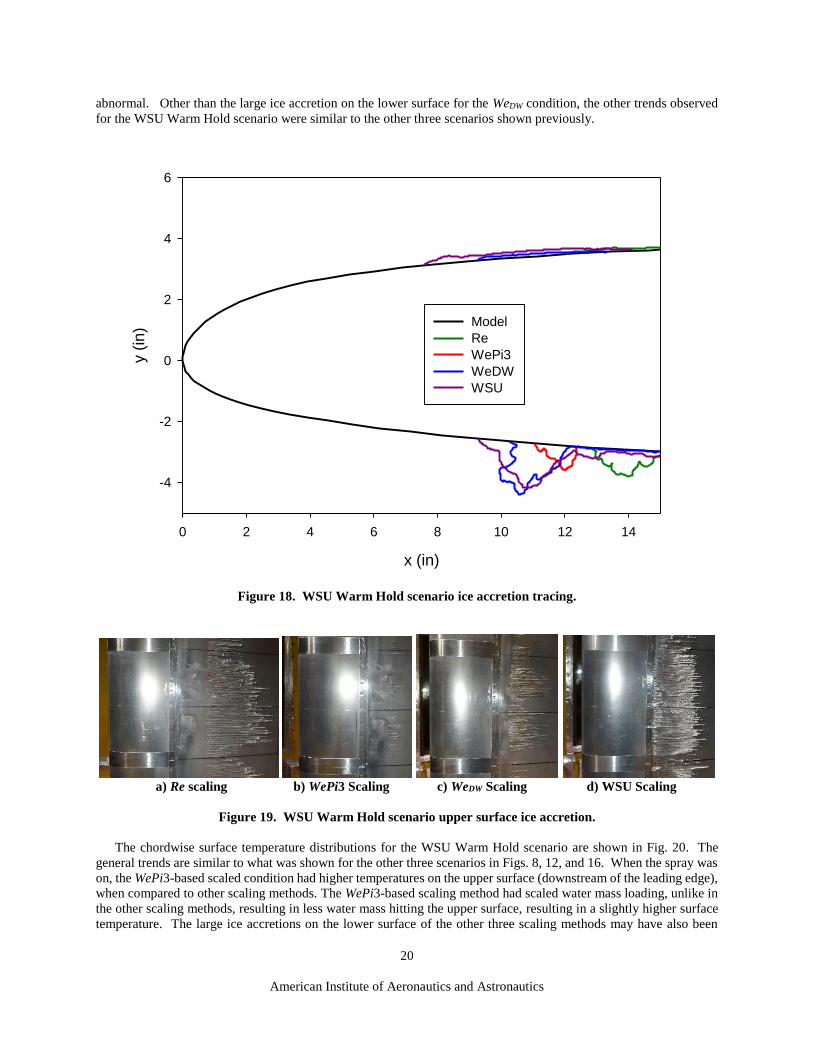
Figure 18 shows the cross section cuts of the ice shapes for the WSU Warm Hold scenario. Figure 19 shows the
photos of the accreted ice on the upper surface. These figures show that runback ice for the Re-based scaling method
started farthest downstream, and the WSU-scaled ice accretion started farthest upstream. The Re-based method
resulted in the largest chordwise extent of the four ice shapes. Figure 19 shows that there was less ice on the upper
surface for the WeDW-based condition when compared to the Re-based method. The greater ice mass for the WeDW
shape shown on Table 6 was due to the greater ice mass that formed on the lower surface, as shown on Figure 18. A
predominate ridge of ice formed on the lower surface at the WeDW scaled condition for this case. This is similar to the
ridge that formed in the Warm Hold case shown in Fig.14. It was likely an increase in the lower surface water loading
produced by the angle of attack increase in conjunction with the elevated convective cooling resulting from the 60%
increase in Reynolds number required by the WeDW scaling method produced an ice shape that was unexpected and
Inlet Dry Outlet Dry Inlet Wet Outlet Wet
T (
de
g C
)
0
20
40
60
80
100
120
Re
WePi3
WeDW
Dry Wet
qd
ot
(W/in
2)
0
2
4
6
8
10
Re
WePi3
WeDW
Ts mw
(deg C) (g/m2s)
Reference 15000 205 -9.4 0.5 20 1350 31.1 0.205 6065 1.73 8.04 N/A
Re 1312 126 -6.3 0.82 27.2 1350 31.1 0.205 3769 2.98 3.01 236.5
WePi3 1835 164 -7.6 0.43 24 1350 21.0 0.264 6065 1.73 5.13 68.9
WeDW 2446 205 -9.2 0.5 22.4 1350 31.1 0.324 9715 2.23 8.04 266.2
WSU 1191 115 -9.4 0.87 29 1350 30.8 0.192 3229 3.03 2.53 483.3
Pi3WeDW
(x106)
Ice Mass
(g)
Spray Time
(s)
Re2r
(x106)
WeDAMVD
(m)
Scale
MethodAlt (ft) V (kts)
LWC
(g/m3)
American Institute of Aeronautics and Astronautics
20
abnormal. Other than the large ice accretion on the lower surface for the WeDW condition, the other trends observed
for the WSU Warm Hold scenario were similar to the other three scenarios shown previously.
Figure 18. WSU Warm Hold scenario ice accretion tracing.
a) Re scaling b) WePi3 Scaling c) WeDW Scaling d) WSU Scaling
Figure 19. WSU Warm Hold scenario upper surface ice accretion.
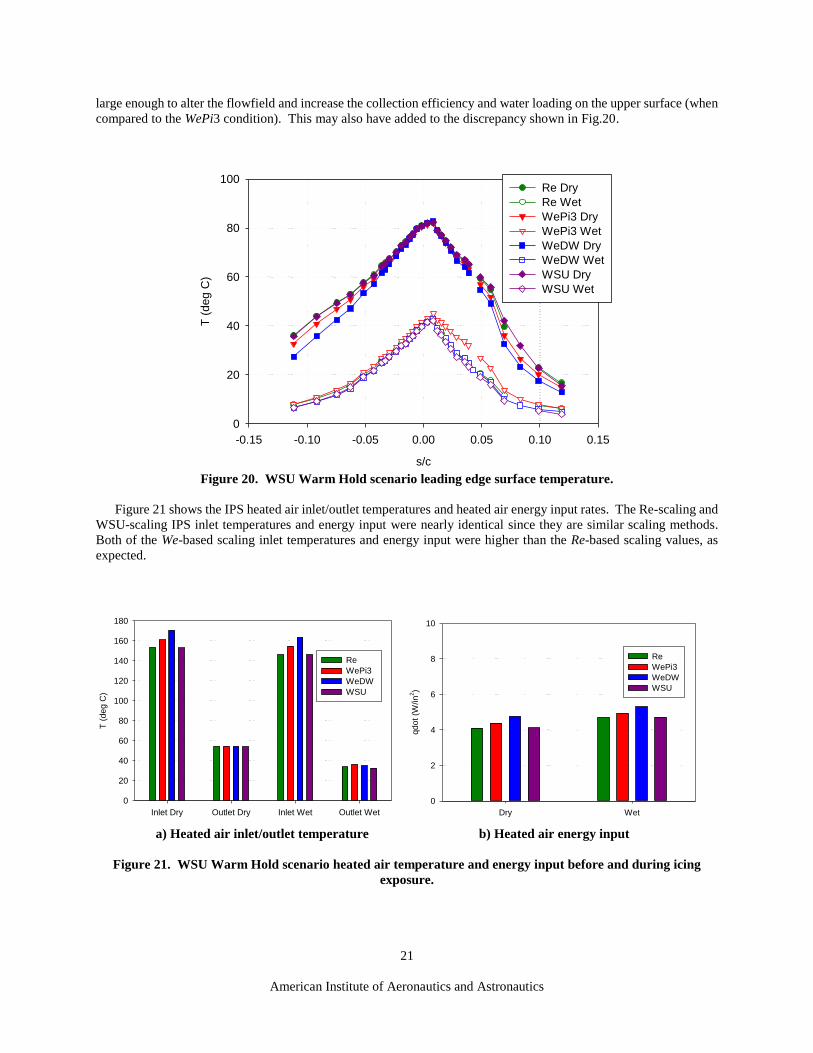
The chordwise surface temperature distributions for the WSU Warm Hold scenario are shown in Fig. 20. The
general trends are similar to what was shown for the other three scenarios in Figs. 8, 12, and 16. When the spray was
on, the WePi3-based scaled condition had higher temperatures on the upper surface (downstream of the leading edge),
when compared to other scaling methods. The WePi3-based scaling method had scaled water mass loading, unlike in
the other scaling methods, resulting in less water mass hitting the upper surface, resulting in a slightly higher surface
temperature. The large ice accretions on the lower surface of the other three scaling methods may have also been
x (in)
0 2 4 6 8 10 12 14
y (
in)
-4
-2
0
2
4
6
Model
Re
WePi3
WeDW
WSU
American Institute of Aeronautics and Astronautics
21
large enough to alter the flowfield and increase the collection efficiency and water loading on the upper surface (when
compared to the WePi3 condition). This may also have added to the discrepancy shown in Fig.20.
Figure 20. WSU Warm Hold scenario leading edge surface temperature.
Figure 21 shows the IPS heated air inlet/outlet temperatures and heated air energy input rates. The Re-scaling and
WSU-scaling IPS inlet temperatures and energy input were nearly identical since they are similar scaling methods.
Both of the We-based scaling inlet temperatures and energy input were higher than the Re-based scaling values, as
expected.
a) Heated air inlet/outlet temperature b) Heated air energy input
Figure 21. WSU Warm Hold scenario heated air temperature and energy input before and during icing
exposure.
s/c
-0.15 -0.10 -0.05 0.00 0.05 0.10 0.15
T (
deg C
)
0
20
40
60
80
100Re Dry
Re Wet
WePi3 Dry
WePi3 Wet
WeDW Dry
WeDW Wet
WSU Dry
WSU Wet
Inlet Dry Outlet Dry Inlet Wet Outlet Wet
T (
de
g C
)
0
20
40
60
80
100
120
140
160
180
Re
WePi3
WeDW
WSU
Dry Wet
qdot
(W/in
2)
0
2
4
6
8
10
Re
WePi3
WeDW
WSU

American Institute of Aeronautics and Astronautics
22
E. Comparison to AIWT Tests
The results of the IRT test largely agreed with and supported the results of the thermal IPS tests conducted at the
AIWT. Trends in the amounts of ice accretion and their location and extent largely agreed with those observed at the
AIWT. In two instances, a prominent ice ridge formed on the lower surface of the IRT model when operating under
WeDW conditions. The larger (5 ft. chord vs. 1.5 ft. chord) asymmetric IRT model, when run at greater than 0 degrees
produced an increase in water loading on the lower surface which, in conjunction with the enhanced convective
cooling resulting from the elevated Reynolds numbers generated by the WeDW scaling, resulted in not only a larger ice
shape, but one exhibiting a change in character (i.e., the ice ridge).
F. Further Discussion
Three things can happen to water striking a heated aircraft surface in flight icing conditions: it can runback and
freeze on an unheated or insufficiently heated surface, it can be re-entrained into the airstream, or it can be evaporated.
The air pressure at flight altitudes affects all three of these modes of mass transport. Reynolds number scaling provides
the surface temperature conditions for freezing of runback water, but does not provide similitude in either liquid water
re-entrainment into the airstream or evaporation. The result is a great deal more ice being frozen on the surface than
would occur at altitude conditions. Weber number based on water density scaling, in conjunction with surface
temperature matching, provides the inertia to surface tension forces ratio needed to remove much of the excess water
that is frozen in the Reynolds number scaling method. Because convective cooling is, however, much enhanced
through the elevated Reynolds number generated by this method, excess ice can still result. The Weber number based
on air density and 3 method seeks to simulate all three modes of mass transport. Model surface temperature matching
creates the surface condition for the ice to freeze in the proper location. Weber number based on air density matching
generates ample inertia to surface tension forces to remove liquid water as would be the case at altitude, without over-
enhancement of convective cooling through increased Reynolds number. Finally, the enhanced evaporation that
occurs at altitude due to the decreased static pressure is addressed by reducing water loading in proportion to the
reduction in calculated water evaporation rate.
IV. Conclusions
A test was conducted at NASA Icing Research tunnel to evaluate altitude scaling methods for thermal ice
protection system. These methods were developed during a series of joint NASA/NRC-Canada tests at NRCC Altitude
Icing Wind Tunnel using a small symmetric airfoil model. The IRT allowed these scaling methods to be evaluated on
a larger asymmetric business jet airfoil with a more typical IPS design at higher Reynolds number.
The results from the IRT test largely agreed with and supported the results from the AIWT tests. The We-based
scaling methods resulted in smaller runback ice mass than the Re-based scaling method. The Re-based scaling method
generated runback ice that formed farther downstream than the We-based methods. These results agreed with those
from the AIWT tests where the scale-method ice accretions were compared with reference (altitude) results. The
Weber number based on air density coupled with surface temperature matching and water loading scaling produced
the most consistent results. While not perfect, this method appears to be the best available to scale thermal IPS icing
test conditions for altitude effects in an atmospheric icing wind tunnel. Moreover, they are not based on empirically-
generated scale factors, but on fundamental physics. What is left is to better determine the limits of the physical
relations used which can be accomplished by testing full-scale airfoil models in an altitude capable wind tunnel.
References
1 SAE AIR6440, “Icing Tunnel Tests for Thermal Ice Protection Systems,” SAE AC-9C Aircraft Icing Technology Committee, June
2014.
2 Whalen, E.A., Broeren, A.P., and Bragg, M.B., “Characteristics of Runback Ice Accretions on Airfoils and their Aerodynamic
Effects,” 43rd AIAA Aerospace Sciences Meeting and Exhibit, January 10-13 2005, Reno, NV, AIAA Paper 2005-1065.
American Institute of Aeronautics and Astronautics
23
3 Whalen, E.A., Broeren, A.P., and Bragg, M.B., “Characteristics of Runback Ice Accretions and their Aerodynamic Effects,” FAA
Report DOT/FAA/AR-07/16, April 2007.
4 Papadakis, M., Wong, S.H., Yeong, H.W., Wong, S.C., and Vu, G.T., “Icing Tunnel Experiments with a Hot Air Anti-Icing
System,” 46th AIAA Aerospace Sciences Meeting and Exhibit, January 7-10, 2008, Reno, NV, AIAA Paper 2008-444.
5 Addy, H.E., Oleskiw, M., Broeren, A.P., and Orchard, D., “A Study of the Effects of Altitude on Thermal Ice Protection System
Performance,” AIAA-2013-2934, NASA/TM-2013-216559.
6 Addy, H.E., Orchard, D., Wright, W., and Oleskiw, M., “Altitude Effects on Thermal Ice Protection System Performance; a Study
of an Alternative Approach,” NASA/TM-2016-219081.
7 Orchard, D.M., Addy, H.E., Wright, W.B., and Tsao, J., “Altitude Scaling of Thermal Ice Protection System in Running Wet
Operation,” 9th AIAA Atmospheric and Space Environments Conference, May 5-9, 2017, Denver, CO, (submitted for publication).
8 Soeder, R.H., Sheldon, D.W., Ide, R.F., Spera, D.A. and Andracchio, C.R., “NASA Glenn Icing Research Tunnel User Manual,”
NASA TM-2003-212004, September 2003.


