SCRS/2019/144 Collect. Vol. Sci. Pap. ICCAT, 76(2): 147-171 (2020)
147
EVALUATION OF ATLANTIC BLUEFIN TUNA OTOLITH AGEING PROTOCOLS
D.S. Busawon1, P. Addis2, R. Allman3, A. Bellodi2, F. Garibaldi4,
T. Ishihara5, S. Karakulak6, P. Lastra Luque7, P. Quelle8and E. Rodriguez-Marin8
SUMMARY
An otolith ageing bias for juvenile Atlantic bluefin tuna was detected at the 2017 population
assessment. Consequently, revised reading criteria were proposed to reduce this ageing bias. To
evaluate standardized and revised reading criteria, age estimates were compared to reading and
radiocarbon age estimates. Age estimates showed a lack of bias and adequate level of precision for
most readers, indicating that reading criteria are adequate. No bias was detected in the ageing of
juveniles, contrary to the 2017 assessment findings. This may be due to the fact that one-year biases
may not be noticeable given the wide age range and small sample size used in this study. Some
readers showed lower age estimates for older individuals (20+) as compared to radiocarbon age
estimates. Furthermore, age estimates were consistently higher than the Ailloud et al. (2017)
growth curve for samples aged over 20 years, likely due to the lower mean asymptotic length of the
growth curve using the Richards fitting. In terms of methodology, a potential section effect on
identification of false annulus and edge type was noted.
RÉSUMÉ
Des biais dans la détermination de l'âge d’otolithes de thons rouges juvéniles de l'Atlantique ont été
détectés lors de l’évaluation de la population en 2017. En conséquence, des critères de lecture
révisés ont été proposés pour réduire ces biais dans la détermination de l'âge. Pour évaluer les
critères de lecture standardisés et révisés, les estimations de l'âge ont été comparées à la lecture et
aux estimations de l'âge par radiocarbone. Les estimations de l'âge ont montré un manque de biais
et un niveau de précision adéquat pour la plupart des lecteurs, ce qui indique que les critères de
lecture sont adéquats. Aucun biais n'a été détecté en ce qui concerne la détermination de l'âge des
juvéniles, contrairement aux conclusions de l'évaluation de 2017. Cela peut être dû au fait que les
biais sur un an pourraient ne pas être perceptibles étant donné la vaste gamme d'âges et la petite
taille de l'échantillon utilisées dans cette étude. Certains lecteurs ont montré des estimations d'âge
plus faibles pour les spécimens plus âgés (20+) par rapport aux estimations de l'âge par
radiocarbone. De plus, les estimations de l'âge étaient constamment plus élevées que la courbe de
croissance d'Ailloud et al. (2017) pour les échantillons âgés de plus de 20 ans, probablement en
raison de la longueur asymptotique moyenne plus faible de la courbe de croissance selon
l'ajustement de Richards. En termes de méthodologie, un effet potentiel de section dans
l'identification des faux anneaux et du type de bord a été noté.
RESUMEN
En la evaluación de atún rojo de 2017 se detectaron sesgos en la determinación de la edad
mediante otolitos de juveniles de atún rojo del Atlántico. Por consiguiente, se propusieron criterios
de lectura revisados para reducir este sesgo en la determinación de la edad. Para evaluar criterios
1 Fisheries & Oceans Canada, Biological Station, 125 Marine Science Drive, St. Andrews, NB E5B 0L4 CANADA. Email address of lead
author: [email protected]. 2 Department of Environmental Life and Science, University of Cagliari (Italy). 3 Panama City Laboratory, National Marine Fisheries Service 4 Dipartimento di Scienzedella Terra, dell'Ambiente e della Vita, University of Genova (Italy) 5 Bluefin Tuna Resources Division, National Research Institute of Far Seas Fisheries, Fisheries Research Agency, Shimizu (Japan) 6 Istanbul University Faculty of Aquatic Sciences, Department of Fisheries Technology and Management (Turkey) 7 AZTI - Tecnalia, Pasaia, Gipuzkoa, Spain 8 Instituto Español de Oceanografia - Santander (Spain)
148
de lectura estandarizados y revisados, las estimaciones de edad se compararon con las lecturas y
con estimaciones de edad a partir de radiocarbono. Las estimaciones de edad mostraron falta de
sesgo y un nivel adecuado de precisión para la mayoría de los lectores, indicando que los criterios
de lectura eran adecuados. No se detectó sesgo en la determinación de la edad de los juveniles, al
contrario que en la evaluación de 2017. Esto podría deberse al hecho de que sesgos de un año
podrían no advertirse dado el amplio rango de edad y el pequeño tamaño de la muestra usado en
este estudio. Algunos lectores presentaron estimaciones de edad inferiores para los ejemplares más
mayores (20+) en comparación con las estimaciones de edad mediante radiocarbono. Además, las
estimaciones de edad eran más elevadas que las de la curva de crecimiento de Ailloud et al. (2017)
para las muestras a las que se asignó una edad de más de 20 años, debido probablemente a la
menor talla asintótica media de la curva de crecimiento utilizando el ajuste de Richards. En
términos de metodología, se observó un posible efecto de sección en la identificación de anillos
falsos y del tipo de borde.
KEYWORDS
Bluefin tuna, ageing, otolith
1. Introduction
The International Commission for the Conservation of Atlantic Tunas (ICCAT) identified growth as a major source
of uncertainty in stock assessment models for Atlantic bluefin tuna (Thunnus thynnus) (ICCAT 2017). A key
component of the ICCAT Atlantic Wide Research Program for Bluefin Tuna (GBYP) has been to provide updated
life history information for this species, specifically age, growth and catch-at-age, to reduce uncertainty in stock
assessment models. The goal of this study is to evaluate the proposed bluefin tuna ageing methodology by comparing
age estimates to validated bomb radiocarbon age estimates.
Currently, catch-at-age of Atlantic bluefin tuna is determined by age slicing, a technique that divides catch length
into different ages creating a catch-at-age matrix. To do this, a distribution of sizes is separated into age classes
under the assumption that distinct lengths separate adjacent age classes. Typically, ages are separated based on the
length halfway between the two mean lengths at an age predicted from a growth curve. A critical assumption is
equal variability in lengths across adjacent ages. Given the variability in growth between individuals, over time this
technique can lead to age class smearing, where one or more age classes overlap and individual are assigned to the
incorrect age. Direct ageing of hard parts (otoliths and dorsal fin spines) reduces this uncertainty and results in better
characterization of catch-at-age, providing more robust stock assessments. As a result, laboratories in Canada,
Europe and USA have been collecting otoliths and dorsal fin spines from a broad size distribution of bluefin tuna
captured by multiple gear types in the East and West Atlantic for routine estimation of size at age and individual
growth rate.
In an effort to standardize otolith based ageing protocols across the laboratories and evaluate the error underlying the
interpretation of annuli, Atlantic Bluefin tuna ageing workshops were held and several ageing exchanges were
carried out (Rodriguez et al. 2007; 2014, Secor et al. 2014 and Busawon et al. 2015).This effort has resulted in an
Atlantic Bluefin tuna otolith reference collection, standardized processing protocols for otoliths and reading criteria
protocols (Secor et al., 2014, Busawon et al. 2015)
Despite this standardization and the different quality controls mentioned above, during the 2017 bluefin tuna
population assessment, a bias was observed in the catch at age estimates using age-length keys based on the adopted
protocols. This bias is small (~ one year) but important, and represents an overestimation of the age in otolith reading
and is likely due to the appearance of sub-annual bands in the first 8 years of life. In an attempt to reduce this bias, a
review of the standardized otolith reading protocol was produced (Rodriguez et al., 2019b, appendix I) and an
exchange was made with this revised protocol (Rodriguez et al., 2019a).

149
The revised reading criteria from Rodriguez et al. (2019b) still need to be further tested and agreed upon by the
Atlantic bluefin tuna ageing laboratories. Therefore, it was decided to employ the set of samples used in the bluefin
tuna age reading validation study from Neilson and Campana (2008). Age estimates obtained using the standardized
reading criteria described in Busawon et al. (2015) and the revised reading criteria described by Rodriguez-Marin et
al. (2019b) were compared to reading and bomb radiocarbon age estimates from the Neilson and Campana (2008)
study. In addition, since the validation study did not use the standardized otolith processing protocols described in
Secor et al. (2014) and Busawon et al. (2015), methodological impacts were assessed by comparing age estimates
from standard and non-standard sections.
The objectives of this paper are to evaluate bias and precision from 1) radiocarbon age estimates to the most recent
growth curve (Ailloud et al., 2017), 2) evaluate age estimates obtained using the standardized and revised reading
protocols and 3) evaluate age estimates from standard and non-standard sections.
2. Material and Methods
2.1 Otolith age validation set
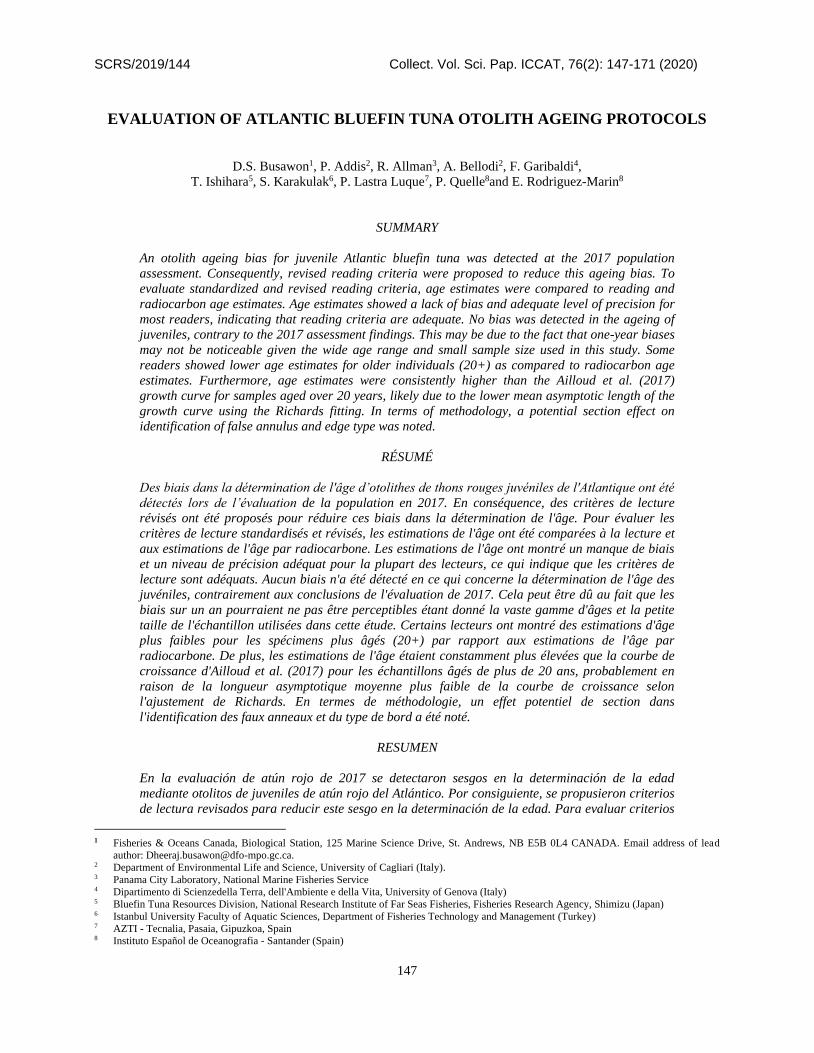
The Bluefin tuna age validation study used a set of 28 samples from archived material stored at the St. Andrews
Biological Station, Fisheries and Oceans Canada (see Neilson and Campana (2008) for further details). Atlantic
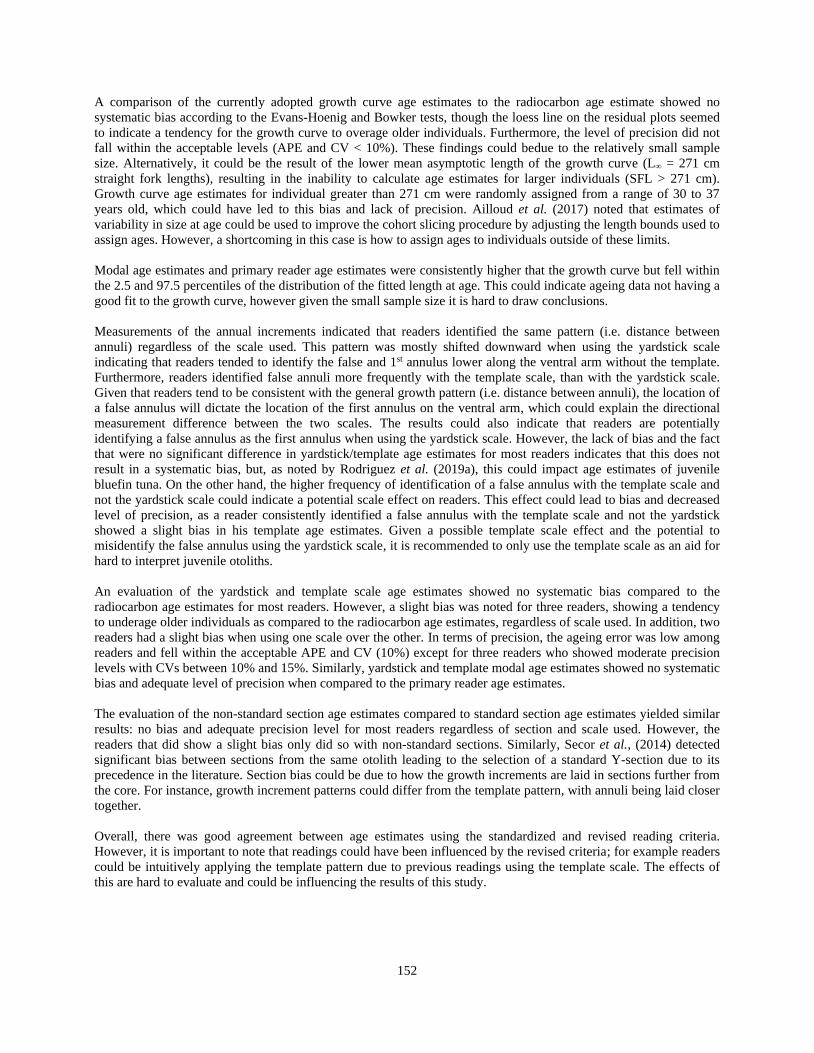
Bluefin tuna were sampled over a broad size distribution (125 - 300 cm straight fork length, SFL), however the
samples were biased toward larger fish (>200cm) (Figure 1). The straight fork length in this study was converted
from curved fork length using the conversion factors from Rodriguez-Marin et al., (2015) (i.e. SFL = 1.85746 +
0.9606*CFL). Otoliths were embedded in epoxy and three adjacent transverse sections were obtained with a low
speed diamond saw: a 1.2 mm central section intended for micro milling and ~ 1mm thick sections anterior and
posterior side for age determination.
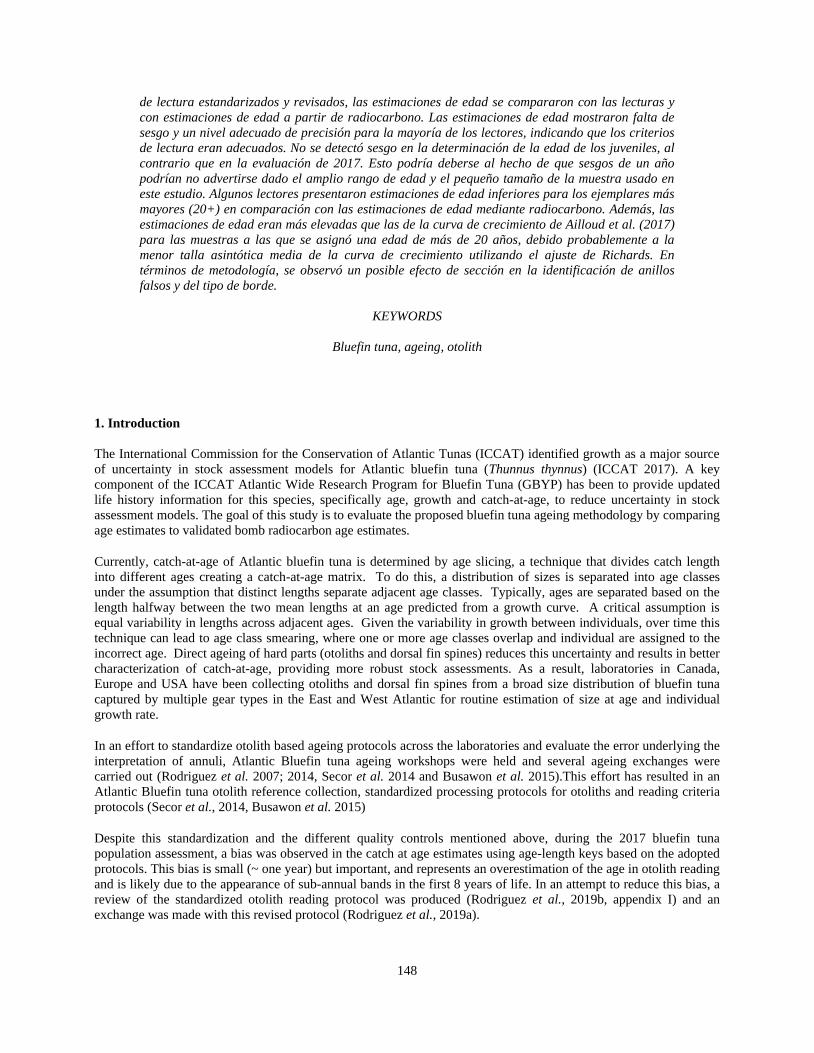
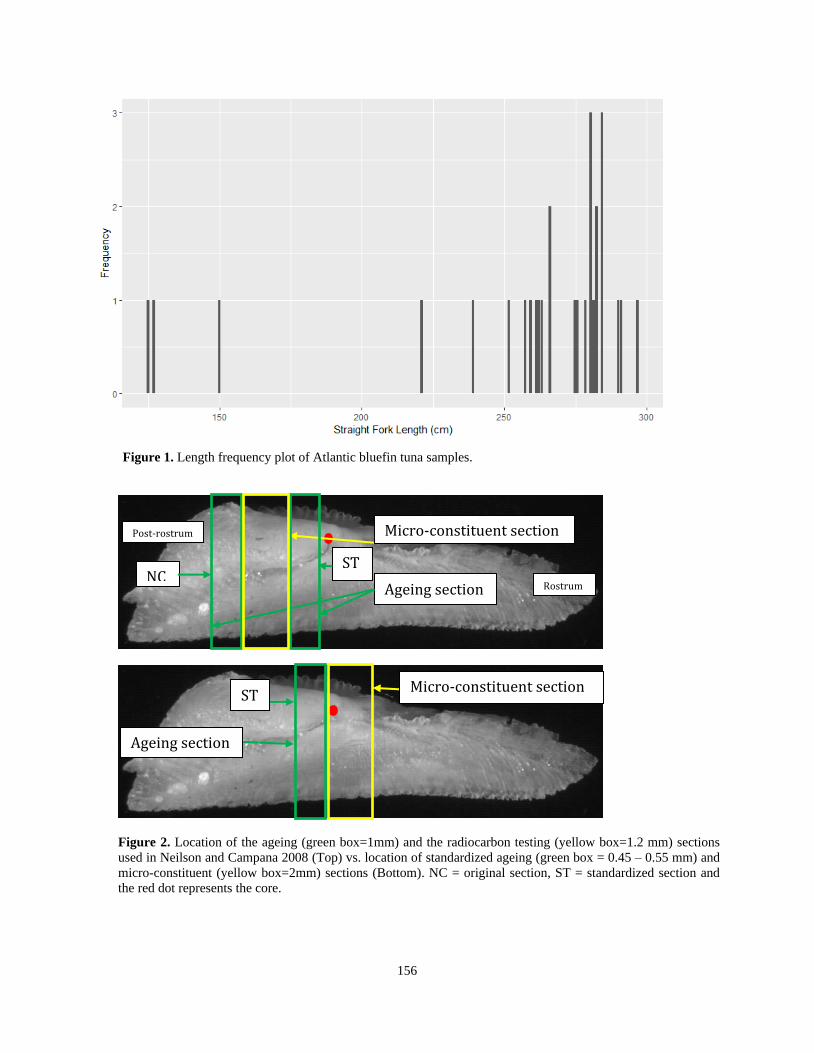
Neilson and Campana (2008) used the ageing section closer to the post-rostrum, which deviates from the
standardized ageing section currently used (Figure 2).I n cases where the unused section matched the current
standardized section (N=17; Y section = 14 and V section = 3), it was imaged and added to the set as a means of
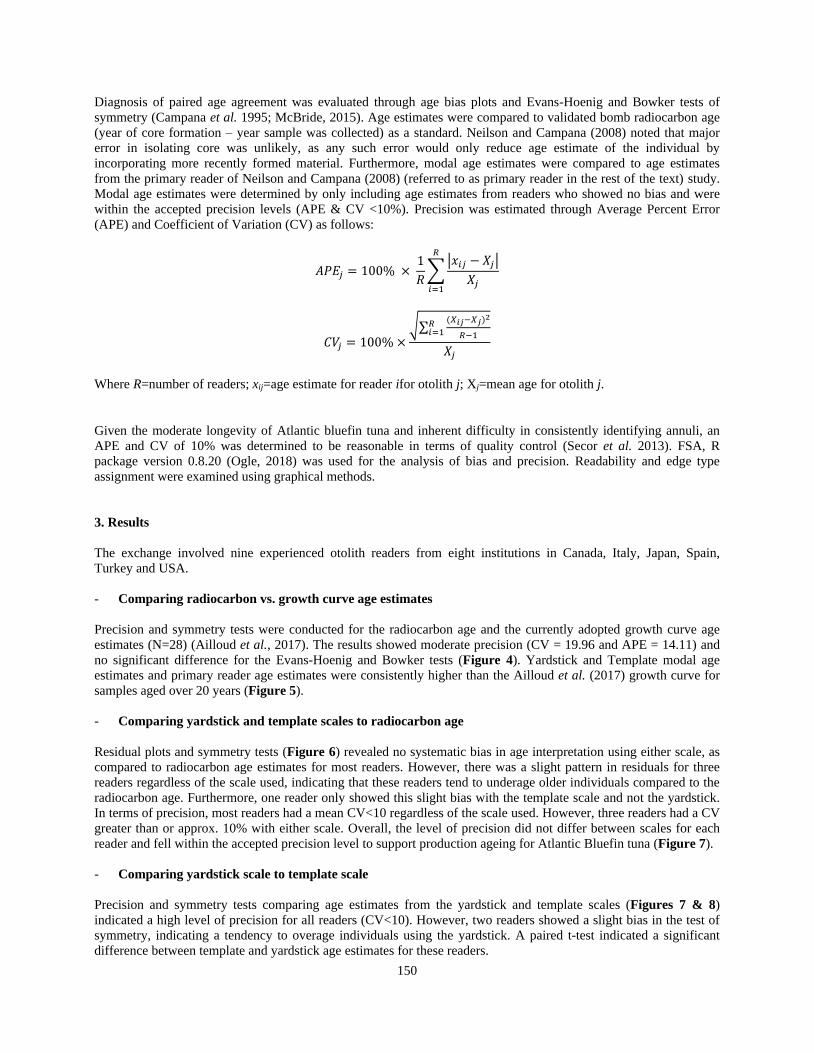
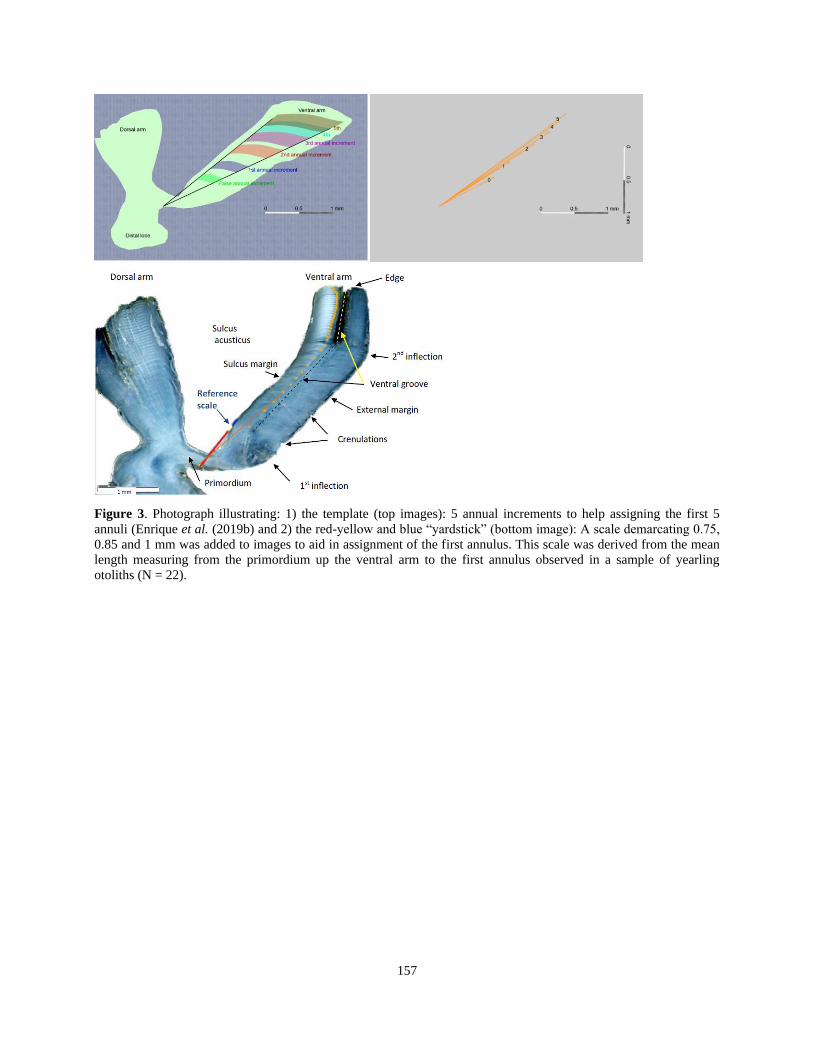
comparing processing protocols. Original images were overlaid with both otolith reference measurements (yardstick
and template) described in Busawon et al. (2015) and Rodriquez-Marin et al. (2019b) (Figure 3). For clarity, the
section originally used in the Neilson and Campana (2008) study will be referred to as NC section (N = 28) and the
standardized section as ST section (N = 17). All images were imaged under reflected light and enhanced using
Photoshop software. Image enhancement filter tools (levels and unsharp mask) were used to improve the contrast of
opaque and translucent bands on the otolith section. It is important to note that original images from the Neilson and
Campana (2008) study were taken without a scale; as a result scale had to be determined by overlaying the drilled
section and fitting it to the original image. In addition, the scale was also determined by taking physical
measurements of landmarks on the image and section (e.g. distance between the dorsal and ventral arm).
A set of 45 images (NC section = 28 and ST section = 17) were read by 9 experienced readers who made two blind
age readings, using the template scale and the yardstick scale (Figure 3). Annual bands (opaque zones) were
annotated on every image using raster layers and final age assignment consisted of counting the number of annotated
annuli on each image, including any partially formed opaque zones on the margin. The readability code and edge
type of each image (i.e., opaque or translucent edge) were also recorded for each otolith image (Table 1).
Furthermore, the first 5 annual increments were measured by each reader (Figure 3). Growth curve age estimates
were calculated using straight fork length and parameters of the Richards growth model (Ailloud et al. 2017).
However, due to the lower mean asymptotic length of the growth curve (L∞ = 271 cm straight fork lengths), age
estimates could not be derived for individuals longer than 271 cm. In these cases, based on visual inspection of the
Richards growth curve, it was assumed that the age of these individuals would range between 30 and 37 years old
and individuals were assigned an age within this range using the sample function in R.
150
Diagnosis of paired age agreement was evaluated through age bias plots and Evans-Hoenig and Bowker tests of
symmetry (Campana et al. 1995; McBride, 2015). Age estimates were compared to validated bomb radiocarbon age
(year of core formation – year sample was collected) as a standard. Neilson and Campana (2008) noted that major
error in isolating core was unlikely, as any such error would only reduce age estimate of the individual by
incorporating more recently formed material. Furthermore, modal age estimates were compared to age estimates
from the primary reader of Neilson and Campana (2008) (referred to as primary reader in the rest of the text) study.
Modal age estimates were determined by only including age estimates from readers who showed no bias and were
within the accepted precision levels (APE & CV <10%). Precision was estimated through Average Percent Error
(APE) and Coefficient of Variation (CV) as follows:
𝐴𝑃𝐸𝑗 = 100% × 1
𝑅∑
|𝑥𝑖𝑗 − 𝑋𝑗|
𝑋𝑗
𝑅
𝑖=1
𝐶𝑉𝑗 = 100% ×√∑
(𝑋𝑖𝑗−𝑋𝑗)2
𝑅−1𝑅𝑖=1
𝑋𝑗
Where R=number of readers; xij=age estimate for reader ifor otolith j; Xj=mean age for otolith j.
Given the moderate longevity of Atlantic bluefin tuna and inherent difficulty in consistently identifying annuli, an
APE and CV of 10% was determined to be reasonable in terms of quality control (Secor et al. 2013). FSA, R
package version 0.8.20 (Ogle, 2018) was used for the analysis of bias and precision. Readability and edge type
assignment were examined using graphical methods.
3. Results
The exchange involved nine experienced otolith readers from eight institutions in Canada, Italy, Japan, Spain,
Turkey and USA.
- Comparing radiocarbon vs. growth curve age estimates
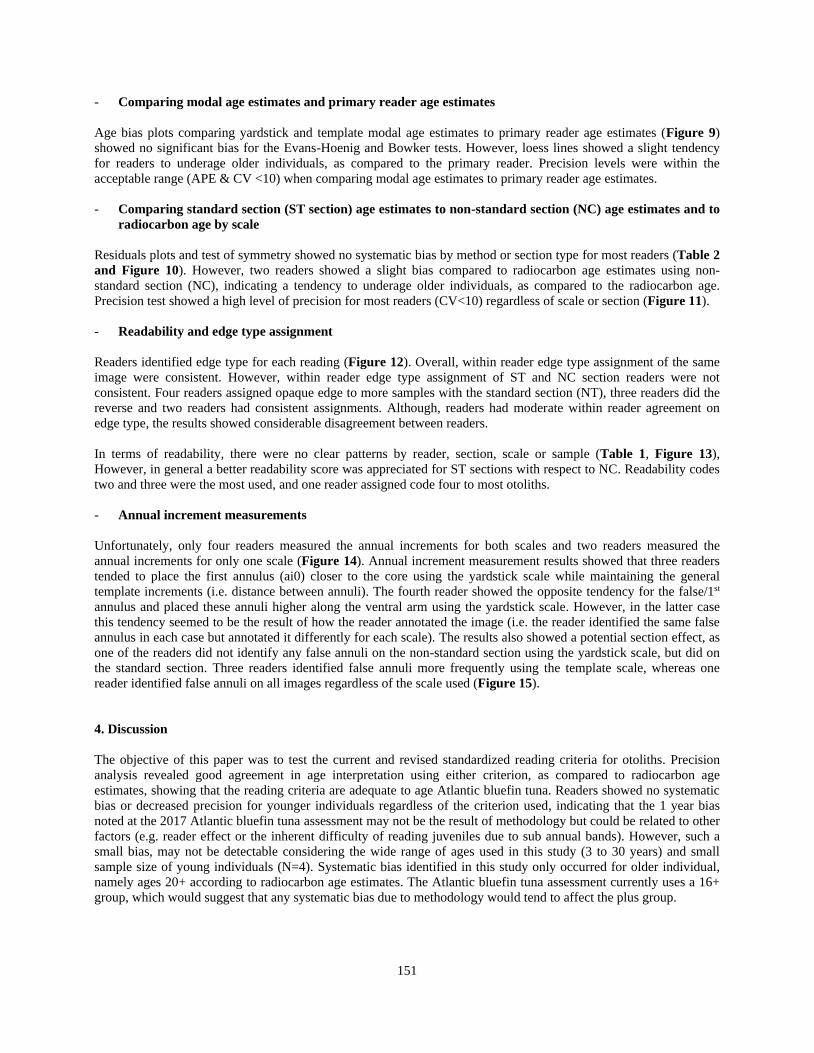
Precision and symmetry tests were conducted for the radiocarbon age and the currently adopted growth curve age
estimates (N=28) (Ailloud et al., 2017). The results showed moderate precision (CV = 19.96 and APE = 14.11) and
no significant difference for the Evans-Hoenig and Bowker tests (Figure 4). Yardstick and Template modal age
estimates and primary reader age estimates were consistently higher than the Ailloud et al. (2017) growth curve for
samples aged over 20 years (Figure 5).
- Comparing yardstick and template scales to radiocarbon age
Residual plots and symmetry tests (Figure 6) revealed no systematic bias in age interpretation using either scale, as
compared to radiocarbon age estimates for most readers. However, there was a slight pattern in residuals for three
readers regardless of the scale used, indicating that these readers tend to underage older individuals compared to the
radiocarbon age. Furthermore, one reader only showed this slight bias with the template scale and not the yardstick.
In terms of precision, most readers had a mean CV<10 regardless of the scale used. However, three readers had a CV
greater than or approx. 10% with either scale. Overall, the level of precision did not differ between scales for each
reader and fell within the accepted precision level to support production ageing for Atlantic Bluefin tuna (Figure 7).
- Comparing yardstick scale to template scale
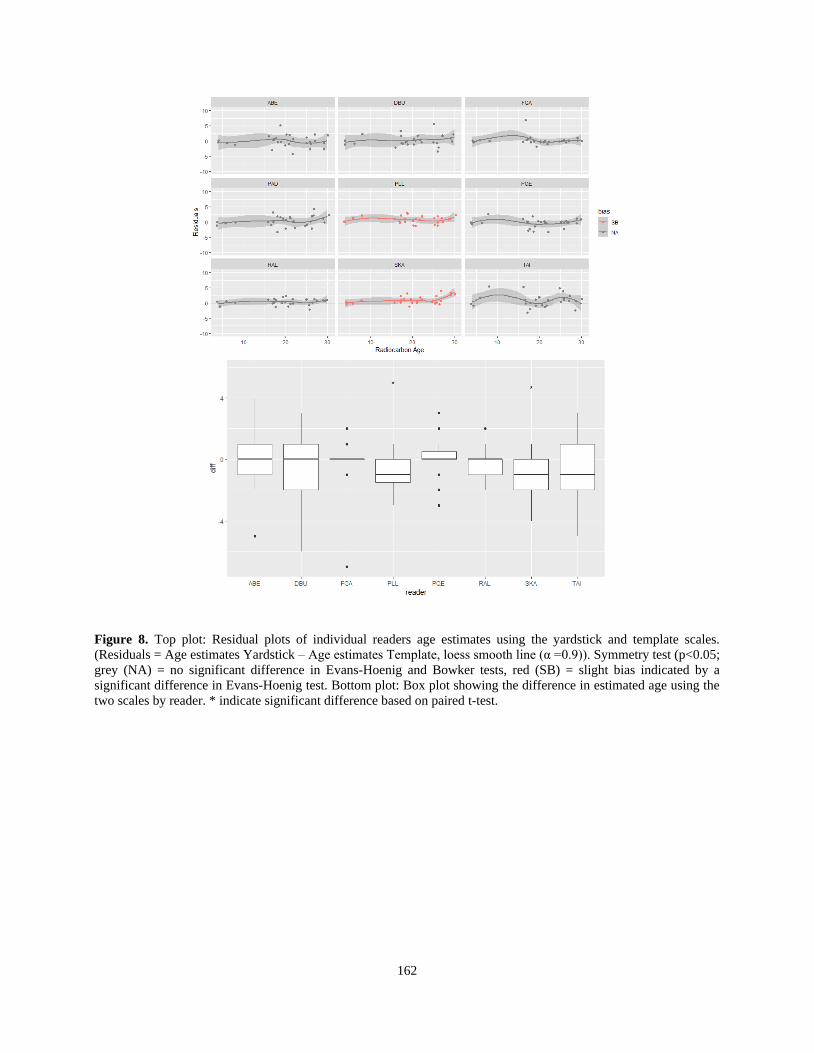
Precision and symmetry tests comparing age estimates from the yardstick and template scales (Figures 7 & 8)
indicated a high level of precision for all readers (CV<10). However, two readers showed a slight bias in the test of
symmetry, indicating a tendency to overage individuals using the yardstick. A paired t-test indicated a significant
difference between template and yardstick age estimates for these readers.
151
- Comparing modal age estimates and primary reader age estimates
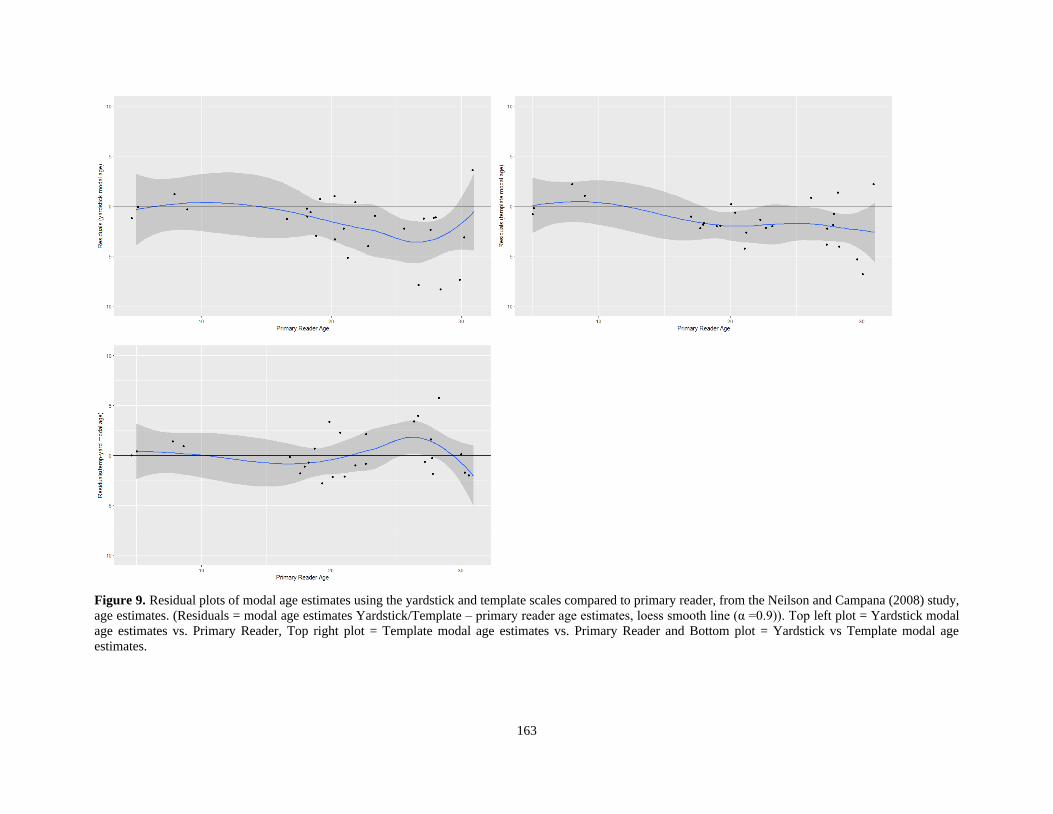
Age bias plots comparing yardstick and template modal age estimates to primary reader age estimates (Figure 9)
showed no significant bias for the Evans-Hoenig and Bowker tests. However, loess lines showed a slight tendency
for readers to underage older individuals, as compared to the primary reader. Precision levels were within the
acceptable range (APE & CV <10) when comparing modal age estimates to primary reader age estimates.
- Comparing standard section (ST section) age estimates to non-standard section (NC) age estimates and to
radiocarbon age by scale
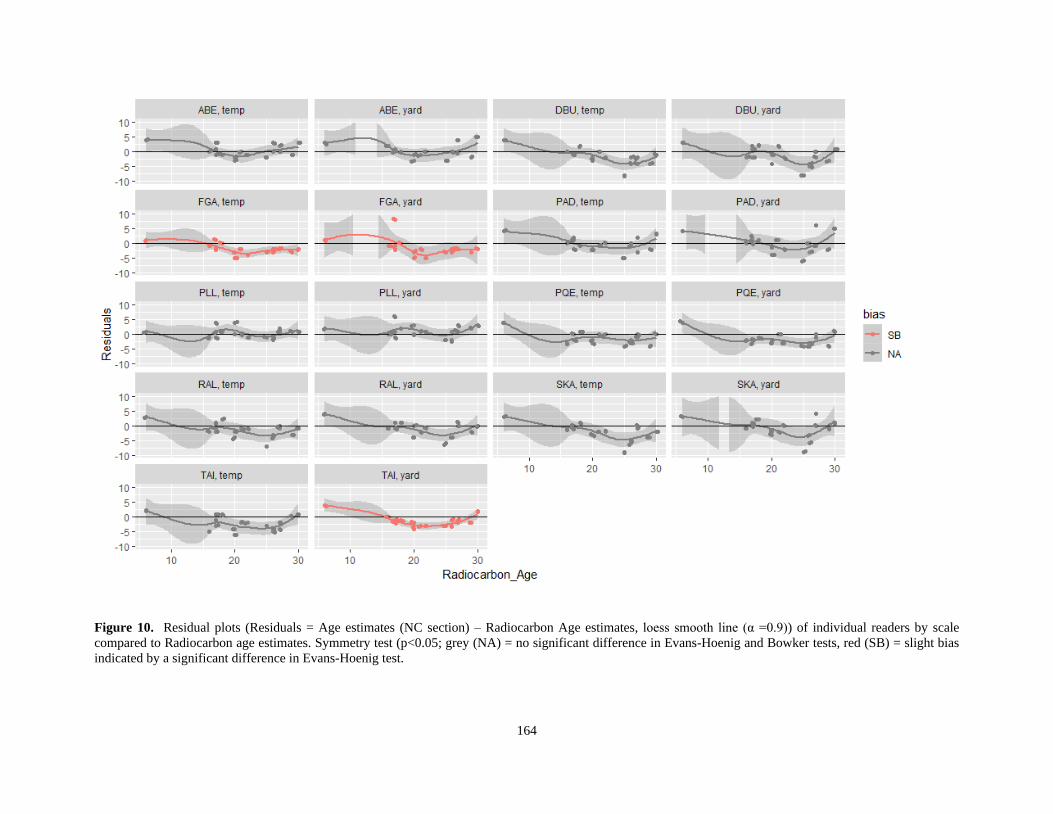
Residuals plots and test of symmetry showed no systematic bias by method or section type for most readers (Table 2
and Figure 10). However, two readers showed a slight bias compared to radiocarbon age estimates using non-
standard section (NC), indicating a tendency to underage older individuals, as compared to the radiocarbon age.
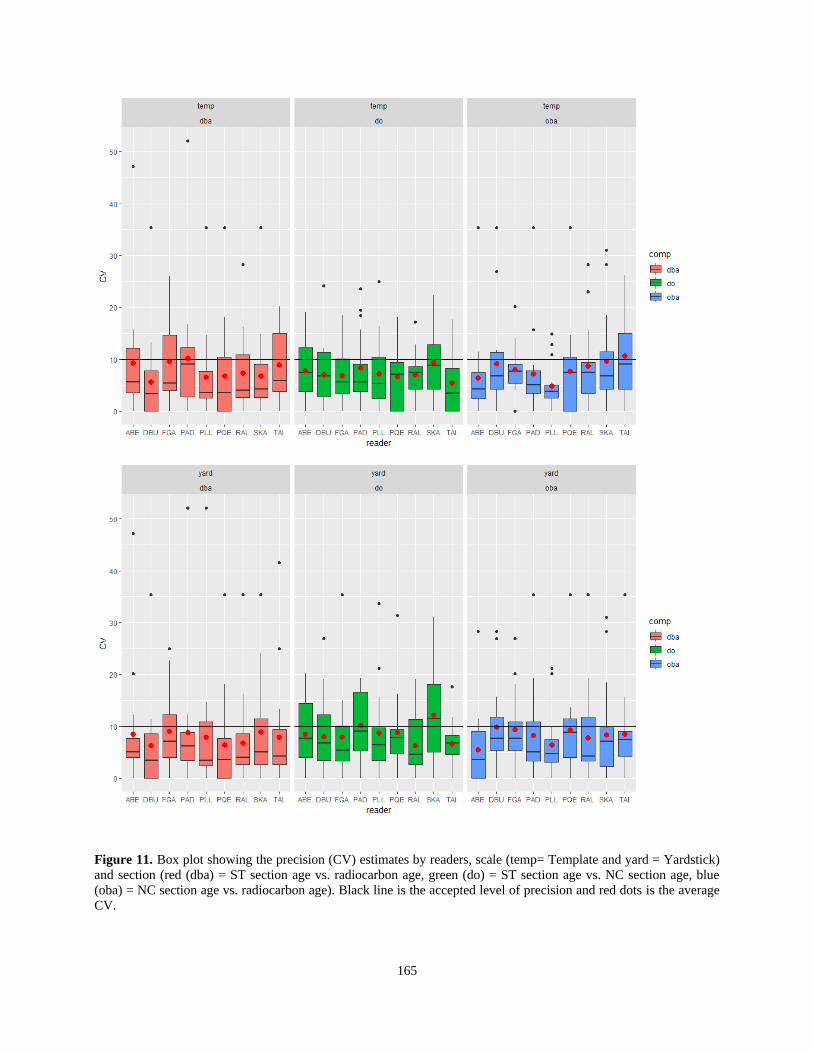
Precision test showed a high level of precision for most readers (CV<10) regardless of scale or section (Figure 11).
- Readability and edge type assignment
Readers identified edge type for each reading (Figure 12). Overall, within reader edge type assignment of the same
image were consistent. However, within reader edge type assignment of ST and NC section readers were not
consistent. Four readers assigned opaque edge to more samples with the standard section (NT), three readers did the
reverse and two readers had consistent assignments. Although, readers had moderate within reader agreement on
edge type, the results showed considerable disagreement between readers.
In terms of readability, there were no clear patterns by reader, section, scale or sample (Table 1, Figure 13),
However, in general a better readability score was appreciated for ST sections with respect to NC. Readability codes
two and three were the most used, and one reader assigned code four to most otoliths.
- Annual increment measurements
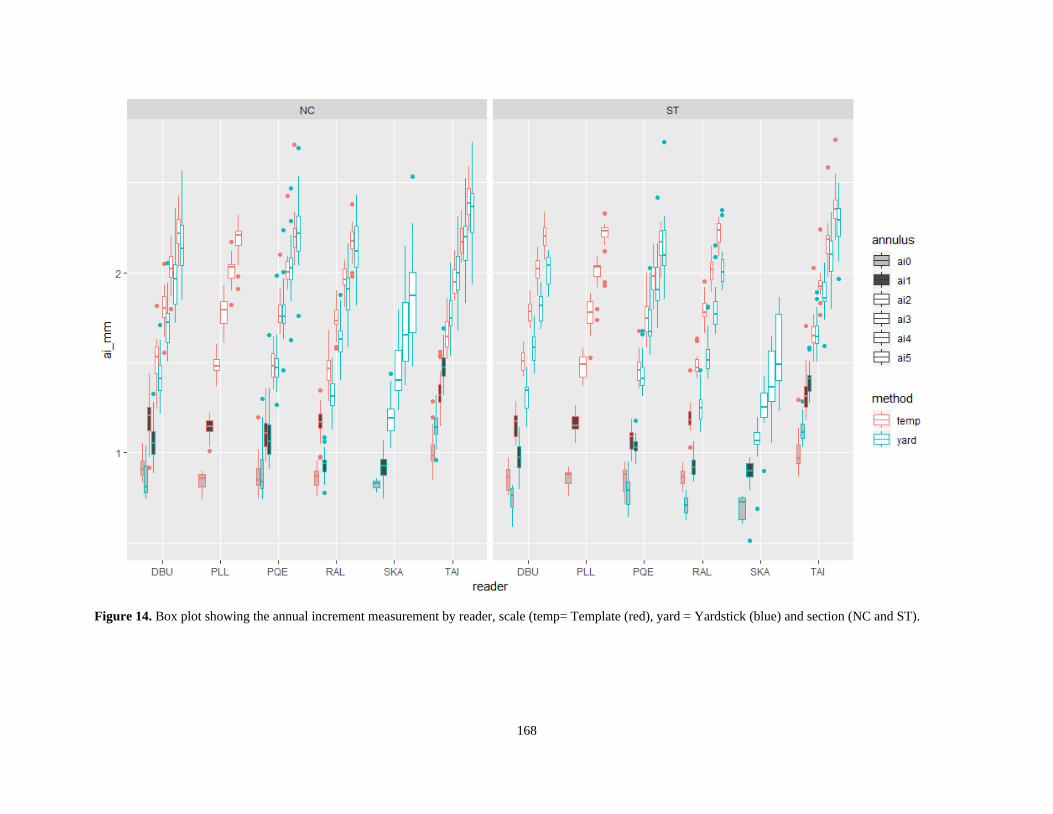
Unfortunately, only four readers measured the annual increments for both scales and two readers measured the
annual increments for only one scale (Figure 14). Annual increment measurement results showed that three readers
tended to place the first annulus (ai0) closer to the core using the yardstick scale while maintaining the general
template increments (i.e. distance between annuli). The fourth reader showed the opposite tendency for the false/1st
annulus and placed these annuli higher along the ventral arm using the yardstick scale. However, in the latter case
this tendency seemed to be the result of how the reader annotated the image (i.e. the reader identified the same false
annulus in each case but annotated it differently for each scale). The results also showed a potential section effect, as
one of the readers did not identify any false annuli on the non-standard section using the yardstick scale, but did on
the standard section. Three readers identified false annuli more frequently using the template scale, whereas one
reader identified false annuli on all images regardless of the scale used (Figure 15).
4. Discussion
The objective of this paper was to test the current and revised standardized reading criteria for otoliths. Precision
analysis revealed good agreement in age interpretation using either criterion, as compared to radiocarbon age
estimates, showing that the reading criteria are adequate to age Atlantic bluefin tuna. Readers showed no systematic
bias or decreased precision for younger individuals regardless of the criterion used, indicating that the 1 year bias
noted at the 2017 Atlantic bluefin tuna assessment may not be the result of methodology but could be related to other
factors (e.g. reader effect or the inherent difficulty of reading juveniles due to sub annual bands). However, such a
small bias, may not be detectable considering the wide range of ages used in this study (3 to 30 years) and small
sample size of young individuals (N=4). Systematic bias identified in this study only occurred for older individual,
namely ages 20+ according to radiocarbon age estimates. The Atlantic bluefin tuna assessment currently uses a 16+
group, which would suggest that any systematic bias due to methodology would tend to affect the plus group.
152
A comparison of the currently adopted growth curve age estimates to the radiocarbon age estimate showed no
systematic bias according to the Evans-Hoenig and Bowker tests, though the loess line on the residual plots seemed
to indicate a tendency for the growth curve to overage older individuals. Furthermore, the level of precision did not
fall within the acceptable levels (APE and CV < 10%). These findings could bedue to the relatively small sample
size. Alternatively, it could be the result of the lower mean asymptotic length of the growth curve (L∞ = 271 cm
straight fork lengths), resulting in the inability to calculate age estimates for larger individuals (SFL > 271 cm).
Growth curve age estimates for individual greater than 271 cm were randomly assigned from a range of 30 to 37
years old, which could have led to this bias and lack of precision. Ailloud et al. (2017) noted that estimates of
variability in size at age could be used to improve the cohort slicing procedure by adjusting the length bounds used to
assign ages. However, a shortcoming in this case is how to assign ages to individuals outside of these limits.
Modal age estimates and primary reader age estimates were consistently higher that the growth curve but fell within
the 2.5 and 97.5 percentiles of the distribution of the fitted length at age. This could indicate ageing data not having a
good fit to the growth curve, however given the small sample size it is hard to draw conclusions.
Measurements of the annual increments indicated that readers identified the same pattern (i.e. distance between
annuli) regardless of the scale used. This pattern was mostly shifted downward when using the yardstick scale
indicating that readers tended to identify the false and 1st annulus lower along the ventral arm without the template.
Furthermore, readers identified false annuli more frequently with the template scale, than with the yardstick scale.
Given that readers tend to be consistent with the general growth pattern (i.e. distance between annuli), the location of
a false annulus will dictate the location of the first annulus on the ventral arm, which could explain the directional
measurement difference between the two scales. The results could also indicate that readers are potentially
identifying a false annulus as the first annulus when using the yardstick scale. However, the lack of bias and the fact
that were no significant difference in yardstick/template age estimates for most readers indicates that this does not
result in a systematic bias, but, as noted by Rodriguez et al. (2019a), this could impact age estimates of juvenile
bluefin tuna. On the other hand, the higher frequency of identification of a false annulus with the template scale and
not the yardstick scale could indicate a potential scale effect on readers. This effect could lead to bias and decreased
level of precision, as a reader consistently identified a false annulus with the template scale and not the yardstick
showed a slight bias in his template age estimates. Given a possible template scale effect and the potential to
misidentify the false annulus using the yardstick scale, it is recommended to only use the template scale as an aid for
hard to interpret juvenile otoliths.
An evaluation of the yardstick and template scale age estimates showed no systematic bias compared to the
radiocarbon age estimates for most readers. However, a slight bias was noted for three readers, showing a tendency
to underage older individuals as compared to the radiocarbon age estimates, regardless of scale used. In addition, two
readers had a slight bias when using one scale over the other. In terms of precision, the ageing error was low among
readers and fell within the acceptable APE and CV (10%) except for three readers who showed moderate precision
levels with CVs between 10% and 15%. Similarly, yardstick and template modal age estimates showed no systematic
bias and adequate level of precision when compared to the primary reader age estimates.
The evaluation of the non-standard section age estimates compared to standard section age estimates yielded similar
results: no bias and adequate precision level for most readers regardless of section and scale used. However, the
readers that did show a slight bias only did so with non-standard sections. Similarly, Secor et al., (2014) detected
significant bias between sections from the same otolith leading to the selection of a standard Y-section due to its
precedence in the literature. Section bias could be due to how the growth increments are laid in sections further from
the core. For instance, growth increment patterns could differ from the template pattern, with annuli being laid closer
together.
Overall, there was good agreement between age estimates using the standardized and revised reading criteria.
However, it is important to note that readings could have been influenced by the revised criteria; for example readers
could be intuitively applying the template pattern due to previous readings using the template scale. The effects of
this are hard to evaluate and could be influencing the results of this study.

153
Given the lack of bias and acceptable level of precision for most readers, the use of yardstick and template scales,
along with the standardized protocols and proposed reading criteria, appear adequate for ageing Atlantic Bluefin
tuna. Observed bias and moderate precision levels appear to be related to random effect (e.g. reader effect) more so
than a result of methodology used. However, itis recommended to better define criteria for edge type assignment, as
a lack of agreement between readers and sections was apparent. Furthermore, the comparison of annual increment
measurements and symmetry test comparing standard and non-standard sections highlighted the importance of using
a standard section, as structures (e.g. false annuli) might not be visible on alternate sections which could lead to
biases.
Conclusions/Recommendations:
- Due to the lack of bias and acceptable level of precision for most readers, the use of yardstick and template
scales along with the standardized protocols and revised reading criteria appear adequate to age Atlantic Bluefin
tuna. Given the potential template scale effect and the potential to misidentify the false annulus using the
yardstick scale, it is recommended to only use the template scale as an aid for hard to interpret juvenile otoliths.
- It is recommended to use the standard section as several exercises, including this one, have reported a section
effect (Secor et al., 2014)
- Edge type assignment criteria need to be better defined. The inclusion of month/season of capture and the
knowledge that the opaque band is formed in winter (Siskey et al. 2016) might be an option.
- It is recommended to include checks to limit reader effect prior to ageing:
- Evaluation of reference collection readings.
- Image exchange (e.g. representative subset of samples) between laboratories to prevent drift between
readers and ensure that standard protocols are being applied.
- It is also recommended to augment the reference set collection to capture variability in samples (e.g.
annotated images from this study and other image exchange)

154
References
Ailloud, L.E., Lauretta, M.V., Hanke, A.R., Golet, W.J., Allman, R.J., Siskey, M.R., Secor, D.H, Hoenig, J. M.,
2017. Improving growth estimates for Western Atlantic Bluefin tuna using an integrated modeling approach.
Fisheries Research 191(2017) 17-24.
Anonymous. 2017. Report of the 2017 ICCAT bluefin stock assessment meeting (Madrid, July 2017).
Busawon, D.S., Rodriguez-Marin, E., Luque, P.L., Allman, R., Gahagan, B., Golet, W., Koob, E., Siskey, M.,Ruiz,
M., Quelle, P. 2015. Evaluation of an Atlantic bluefin tuna otolith reference collection. Collect Vol Sci Pap
ICCAT 71: 960-982
Campana, S.E.; Annand, M.C.; Mcmillan, J.I. 1995. Graphical and statistical methods for determining the
consisteny of age determinations. Transactions of the American Fishery Society. 124:131-138.
McBride. R.S. 2015. Diagnosis of paired age agreement: a simulation of accuracy and precision effects. ICES
Journal of Marine Science; doi:10.1093/icesjms/fsv047
Neilson, J. and S. Campana. 2008. A validated description of age and growth of western Atlantic bluefin tuna
(Thunnus thynnus). Can. J. Fish. Aquat. Sci. 65: 1523-1527.
Ogle, D.H. 2018. FSA: Fisheries Stock Analysis. R package version 0.8.20.
Rodriguez-Marin, E., Clear, N., Cort, J.L., Megalofonou, P., Neilson, J.D., Neves dos Santos, M., Olafsdottir,
D., Rodriguez-Cabello, C., Ruiz, M. and Valeiras, J. 2007.Report of the 2006 ICCAT Workshop for bluefin
tuna direct ageing. Collect. Vol. Sci. Pap. ICCAT, 60(4): 1349-1392.
Rodriguez-Marin E., Di Natale A., Quelle P., Ruiz M., Allman R. , Bellodi A., Busawon D., Farley J., Garibaldi,
F., Ishihara T., Koob E., Lanteri L., Luque P.L., Marcone A., Megalofonou P., Milatou N., Pacicco A., RussoE.,
Sardenne F., Stagioni M., Tserpes G. and Vittori S. 2014. Report of the age calibration exchange within the Atlantic
Wide Research Programme for bluefin tuna (GBYP). ICCAT SCRS doc. SCRS/2014/150
Rodriguez-Marin E., Quelle P., Busawon D., Farley J., Addis P., Allman R., Bellodi A., Garibaldi F., Hanke A.,
Ishihara T.,Karakukak S., Koob E., Lanteri L., Luque P.L., and Ruiz M. 2019a. Juvenile Atlantic Bluefin
tuna otoliths exchange. Collect. Vol. Sci. Pap. ICCAT, 75: 1315-1329.
Rodriguez-Marin E., Quelle P., Busawon D., and Hanke A. 2019b. New protocol to avoid bias in otolith readings
of Atlantic bluefin tuna juveniles. Collect. Vol. Sci. Pap. ICCAT, 75: 1301-1314.
Secor, D.H., Allman, R., Busawon, D., Gahagan, B., Golet, W., Koob, E., Luque, P.L., Siskey, M. 2014.
Standardization of otolith-based ageing protocols for Atlantic bluefin tuna. Collect Vol Sci Pap ICCAT. 70:
357-363.

155
Table 1. Readability codes for Atlantic bluefin tuna otoliths.
Readability Code Definition
1 Pattern present-no meaning
2 Pattern present-unsure with age estimate
3 Good pattern present-slightly unsure in some areas
4 Good pattern-confident with age estimate.
Table 2. Symmetry test by readers and scale for standardized sections (ST) and original sections (NC) (N=17).
p<0.05; - = no significant difference in Evans-Hoenig and Bowker tests, SB = slight bias indicated by a significant
difference in Evans-Hoenig test.
Test of symmetry ABE DBU FGA PAD PLL PQE RAL SKA TAI
Yardstick
NC vs. radiocarbon - - SB - - - - - SB
ST vs. radiocarbon - - - - - - - - -
NC vs. ST - - - - - - - - -
Template
NC vs. radiocarbon - - SB - - - - - -
ST vs. radiocarbon - - - - - - - - -
NC vs. ST - - - - - - - - -
156
Figure 1. Length frequency plot of Atlantic bluefin tuna samples.
Figure 2. Location of the ageing (green box=1mm) and the radiocarbon testing (yellow box=1.2 mm) sections
used in Neilson and Campana 2008 (Top) vs. location of standardized ageing (green box = 0.45 – 0.55 mm) and
micro-constituent (yellow box=2mm) sections (Bottom). NC = original section, ST = standardized section and
the red dot represents the core.
Ageing section
Micro-constituent section Post-rostrum
Rostrum
Ageing section
Micro-constituent section
NC ST
ST
157
Figure 3. Photograph illustrating: 1) the template (top images): 5 annual increments to help assigning the first 5
annuli (Enrique et al. (2019b) and 2) the red-yellow and blue “yardstick” (bottom image): A scale demarcating 0.75,
0.85 and 1 mm was added to images to aid in assignment of the first annulus. This scale was derived from the mean
length measuring from the primordium up the ventral arm to the first annulus observed in a sample of yearling
otoliths (N = 22).

158
Figure 4. Top plot: Age bias plots of radiocarbon age and Ailloud et al. (2017) growth curve age estimates.
(Residuals = growth curve age estimates – radiocarbon age estimates). Bottom plot: illustrates the number of samples
where age was calculated using the Ailloud et al. (2017) growth curve (blue) and samples where age was assigned
within a range of 30-37 years old (red) (numbers = sample ID, line = loess smooth line (α =0.9)).

159
Figure 5. Modal age estimates (red squares = template modal age and blue triangles = yardstick modal age) and
primary reader from the Neilson and Campana (2008) age estimates (black dots) overlaid with the Ailloud et al.
(2017) growth curve (red lines = 2.5 and 97.5 percentiles of the distribution of the fitted length at age).

160
Figure 6. Residual plots of individual readers vs. Radiocarbon age by scale (PM, NC and SC are the readers from the Neilson and Campana 2008 study.
Residuals = Age estimates – Radiocarbon Age, loess smooth line (α =0.9), temp= template, yard= Yardstick, nsm= no standard method used). Symmetry test
(p<0.05; grey (NA) = no significant difference in Evans-Hoenig and Bowker tests, red (SB) = slight bias indicated by a significant difference in Evans-Hoenig
test.

161
Figure 7. Box plot showing the precision (CV) estimates by readers and scale (red (tb) = template vs. radiocarbon age, green (yb) = yardstick vs. radiocarbon age,
blue (yt) = yardstick vs. template). Black line is the accepted level of precision and red dots is the average CV.
162
Figure 8. Top plot: Residual plots of individual readers age estimates using the yardstick and template scales.
(Residuals = Age estimates Yardstick – Age estimates Template, loess smooth line (α =0.9)). Symmetry test (p<0.05;
grey (NA) = no significant difference in Evans-Hoenig and Bowker tests, red (SB) = slight bias indicated by a
significant difference in Evans-Hoenig test. Bottom plot: Box plot showing the difference in estimated age using the
two scales by reader. * indicate significant difference based on paired t-test.
163
Figure 9. Residual plots of modal age estimates using the yardstick and template scales compared to primary reader, from the Neilson and Campana (2008) study,
age estimates. (Residuals = modal age estimates Yardstick/Template – primary reader age estimates, loess smooth line (α =0.9)). Top left plot = Yardstick modal
age estimates vs. Primary Reader, Top right plot = Template modal age estimates vs. Primary Reader and Bottom plot = Yardstick vs Template modal age
estimates.
164
Figure 10. Residual plots (Residuals = Age estimates (NC section) – Radiocarbon Age estimates, loess smooth line (α =0.9)) of individual readers by scale
compared to Radiocarbon age estimates. Symmetry test (p<0.05; grey (NA) = no significant difference in Evans-Hoenig and Bowker tests, red (SB) = slight bias
indicated by a significant difference in Evans-Hoenig test.
165
Figure 11. Box plot showing the precision (CV) estimates by readers, scale (temp= Template and yard = Yardstick)
and section (red (dba) = ST section age vs. radiocarbon age, green (do) = ST section age vs. NC section age, blue
(oba) = NC section age vs. radiocarbon age). Black line is the accepted level of precision and red dots is the average
CV.

166
Figure 12. Tile plot of edge type assigned by each reader (red = opaque, black = translucent and white = no edge
assigned; top left = template, top right = yardstick, bottom left = ST section, bottom right = NC section)

167
Figure 13. Tile plot of readability code assigned by each reader (Black = 1, Red = 2, Green = 3 and Blue = 4; top left
= template, top right = yardstick, bottom left = ST section, bottom right = NC section)
168
Figure 14. Box plot showing the annual increment measurement by reader, scale (temp= Template (red), yard = Yardstick (blue) and section (NC and ST).

169
Figure 15. Histogram showing the frequency of false annuli (ai0) by reader and scale (temp= template, yard =
yardstick).

170
Appendix 1
Protocol for the preparation of Atlantic Bluefin tuna otoliths
- Image capture of whole intact otolith shape analysis and metrics
- Weight whole intact otoliths
- Embedded otolith for sectioning: It is recommended to obtain both age estimates and natal origin of
Atlantic Bluefin tuna from one otolith.
- otolith section: Y section
• Trials showed a definite bias of approximately one additional annulus in Y sections than in V
sections. Although there is no basis for selecting one section over the other (no way to
determine if higher or lower age is correct), precedence in publications (Hurley and Iles 1982;
and Neilson and Campana 2008) would favor use of the Y section for the purpose of
consistency.
- Image ageing section: reflected vs. transmitted light
• Trials indicated nil effects due to light type. It was agreed that light type, when sufficiently
matched with a standardized image enhancement procedure, was a matter of preference
(Busawon et al (2015).
Reading criteria
These criteria (highlighted in cursive) are simply a guide that seeks to complement the criteria defined by Busawon
et al. (2015), whose instructions are also included (normal font).
Prior to production ageing, readers should read the reference set one time single blind under their preferred light
type. A precision level of APE and CV of 10% or lower and no bias would be acceptable to support production
ageing. The reference set should also be used to monitor ageing consistency over time as well as among age readers
(relative bias and precision) and for training purposes.
- Identification of annuli on otolith section.
• View sections (or images) under either transmitted or reflected light.
• Annuli are a bipartite structure consisting of a translucent and opaque zone.
• Age is estimated by counting opaque growth zones. These appear dark under transmitted light and
white under reflected light.
• The ventral (long) arm is used for age estimates whereas the dorsal (short) arm can be used as
check; however it is important to remember that the dorsal arm tends to underestimate age.
• There are no annual growth increments between the “primordium” and the 1st inflection.
• Start reading at the “primordium” and proceed towards the edge of the ventral arm. It is
recommended to count annual increments at the upper part of the ventral groove.
• The ventral arm can be divided in 3 general regions as one travels from the primordium to the edge
of the ventral arm:
o 1stregion: Annuli are broad and diffuse and contain multiple translucent and opaque zones
(~1-5annuli). These annual growth zones are broad and contain multiple sub-annual
translucent and opaque bands, although less marked than the annual ones, this is
especially common between the first and second annulus. First 4 annual increments
should cover the width of the ventral arm (marked throughout the entire arm).
Crenulations (grooves along the margins) may aid in the identification of growth zones.
The distance between the first five annuli is greater than in the rest.

171
o 2ndregion: Annuli are less broad and closer together (~5-10 annuli). From the fifth, the
distance between annuli decreases and from the eighth or ninth annual deposition, and
especially after the second inflection, the deposition of the annual bands is distinct and
regular.
o 3rdregion: Annuli appear clearer and are regular in width (~ 10+ annuli).
• The section of the ventral arm between the first and second inflection is difficult to interpret. The
first 10annual bands are located in this section and sub-annual marks are frequently observed.
Here are some guidelines to help interpretation:
o The appearance of a false sub-annual increment or annulus 0, which can even present
crenulation, is frequent (40% of the sections from a sample of n = 131). The false annulus
is less marked than the first three true annual increments. The distance from the first
inflection to the false annulus is less than the width of the ventral arm. The false annulus
is at approximately half the distance between the 1st inflection and the 1st annual
increment.
o Use the reference scale as a guide to identify the first annulus. The first annual deposition
should be within this distance of 1 mm, measured as annual increment measurement.
o The second annulus is about one third the distance of the first one (annual increment
measurement). The recognition of the first two annuli is important to establish the
deposition pattern of the first 5 annual bands, including the gradual decrease of the
distance between them
o A template has been developed to help locate the first five annuli.
• Edge type assignment. Follow these guidelines to help identify the type of edge of the ventral arm
(edge of the last annulus), opaque or translucent, since it is difficult to determine and therefore,
whether it is counted or not.
o View both the enhanced and un-enhanced version of the image. Keep in mind that the
thickness of the section and the diffraction of light can influence the perception of the type
of edge.
o Edge type should only be noted if more than 50% of the edge is visible across the width of
the ventral arm. Dorsal arm can be used to corroborate this edge type and with the same
criterion of50%.
o The edge is considered of one type or another (translucent or opaque) when there is a
clear band (around 0.01 mm width) not just as a thin line. According to Siskey et al. 2016,
the opaque band of the annual bipartite structure is formed in winter, but is shown or
appreciated later at the edge of the section, i.e. about 6 months later.
• Converting annuli counts to Age estimates.
o The adopted rule for otoliths is that when counting opaque bands: if the fish is caught
between January 1st and June 1st, then 1 year is added to the age. When counting
translucent bands: if the fish is caught between June1st and 31st of December, then 1 year
is subtracted to the age (Rodriguez-Marin et al. 2016b)


