
UNIVERSIDADE DE LISBOA
FACULDADE DE CIÊNCIAS
DEPARTAMENTO DE ENGENHARIA GEOGRÁFICA, GEOFÍSICA E ENERGIA
Evaluation of dehumidification system energy usage in
ice rinks
Diogo Bermejo Pereira Rodrigues da Silva
Dissertação
Mestrado Integrado em Engenharia da Energia e do Ambiente
Ano 2013

Evaluation of dehumidification system energy usage in ice rinks
Diogo Bermejo Pereira Rodrigues da Silva 2
UNIVERSIDADE DE LISBOA
FACULDADE DE CIÊNCIAS
DEPARTAMENTO DE ENGENHARIA GEOGRÁFICA, GEOFÍSICA E ENERGIA
Evaluation of dehumidification system energy usage in
ice rinks
Diogo Bermejo Pereira Rodrigues da Silva
Dissertação de Mestrado Integrado em Engenharia da Energia e do Ambiente
Trabalho realizado sob a supervisão de:
Jörgen Rogstam (Energi & Kylanalys)
Marta João Nunes Oliveira Panão (FCUL)
Ano 2013

Evaluation of dehumidification system energy usage in ice rinks
Diogo Bermejo Pereira Rodrigues da Silva 3
Abstract
Ice skating rinks are one of the largest energy consumers in terms of public buildings due to its
simultaneous needs of cooling, heating, ventilation and lighting for different parts of the structure,
which means that these facilities have also a lot of potential for saving energy.
Saving energy from dehumidification systems in ice rinks is a subject that still needs to be developed
and investigated with an increased focus in matters of energy efficiency in these types of structure.
The performance of the dehumidification system of diverse ice rinks located near the city of
Stockholm, Sweden, is here analysed in order to evaluate the use of energy related to indoor and
outdoor climate. The connection of a district heating system to a dehumidifier in Älta ice rink is also
investigated, with the final conclusion that the amount of electricity that the system is able to save is
nearly 50%.
There are two different types of dehumidifiers and their energy consumption is studied and further
compared with the obtained values of energy usage by the refrigeration system to dehumidify the air
using the ice slab. The results show that the ice slab uses much less energy comparing with the
dehumidifier system (0,336 and 2,076kWh/kg water, respectively, in Älta ice rink case).
The bibliography points out that the energy use related to dehumidification of an ice rink is 4 to 6% of
the total ice rink energy consumption but, in this project, that real value is accurately quantified using
proper equipment for Swedish ice rinks and observe that percentage is, actually, underestimated in the
current “state of art”.
At the moment, the number of ice rinks in Sweden is about 350 and the average of the annual energy
consumption is about 1000 MWh/year. With current knowledge that the number of installations is
growing in a rate of 5-10 per year in the country, energy saving measures are evaluated and studied in
these facilities in order to upgrade the old structures and improve the new ones.
Key words: energy efficiency, ice rink, dehumidification system

Evaluation of dehumidification system energy usage in ice rinks
Diogo Bermejo Pereira Rodrigues da Silva 4
Acknowledgment
I would like to express my special gratitude to those who had given me their contribution, in some
way, to complete this master project report. Particularly, I want to express my appreciation to Jörgen
Rogstam, for the opportunity of working close to industrial reality in a foreign country, for his support
and motivation when things were not going so well. I would like to thank my master thesis supervisor,
Marta Panão, for her valuable help structuring the work and for her precious advises.
My friends, from my University and from my hometown, made me feel that they were always there
(even if they were not) and I also wish to dedicate some words to them, for their support by distance in
my adventure abroad. For the friends I made in Sweden, I also have some words of gratitude for their
support and friendship as well.
Special thanks to my friend Daniel Santos, who shared with me the adventure in Sweden and also
worked in a similar theme. It was always meaningful to have someone near to discuss some related
topic and to keep each other motivated with the work.
My last words, and the most important for me, go to my family, with special consideration to my
parents, Carlos Silva and Maria Eduarda Silva, and to my sister, Alice Bermejo Silva, for their
continuous support and trust.
Thanks to all above. Even in difficult times, we made it happen. We can build an ice rink everywhere.

Evaluation of dehumidification system energy usage in ice rinks
Diogo Bermejo Pereira Rodrigues da Silva 5
Contents
Abstract ................................................................................................................................................... 3
Key words: .............................................................................................................................................. 3
Acknowledgment .................................................................................................................................... 4
1. Introduction ..................................................................................................................................... 7
1.1 Aim and Objectives ................................................................................................................. 7
1.2 Methodology ........................................................................................................................... 8
1.3 Scopes and Limitations ........................................................................................................... 9
2. Ice rinks ......................................................................................................................................... 10
2.1 Ice rinks energy system ......................................................................................................... 10
2.2 Refrigeration system in Ice Rinks ......................................................................................... 12
2.3 Heat Loads in Ice Rinks ........................................................................................................ 14
2.3.1 Conductive Loads .......................................................................................................... 14
2.3.2 Convective Loads .......................................................................................................... 15
2.3.3 Radiation Loads ............................................................................................................. 15
2.4 Ice rinks energy saving potential ........................................................................................... 16
2.4.1 Heat loads decrease ....................................................................................................... 16
2.4.2 Improvement of the distribution system performance ................................................... 18
2.4.3 Ice/concrete slab quality enhancement .......................................................................... 19
3. Dehumidification in Ice rinks analysis .......................................................................................... 21
3.1 Introduction to dehumidification in ice rinks ........................................................................ 21
3.2 Dehumidification technologies .............................................................................................. 21
3.2.1 Dehumidification absorption type ................................................................................. 21
3.2.2 Dehumidification refrigeration type .............................................................................. 22
3.3 Ice Rinks included in the study ............................................................................................. 24
3.4 Sensors Analysis – Climacheck Software ............................................................................. 25
3.4.1 Evaluation of Climacheck sensors performance ........................................................... 26

Evaluation of dehumidification system energy usage in ice rinks
Diogo Bermejo Pereira Rodrigues da Silva 6
3.5 Indoor climate analysis through differences in ice temperature ............................................ 31
4. Ice rinks dehumidifier energy consumption .................................................................................. 33
4.1 Älta ice rink Dehumidifier – Energy consumption ............................................................... 35
4.2 Ice rinks dehumidifier energy consumption – Detailed analysis ........................................... 36
4.3 Potential of energy reduction by the use of district heating .................................................. 38
4.4 Nacka ice rink dehumidification performance – case study .................................................. 40
4.5 Dehumidification indoor activity vs. no activity – Saltsjöbaden case study ......................... 42
4.6 Shares for dehumidification energy consumption in ice rinks .............................................. 43
5. Dehumidifier types analysis .......................................................................................................... 45
5.1 Dehumidifier performance in Älta and Saltsjöbaden – absorption type................................ 45
5.2 Dehumidifier performance in Norrtälje – refrigeration type ................................................. 46
5.3 Diffusion Load Calculation in ice rinks ................................................................................ 48
6. Radiation Model analysis .............................................................................................................. 50
7. Conclusion ..................................................................................................................................... 54
Suggestions for future work .................................................................................................................. 56
8. References ..................................................................................................................................... 57
9. Annexes ......................................................................................................................................... 59
Annexe A - Constants used regarding water vapour saturation pressure calculation ............................ 59
Annexe B - Dehumidifier Fuktkontroll AB – DA 6000 information .................................................... 60
Annexe C - Dehumidifier Munters – MCD40 information ................................................................... 61
Annexe D - Electricity consumption analysis in Nacka, Saltsjöbaden and Vikingahallen ice rinks ..... 63

Evaluation of dehumidification system energy usage in ice rinks
Diogo Bermejo Pereira Rodrigues da Silva 7
1. Introduction
Energy use has always been an important issue for global science and the exploration of renewable
energy has always been present since the beginning of time: before the development of coal usage in
the nineteenth century, relative to industrial revolution, the most part of energy consumption in the
world was provided by renewable energy such as water power, wind and biomass.
Subsequent to industrial revolution, the usage of petroleum and natural gas substantially increased.
The large consumption of fuels resources was a driver to research alternative sources of energy. This
fact was justified, not only because of the intensive extraction of petroleum and natural gas from their
reserves, but also by the associated environmental problems. It was necessary to change the type of
energy system used on a long-term development, controlling the high levels of energy use in the world
and accessing to a sustainable energy plan, with the main objective of improving the sustainable
energy from renewable energy sources and the energy efficiency.
Unfortunately, there is still a long way to go to reach the point where renewable energy sources are the
dominating resources of energy and, in reality, the best answer to the problems associated with the
highest consumption in the world is using the energy that we already produce in an efficient way.
Ice skating installations are one of the largest energy consumers in terms of public buildings and areas
with simultaneous needs of cooling, heating, ventilation and lighting for different parts of the
structure. Ice skating rinks may be often associated to countries with an extensive cold climate average
per year, but it is a fact that an ice rink can be build everywhere, even in countries that never had snow
or ice.
Canada and United States of America are the countries in the world with the highest number of ice
skating rinks built (more than 5000 ice rinks built in both countries), followed by the Scandinavian
countries of Sweden and Finland (more than 500) in Europe [1].
The number of ice rinks in Sweden is about 350 and grows in a rate of 5 to 10 new constructions per
year [2]. At the moment, the average annual energy consumption of an ice rink in the country is 1000
MWh/year, where 82% is electricity and 18% is heat [3], provided from recovering system installed in
the refrigeration system of the ice rink installation or district heating pipes distribution of heat.
Currently, the total energy consumption of indoor ice rinks reach, in Sweden, reaches the total value of
300GWh/year. Since indoor ice rinks are still increasing numbers in the country, it is very important to
practise a policy of sustainability and search for better energy efficient techniques, given that the
amount of energy used to these facilities will continuously increase.
The dehumidification system of an ice rink is indispensable in order to control the quality of the
indoor air, keeping it in a standard level and avoiding problems due to the presence of moisture, such
as degradation of structure materials, corrosion of metal, rotting of the wooden structures and
development of fungi and bacteria but, dehumidification in ice rinks is still a very delicate subject in
terms of energy efficiency concerning these public buildings.
The energy consumption related to dehumidification in an ice rink is estimated to be 6% of total
energy consumption of system. However, due to the fact that ice rinks require huge amount of energy,
the potential to save energy is still high [1, 2].
1.1 Aim and Objectives
The aim of this thesis is to evaluate the potential of saving energy in Swedish ice rinks, specifically
regarding to the dehumidification systems. The analysis is based on studies of existing reference ice
rinks concerning the energy use of their dehumidifiers and refrigeration systems to dehumidify the
internal of the ice rink structure.

Evaluation of dehumidification system energy usage in ice rinks
Diogo Bermejo Pereira Rodrigues da Silva 8
The main objectives of this project are referred in the following points:
- Analysis of four ice rinks dehumidifier performances associated to different outdoor
water content in order to evaluate the dehumidification load related to internal moisture
source.
- Evaluation of the potential of electricity saving when district heating system is connected
to the dehumidifier in Älta ice rink;
- Compilation and analysis of total energy related to dehumidification in five different ice
rinks and evaluation of the percentage associated with the total of energy used by the ice
rink.
- Evaluation of the energy consumption of different types of dehumidifiers: absorption type
and refrigeration type dehumidifier installed in different ice rinks.
- Evaluation of the radiation model completed in previous work Evaluation of Energy
Saving Measures in Ice Rinks by Zhang Z., master thesis at KTH School of Industrial
Engineering and Management of Stockholm, in 2010, analysing the inside walls
temperature of an ice rink, for different seasons of the year.
In order to obtain the best results to reach the proposed main objectives, the following steps are also
planned:
- Evaluation of the precision of temperature and relative humidity measured by the
Climacheck sensors in six different ice rinks;
- Evaluation of the ice temperature impact on the remnant climate inside the ice rink
structure;
- Investigation of the high values of energy consumption associated with dehumidification
and respective recovered heat system installation analysis in Nacka ice rink.
- Comparison analysis of the total load used by the dehumidification system in
Saltsjöbaden ice rink in a period with activity and in another occasion with no activities
inside.
1.2 Methodology
In order to accomplish all the proposed objectives, the methodology has been divided into three steps.
The first step is to start with literature review of ice rinks technologies, heat loads in an ice rink and
methods to save energy in the area, presenting some solutions related to energy efficient methods
already used.
The second step corresponds to posterior collection of the temperature and relative humidity data
provided by Climacheck software. Ice rinks considered in this study are equipped with several sensors
responsible to record data and to measure temperature and relative humidity, which enable ice rinks
monitoring.
Portable sensors responsible to measure temperature or relative humidity can be installed in specific
places where there is the need of getting data to analyse.
The third step is referred to the analysis and comparisons of the calculations accomplished, in order to
get the best results concerning the energy efficiency in dehumidification system of ice rinks.
Evaluation of dehumidification system energy usage in ice rinks
Diogo Bermejo Pereira Rodrigues da Silva 9
1.3 Scopes and Limitations
This project focus on five ice rinks located near the city of Stockholm, in Sweden (Älta, Saltsjöbaden,
Vikingahallen, Norrtälje and Nacka ice rinks). The study was realized with information provided by
Climacheck software related to the year of 2011 until February of 2013.
Some part of this investigation has specific focus on daily average values in a monthly based study
that is going to be clearly mentionated in the beginning of the corresponding involved study. Despite
the fact that all ice rinks have very similar external conditions, activity and dimensions of the building
make each ice rink a unique case, therefore, the solution which applies to one ice rink, may not be very
suitable to apply in other. Each ice rink needs to be particularly studied.
Some data from Climacheck sensors are not available for important periods of the study in some ice
rinks so it was necessary to request climate data from Swedish Meteorological and Hydrological
Institute (SMHI).
Some temperature and relative humidity information is necessary but not available in Climacheck, so
some sensors were installed and connected to Climacheck software to obtain the measured data.
An additional limitation of the study is that some parameters used in the equations are unknown.
Those parameters are clearly mentioned in the text as well as the best guess assumed for the unknown
parameters.
Evaluation of dehumidification system energy usage in ice rinks
Diogo Bermejo Pereira Rodrigues da Silva
10
2. Ice rinks
2.1 Ice rinks energy system
Ice rinks need to be considered as complex buildings that should provide different inside temperature
ranges, which require highly energy systems and could greatly benefit from energy saving measures.
In Sweden, the annual average energy consumption of a typical ice rink is 1000MWh/year and, the
energy consumption of the total number of ice rinks in the country exceeds the value of 300GWh/year
[2].
Ice rinks have very specific requirements comparing with ordinary public buildings because there is a
wide range of demands. For instance, there is the permanent need of cooling and heating to
simultaneously provide temperatures ranging from -4°C (ice slab) to 20°C (area reserved for
spectators) and 60°C (domestic hot water).
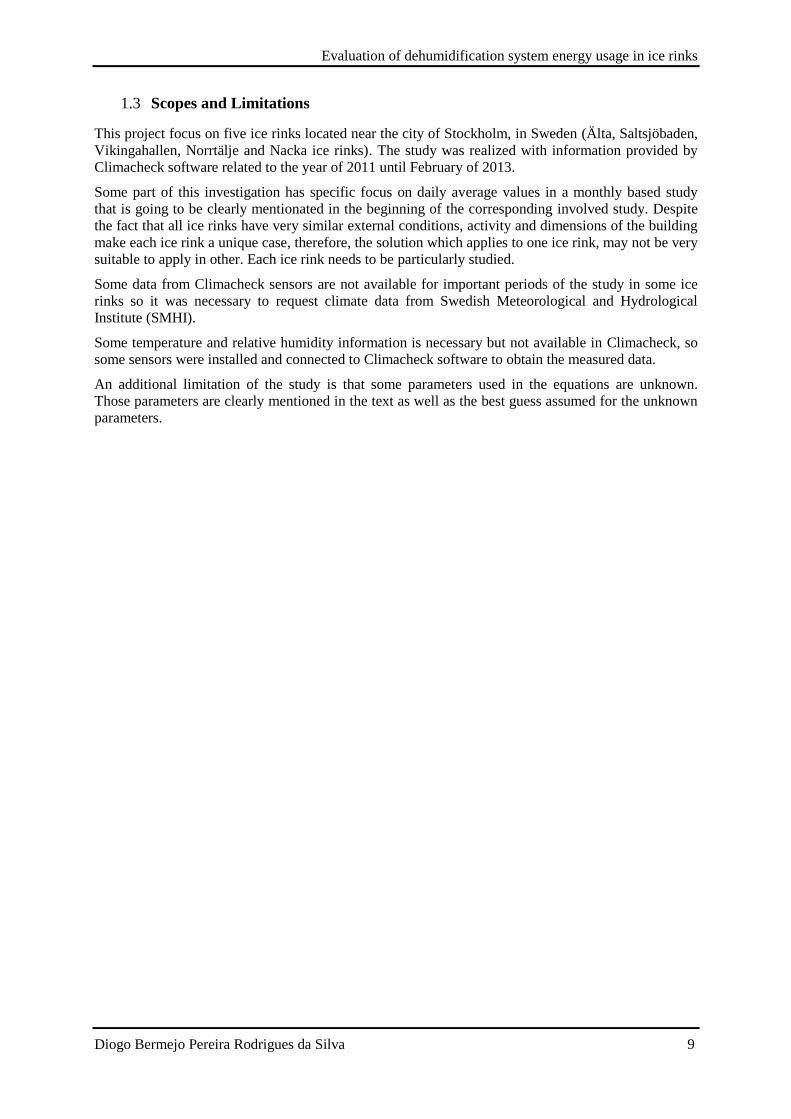
Fig.1 – Energy systems in ice rinks [3].
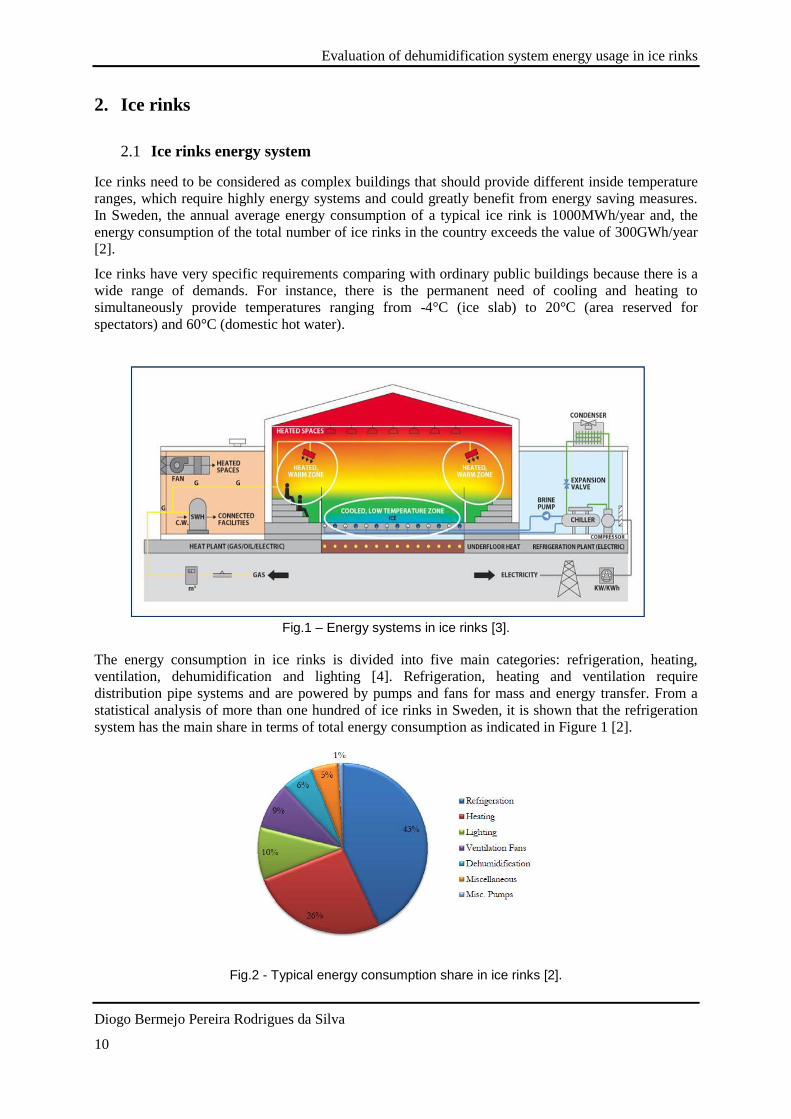
The energy consumption in ice rinks is divided into five main categories: refrigeration, heating,
ventilation, dehumidification and lighting [4]. Refrigeration, heating and ventilation require
distribution pipe systems and are powered by pumps and fans for mass and energy transfer. From a
statistical analysis of more than one hundred of ice rinks in Sweden, it is shown that the refrigeration
system has the main share in terms of total energy consumption as indicated in Figure 1 [2].
Fig.2 - Typical energy consumption share in ice rinks [2].

Evaluation of dehumidification system energy usage in ice rinks
Diogo Bermejo Pereira Rodrigues da Silva
11
Refrigeration is the most important energy system of an ice rink, since it is the responsible for keeping
the ice in its solid state, avoiding water melting. For a typical ice rink, the cooling capacity is around
300-350kW [1].
Fig.3 – Indirect refrigeration system [1].
In ice rinks, the heating system is also very important since it is responsible for heating supply of
domestic hot water, ice resurfacing water, snow melting, floor and subsoil heating. The required heat
sources can be fossil fuels, electricity or district heating but, the most profitable source, in financial
and environmental terms, is the use of the heat rejected by the refrigeration system through the
condenser or the desuperheater. As shown before, the refrigeration system has the main share in the
total energy consumption. Therefore the amount of heat pumped by that system can partially or totally
cover the heating demand [5].
Fresh and clean air is delivered to the indoor space through the ventilation system, which provides the
air exchange, avoiding the concentration of pollutants and smells. The ventilation system in ice rinks
has to be studyed as a particular case due to the dissimilar requirements of ventilation between the ice
slab and public areas. Direct air blown to the ice surface should be avoided to conserve the quality of
the ice and, for the public areas, the ventilation system has to be considered to closed spaces as the
stands and other rooms, such as restaurants, offices, locker rooms, medical rooms and toilets [1].
Fig.4 – Ventilation duct over the stands in a Swedish ice rink [3].

Evaluation of dehumidification system energy usage in ice rinks
Diogo Bermejo Pereira Rodrigues da Silva
12
Dehumidification system is the responsible for keeping the relative humidity of the indoor air below a
standard level. The humidity of the air needs to be controlled for ice quality reasons and in order to
keep the quality of the breathable air. The dehumidification system also avoids the degradation of the
structural materials, by metal corrosion or rotting of the wooden structures as well as the development
of fungi and bacteria [6]. In Chapters 3 to 5 the dehumidification system of some specific ice rinks is
analysed in more detail.
Fig. 5 – Dehumidification system in Nacka ice rink
Indoor lighting is a basic requirement, providing a pleasant indoor condition for skaters and spectators.
Different activities inside the ice rink require different light intensities; so that it is possible to decrease
the energy consumption by the controlling the lighting system according to the ongoing activity [7].
2.2 Refrigeration system in Ice Rinks
The refrigeration system is responsible for keeping the ice in its most desired condition and it is the
main energy consumer of the building. The refrigeration system is divided into two main important
parts: a mechanical refrigeration unit, which produces the cooling energy, and a distribution system, or
secondary cooling system, which is responsible to cool the ice surface [8].
There are three types of refrigeration system design: i) indirect system, ii) direct system and iii) a
combination of the previous two, the partly indirect system. The first two are shown in Figure 6.
Fig.6 – Indirect and direct (respectively) refrigeration system in ice rinks.

Evaluation of dehumidification system energy usage in ice rinks
Diogo Bermejo Pereira Rodrigues da Silva
13
The ice rink is usually frozen by circulation of a heat transfer fluid through a system of tubes or pipes,
placed under a concrete slab, under the surface of the ice. The heat transfer fluid is predominantly a
secondary coolant such as glycol, methanol or calcium chloride. R-717 (Ammonia) is most frequently
used for chilling secondary coolants for ice in Sweden.
About 97% of ice rinks in Sweden use the indirect system or the partly indirect designs. R-717 is used
as the refrigerant in about 85% of ice rinks in Sweden, while the remaining use R404A, R134 or other
HFC refrigerants [9].
In the direct system, the distribution system works as the evaporator and only one type of refrigerant
flows through the whole piping circuit. The direct-refrigerant rinks operate at higher compressor
suction pressures and temperatures, thus achieving a high coefficient of performance (COP), compared
to those using secondary coolants [10].
Although the energy efficiency of the direct system is commonly higher than the efficiency of the
indirect system, this method is rarely applied in the ice rinks designs. It demands a huge amount of
refrigerant charge and R-717 has a charge limit according to its hazards and, therefore, cannot be used
in large systems. Furthermore, the capital investment required for a direct system is higher than the
required by an indirect system, in addition its design and installation requires more specialized skills
[1].
Indirect system is the most usual design for ice rink refrigeration system. In this system, a primary
refrigerant, such as ammonia, cools a secondary refrigerant, identified as “brine”, such as calcium
chloride (CaCl2). The distribution system circulates this secondary refrigerant below the ice pad and
returns it back to the evaporator. A typical ice rink with indirect system is represented in Figure 7.
Fig.7 – Refrigeration plant with heat recovery: preheating of hot water, floor heating and air heating [1].
As mentioned, the refrigeration unit cools the brine in the evaporator and the brine is sent to the
embedded cooling pipes installed under the ice pad. Applying this design method, the amount of
required refrigerant is minimized, the refrigeration unit dimension at same cooling capacity is reduced
and, consequently, the risk of refrigerant leakage is reduced. However, the efficiency of this system is
lower in comparison with the direct system because of heat loss between the first refrigerant and the
brine as well as the required pump power for the brine circulation [1].

Evaluation of dehumidification system energy usage in ice rinks
Diogo Bermejo Pereira Rodrigues da Silva
14
The Figure 8 shows the percentage of energy usage in the indirect system, where the energy source is
the electricity. The compressors account for 80% of the total electricity consumption while the brine
pumps, the coolant pumps and the dry cooler fans use 10%, 5% and 5%, respectively [2].
Fig.8 – Percentage of energy used in a refrigeration indirect system.
2.3 Heat Loads in Ice Rinks
The quantification of the heat loads in ice rinks is very important in order to calculate the energy and
the operating costs of ice rinks. A good estimative of the required refrigeration load can be calculated
by summing the heat load components at design operating conditions, categorized into conductive,
convective and radiant components [10].
2.3.1 Conductive Loads
Main contributors to the conduction heat are the ice resurfacing, brine pump working, brine headers,
ground conduction and skaters activity.
Ice resurfacing is a procedure needed to keep the ice surface in a good condition, where a specific
mobile machine is used to shave the ice and cover it with a portion of hot water. The standard volume
of water deposit on the ice slab is between 400 and 700 litres, according to the ice slab dimensions.
The temperature of resurfacing water varies between 30-80ºC [10].The lower the water temperature,
the lower the freeze load and, consequently, the lower the generated heat load.
Fig.9 – Ice resurfacing machine.
Evaluation of dehumidification system energy usage in ice rinks
Diogo Bermejo Pereira Rodrigues da Silva
15
The brine pump working increases the enthalpy of the secondary refrigerant. The common load of
these pumps is about 15kW, which is the heater introduced in the brine circuit. Improvements to
control the pump energy consumption during unnecessary periods should be considered [3].
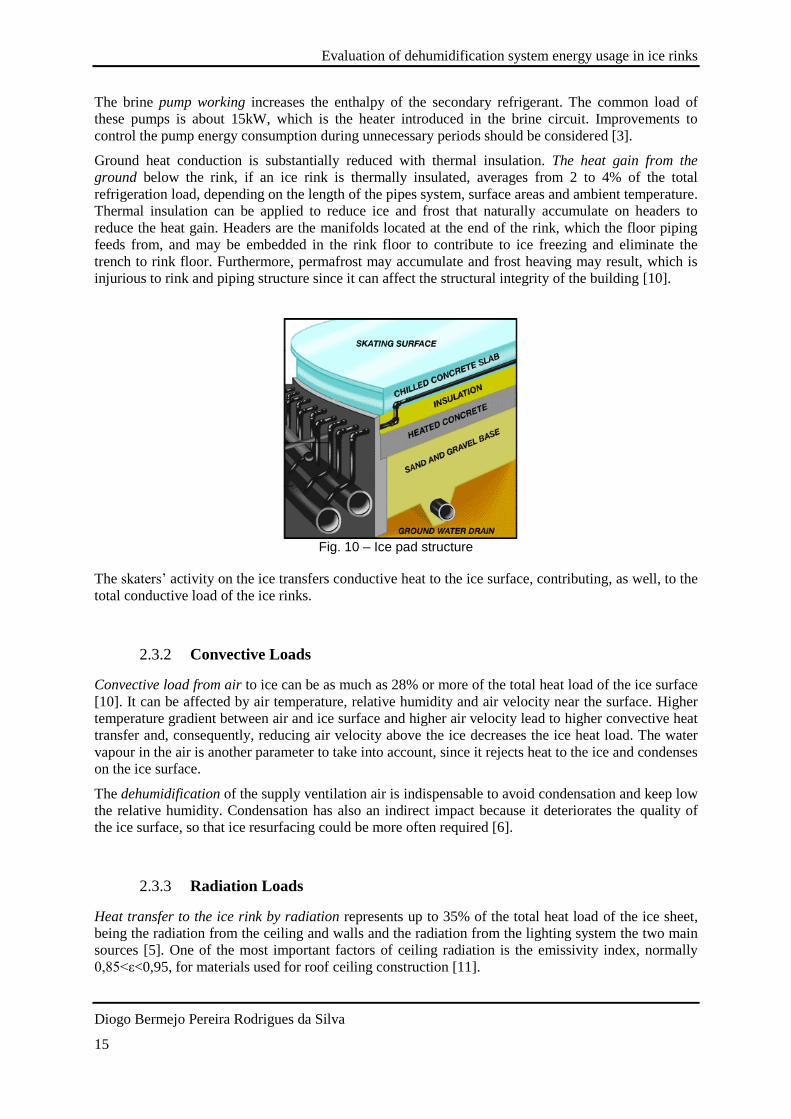
Ground heat conduction is substantially reduced with thermal insulation. The heat gain from the
ground below the rink, if an ice rink is thermally insulated, averages from 2 to 4% of the total
refrigeration load, depending on the length of the pipes system, surface areas and ambient temperature.
Thermal insulation can be applied to reduce ice and frost that naturally accumulate on headers to
reduce the heat gain. Headers are the manifolds located at the end of the rink, which the floor piping
feeds from, and may be embedded in the rink floor to contribute to ice freezing and eliminate the
trench to rink floor. Furthermore, permafrost may accumulate and frost heaving may result, which is
injurious to rink and piping structure since it can affect the structural integrity of the building [10].
Fig. 10 – Ice pad structure
The skaters’ activity on the ice transfers conductive heat to the ice surface, contributing, as well, to the
total conductive load of the ice rinks.
2.3.2 Convective Loads
Convective load from air to ice can be as much as 28% or more of the total heat load of the ice surface
[10]. It can be affected by air temperature, relative humidity and air velocity near the surface. Higher
temperature gradient between air and ice surface and higher air velocity lead to higher convective heat
transfer and, consequently, reducing air velocity above the ice decreases the ice heat load. The water
vapour in the air is another parameter to take into account, since it rejects heat to the ice and condenses
on the ice surface.
The dehumidification of the supply ventilation air is indispensable to avoid condensation and keep low
the relative humidity. Condensation has also an indirect impact because it deteriorates the quality of
the ice surface, so that ice resurfacing could be more often required [6].
2.3.3 Radiation Loads
Heat transfer to the ice rink by radiation represents up to 35% of the total heat load of the ice sheet,
being the radiation from the ceiling and walls and the radiation from the lighting system the two main
sources [5]. One of the most important factors of ceiling radiation is the emissivity index, normally
0,85<ε<0,95, for materials used for roof ceiling construction [11].
Evaluation of dehumidification system energy usage in ice rinks
Diogo Bermejo Pereira Rodrigues da Silva
16
Lighting is the second source of radiation to the ice where near 60% of the light can be converted to
heat absorbed by the ice [10].
Table 1 shows, how much each load category approximates the maximum total load and the maximum
possible reduction by design and operation measures.
Table 1 – Ice rink heat loads [10].
2.4 Ice rinks energy saving potential
With the current knowledge that ice rinks are very high energy consumers, it is possible to assume that
the energy saved applying energy conservation measures could also be significant. Different kinds of
energy saving measures may be applied according to the sections that would be analysed.
The strategies for saving energy in ice rinks are categorized in three classifications: heat loads
decreasing, refrigeration and distribution system performance improvement and ice/concrete slab
quality enhancement.
2.4.1 Heat loads decrease
Low emissivity ceilings
Infrared radiation from an ice rink ceiling represents up to 30% of the refrigeration system load. The
heat is transmitted to the ice rink by radiation. The temperature, colour and emissivity index of the
inner surface of the ceiling are the main causes of the radiation thermal load. Common materials used,
as wood or steel, have an emissivity index relatively high, between 0,85<ε<0,95 [12]. The installation
Load Sources
Category
Approximate
Maximum of Total
Load,
%
Maximum reduction of
Load Category through
Design and Operation
%
Conductive loads
Ice resurfacing 12 60
System pump work 15 80
Ground heat 4 80
Header heat gain 2 40
Skaters 4 0
Convective Loads
Rink air temperature 13 50
Rink humidity 15 80
Radiant Loads
Ceiling radiation 28 90
Lighting radiation 7 40
Total 100

Evaluation of dehumidification system energy usage in ice rinks
Diogo Bermejo Pereira Rodrigues da Silva
17
of a low emissivity ceiling has a great potential for reducing the heat load of the ice arena, since the
low-e ceiling material transfers less radiation energy, which reduces the heat load above the ice rink
by as much as 20%. Radiant energy is always transferred between an object with a higher temperature
and another object with a lower temperature, and the greater the temperature differential the higher the
rate of heat transfer. Therefore, the heat transfer from ceiling to ice is unavoidable. However, with the
installation of a low-e ceiling above the ice rink, the heat load of the ice sheet is reduced by as much as
twenty percent [11].
The amount of heat transferred from the warm ceiling to the cold ice slab could be estimated
using the Stefan-Boltzmann equation.
4
sTE (1)
Where,
E = emissive power per unit area 2/ mW
= emissivity of the material ( 10
= Stefan-Boltzmann constant )/( 42 KmW
sT Absolute surface temperature K
A good low-e ceiling has an emissivity factor of 0.03 [13].
Fig.11 – Radiant heat transfer mechanism [3].
Reduction of light intensity
The heat provided by the ice rink lighting system can be reduced by the use of lighting systems where
the intensity and the number of operational lamps is adjusted according to the activity in progress and
the occupancy rate on the stands.

Evaluation of dehumidification system energy usage in ice rinks
Diogo Bermejo Pereira Rodrigues da Silva
18
Another way to reduce the lighting energy use would be optimising the elevation of the equipment by
considering reflectance of the walls and of the low emissivity ceiling, while ensuring the required
clearance above the ice rink [12].
2.4.2 Improvement of the distribution system performance
Use of carbon dioxide (CO2) as a secondary refrigerant system
Calcium Chloride (CaCl2) solutions are the most used secondary refrigerants in refrigeration systems
of the ice rinks in Sweden. The CO2 has some advantages as being cheap and a robust choice
comparing with CaCl2 solutions that are more corrosive. Furthermore, for the same required
conditions, CaCl2 refrigerant needs a higher pumping power when compared with CO2.
Other advantage of CO2 use is that the level of CO2 temperature, while boiling at a constant pressure,
improves the ice quality [14].
Waste Heat Recovery
The refrigerant in the refrigeration system is cooled and condensed in a condenser and desuperheater
after its compression, dissipating energy in heat form. This heat can be recovered and can be used to
supply other heating demands.
Recovered heat from the refrigeration system saves a substantial amount of heat, which can be
successfully recovered to supply several heating requirements in the ice arena such as flood water
heating, domestic water heating, air ventilation heating, under slab heating, freeze protection and ice
melting [15].
Fig.12 – Recovery of the heat dissipated after the compression of the refrigerant in the secondary coolant pump.
Capacity controlled brine pumps
In ice rinks the pumps are responsible for consuming large amounts of energy. In normal conditions,
the energy is significantly lower; the problem arises for extreme conditions. Secondary refrigerant
pumps or brine pumps are designed and installed to work in these severe situations, such when there is
some ice resurfacing, when a certain volume of warm resurfacing water has to get cooled and frozen,
and operation during matches, when additional heat flux from skaters, spectators and lighting
contributes to warm up the ice. Full speed brine pumps working 24 hours a day contribute to 15% of
the total electricity consumption in the refrigeration systems [9].

Evaluation of dehumidification system energy usage in ice rinks
Diogo Bermejo Pereira Rodrigues da Silva
19
The energy used by the secondary refrigerant pumps may be minimized by using:
- Motors with two speed types, running at a full speed during the day and low speed
during the night or unoccupied hours;
- Variable speed motors, which can be controlled by the brine temperature differential
change;
- Two or more pumps controlled by the brine temperature differential change or with an
occupied-unoccupied timer [12].
Stands heating
The spectators who wants to watch and appreciate an event occurring in an ice arena needs to feel
comfortable, so the temperature of the air in the standings cannot be the same temperature in the ice
field.
The infrared heat over the stands can provide a spot heating and are a good solution to not interfere
with the ice rink temperature [3]. If this solution is not possible and the ventilation system has to work
simultaneously for heating the stands, then it has to be considered that the air should not be pointing to
the ice rink directly, because it would increase the heat load over the ice.
2.4.3 Ice/concrete slab quality enhancement
Ice surface temperature controls
It is accepted that as colder the ice surface is, the better the skating quality will be. However, each
degree increased in the ice temperature decreases the energy required by the ice rink energy system.
Consequently it is important to keep the ice temperature at a level which is good for ice quality but at
its greater limit in order to avoid excessive radiation.
If an ice rink operates the whole year, it is possible to save 40-60MWh of electricity and 70-90MWh
of heating, by the temperature increase of the ice slab of one degree [1].
There are two possible solutions to effectively measure the ice surface temperature, with the objective
to keep it at its optimal level. The first is sensing the average temperature of the secondary coolant or
the slab temperature under the ice to control the surface temperature, but that solution do not
accurately keep the temperature of the ice surface at the required value. The other solution is the
installation of infrared detectors, above the ice slab. These detectors can measure the ice surface
temperature with more accuracy and provide a reliable feedback to the control system, avoiding
overcooling of the ice. Furthermore, these systems could be programmed in order to increase the ice
temperature, only for a certain time period, such as unoccupied hours, resulting in more energy saved
[9].
Adjusting the ice temperature set point according to the season and the type of activity could
significantly decrease the energy consumption at the end of the year, since the refrigeration system has
the highest share in ice rinks total energy consumption [14].
Air handling and dehumidification
The temperature and the air velocity near the surface of the ice slab play an important role on the
energy consumption of the refrigeration system, because of convective heat transfer. The water vapour
of the air over the ice surface rejects its heat by condensing on the ice surface. The most effective way
to reduce convective heat load is keeping the ice temperature as high as possible and the air
temperature as low as possible [1].

Evaluation of dehumidification system energy usage in ice rinks
Diogo Bermejo Pereira Rodrigues da Silva
20
To prevent fog and condensation of the air near the ice rink it is essential to have a good
dehumidification system. If the system is not capable of keeping the air sufficiently dry, the
refrigeration system uses more energy to remove the additional heat load of freezing the water vapour.
Water treatment and ice maintenance
Controlling the purity of the water is also very important for saving energy since the amount of energy
needed to freeze the water is higher the less is the water purity. Furthermore, the ice needs to be solid
and thick to support the skaters and the structures above it, but if the ice is excessively thick, that will
make the refrigeration system work more than the necessary, wasting energy.

Evaluation of dehumidification system energy usage in ice rinks
Diogo Bermejo Pereira Rodrigues da Silva
21
3. Dehumidification in Ice rinks analysis
3.1 Introduction to dehumidification in ice rinks
The installation of a dehumidification system in an ice rink is very important to keep the air dry and
avoid problems due to the presence of moisture in the air inside the building.
Atmospheric air is a mixture of various gases, water vapour and some pollutants that may vary
considerably from place to place, but it is considered that the composition of the dry air is relatively
constant everywhere, with small variations with time, location and altitude.
Moist air is a mixture of dry air and water vapour. The amount of the water vapour may vary from
zero to a maximum that is determined by the temperature and pressure of the mixture. When the air
contains the maximum value of water vapour, which is denominated as saturated air, there is a neutral
equilibrium state between the moist air and the liquid or solid phases of water [16].
Moisture is transferred trough air from higher to lower concentrations due to the difference in their
vapour pressure. When the air is cooled is unable to hold the same amount of moisture and, therefore,
moisture condenses on the surfaces that temperature is lower than the dew point of the air temperature.
The condensation occurs in the form of water droplets, leading to sweating, dripping and fogging
analogous to what happens above the ice surface. In ice rinks, the moisture tends to deposit in the ice
slab and condense, with a negative impact for the ice quality.
Moisture can be introduced into an ice rink facility trough several sources such as flood water
evaporation, skaters and spectators, code ventilation, infiltration and combustion (ice resurfacers and
gas heaters), so it is very important to avoid dripping and fogging, keeping the air dry inside the
installation [17].
The energy use for dehumidification of an ice rink could be 6% of the total energy use of the cooling
system [2] but in this project it is going to be conclude that the actual “state of art” underestimate the
real value of energy consumption regarding the dehumidification system in ice rinks.
3.2 Dehumidification technologies
There are two types of dehumidification technologies used in ice rinks: absorption type and
refrigeration type.
3.2.1 Dehumidification absorption type
The absorption technology is based in the principle of dehumidifying using chemical sorbents, with an
absorption rotor coated with a special substance, such as silica gel that absorbs the water molecules of
the moisture in the transitory air. When the air is saturated, the rotor rotates to a regeneration zone,
where it is dried with heated air. The warm and humid air is led away out of the building, while the
rotor is prepared again to take off the water molecules of the air inside the building [19].
The most recognized equipment which use the absorption type technique is nominated “desiccant
wheel”

Evaluation of dehumidification system energy usage in ice rinks
Diogo Bermejo Pereira Rodrigues da Silva
22
Fig.13 – Dehumidification by desiccant wheel [1].
3.2.2 Dehumidification refrigeration type
The refrigeration is another technology to dehumidify the air, acting by the decrease of the air
temperature below the dew temperature point, in order to condense the moisture of the air.
Fig.14 - Principle of refrigeration type dehumidifier [20].
The working principle of a refrigeration dehumidifier unit is that the air crosses the evaporator coil,
cooling down until the dew temperature point, where condensation occurs. The cooled air is heated up
in the condenser coil and, afterwards, the dry warm air is discharged to the room [21].
For cooling the air, part of the cold brine from the refrigeration system unit can be used so,
dehumidification by condensation can be integrated with ventilation or refrigeration system of an ice
rink [3].

Evaluation of dehumidification system energy usage in ice rinks
Diogo Bermejo Pereira Rodrigues da Silva
23
Fig.15 - Dehumidification by water vapour condensation [1].
The two types of operation principle, the absorption or the refrigeration dehumidifier, are explained by
means of the psychometric chart.
Fig. 16 - Principle of operation related to Desiccant dehumidifier and refrigerant dehumidifier, respectively [21].

Evaluation of dehumidification system energy usage in ice rinks
Diogo Bermejo Pereira Rodrigues da Silva
24
3.3 Ice Rinks included in the study
In this study seven ice rinks near the city of Stockholm, Sweden, were considered, but the analysis
focused on Älta, Norrtälje and Saltsjöbaden ice rinks.
The ice rinks in Sweden that figure in this study are equipped with several sensors with the purpose of
monitoring the performance of their refrigeration system. In this study, the use of diverse temperature
and relative humidity sensors, as well as the power and energy consumed by the dehumidifier systems
were analysed and used in the calculations.
Fig.17 – Chart of Stockholm, Sweden, with the ice rinks included in the study
It was possible to obtain the outdoor air meteorological data of air temperature and relative humidity,
requesting them to Swedish Meteorological and Hydrological Institute (SMHI), whenever there were
problems with the data transfer from the outdoor sensors or due to the lack of sensors installed outside
the building in the time period corresponding to the analysis.
Despite the fact that all ice rinks are closely located and have similar sizes, every case is unique and
must be studied and analysed in a particular way. The following table shows the values of the indoor
air temperature, relative humidity, dew temperature point and water content of every ice rink included
1
2 3
4
5
6
7

Evaluation of dehumidification system energy usage in ice rinks
Diogo Bermejo Pereira Rodrigues da Silva
25
in the study. The study was performed during the month of November 2012 and the values in Table 2
are on a daily basis averages.
Table 2 – Average values of indoor climate for different ice rinks during November 2012.
Ice rink Indoor
Temperature (°C) Relative
Humidity (%) Dew Temperature
Point (°C) Indoor water content
(g water/kg air)
Norrtälje 8,05 65,50 1,91 4,43
Järfälla 5,74 66,48 -0,09 3,83
Nacka 3,88 69,71 -1,22 3,52
Björknäs 2,70 78,52 -0,70 3,68
Saltsjöbaden 2,00 70,66 -2,84 3,12
Älta 4,99 55,34 -3,31 3,47
Vikingahallen 7,54 62,79 0,82 4,11
It is possible to observe that each ice rink has its specific indoors climate conditions, which varies with
the indoor activity, dehumidification performance and quantity of air leakage inside the building.
It is noteworthy that Vikingahallen and Norrtälje ice rinks have high values for water content in the
indoor air. This fact indicates that those ice rinks use with more intensity the ice slab to dehumidify
the air than the others ice rinks. Those two ice rinks spend less energy by the use of the dehumidifier
but spend more energy using the refrigeration system. The use of the ice to dehumidify the air can be
an alternative to the use of a dehumidifier but it causes damage in the quality of the ice and it requires
more ice resurfacings – the energy use to dehumidify the air with the ice slab will be analysed in
Chapter 5.3.
3.4 Sensors Analysis – Climacheck Software
The ice rinks located near Stockholm, Sweden, included in this study, are equipped with several
sensors with the purpose of monitoring the performance of their refrigeration system.
The software Climacheck principle is to keep a record of the data register by every sensor in a
determined period (reading in intervals between one and five minutes) and obtain easy access to the
values through the webpage “ClimaCheck.se” [22]. In addition, Climacheck also calculate some
essential relations as the cooling capacity, heating capacity and COP-values of the system.
Evaluation of dehumidification system energy usage in ice rinks
Diogo Bermejo Pereira Rodrigues da Silva
26
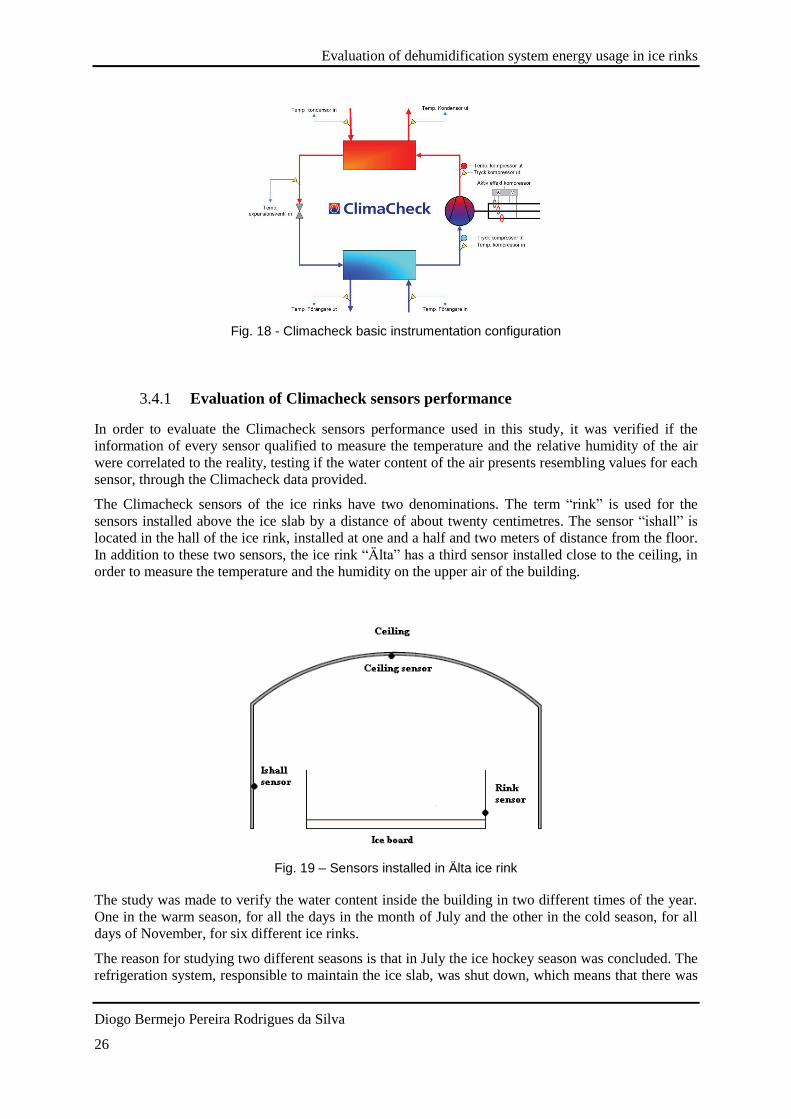
Fig. 18 - Climacheck basic instrumentation configuration
3.4.1 Evaluation of Climacheck sensors performance
In order to evaluate the Climacheck sensors performance used in this study, it was verified if the
information of every sensor qualified to measure the temperature and the relative humidity of the air
were correlated to the reality, testing if the water content of the air presents resembling values for each
sensor, through the Climacheck data provided.
The Climacheck sensors of the ice rinks have two denominations. The term “rink” is used for the
sensors installed above the ice slab by a distance of about twenty centimetres. The sensor “ishall” is
located in the hall of the ice rink, installed at one and a half and two meters of distance from the floor.
In addition to these two sensors, the ice rink “Älta” has a third sensor installed close to the ceiling, in
order to measure the temperature and the humidity on the upper air of the building.
Fig. 19 – Sensors installed in Älta ice rink
The study was made to verify the water content inside the building in two different times of the year.
One in the warm season, for all the days in the month of July and the other in the cold season, for all
days of November, for six different ice rinks.
The reason for studying two different seasons is that in July the ice hockey season was concluded. The
refrigeration system, responsible to maintain the ice slab, was shut down, which means that there was

Evaluation of dehumidification system energy usage in ice rinks
Diogo Bermejo Pereira Rodrigues da Silva
27
no ice in that period and, consequently, no indoor activities. Therefore the information provided by the
two sensors should indicate more accurately similar values of the properties of the air.
Fig.20 – Example of a sensor responsible to measure temperature and relative humidity
Älta case study
Fig.21 – Sensors Comparison in Älta ice rink for the month of July 2012
In July of 2012, the water content in the air should be very similar, since there was no activity inside
the rink in that time period so that there were not so much external disturbances that could affect the
measuring of relative humidity and temperature of the air by the two installed sensors. Nevertheless,
the average difference between the measured data by the two sensors is 0,88 grams per kilogram of
air. Possibly, one of the two sensors is not measuring accurately the relative humidity and the
temperature of the air.
The same comparison was performed during the month of November 2012, using an additional sensor
installed close the ceiling of the ice rink structure. Only twenty two days were used due to the lack of
Sensors Comparison
0,0070
0,0075
0,0080
0,0085
0,0090
0,0095
0,0100
0,0105
0,0110
0,0115
1 3 5 7 9 11 13 15 17 19 21 23 25 27 29 31
July
Wat
er c
on
ten
t (k
g w
ater
/ k
g ai
r)
W rink
W ishall

Evaluation of dehumidification system energy usage in ice rinks
Diogo Bermejo Pereira Rodrigues da Silva
28
information for some days. Comparing the data obtained for the three sensors, it is possible to argue
that one of the sensors may not be correctly measuring.
Fig. 22 – Sensors Comparison in Älta ice rink for the month of November 2012
The water content calculated by the relative humidity and temperature information of the sensors
installed in the rink and in the ceiling is very similar for all month, with an average difference of
0,025grams between them. This fact shows that the building has a good air circulation system, once
the two sensors are installed in opposite sides of the building, close the ice slab and close the ceiling.
On the other hand the sensor installed in the hall may not be working with the same precision as the
ceiling and the rink sensors.
Sensors Comparison
0,002
0,0025
0,003
0,0035
0,004
0,0045
6 7 8 9 10 11 12 13 14 15 16 17 18 19 20 21 22 23 24 25 26 27 28
November
Wat
er
con
ten
t (k
g w
ate
r /
kg a
ir)
W ceiling
W ishall
W rink

Evaluation of dehumidification system energy usage in ice rinks
Diogo Bermejo Pereira Rodrigues da Silva
29
Saltsjöbaden case study
Fig. 23 – Sensors comparison in Saltsjöbaden ice rink for the month of July 2012
In July of 2012, the water content in the air should be very similar for Saltsjöbaden ice rink but the
average difference measured by the two sensors was 1,39 grams of water per kilogram of air. The
possible explanation for this fact is that, below the ice slab in Saltsjöbaden ice rink, there is a sand
floor instead of a concrete floor. Due to the fact that there was no ice, the water retained in the sand
tended to evaporate, causing the great difference in the water content of the air that it is possible to
observe in Figure 23 above.
Fig. 24 – Sensors Comparison in Saltsjöbaden ice rink for the month of November 2012
Sensors Comparison
0,005
0,006
0,007
0,008
0,009
0,01
0,011
0,012
0,013
0,014
0,015
1 3 5 7 9 11 13 15 17 19 21 23 25 27 29 31
July
wat
er c
on
te (
kg w
ater
/kg
air)
W rink
W ishall
Sensors Comparison
0,002
0,0022
0,0024
0,0026
0,0028
0,003
0,0032
0,0034
0,0036
1 3 5 7 9 11 13 15 17 19 21 23 25 27 29
November
wat
er c
on
ten
t (k
g w
ater
/ kg
air
)
W rink
W ishall

Evaluation of dehumidification system energy usage in ice rinks
Diogo Bermejo Pereira Rodrigues da Silva
30
For the month of November 2012, it is possible to notice that the measured values by two different
sensors are very similar, with an average difference of 0,09 grams of water per kilogram of air,
concluding that both sensors are working correctly.
The same study was applied to other four different ice rinks. Table 3 compares the results of the
difference between the water content in the air (g water / kg air) calculated by the information
provided by the two sensors.
Table 3 – Water content indoor difference (g water/kg air) calculated by the providing information of the two sensors installed (Ishall sensor and Rink sensor)
July November
Älta 0,88 0,6
Saltsjöbaden 1,39 0,09
Björknäs 0,09 0,121
Norrtälje 1,04 0,55
Järfälla 0,004 0,024
Nacka not available 0,01
Evaluation of dehumidification system energy usage in ice rinks
Diogo Bermejo Pereira Rodrigues da Silva
31
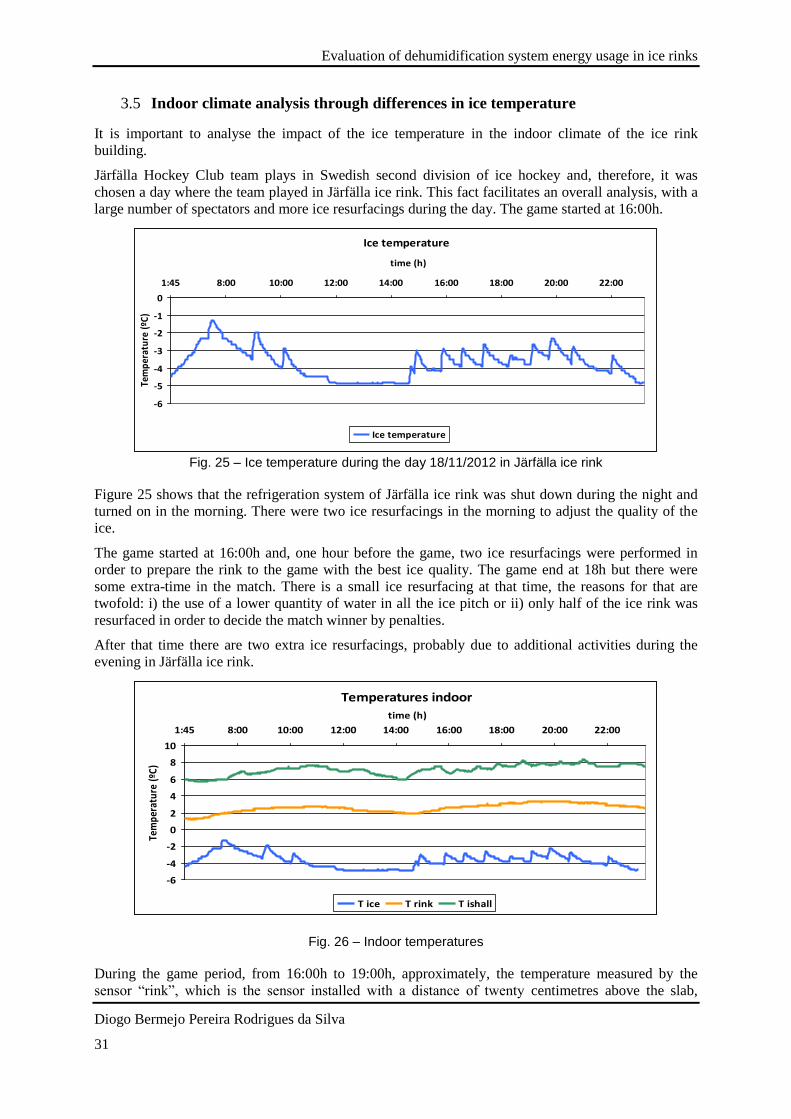
3.5 Indoor climate analysis through differences in ice temperature
It is important to analyse the impact of the ice temperature in the indoor climate of the ice rink
building.
Järfälla Hockey Club team plays in Swedish second division of ice hockey and, therefore, it was
chosen a day where the team played in Järfälla ice rink. This fact facilitates an overall analysis, with a
large number of spectators and more ice resurfacings during the day. The game started at 16:00h.
Fig. 25 – Ice temperature during the day 18/11/2012 in Järfälla ice rink
Figure 25 shows that the refrigeration system of Järfälla ice rink was shut down during the night and
turned on in the morning. There were two ice resurfacings in the morning to adjust the quality of the
ice.
The game started at 16:00h and, one hour before the game, two ice resurfacings were performed in
order to prepare the rink to the game with the best ice quality. The game end at 18h but there were
some extra-time in the match. There is a small ice resurfacing at that time, the reasons for that are
twofold: i) the use of a lower quantity of water in all the ice pitch or ii) only half of the ice rink was
resurfaced in order to decide the match winner by penalties.
After that time there are two extra ice resurfacings, probably due to additional activities during the
evening in Järfälla ice rink.
Fig. 26 – Indoor temperatures
During the game period, from 16:00h to 19:00h, approximately, the temperature measured by the
sensor “rink”, which is the sensor installed with a distance of twenty centimetres above the slab,
Ice temperature
-6
-5
-4
-3
-2
-1
0
1:45 8:00 10:00 12:00 14:00 16:00 18:00 20:00 22:00
time (h)
Tem
per
atu
re (
ºC)
Ice temperature
Temperatures indoor
-6
-4
-2
0
2
4
6
8
10
1:45 8:00 10:00 12:00 14:00 16:00 18:00 20:00 22:00
time (h)
Tem
pera
ture
(ºC
)
T ice T rink T ishall

Evaluation of dehumidification system energy usage in ice rinks
Diogo Bermejo Pereira Rodrigues da Silva
32
increased from 2,6ºC to 3,6ºC due the players activity and the ice resurfacings. It is possible to observe
that ice resurfacings have also some impact in the temperature measured on the hall of the building. In
the first ice resurfacing performed during the morning, the temperature measured in the hall increased
from 6ºC to 6,9ºC.
Fig. 27 – Relative Humidity measured indoor
The relative humidity measured by the sensor “rink” increased when the game start and reached the
one hundred value, due prolongation of the ice rink activities during the evening.
The relative humidity measured in the hall slightly increased 2% since the start of the game and during
the evening, with other activities.
On the other hand, relative humidity measured by “ishall” sensor, installed in the hall, increased from
66% to 70% during the game. This value could be due to the entering of spectators inside the building
and also doors opening, which allows the incoming of the outdoor air.
Relative humidity indoor
0
20
40
60
80
100
1:45 8:00 10:00 12:00 14:00 16:00 18:00 20:00 22:00
time (h)
Re
lati
ve
Hu
mid
ity
(%)
-6
-5
-4
-3
-2
-1
0
Te
mp
era
ture
(ºC
)
RH rink RH ishall T ice

Evaluation of dehumidification system energy usage in ice rinks
Diogo Bermejo Pereira Rodrigues da Silva
33
4. Ice rinks dehumidifier energy consumption
The main aim of a dehumidifier is to reduce the moisture in the air so it is important to understand
from where the moisture comes from. There are two main sources of moisture: external, due leakage
from outdoor air and infiltration in the ice rink, and internal source, due to skaters in activity,
spectators and resurfacing water. Part of the moisture in the air will deposit on the ice slab and the part
will be removed by the dehumidifier.
Fig. 28 – Moisture balance inside an ice rink
The water content (kg water/kg air) from outdoor and indoor air was calculated with values of
temperature (T ) and relative humidity ( ) measured by the Climacheck sensors with the following
equation:
s
s
spp
pW
622,0 (2)
Where sp corresponds to the partial pressure and p corresponds to the total pressure.
wss pp (3)
The water vapour saturation pressure, wsp , is calculated by the two equations below:
TCTCTCTCTCCT
Cpws lnln 7
4
6
3
5
2
4321 (4)
And,
TCTCTCTCCT
Cpws lnln 13
3
12
2
11109
8 (5)
Equation 4 is used when the temperature of the moist air is between -100ºC and 0ºC and Equation 5 is
for the temperature range from 0ºC to 200ºC. The constants 1C to 13C are tabled values (see annexe
A).
Moisture
from
outdoor
air leakage
Moisture
from
indoor
activity
Air to
dehumidifier
Moisture
depositing in
the ice slab
Water
extracted
from the air

Evaluation of dehumidification system energy usage in ice rinks
Diogo Bermejo Pereira Rodrigues da Silva
34
For each day of October 2011 in Älta case and November 2012 for Nacka, Vikingahallen and
Saltsjöbaden ice rinks, a daily average of the recorded values given by Climacheck sensors were
made, measuring each one minute, in order to have a better perception of each case.
From results analysis it can be concluded that the internal source of moisture can be simplified to a
constant value, because daily values are very similar. Therefore, the moisture load of the dehumidifier
mainly changes with the outdoor conditions regarding the air water content. Figure 29 shows the
dehumidifier energy consumption varying with different water content in the outdoor air.
Fig. 29 – Dehumidification energy consumption per hour related to outdoor air water content
Figure 29 shows that the trend lines corresponding to all of the ice rinks have a similar inclination and
the main difference is the level of energy consumption for the same outdoor air water content. Nacka
ice rink has the highest energy consumption, which can be due to an inefficient dehumidifier system or
a poor tightness of the building structure, increasing the external air infiltration inside the ice rink.
If the internal water content is the same as the external, there is a situation that outside air brings no
load for the dehumidifier. For those conditions the energy consumption would be related only with the
internal sources.
The average water content indoor value is used as the internal moisture level. According to the trend
lines of Figure 29, it is possible to calculate the use of energy per hour due to the internal moisture.
Table 4- Energy due internal moisture in the ice rinks.
Ice rink
Indoor water content
Energy due internal moisture
(g water /kg air) (kWh/h)
Älta 2011 3,47 16,771
Saltsjöbaden 3,12 19,083
Vikingahallen 4,11 15,972
Nacka 3,47 24,671
Dehumidification energy consumption (kWh)
y = 3998,8x + 2,8756
y = 2777x + 10,419
y = 3316,3x + 2,3402
y = 3672,6x + 11,934
0
5
10
15
20
25
30
35
40
45
0 0,001 0,002 0,003 0,004 0,005 0,006 0,007 0,008 0,009 0,01
outdoor water content (kg water/kg air)
Ener
gy c
on
sum
pti
on
(kW
h)
Alta 2011 Saltsjobaden Vikingahallen Nacka
Linear (Alta 2011) Linear (Saltsjobaden) Linear (Vikingahallen) Linear (Nacka)
Dehumidification energy consumption (kWh/h)
Ener
gy c
on
sum
pti
on
(kW
h/h
)

Evaluation of dehumidification system energy usage in ice rinks
Diogo Bermejo Pereira Rodrigues da Silva
35
Nacka ice rink spends more energy than others ice rinks. Since all studied ice rinks have similar
construction dimensions, this fact can probably be due to the inefficiency of the dehumidification
system in Nacka. This occurrence is going to be analysed with more detail in Chapter 4.4.
4.1 Älta ice rink Dehumidifier – Energy consumption
Älta ice rink has a district heating system installed and connected to the dehumidifier since the
beginning of the summer period of 2012, which had start working in that period.
In the previous section, an analysis was performed in order to verify the current energy consumption
of the dehumidifier with pre-heating system and compare it with the values obtained in 2011.
Fig. 30 – Water content indoor (November 2012)
The average water content indoor is 3,467 grams of water per kilogram of air and this value is used as
the internal moisture level. It is possible to verify that the water content indoor is very similar when
compared with the evaluation performed in 2011.
Fig. 31 – Comparison between dehumidifier consumption in 2011 and 2012
Water content indoor (November 2012)
0
0,0008
0,0016
0,0024
0,0032
0,004
0,0048
5 7 9 11 13 15 17 19 21 23 25 27 29
November 2012 (days)
wat
er
con
ten
t (k
g w
ate
r/kg
air
)
October 2011 / November 2012
y = 3998,8x + 2,8756
y = 3999,2x - 4,9637
0
5
10
15
20
25
30
35
40
45
0 0,002 0,004 0,006 0,008 0,01
water content (kg water/kg outdoor air)
Ener
gy C
on
sum
pti
on
(kW
h)
October 2011 November 2012
Dehumidification energy consumption (kWh/h)
Elec
tric
ity
con
sum
pti
on
(kW
h/h
)
Evaluation of dehumidification system energy usage in ice rinks
Diogo Bermejo Pereira Rodrigues da Silva
36
In Figure 31, the electricity consumption by the same dehumidifier in two different occasions is
compared, in October 2011 and November 2012, without and with district heating installation,
respectively.
Dehumidifier electricity use is significantly lower since the district heating system was installed in
Älta ice rink. According to the trend line of the data from November 2012 shown in Figure 31, the
electricity consumption of the dehumidifier due to internal moisture is now around 8,90 kWh/h.
Figure 31 shows also a relationship between the two trend lines from the product of the two years
analysis: the slope of the trend line of dehumidifier electricity consumption in November 2012 is
similar the slope of the trend line in October 2011. Therefore, the trend line is indicative of the product
of outside air leakage and the performance of the dehumidifier.
The aforementioned slope value could be used to evaluate the air tightness of an ice rink building
structure. Knowing the type of the dehumidifier and its performance, it is possible to observe if the ice
rink is wasting too much energy due the air leakage from outside.
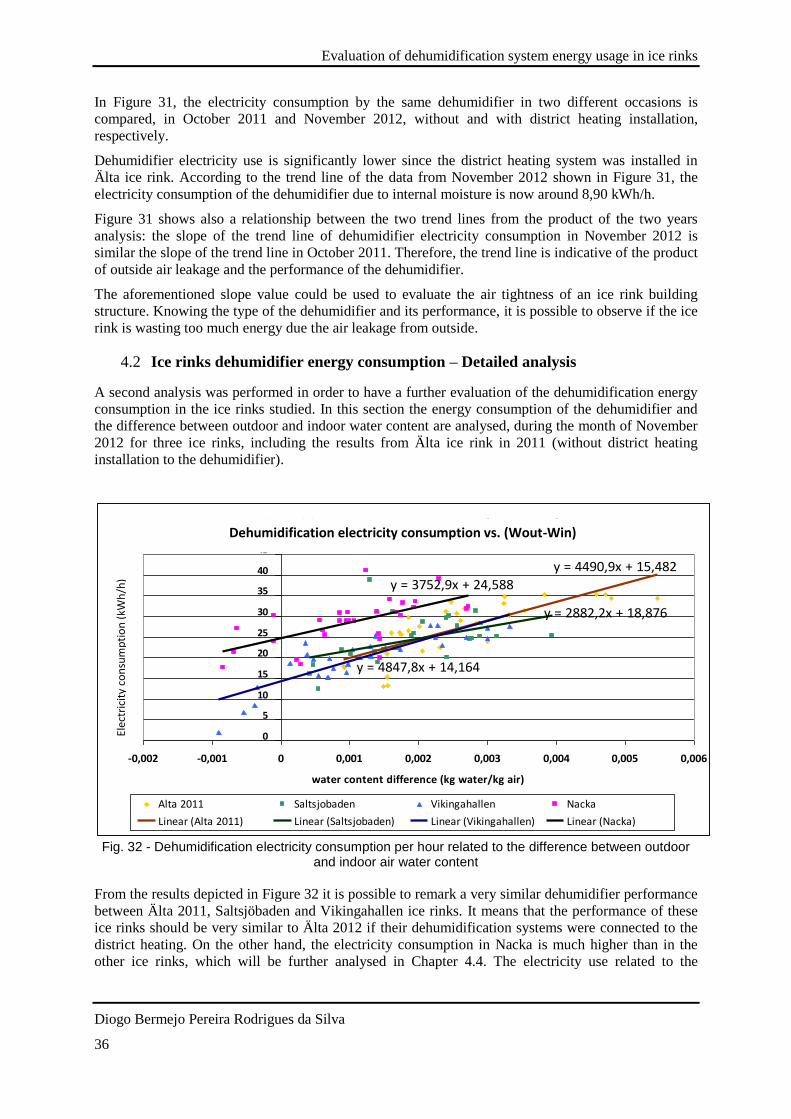
4.2 Ice rinks dehumidifier energy consumption – Detailed analysis
A second analysis was performed in order to have a further evaluation of the dehumidification energy
consumption in the ice rinks studied. In this section the energy consumption of the dehumidifier and
the difference between outdoor and indoor water content are analysed, during the month of November
2012 for three ice rinks, including the results from Älta ice rink in 2011 (without district heating
installation to the dehumidifier).
Fig. 32 - Dehumidification electricity consumption per hour related to the difference between outdoor
and indoor air water content
From the results depicted in Figure 32 it is possible to remark a very similar dehumidifier performance
between Älta 2011, Saltsjöbaden and Vikingahallen ice rinks. It means that the performance of these
ice rinks should be very similar to Älta 2012 if their dehumidification systems were connected to the
district heating. On the other hand, the electricity consumption in Nacka is much higher than in the
other ice rinks, which will be further analysed in Chapter 4.4. The electricity use related to the
Dehumidifier energy consumption vs (Wout-Win)
y = 4490,9x + 15,482
y = 2882,2x + 18,876
y = 4847,8x + 14,164
y = 3752,9x + 24,588
0
5
10
15
20
25
30
35
40
45
-0,002 -0,001 0 0,001 0,002 0,003 0,004 0,005 0,006
water content difference (kg water/kg air)
Ener
gy c
on
sum
pti
on
(kW
h)
Alta 2011 Saltsjobaden Vikingahallen Nacka
Linear (Alta 2011) Linear (Saltsjobaden) Linear (Vikingahallen) Linear (Nacka)
Elec
tric
ity
con
sum
pti
on
(kW
h/h
)
Dehumidification electricity consumption vs. (Wout-Win)

Evaluation of dehumidification system energy usage in ice rinks
Diogo Bermejo Pereira Rodrigues da Silva
37
dehumidification due to internal moisture can be associated when the trend line of Figure 32 crosses
the “yy axis”, or, in other words, the b value in the equation y=mx+b of every single trend line.
Since Saltsjöbaden and Vikingahallen dehumidification systems perform similarly to Älta, their results
are analysed by one single trend line, in order to compare the group with the results of Älta 2012 with
district heating installation.
Figure 33 shows the decrease in terms of electricity consumption when there is a district heating
system installation.
Fig 33 - Dehumidification electricity usage per hour comparison between all the ice rinks without district heating connected to the dehumidifier and Älta 2012.
It is possible to observe now, in Figure 33, which behaviour shall Vikingahallen and Saltsjöbaden ice
rink have if district heating would be installed resembling what happened this year in Älta ice rink,
with a high reduction in terms of electricity consumption due to district heating system. According to
both trend lines, the electricity consumption due to internal moisture is 15,2kWh/h for the ice rinks
without district heating and 8,5kWh/h for an ice rink with district heating installed.
Figure 34 compares the electricity consumption of the four ice rinks in the month of November 2012.
Fig.34 – Total electricity consumption in November 2012 of the studied ice rinks.
District heating consumption comparison
y = 4495,6x + 15,216
y = 4237,5x + 8,5296
0
5
10
15
20
25
30
35
40
45
-0,002 -0,001 0 0,001 0,002 0,003 0,004 0,005 0,006
water content (kg water/kg air)
Ener
gy C
on
sum
pti
on
(kW
h)
All ice rinks Älta 2012
0
2000
4000
6000
8000
10000
12000
14000
16000
18000
Ice rinks
Ene
rgy
(kW
h)
Total energy consumption November 2012 (kWh)
Älta
Saltsjöbaden
Vikingahallen
Nacka
Elec
tric
ity
con
sum
pti
on
(kW
h/h
) El
ectr
icit
y (k
Wh
)
Total electricity consumption November 2012 (kWh)

Evaluation of dehumidification system energy usage in ice rinks
Diogo Bermejo Pereira Rodrigues da Silva
38
Climacheck sensors give information about the electricity consumption of the studied ice rinks. Nacka
ice rink has the highest electricity consumption for the dehumidification system, while Älta ice rink
has the lowest due to its connection to district heating.
4.3 Potential of energy reduction by the use of district heating
To study in detail the influence of the district heating installation and compare the performance of the
same dehumidifier, without and with pre-heating assistance, a routine day from 2011 and 2012 was
chosen. The selected day corresponds to 12th November of 2011 and 2012 when there were no ice
hockey games in Älta ice rink or other important activities, besides the regular daily teams training.
Fig. 35 – Dehumidifier Power in a routine day of 2011 (without district heating)
In 2011 regular day, it is possible to observe that the dehumidifier system was moving back and
forward, between on and off, during night and morning, reaching the load of 25kW and with two
periods at 35kW during the morning, but always with a basic load of 15kW. From 15:00h until the
evening, when there the regular trainings and activities inside the ice rink occur, the system has some
small crest oscillations in the total power used by the dehumidifier, but always working in a value near
the maximum power, approximately 35kW.
Fig. 36 – Dehumidifier Power in a routine day of 2012 (with district heating)
Dehumidifier Power in a day of 2011
05
10
1520
25
3035
40
0:00 2:00 4:00 6:00 8:00 10:00 12:00 14:00 16:00 18:00 20:00 22:00
time (h)
Po
we
r (k
W)
Power DH
Distric heating and Dehumidifier Power in a day of 2012
0
10
20
30
40
50
60
70
80
90
0:00 2:00 4:00 6:00 8:00 10:00 12:00 14:00 16:00 18:00 20:00 22:00
time (h)
T (º
C)
0
10
20
30
40
50
60
70
80
90
Po
we
r D
eh
um
idif
ier
(kW
)
T in T out Power Dehumidifier
Dehumidifier Power in 12th November 2011 (Älta ice rink)
District heating and dehumidifier power in 12th November 2012 (Älta ice rink)
Evaluation of dehumidification system energy usage in ice rinks
Diogo Bermejo Pereira Rodrigues da Silva
39
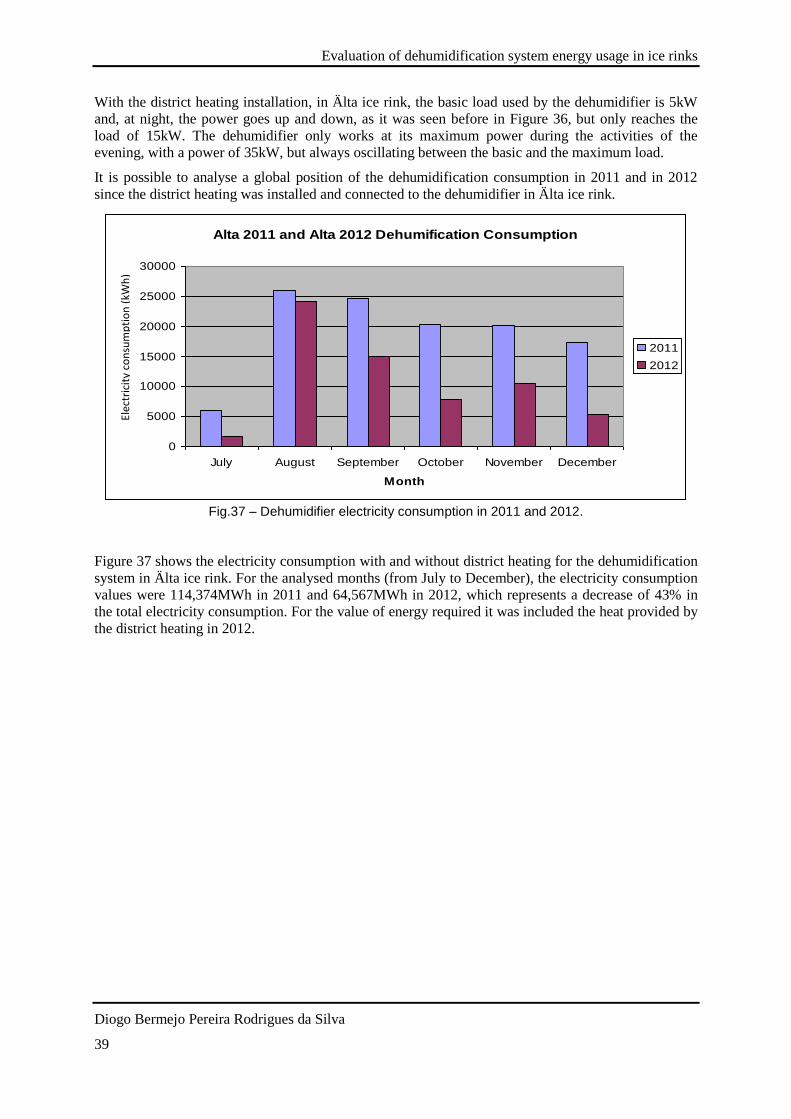
With the district heating installation, in Älta ice rink, the basic load used by the dehumidifier is 5kW
and, at night, the power goes up and down, as it was seen before in Figure 36, but only reaches the
load of 15kW. The dehumidifier only works at its maximum power during the activities of the
evening, with a power of 35kW, but always oscillating between the basic and the maximum load.
It is possible to analyse a global position of the dehumidification consumption in 2011 and in 2012
since the district heating was installed and connected to the dehumidifier in Älta ice rink.
Fig.37 – Dehumidifier electricity consumption in 2011 and 2012.
Figure 37 shows the electricity consumption with and without district heating for the dehumidification
system in Älta ice rink. For the analysed months (from July to December), the electricity consumption
values were 114,374MWh in 2011 and 64,567MWh in 2012, which represents a decrease of 43% in
the total electricity consumption. For the value of energy required it was included the heat provided by
the district heating in 2012.
Alta 2011 and Alta 2012 Dehumification Consumption
0
5000
10000
15000
20000
25000
30000
July August September October November December
Month
En
erg
y c
on
su
me
d (
kW
h)
2011
2012
Elec
tric
ity
con
sum
pti
on
(kW
h)

Evaluation of dehumidification system energy usage in ice rinks
Diogo Bermejo Pereira Rodrigues da Silva
40
4.4 Nacka ice rink dehumidification performance – case study
It is important to understand why the dehumidifier system Nacka ice rink is using so much electricity.
In fact, Nacka ice rink has a connection from the district heating system to the dehumidifier, which is
similar to Älta. Therefore, it would be expected lower values for electricity consumption comparing
with other ice rinks. But it is the opposite: higher values of electricity consumption are verified.
The first hypothesis to explain that fact was that Nacka ice rink has a poor and old dehumidifier.
Fortunately, a visit to the local made possible the identification of the real problem.
Nacka has the same dehumidifier as Älta ice rink, an absorption type dehumidifier DA 6000,
manufactured by Fuktkontroll AB (see annexe B) [23]. The problem was not in its dehumidifier.
Fig. 38 – Nacka ice rink dehumidifier installation
Figure 38 shows the dehumidifier system in Nacka ice rink (box number one). Besides this
construction, Nacka has another structure with another ice rink outside, only suitable for practising or
not so important games – a secondary ice rink tent. The large door (box number two) makes possible
the ice resurfacing machine to go and return between the two ice rinks, so that the outside air enters
and disturbs the normal indoor climate. Since the outside ground is usually covered with snow or dirt,
it is necessary to wash and clean the wheels of the ice resurfacing machine. This additional water
influences the indoor climate close to the washing place (box number 3). The sensor that controls the
dehumidifier is installed in the local shown in the figure by the box number 4, which is close to the
door and to the place where the ice resurfacing machine is washed. That sensor is connected to the
dehumidifier and automatically controls the temperature and the relative humidity of the air. The
difference between Nacka and other ice rinks is that the others have a separate garage to wash the ice
resurfacing mobile machine, so the dehumidifier will not be forced to work because of that water used
to clean the wheels from the machine. These two reasons explain why the dehumidifier in Nacka ice
rink uses so much energy, working much more than the dehumidification systems in others ice rinks.
2 4
1
3
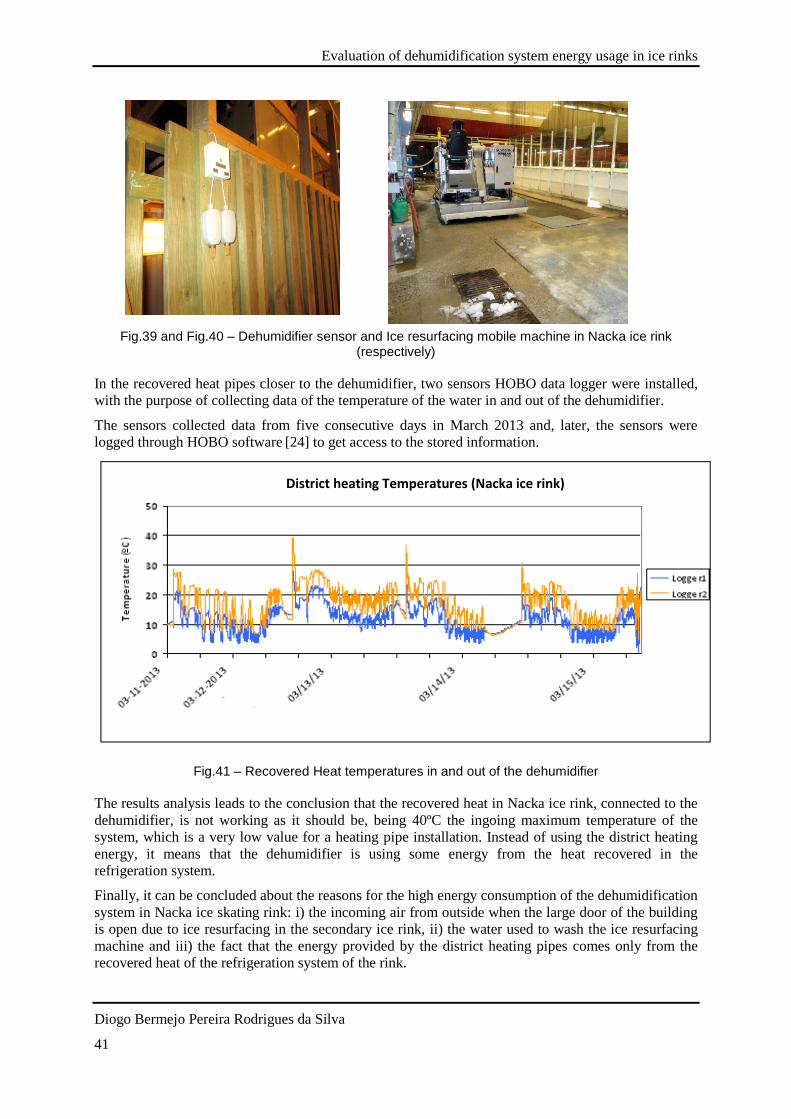
Evaluation of dehumidification system energy usage in ice rinks
Diogo Bermejo Pereira Rodrigues da Silva
41
Fig.39 and Fig.40 – Dehumidifier sensor and Ice resurfacing mobile machine in Nacka ice rink (respectively)
In the recovered heat pipes closer to the dehumidifier, two sensors HOBO data logger were installed,
with the purpose of collecting data of the temperature of the water in and out of the dehumidifier.
The sensors collected data from five consecutive days in March 2013 and, later, the sensors were
logged through HOBO software [24] to get access to the stored information.
Fig.41 – Recovered Heat temperatures in and out of the dehumidifier
The results analysis leads to the conclusion that the recovered heat in Nacka ice rink, connected to the
dehumidifier, is not working as it should be, being 40ºC the ingoing maximum temperature of the
system, which is a very low value for a heating pipe installation. Instead of using the district heating
energy, it means that the dehumidifier is using some energy from the heat recovered in the
refrigeration system.
Finally, it can be concluded about the reasons for the high energy consumption of the dehumidification
system in Nacka ice skating rink: i) the incoming air from outside when the large door of the building
is open due to ice resurfacing in the secondary ice rink, ii) the water used to wash the ice resurfacing
machine and iii) the fact that the energy provided by the district heating pipes comes only from the
recovered heat of the refrigeration system of the rink.
District heating Temperatures (Nacka ice rink)

Evaluation of dehumidification system energy usage in ice rinks
Diogo Bermejo Pereira Rodrigues da Silva
42
4.5 Dehumidification indoor activity vs. no activity – Saltsjöbaden case study
Due to maintenance operations on building roof, Saltsjöbaden ice rink was off of activities since the
beginning of the year of 2013. This was very useful for this study due to the fact that the refrigeration
system was on during the period of 12th January until 12
th February. Therefore, the dehumidification
performance could be analysed, computing the same procedures for the case of no activities inside the
building.
Figure 45 shows the comparison between the dehumidifier consumption related to the presence of
water content in the air in the months of November and December 2012, with normal activity indoor,
and the same information to January and February 2013 with no any indoor activities.
The average water content indoor was calculated for both situations: 3,120 grams of water per
kilogram of indoor air in the months with activity and 2,598 grams of water per kilogram of indoor air
in the months without activity.
The dehumidifier energy consumption was correlated with the outdoor water content, as computed
before in Chapter 4.
Fig. 42 - Dehumidification energy consumption related to outdoor air water content
The slope of both trend lines is very similar and, therefore, it can be argued that the energy
consumption is well correlated with the air leakage of the building and the performance of the
dehumidifier. Indoor air climate has a minor influence on the trend line slope. The difference between
trend lines is related to indoor moisture and quantifies as 11kWh/h the energy required which is
related to activity.
Indoor activity vs. no activity
y = 3247,2x + 7,1679
y = 3327x - 3,8739
0
5
10
15
20
25
30
35
40
45
0 0,001 0,002 0,003 0,004 0,005 0,006 0,007 0,008
water content (kg water /kg outdoor air)
Ener
gy C
on
sum
pti
on
(kW
h)
Activity indoor No activity indoorLinear (No activity indoor)
E
ner
gy c
on
sum
pti
on
(kW
h/h
)
Indoor Activity vs. No activity study (Saltsjöbaden ice rink)
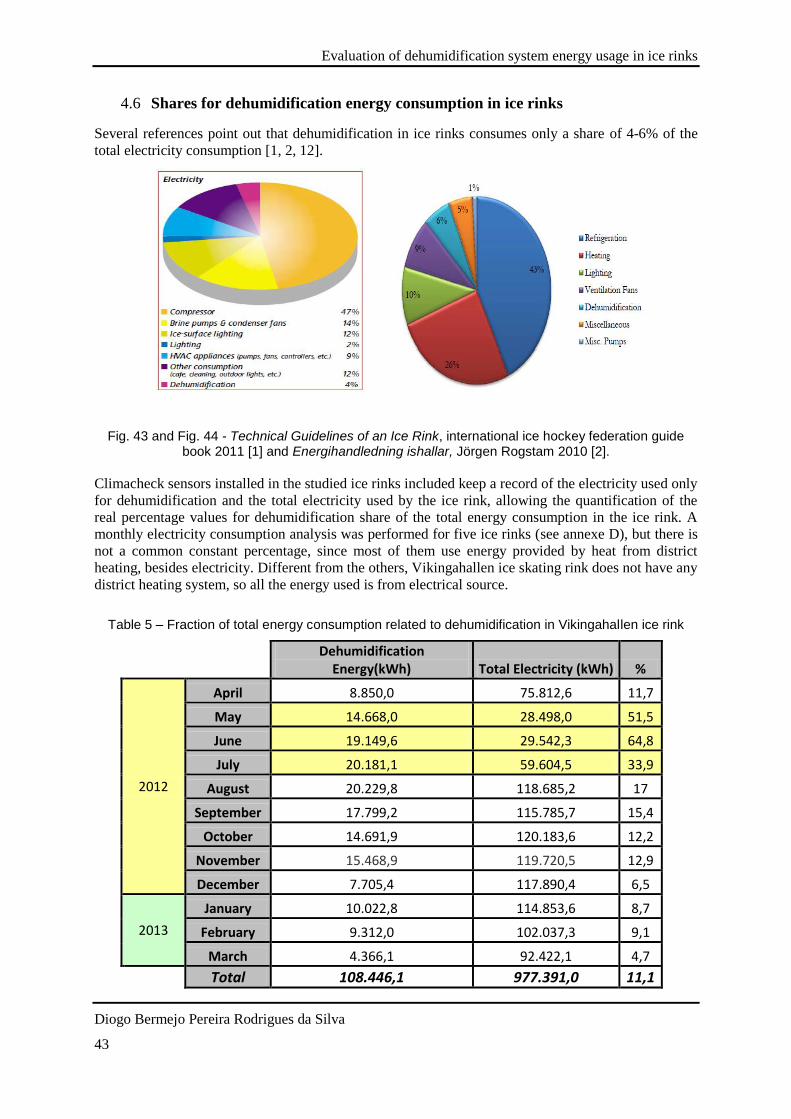
Evaluation of dehumidification system energy usage in ice rinks
Diogo Bermejo Pereira Rodrigues da Silva
43
4.6 Shares for dehumidification energy consumption in ice rinks
Several references point out that dehumidification in ice rinks consumes only a share of 4-6% of the
total electricity consumption [1, 2, 12].
Fig. 43 and Fig. 44 - Technical Guidelines of an Ice Rink, international ice hockey federation guide book 2011 [1] and Energihandledning ishallar, Jörgen Rogstam 2010 [2].
Climacheck sensors installed in the studied ice rinks included keep a record of the electricity used only
for dehumidification and the total electricity used by the ice rink, allowing the quantification of the
real percentage values for dehumidification share of the total energy consumption in the ice rink. A
monthly electricity consumption analysis was performed for five ice rinks (see annexe D), but there is
not a common constant percentage, since most of them use energy provided by heat from district
heating, besides electricity. Different from the others, Vikingahallen ice skating rink does not have any
district heating system, so all the energy used is from electrical source.
Table 5 – Fraction of total energy consumption related to dehumidification in Vikingahallen ice rink
Dehumidification
Energy(kWh) Total Electricity (kWh) %
2012
April 8.850,0 75.812,6 11,7
May 14.668,0 28.498,0 51,5
June 19.149,6 29.542,3 64,8
July 20.181,1 59.604,5 33,9
August 20.229,8 118.685,2 17
September 17.799,2 115.785,7 15,4
October 14.691,9 120.183,6 12,2
November 15.468,9 119.720,5 12,9
December 7.705,4 117.890,4 6,5
2013
January 10.022,8 114.853,6 8,7
February 9.312,0 102.037,3 9,1
March 4.366,1 92.422,1 4,7
Total 108.446,1 977.391,0 11,1

Evaluation of dehumidification system energy usage in ice rinks
Diogo Bermejo Pereira Rodrigues da Silva
44
During the period of May, June and July from 2012, there were no activities in Vikingahallen ice rink,
but it is verified that a great amount of energy is wasted by the dehumidifier system since its operation
is automatic and anyone had turned it off. Due to this fact, these months with extremely high
percentage values were not considered to the annual average energy associated with dehumidification.
Taking into account all these factors, the annual average of energy used by dehumidification is 11% of
the total electricity consumption by Vikingahallen ice rink.
Älta ice rink has a district heating system installed but it was possible to evaluate the data
corresponding to the energy offered by this system in the last season, to account to the total electricity
used by the ice rink provided by Climacheck and, finally, observe the total energy consumed by the
ice rink.
Table 6 – Fraction of total energy consumption related to dehumidification in Älta ice rink
Dehumidification
Energy(kWh) Total Electricity (kWh) Total District heating
(kWh) %
2011
August 25.919,7 166.776,0 178,0 15,5
September 24.567,4 129.157,6 6.230,0 18,1
October 20.384,8 87.535,1 12.818,0 20,3
November 20.114,5 84.071,4 20.650,0 19,2
December 17.325,0 77.744,3 27.415,0 16,5
2012
January 14.814,3 77.544,3 24.532,0 14,5
February 6.993,4 64.851,5 24.519,0 7,8
March 2001,0 64.699 19.960,0 2,4*
April 5.230 60.678 20.260,0 6,5
Total 135.349,1 748.358,2 136.602,0 15,3
In Älta ice rink the situation is not substantially different comparing to Vikingahallen but, since it was
possible to access the district heating energy data, for the months analysed, it is possible to confirm the
total monthly energy used by the ice rink and also the fraction of total energy used by the ice rink
related to dehumidification.
There are some months of the period that the dehumidification share is almost 20% of the total energy
consumption. In March of 2012, the dehumidifier was turned off for some reason during a great part of
the month. For the same reason as before, the value of March was excluded from the average.

Evaluation of dehumidification system energy usage in ice rinks
Diogo Bermejo Pereira Rodrigues da Silva
45
5. Dehumidifier types analysis
In this chapter, the dehumidification types are approached and an analysis of their actual consumption
in ice rinks is performed. Älta and Saltsjöbaden ice rinks work with absorption type dehumidifier
while Norrtälje ice rink has a refrigeration type dehumidifier connected to the brine from the
refrigeration system.
5.1 Dehumidifier performance in Älta and Saltsjöbaden – absorption type
In Älta ice rink, the absorption type dehumidifier used is DA 6000, manufactured by Fuktkontroll AB.
According to the technical parameters (see annexe B), the dehumidifier has 54,4kW of power capacity
and 18kg/h (4ºC/50% of relative humidity) of capacity of condensing water [23].
Fig. 45 – Profile of the dehumidifier in Alta (Fuktcontroll AB, 2012)
In Saltsjöbaden ice rink, the absorption type dehumidifier used is MCD40, manufactured by Munters.
According to the technical specifications (see annexe C), the dehumidifier has 46,8kW of power
capacity and 14kg/h (4ºC/60% of relative humidity) of capacity of condensing water [25].
Fig. 46 – Profile of the dehumidifier in Saltsjöbaden

Evaluation of dehumidification system energy usage in ice rinks
Diogo Bermejo Pereira Rodrigues da Silva
46
With Climacheck software sensors, it is possible to see the power and the energy consumption of both
dehumidifiers during a day period. The study was realized for the month of November 2011 in Älta
and November 2012 for Saltsjöbaden ice rinks. The values correspond to an average of each day of the
studied month.
Table 7 –Power and energy consumption average for the dehumidifier in Älta ice rink (November2011) and Saltsjöbaden (November 2012) ice rinks.
Ice rink
Power Average
(kW/day)
Monthly average
consumption (kWh/day)
Älta 15,148 348,735
Saltsjöbaden 18,742 406,376
Assuming that the dehumidifier works with constant capacity of removing water, it is possible to
calculate how much energy each dehumidifier consumes to remove a kilogram of water.
Table 8 – Mass of water removed by the dehumidifier and energy consumption per each kilogram of water.
Ice rink )/( hourkgm
)/( daykgm
Energy (kWh/kg water)
Älta 7,214 167,352 2,076
Saltsjöbaden 6,431 147,058 2,769
5.2 Dehumidifier performance in Norrtälje – refrigeration type
Dissimilar of Älta and Saltsjöbaden, Norrtälje ice rink uses the refrigeration type in its
dehumidification system. Since it is a different type of dehumidifier, there are no sensors available to
verify the energy consumption in the dehumidification system of this ice rink.
Norrtälje ice rink dehumidification system is refrigeration type, where the brine is connected to the
dehumidifier and its energy usage is part of the total refrigeration system of the ice rink. It is possible
to calculate its energy consumption knowing the mass flow, the type of brine used in the ice rink and
the temperatures in and out of the brine from the dehumidifier. To that end, sensors were installed in
particular locations and the results were analysed, including sensors to measure the quantity of water
condensed by the dehumidifier.
Fig.47 – Dehumidification refrigeration type in Norrtälje.
In order to calculate the cooling capacity:

Evaluation of dehumidification system energy usage in ice rinks
Diogo Bermejo Pereira Rodrigues da Silva
47
TsmQ erdehumidifi
(6)
Where,
erdehumidifiQ Cooling capacity (W)
m Brine mass flow (m³/s)
s = volumetric heat capacity
Km
J3
T = temperature difference measured between the incoming and out coming brine (K)
And,
pcs (7)
Where,
pc = specific heat capacity
Kkg
J
= density
3m
kg
The daily energy consumption is given by the following equation:
COP
hQE
erdehumidifi
erdehumidifi
24 (8)
The type of brine operating in Norrtälje is Calcium Chloride – 25% and the mass flow is constant and
about 6,3 m³/h [11]. The study was performed for the period of days between 15 and 21 of October
2012. In this period, the average COP of the refrigeration system value per day is 3,64.
Table 9 – Mass of water removed by the dehumidifier and energy consumption per each kilogram of water
Energy Consumption (kWh/day) )/( daykgm
Energy (kWh/kg water)
116,02 48,73 2,49
Comparing the obtained values of energy used to remove a kilogram of water from the moisture in the
air it is difficult to conclude about the type of dehumidifier used, since they all have a very similar
energy use. Nevertheless, these values can be used to compare with the energy used by the ice slab to
dehumidify the air, which will be analysed in the next section.

Evaluation of dehumidification system energy usage in ice rinks
Diogo Bermejo Pereira Rodrigues da Silva
48
5.3 Diffusion Load Calculation in ice rinks
Moisture condense on cold surfaces that have a lower temperature than the dew point of the air
temperature, leading to sweating, dripping and fogging and, in ice rinks, the moisture tend to deposit
in the ice slab and condense. The diffusion load required to remove the water from the moist air that
deposit on the ice slab is given by the equation [10]:
)/18)(/2852)(( molkgkgkJXXKAQ iadiffusion (9)
Where,
diffusionQ Diffusion load (W)
A Total area of the ice slab (2m )
K Mass heat transfer coefficient )/(23,0 2msg ,
aX Mole fraction of water vapour in air, (kg mol/kg mol) ,
iX Mole fraction of water in saturated ice, (kg mol/kg mol)
And,
ice
diffusion
L
Qm
(10)
Where,
m Total mass of water that deposits on the ice slab (kg)
diffusionQ Diffusion load (J)
iceL Latent heat of deposition of water into ice (J/g)
And,
gJTTTL iceiceiceice /)004,029,01,2834()(2
(11)

Evaluation of dehumidification system energy usage in ice rinks
Diogo Bermejo Pereira Rodrigues da Silva
49
Älta and Norrtälje ice rinks results for the month of November 2012 were studied. The results below
correspond to a monthly average.
Table 10 – Mass of water removed by the ice slab
Ice rink )/( daykgm
)/( hourkgm
))/(( 2mhourkgm
Älta 603,1 25,127 0,0146
Norrtälje 1.021,940 42,581 0,0247
The water content deposited in the ice slab could apparently be exceptionally high, but they
correspond only to a deposit of 15 grams per hour in a square meter, which seems reasonable.
To evaluate the energy required by the refrigeration system for each kilogram of water it was
necessary to use information from another Climacheck sensor: the COP information of the
refrigeration system.
COP
hQE
diffusion
diffusion
24 (12)
The COP of each ice rink was analysed and the average values for November 2012 are shown in the
Table 11.
Table 11 – Average of COP values for each ice rink in November 2012
Ice rink COP (November 2012)
Älta 2,41
Norrtälje 3,64
The values in Table 12 correspond to a monthly average for November 2012.
Table 12 – Energy to dehumidify the air with the ice slab
Ice rink Ediff (kWh/day) kWh/kg water
Älta 199,043 0,335
Norrtälje 221,103 0,216
The values of energy used by the refrigeration system of the ice rinks to dehumidify the air are very
low, when compared with the values of energy used to remove a kilogram of water of the
dehumidifier.
Nevertheless, the action of dehumidify the air with the ice slab requires more ice resurfacings and,
consequently, more energy used by the refrigeration system to freeze the hot water discharged in the
slab. In terms of the analysis accomplished in this chapter, the most important factor is the COP of the
refrigeration system of the ice rink: the higher the values of COP, the lower the energy used to remove
a kilogram of water.

Evaluation of dehumidification system energy usage in ice rinks
Diogo Bermejo Pereira Rodrigues da Silva
50
6. Radiation Model analysis
A specific task of this project was the measurement and evaluation of the radiation heat load, in order
to verify the model proposed in a previous work, Evaluation of Energy Saving Measures in Ice Rinks
by Zhang Z., master thesis at KTH School of Industrial Engineering and Management of Stockholm,
in 2010 [11], specifically what concerns the performance of the low emissivity ceiling installed in Älta
ice rink.
In the calculation model already developed aiming at calculating the radiation load of the low
emissivity ceiling, the assumption that the temperature of the ice rinks walls takes the measured value
by the Climacheck sensors installed indoor. Therefore, this assumption should be checked and, to that
purpose, two sensors HOBO data logger were installed in Älta ice rink in two different walls, with a
height of approximately three meters of distance from the floor, in order to collect data from the
surface temperature.
Fig. 48 –Sensors installed in Älta ice rink, nominated north wall and west wall, respectively.

Evaluation of dehumidification system energy usage in ice rinks
Diogo Bermejo Pereira Rodrigues da Silva
51
The sensors collected data from four consecutive days during February 2013 and, later, the sensors
were logged through the HOBO software to get access to the stored information and compare with the
indoor temperature using the Climacheck software, for a synchronized period of time.
Fig. 49 – Comparison between indoor temperature and walls temperature
Figure 49 shows that the assumption made in the previous work is overestimating the wall
temperature, since it is possible to observe a clear deviation between the temperature values. The
temperature inside the building is always higher than the walls temperature, due to the outside climate
influence. The difference between the indoor temperature and surface temperature is approximately
1,5ºC.
Fig. 50 – Temperature measured in the wall values compared with indoor temperature measured for the same time
Indoor Temperature and Wall Temperature
0
1
2
3
4
5
6
7
8
02
-11
-13
02
-11
-13
02
-11
-13
02
-12
-13
02
-12
-13
02
-12
-13
02
-12
-13
02
-12
-13
02
-12
-13
02
-12
-13
02
/13
/13
02
/13
/13
02
/13
/13
02
/13
/13
02
/13
/13
02
/13
/13
02
/14
/13
02
/14
/13
02
/14
/13
02
/14
/13
02
/14
/13
time (days)
Tem
per
atu
re (
ºC)
Indoor Temperature North Wall West Wall
Indoor temperature Vs. Wall Temperature
3
3,5
4
4,5
5
5,5
3 3,5 4 4,5 5 5,5 6 6,5 7 7,5
Indoor Temperature (ºC)
No
rth
wal
l tem
per
atu
re (
ºC)
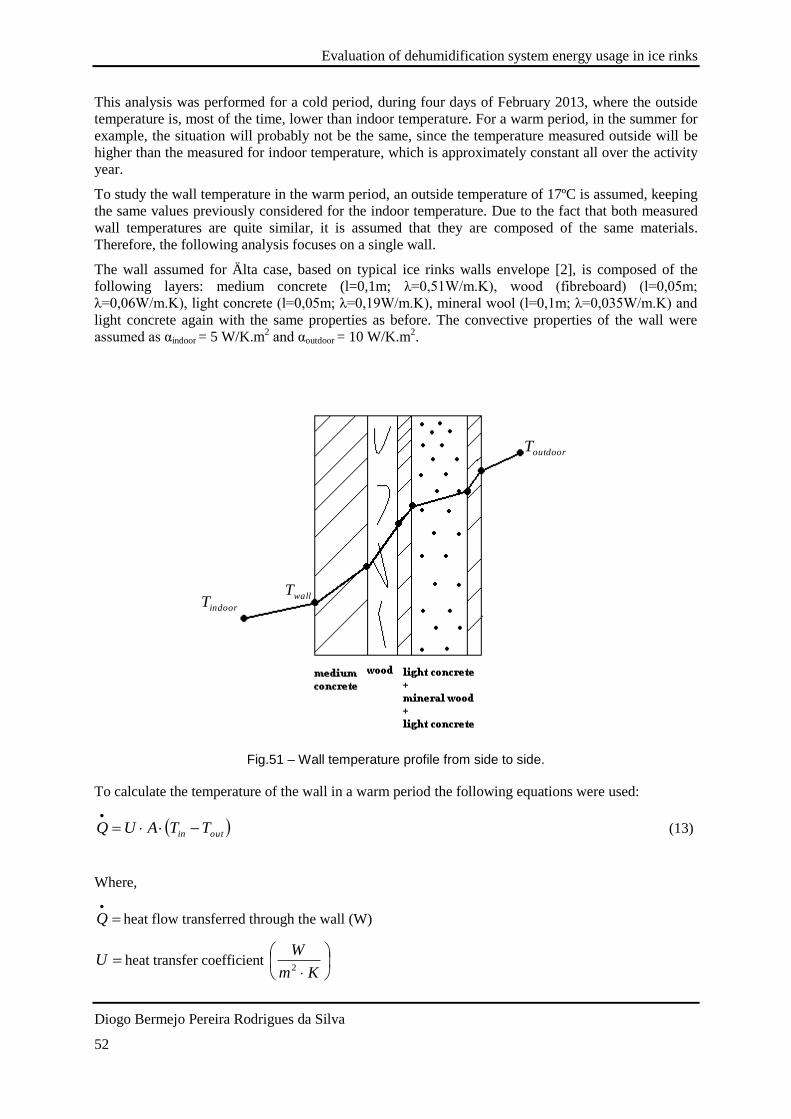
Evaluation of dehumidification system energy usage in ice rinks
Diogo Bermejo Pereira Rodrigues da Silva
52
This analysis was performed for a cold period, during four days of February 2013, where the outside
temperature is, most of the time, lower than indoor temperature. For a warm period, in the summer for
example, the situation will probably not be the same, since the temperature measured outside will be
higher than the measured for indoor temperature, which is approximately constant all over the activity
year.
To study the wall temperature in the warm period, an outside temperature of 17ºC is assumed, keeping
the same values previously considered for the indoor temperature. Due to the fact that both measured
wall temperatures are quite similar, it is assumed that they are composed of the same materials.
Therefore, the following analysis focuses on a single wall.
The wall assumed for Älta case, based on typical ice rinks walls envelope [2], is composed of the
following layers: medium concrete (l=0,1m; λ=0,51W/m.K), wood (fibreboard) (l=0,05m;
λ=0,06W/m.K), light concrete (l=0,05m; λ=0,19W/m.K), mineral wool (l=0,1m; λ=0,035W/m.K) and
light concrete again with the same properties as before. The convective properties of the wall were
assumed as αindoor = 5 W/K.m2 and αoutdoor = 10 W/K.m
2.
Fig.51 – Wall temperature profile from side to side.
To calculate the temperature of the wall in a warm period the following equations were used:
outin TTAUQ
(13)
Where,
Q heat flow transferred through the wall (W)
U heat transfer coefficient
Km
W2
indoorT wallT
outdoorT
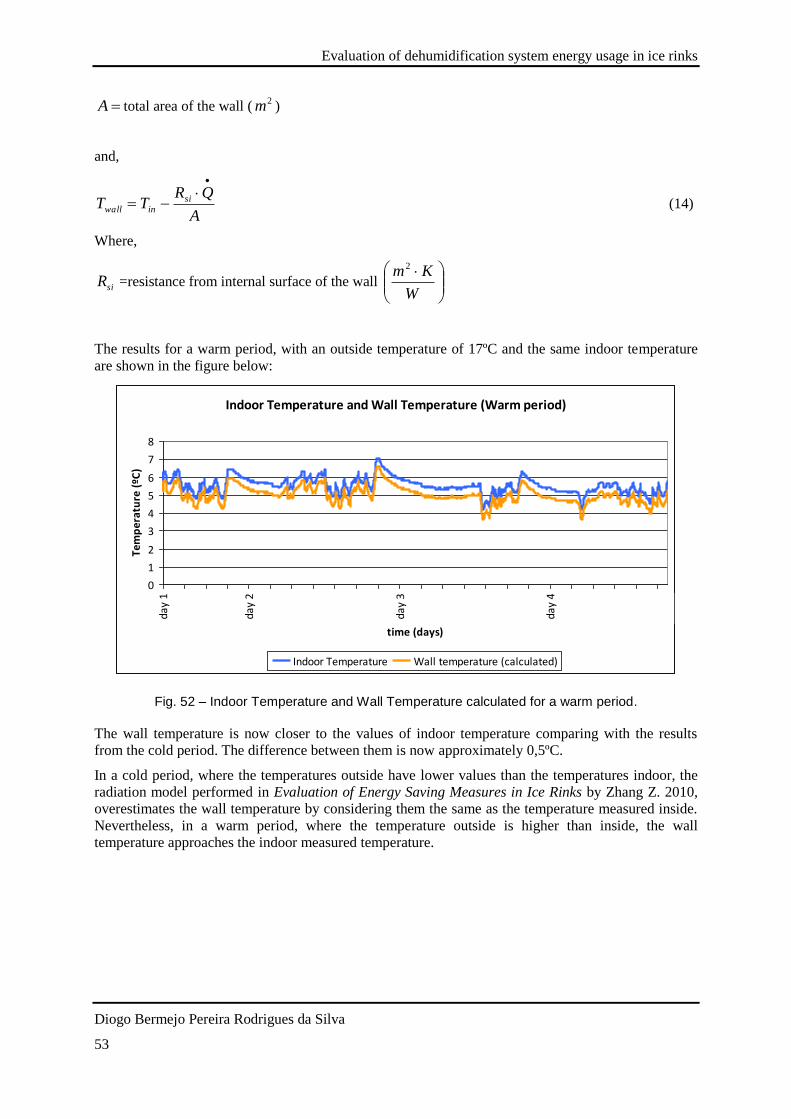
Evaluation of dehumidification system energy usage in ice rinks
Diogo Bermejo Pereira Rodrigues da Silva
53
A total area of the wall (2m )
and,
A
QRTT si
inwall
(14)
Where,
siR =resistance from internal surface of the wall
W
Km2
The results for a warm period, with an outside temperature of 17ºC and the same indoor temperature
are shown in the figure below:
Fig. 52 – Indoor Temperature and Wall Temperature calculated for a warm period.
The wall temperature is now closer to the values of indoor temperature comparing with the results
from the cold period. The difference between them is now approximately 0,5ºC.
In a cold period, where the temperatures outside have lower values than the temperatures indoor, the
radiation model performed in Evaluation of Energy Saving Measures in Ice Rinks by Zhang Z. 2010,
overestimates the wall temperature by considering them the same as the temperature measured inside.
Nevertheless, in a warm period, where the temperature outside is higher than inside, the wall
temperature approaches the indoor measured temperature.
Indoor Temperature and Wall Temperature (Warm period)
0
1
2
3
4
5
6
7
8
day
1
day
1
day
1
day
1
day
2
day
2
day
2
day
2
day
2
day
2
day
2
day
3
day
3
day
3
day
3
day
3
day
3
day
3
day
4
day
4
day
4
day
4
day
4
day
4
time (days)
Tem
per
atu
re (
ºC)
Indoor Temperature Wall temperature (calculated)
Evaluation of dehumidification system energy usage in ice rinks
Diogo Bermejo Pereira Rodrigues da Silva
54
7. Conclusion
Ice rinks are very complex buildings, with specific requirements, where there is a wide range of
energy demands to assure the permanent need for cooling and heating. They provide very low
temperatures in the ice slab, comfortable level in the spectator’s area and higher temperatures for
domestic and resurfacing hot water. The dehumidification systems necessary for an adequate level of
air moisture in these different environments are very complex and energy consuming.
This project focused in dehumidification systems, specifically regarding their potential for energy
saving. The analysis is based on measurements and the studies performed on seven ice rinks near the
city of Stockholm. For Älta, Norrtälje, Saltsjöbaden and Nacka ice rinks a depth analysis was
performed. Each ice rink needs to be particularly analysed in order to find the best solution in terms of
energy saving, therefore each ice rink is considered as a unique case and a solution applied to one ice
rink, may be not suitable to another.
The ice rinks mentioned in this study are equipped with several sensors (Climacheck sensors) with the
purpose of monitoring the performance of their refrigeration system. The data collected from the
temperature and humidity sensors, as well as the power and energy consumed by the dehumidifier
systems were analysed and used to perform different calculations.
To evaluate the performance of the Climacheck sensors that are measuring relative humidity and
temperature of the air in the different studied ice rinks studied, the correlation between the information
of every sensor with real values was verified. It was detected that Älta and Norrtälje ice rinks have a
sensor that was not working with the same accuracy as the others. In Älta rink this evaluation was
made by analysing the data measured by a third sensor located in the ceiling of the ice rink.
Afterwards, the malfunction sensor was replaced and it is currently working with the same accuracy as
the other sensors.
The ice rinks referred in the study may look very similar in terms of indoor climate requirements,
since they have comparable dimensions and they are located in the same geographic area, near
Stockholm. However, the analysis performed during November 2012 shown the temperature and
relative humidity and, consequently, the water content of indoor air differ for each ice rink. High
values of indoor water content were detected in Norrtälje and Vikingahallen ice rinks: these ice rinks
use the ice slab with more intensity to dehumidify the air than others. The ice slab could be a solution
to dehumidify the air, but it causes damage in the quality of the ice, so it demands more ice
resurfacings, more hot water dropping on the slab and, consequently, more energy used by the
refrigeration system to freeze the water.
It was conclude that the indoor climate of an ice rink can be influenced by the ice temperature of the
slab. During a game, with duration of three hours, the temperature measured twenty centimetres above
the slab can raise 1ºC due to the ice resurfacing and the activity of ice hockey players. In the
atmosphere of the remainder structure, the relative humidity may raise between 2 to 4% due the
activity, ice resurfacing and the presence of people in the stands. Indoor temperature can increase
0,9ºC in the building only due to an ice resurfacing of the slab.
The air moisture comes from external sources, due to the infiltration of outdoor air in the ice rink, and
internal sources, due to the activities, audience in the stands and resurfacing water. The moisture
deposits on the ice slab in form of water drops or is removed by the dehumidifier. Internal source of
moisture can be simplified as a constant because its daily range of values are very similar, so the load
used by dehumidifiers in ice rinks changes with the outdoor condition of water content in the air.
An hourly energy analysis of the dehumidifier and the corresponding water content in the outdoor air
make possible to evaluate the thermal insulation of an ice rink building and the amount of energy
caused by outdoor air leakage, which requires the knowledge of the dehumidifier type and
performance.

Evaluation of dehumidification system energy usage in ice rinks
Diogo Bermejo Pereira Rodrigues da Silva
55
Nacka ice rink is spending much more energy due to dehumidification comparing with others ice
rinks. This fact is not caused by its bigger structure, but by the fact that it does not have a separate
garage to wash the ice resurfacing mobile machine, which happens in the other ice rinks, forcing the
dehumidifier to work more time than it should and spend more energy than it needs to.
Since the beginning of summer 2012, Älta ice rink has a district heating installation connected to its
dehumidification system. Comparing data after this installation with those from the year before, it was
verified that the indoor water content is very similar and the district heating is able to save nearly 50%
of the total electricity consumption.
The collected data by two sensors measuring the water temperature in the ingoing and outgoing pipes
of the dehumidifier in Nacka ice rink show that the dehumidifier only uses recovered heat from the
refrigeration system, so it is not able to take so much energy from the heat of the water, dissimilar
what happens in Älta district heating system.
The obtained values for the energy used to remove one kilogram of water from the humid air by an
absorption type dehumidification system are 2,1kWh for Älta ice rink and 2,8kWh for Saltsjöbaden ice
rink. On the other hand, dehumidification refrigeration type uses 2,5kWh (Norrtälje ice rink) to
dehumidify the air. It is difficult to conclude which type of dehumidification system is the most
efficient, because the energy is for all systems of the same order of magnitude. Nevertheless, it is
possible to conclude that both types of dehumidifiers have very similar values of energy consumption.
It is possible to determine the energy used by the refrigeration system to remove a kilogram of water
on the ice slab and compare those values with the energy use for the same purpose by the
dehumidifier. In fact, dehumidifying the air with the ice slab use significantly less energy than a
dehumidifier does, but the act of dehumidifying the air with the slab damage and indirectly uses more
energy for the hot water to resurface the ice and the refrigeration system to freeze the hot water. The
main factors related to the quantification of water placed on the ice slab are: i) the higher presence of
water content in the air indoor and ii) the efficiency of removing that water from the slab, which is
determined by the coefficient of performance of the refrigeration system of the ice rink.
Saltsjöbaden ice rink was closed for activities for one month, but its refrigeration system was still
working during that period. Thereby, it was possible to analyse its dehumidifier performance for a
month and compare it with a regular month of activity, with similar climate conditions, and conclude
that the dehumidifier consumes approximately 11kWh/h related to activity inside the ice rink.
Since there were no activities in the ice rink during that month, the dehumidifier only worked and used
energy to remove moisture of the indoor air, which was not subject to evaporated water from activities
or ice resurfacings but only from other internal sources and infiltrations of outside air inside the
structure.
The current “state of art” about energy consumption in ice rinks indicates a share of 4 to 6% as regards
to dehumidification: in this project it is possible to conclude that this percentage is underestimated and
the value also depends on the season of the year, being outdoor climate the most influencing factor.
Knowing that Vikingahallen ice rink does not have any district heating connection and quantifying the
total electricity consumption and the consumption related to the dehumidification system, an yearly
average of 11% is obtained.
On the other hand, Älta ice rink has a district heating installation but it was possible to observe data
related to its energy provided in the year of 2011. Quantifying electricity use provided by Climacheck
sensors, the percentage value of 15% related to dehumidification system consumption was obtained.
Regarding the radiation model proposed in the previous work Evaluation of Energy Saving Measures
in Ice Rinks by Zhang Z., master thesis at KTH School of Industrial Engineering and Management of
Stockholm, in 2010 [11], which studies the performance of the low emissivity ceiling installed in Älta
ice rink with the assumption for the walls temperature of the ice rink as the temperature measured by
the Climacheck sensors installed indoor, it was verified that the radiation model is overestimating the
walls temperature. This occurs for a cold period, where the outside temperatures are lower than inside.

Evaluation of dehumidification system energy usage in ice rinks
Diogo Bermejo Pereira Rodrigues da Silva
56
Nevertheless, in a warm period, where the temperature outside are higher than inside, the walls
temperature are similar to indoor temperature.
Suggestions for future work
Complementary to this conclusion, I suggest some possible future work:
Considering the results of this study, where it is shown that dehumidification system has more
impact than what it was expected in the percentage of the total energy consumption in ice
rinks, it is important to improve the studies concerning energy efficiency of dehumidification
systems of ice rinks. For example, studies focusing on the performance of dehumidifiers, the
contribution of district heating for the dehumidification system and other solutions for the
improvement of the performance of dehumidification system process.
Detailed analysis of the impact of the spectators in the stands of the ice rink: Compare
temperature and relative humidity in similar game days, choosing a day with a lot of audience
and a day without spectators, with the aim of studying the impact of people presence in the
stands to the dehumidification system;
Calculate the amount of energy required by the refrigeration system in every ice resurfacing
and analyse the total energy used to dehumidify the air with the ice slab;
Suggestions of alternative places to wash the ice resurfacing machine in Nacka ice rink in
order to save energy from its dehumidifier.

Evaluation of dehumidification system energy usage in ice rinks
Diogo Bermejo Pereira Rodrigues da Silva
57
8. References
[1] IIHF, 2010. Technical Guidelines of an Ice Rink, international ice hockey federation guide book
[2] Rogstam, Jörgen. 2010, Energihandledning ishallar. En guide till effektivare energianvändning i svenska
ishallar. Sveriges Energi & Kylcentrum. Katrineholm
[3] Karampour M. 2011, Measurement and Modelling of Ice Rinks Heat Loads, Master Thesis, KTH School of
Industrial Engineering and Management , Stockholm
[4] Rogstam, Jörgen. 2012, Ice rink Information.
[5] ASHRAE 2002. Refrigeration handbook. Chapter 35: Ice rinks.
[6] Desert Aire, Application Note 13, Indoor Ice Rink Dehumidification
[7] Everything Ice 2000, Recreation Facilities Design Manual, publish authorized by “Manitoba Hydro”,
Canada
[8] Nguyen T. 2012, Carbon Dioxide in Ice Rink Refrigeration, Master Thesis, KTH School of Industrial
Engineering and Management, Stockholm
[9] Makhnatch P. 2010, Technology and Energy Inventory of Ice Rinks, Master thesis, KTH School of Industrial
Engineering and Management, Stockholm
[10] ASHRAE. 2010, ASHRAE Refrigeration Handbook, chapter 44: ice rinks, ANSI/ASHRAE standard
[11] Zhang Z. 2010, Evaluation of Energy Saving Measures in Ice Rinks, Master Thesis, KTH School of
Industrial Engineering and Management, Stockholm
[12] Natural Resources Canada 2003, Technical Fact Sheets on the Impacts of New Energy Efficiency
Technologies
[13] McBride R. 2005, Low-E Ceilings: Benefits, Costs and Tips
[14] Shahzad K. 2006, an ice rink refrigeration system based on CO2 as secondary fluid in copper tubes, Master
Thesis, IUC/ KTH School of Industrial Engineering and Management, Stockholm
[15] Manitoba Hydro 1991. Energy Efficiency Guide for Ice Arenas and Curling Rinks.
[16] Carrilho, Guilherme, 2010. Psicrometria Ar Atmosférico, Sistemas Energéticos em Edifícios – Aula A,
Faculdade de Ciências da Universidade de Lisboa
[17] Canadian Gas Research Institute 1999, Development and Dissemination of Information on the Operator
Benefits of Desiccant Dehumidification in arenas
[18] Talby M. 2008, Reducing energy consumption in ice rinks, efficient dehumidification with liquid desiccant
technology
[19] Adsorption type dehumidification
http://www.cotes.com/adsorption-dehumidification.html.
[Online: Last access at 29th April 2013]
[20] Hire All Seasons, 2006. How Does A Dehumidifier Work?
http://www.allseasonshire.eu/dryers/principle-of-operation.php
[Online: Last access at 29th April 2013]
Evaluation of dehumidification system energy usage in ice rinks
Diogo Bermejo Pereira Rodrigues da Silva
58
[21] Humidity Control Systems : Dehumidification theory: refrigerant dehumidifier and desiccant dehumidifier
http://www.humiditycontrol.co.uk/dehumidification-theory.htm
[Online: Last access at 29th April 2013]
[22] Climacheck Homepage
www.climacheck.se
[Last access at 29th April 2013]
[23] Fuktkontroll AB, 2011.
http://www.fuktkontroll.com/sorption/sorption.htm
[Last access at 29th April 2013]
[24] Onset HOBBO data loggers:
http://www.onsetcomp.com/
[Last access at 29th April 2013]
[25] Munters MCD40, 2012.
http://www.munters.com/upload/2-MCD40_GB.pdf
[Last access at 29th April 2013]
Evaluation of dehumidification system energy usage in ice rinks
Diogo Bermejo Pereira Rodrigues da Silva
59
9. Annexes
Annexe A - Constants used regarding water vapour saturation pressure
calculation
The water vapour saturation pressure, wsp , is calculated by the two equations below:
TCTCTCTCTCCT
Cpws lnln 7
4
6
3
5
2
4321 (4)
and,
TCTCTCTCCT
Cpws lnln 13
3
12
2
11109
8 (5)
Equation 4 is used when the temperature of the moist air is between -100ºC and 0ºC and Equation 5
applies for the temperature range between 0ºC and 200ºC. The values from the range of 1C to 13C are
tabled constants where:
C1 = −5.674 535 9 E+03
C2 = 6.392 524 7 E+00
C3 = −9.677 843 0 E–03
C4 = 6.221 570 1 E−07
C5 = 2.074 782 5 E−09
C6 = −9.484 024 0 E−13
C7 = 4.163 501 9 E+00
C8 = −5.800 220 6 E+03
C9 = 1.391 499 3 E+00
C10 = −4.864 023 9 E−02
C11 = 4.176 476 8 E−05
C12 = −1.445 209 3 E−08
C13 = 6.545 967 3 E+00
Evaluation of dehumidification system energy usage in ice rinks
Diogo Bermejo Pereira Rodrigues da Silva
60
Annexe B - Dehumidifier Fuktkontroll AB – DA 6000 information

Evaluation of dehumidification system energy usage in ice rinks
Diogo Bermejo Pereira Rodrigues da Silva
61
Annexe C - Dehumidifier Munters – MCD40 information

Evaluation of dehumidification system energy usage in ice rinks
Diogo Bermejo Pereira Rodrigues da Silva
62

Evaluation of dehumidification system energy usage in ice rinks
Diogo Bermejo Pereira Rodrigues da Silva
63
Annexe D - Electricity consumption analysis in Nacka, Saltsjöbaden and
Vikingahallen ice rinks
Total electricity consumption and electricity use regarding to the dehumidification system of Nacka,
Saltsjöbaden and Vikingahallen ice rink. There was not possible to access the district heating data to
observe the amount of energy provided by this system in each ice rink.
Nacka Ice Rink
Dehumidification (kWh)
Total (kWh) %
2012
October 16.974 65.774 26
November 16.553 47.366 35
December 11.273 30.341 37
2013
January 11.351 32.000 35
February 10.423 32.654 32
Total 66.574 208.135 32
Saltsjöbaden Ice Rink
Dehumidification (kWh)
Total (kWh) %
2012
May 6.339 13.052 49
June 5.448 11.778 46
July 4.712 12.432 38
August 23.817 96.336 25
September 15.776 83.190 19
October 12.917 71.600 18
November 12.419 65.464 19
December 8.307 59.703 14
Total 89.735 413.555 22

Evaluation of dehumidification system energy usage in ice rinks
Diogo Bermejo Pereira Rodrigues da Silva
64
Vikingahallen Ice Rink
Dehumidification (kWh)
Total (kWh) %
2012
April 8.850 75.813 12
May 14.668 28.498 51
June 19.150 29.542 65
July 20.181 59.605 34
August 20.230 118.685 17
September 17.799 115.786 15
October 14.692 120.184 12
November 15.469 119.721 13
December 7.705 117.890 7
2013 January 10.023 114.854 9
February 9.312 102.037 9
Total 158.079 1.002.614 16


